Wood, Pulp & Paper Polygrafi a Academica 2014 Pulp and Paper 2014 ... Conductive Structures ........
192
12. a 13. marca 2014 hotel Tatra, Bratislava, Slovensko http://wpppa2014.e-wpp.com 2014 WPP PA Wood, Pulp & Paper Polygrafia Academica Zbornik1_PA2014_10.indd 1 Zbornik1_PA2014_10.indd 1 25. 2. 2014 12:11:05 25. 2. 2014 12:11:05
-
Upload
duonghuong -
Category
Documents
-
view
250 -
download
1
Transcript of Wood, Pulp & Paper Polygrafi a Academica 2014 Pulp and Paper 2014 ... Conductive Structures ........

12. a 13. marca 2014hotel Tatra, Bratislava, Slovensko
http://wpppa2014.e-wpp.com
2014
WPP PAWood, Pulp & Paper
Polygrafi a Academica
Zbornik1_PA2014_10.indd 1Zbornik1_PA2014_10.indd 1 25. 2. 2014 12:11:0525. 2. 2014 12:11:05
WOOD, PULP AND PAPER 2014 POLYGRAFIA ACADEMICA 201412. a 13. marca 2014
Zborník vedeckých konferencií/Proceedings of joint conferencesUzávierka všetkých príspevkov v zborníku: 17. februára 2014
Organizátori konferencie/Conference Organizers
Konferencia sa poriada pod záštitou dekana Fakulty chemickej a potravinár-skej technológie prof. Ing. Jána Šajbidora, DrSc., Slovenská technická univerzita v Bratislave.Na organizácii konferencie sa podieľajú: Ústav prírodných a syntetických polymé-rov, Fakulta chemickej a potravinárskej technológie, Slovenská technická univerzita v Bratislave, Zväz polygrafi e na Slovensku, Výskumný ústav papiera a celulózy, Zväz celulózo-papierenského priemyslu SR, Slovenská spoločnosť priemyselnej chémie
Vedecký a programový výbor konferencie/Scientifi c and Program Commitee
Michal Čeppan (FCHPT STU), Katarína Vizárová (FCHPT STU), Ivan Hudec (FCHPT STU), Svetozár Katuščák (FCHPT STU), Miroslav Milichovský (Fakulta chemicko-technologická, Univerzita Pardubice), Michal Veselý (Fakulta chemická, Vysoké učení technické v Brně), Ján Panák (FCHPT STU), Milan Mikula (FCHPT STU), Štefan Šutý (FCHPT STU), Milan Vrška (FCHPT STU), Ľudovít Jelemenský (FCHPT STU), Jozef Hanus (FCHPT STU), Štefan Boháček (Výskumný ústav papiera a celulózy), Peter Blubla (Zväz polygrafi e na Slovensku), Igor Patráš (Zväz spracovateľov dreva SR), Konrad Olejnik (Institute of Papermaking and Printing, TU Lodz)
Organizačný výbor konferencie/Organizing Commitee
Vladimír Dvonka, Radovan Tiňo, Milena Reháková, Viera Jančovičová, Lukáš Gál, Igor Šurina, Michal Jablonský, Soňa Kirschnerová
Recenzenti/Reviewers
Michal Čeppan, Ján Panák, Milan Mikula,Milena Reháková, Viera Jančovičová,Katarína Vizárová, Štefan Šutý, Milan Vrška
Grafi cké spracovanie zborníka: Vladimír Dvonka, Lukáš GálTlač zborníka: Slovenská Grafi a, a. s.Papier na zborník: Europapier Slovensko, s. r. o.Vydala Slovenská chemická knižnica FCHPT STU v Bratislave, 2014. Náklad 250 ks.ISBN 978-80-89597-16-1
Zbornik1_PA2014_10.indd 2Zbornik1_PA2014_10.indd 2 25. 2. 2014 12:11:1025. 2. 2014 12:11:10

Obsah/Content
Plenárne prednášky/Plenary lectures
Wood, Pulp and Paper 2014, Polygrafi a Academica 2014
Annamarie VeličMinimizing Eff ects of Particle Board Production on the Environment.Can particle board manufacturing be done in a sustainable way? .............................10
Diana Gregor Svetec, Janja Zule, Graziano ElegirRecyclability of graphic products and paper based packaging ...................................14
Stefan Jakucewicz, Ján PanákTrendy rozvoja tlačových technológiíTrends in Developments of Printing Technologies ...........................................................20
Miroslav Vajs, Štefan Boháček, Juraj DlhopolčekKonkurencieschopnosť a trendy rozvoja celulózo-papierenského priemyslu SRCompetitivnes and Trends of Pulp and Paper Industry Developmentin Slovak Republic .........................................................................................................................27
Polygrafi a Academica 2014
Veronika LovellColor Science Behind Inks in CMYK vs. Extended Color Gamutvs. Spot/Pantone Ink Sets ...........................................................................................................34
Peter MračnaNové technológie vyvracajú mýty o inkjetovej tlačiNew technologies dispel myths of inkjet printing ............................................................40
Michal Veselý, Petr DzikMateriálový tisk nebo 3D tisk?/Material printing or 3D print? ......................................46
Markéta Držková, Nikola Peřinka, Patrycja Bober, Milena Hajná,Tomáš Syrový, Jaroslav Stejskal, Yvan BonnassieuxInkjet printability of poly(N-vinylpyrrolidone)-stabilizedpolyaniline dispersions ...............................................................................................................51
Oldřich Zmeškal, Veronika Schmiedová, Jan Pospíšil, Jiří ČernýStudium optických vlastností tenkých vrstev připravených materiálovým tiskemStudy of optical properties of thin fi lms prepared by material printing ...................57
Silvia Káčerová, Marta Klanjšek Gunde, Michal VeselýSpectroscopic study of inkjet inks ...........................................................................................64
Petr Dzik, Michal Veselý, Petr Klusoň,Magdalena Morozová, Urška Lavrenčič ŠtangarInkjet Printed Oxide Semiconductor Layers – Limits and Benefi ts ..............................71
Milan Mikula, Pavol Gemeiner, Vladimír Dvonka, Zuzana BekováTlačené farbivom scitlivené solárne články/Printed Dye Sensitized Solar Cells .........78
3
Zbornik1_PA2014_10.indd 3Zbornik1_PA2014_10.indd 3 25. 2. 2014 12:11:1025. 2. 2014 12:11:10

Vesna Džimbeg Malčić, Irena Bates, Željka Barbarić-MikočevićAnalysis of methods appropriate for polymer substrate ink trapping .................... 84
Veronika Tkáčová, Jiří HejdukChování potištěných biodegradabilních materiálů při kompostováníBehaviour of printed biodegradable materials made into compost ........................ 90
Daniel JavorskýNew trends in fl exographic printing forms production ................................................ 96
Sandra Dedijer, Magdolna Pal, Živko Pavlović, Dragoljub NovakovićSurface roughness analysis of conventional fl exo printing platein dependence of developing and light fi nishing phase ............................................. 101
Jan Vališ, Bohumil Jašúrek, Tomáš SyrovýMethodology of evaluation of print abrasion resistance ............................................ 107
Kristián Petruf, Ondřej Mikala, Tomáš Syrový, Petr NěmecInfl uence of Bending on Resistance of Screen PrintedConductive Structures .............................................................................................................. 111
Viera Jančovičová, Zuzana Machatová, Zuzana ŠtromajerSvetelná a tepelná stabilita čiernobielej fotografi eLight and thermal stability of black and white photography .................................... 117
Pavol Gemeiner, Milan MikulaVplyv reologického činidla na sieťotlačové TiO2 pastypre fotoanódu farbivom senzibilizovaných solárnych článkovThe eff ect of rheological agent on TiO2 pastes propertiesfor photoanodes of dye sensitized solar cells .................................................................. 123
Zuzana Machatová, Viera Jančovičová, Ľubica KrovinováIdentifi kácia historických fotografi ckých techníknedeštruktívnymi metódamiIdentifi cation of some historic photographic processesusing nondestructive methods ............................................................................................. 129
Bohumil Jašúrek, Helena Odstrčilová, Jan Vališ, Tomáš SyrovýStudy of rheological properties of UV and Hybrid off set inks .................................... 135
Ana Slugic, Mateja Puhalo, Igor Majnaric,Ivana Bolanca Mirkovic, Milena RehákováThe infl uence of NOx on the stability white colored Inkjet prints ............................. 140
Adriana Jabconová, Alena Uváčková, Marek Rychnavský,Michal Roščák, Bohumil BohunickýInvestigation of writing-printing sequenceusing scanning electron microscope .................................................................................. 146
Adriana Jabconová, Elena Blahová,Tatiana Dugovičová, Juraj MatějkaForensic experts’ view on counterfeits ............................................................................... 150
4
Zbornik1_PA2014_10.indd 4Zbornik1_PA2014_10.indd 4 25. 2. 2014 12:11:1025. 2. 2014 12:11:10

Milena Reháková, Michal Čeppan, Michaela Belovičová, Pavol GemeinerŠtúdium štruktúry a identifi kácia materiálov plastových karietpre potreby kriminalisticko-technických analýzStudy of Structure and Identifi cation of Materials in Plastic Cardsfor the Purpose of Forensic Analysis .................................................................................... 157
Eva Belányiová, Milena Reháková, Michal Čeppan,Magdaléna Kadlečíková, Ľubomír VančoMetódy skúmania moderných písacích prostriedkov vo forenznej vedeMethods of Modern Writing Means Research in Forensic Science .......................... 163
Ivan Pinćjer, Dragoljub Novaković, Uroš Nedeljković, Irma PuškarevićInformation design for the graphic engineering e-learning application .............. 170
Lukáš Gál, Michal Oravec, Pavol Gemeiner, Michal ČeppanPrincipal Component Analysis of Vis-NIR Refl ectance Spectraof Inkjet Inks for Forensic Analysis ....................................................................................... 176
Pavol Gemeiner, Milan Mikula, Zuzana Beková, Ľubomír Švorc, Mária OmastováFarbivom senzibilizované solárne články s kompozitnými elektródamina báze PPy/Ag/f-MWCNTDye sensitized solar cells based on polypyrrole/silver/f-MWCNTcomposite counter electrodes................................................................................................ 183
Vladimír Dvonka, Pavol Gemeiner, Milena RehákováForensic image analysis of writting pen inks..................................................................... 189
Wood, Pulp and Paper 2014
Katarína Vizárová, Štefan Šutý, Milan Vrška, Igor Šurina, Radovan Tiňo,Michal Jablonský, Soňa Kirschnerová, Svetozár KatuščákBio-based renewable resources and Materials, Research and education .............. 194
Janka Kubačková, Ivan Hudec, Jozef Feranc, Jozef Preťo, Štefan ŠutýPossibilities for lignin and cellulose as a fi ller in rubber compositesMožnosti využitia lignínu a celulózy ako zložky gumárskych zmesí ....................... 200
Michal Jablonský, Jakub Kočiš, Štefan Šutý, Aleš Ház, Igor Šurina,Milan Vrška, Radovan TiňoFractionation and characterization of lignins as and effi cient toolsfor their better valorization ..................................................................................................... 206
Dušan BakošBiomass – Sustainable Raw Material for Energy and Chemistry ............................... 212
Michal Letko, Juraj Gigac, Mária Fišerová,Štefan Boháček, Andrej Pažitný, Albert RussPredspracovanie lignocelulózových materiálov – kľúčový procespri výrobe bioetanolu druhej generáciePretreatment of LC materials the key process for it utilisationfor bioethanol (biofuel) of second generartion .............................................................. 218
5
Zbornik1_PA2014_10.indd 5Zbornik1_PA2014_10.indd 5 25. 2. 2014 12:11:1025. 2. 2014 12:11:10

Miloslav Milichovský, Michaela Filipi, Jan Gojný, Břetislav ČešekHypermolecular structure of lignocellulosic materialsand their properties .................................................................................................................. 224
Konrad OlejnikModelling the water-mass equilibrium in the paper machine ................................... 232
Anton Geff ert, Jarmila Geff ertováZmeny vybraných fyzikálnych a mechanických vlastnostísulfátovej buničiny v podmienkach modelovanej recyklácieChanges of the selected physical and mechanical characteristicsof sulphate pulp in conditions of simulated recycling ................................................. 239
František Janíček, Anton Cerman, Juraj KubicaVybrané aspekty záverov 22. Svetového energetického kongresu v DaeguCoclusions of 22. World Energetic Congress in Daeg – South Corea ....................... 245
Tiňo Radovan, Repáňová ZuzanaBiological inactivation of lignocellulosic surfaces with atmosphericlow temperature plasma .......................................................................................................... 250
Jozef Hanus, Katarína Vizárová, Michal JablonskýDegradácia a ochrana objektov kultúrneho dedičstva na bázelignocelulózových materiálov z hľadiska mikrobiálnej kontaminácieDegradation and protection of cultural herritage based onLC materials in front of view the microbial contamination ......................................... 259
Iveta Čabalová, František Kačík, Tereza Tribulová, Jan GojnýVybrané vlastnosti historických papierových dokumentovSelected properties of historical paper documents ...................................................... 265
Jan Gojný, Bretislav Češek, Ondřej Mikala, Miloslav Milichovský,Iveta Čabalová, Kamil KřumalVliv atmosféry tvořené zředěnými parami esenciálních olejůna pórovité materiály na celulózové a lignocelulózové báziThe mechanical and optical properties changesof lignocellulosics materials via esential oils vapours treatment .............................. 271
Irena Bates, Ivana Plazonic, Tajana KorenThe reproduction quality of the lineson paper substrates with straw fi bers ................................................................................. 276
Tereza Tribulová, František Kačík, Iveta ČabalováFyzikálně-mechanické vlastnosti chemicky modifi kované celulózyPhysico-mechanical properties chemically modifi ed cellulose ................................ 282
Michaela Filipi, Miloslav MilichovskyMicrostructural analysis of oxycelluloses using synchrotronX-ray microtomography ............................................................................................................ 288
Ivana Plazonic, Zeljka Barbaric-Mikocevic, Vesna Dzimbeg-MalcicChemical composition of triticale straw as a paper fi ber source .............................. 292
6
Zbornik1_PA2014_10.indd 6Zbornik1_PA2014_10.indd 6 25. 2. 2014 12:11:1025. 2. 2014 12:11:10

Blažej Seman, Anton Geff ert, Jarmila Geff ertováVplyv skladovania dreva na jeho chemické zloženieEff ect of the wood storage on its chemical composition ............................................ 298
Ivana Schwarzova, Nadezda Stevulova, Julia CigasovaLightweight composites based on a woody part of the hemp plant ....................... 304
Zoltán Nagy, Marian Babiak, Josef DrábekTechnicko-ekologická analýza dopravy základných surovíndo celulózo-papierenského podnikuTechnical-economic analysis of transport of raw materialsto the pulp and paper mills .................................................................................................... 310
Petra Wollboldt, Andrea Borgards, Herbert Sixta, Hedda K. WeberCharacterization of Lignosulfonates from Diff erent Wood Sources ......................... 316
Matěj Hájek, Miloslav Milichovský, Michaela FilipiHypermolekulární vlastnosti celulózových materiálůHypermolecular properties of cellulosic materials ........................................................ 322
František Potůček, Bijay Gurung, Kateřina HájkováInfl uence of anthraquinone on soda pulping of rapeseed straw .............................. 328
Ondřej Mikala, Miloslav Milichovský, Jan Gojný, Michaela FilipiVliv atmosféry tvořené oxidy dusíku na proces stárnutípórovitých materiálů na celulózové a lignocelulózové báziEff ect of nitrogen oxide atmosphere on aging processof porous materials on cellulose and lignocellulose base ........................................... 334
Kateřina Hájková, Bijay Gurung, František PotůčekSoda pulping of rapeseed straw ............................................................................................ 338
Jana Provazníková, Ján Gallik, Soňa Kirschnerová,Štefan Šutý, Katarína VizárováAnalýza vplyvu technológie na fi nálne vlastnosti papieraTechnology impact analysis on the fi nal paper properties ......................................... 343
Lenka Dubinyová, Katarína Čížová, Aleš Ház, Alexandra SládkováMetódy analýzy a identifi kácie prírodných polymérnych látokMethods of analysis and identifi cation of natural polymeric substances ............. 348
Aleš Ház, Alexandra Sládková, Katarína Čížová,Lenka Dubinyová, Igor ŠurinaEff ect of supercritical fl uid extraction on the compositionof main wood components .................................................................................................... 353
Andrea Škulcová, Michal Jablonský, Aleš HázCharacterization of isolated lignins ...................................................................................... 357
Alexandra Sládková, Aleš Ház, Lenka Dubinyová, Katarína Čížová, Igor ŠurinaVplyv spôsobu prípravy lignínov na ich termické vlastnostiEff ect of isolation on the thermal properties of lignins ................................................ 362
7
Zbornik1_PA2014_10.indd 7Zbornik1_PA2014_10.indd 7 25. 2. 2014 12:11:1025. 2. 2014 12:11:10

8
Michal Jablonský, Lenka Dubinyová, Martina Botková, Milan VrškaUltrasonic treatment of recycled pulp fi bres ..................................................................... 367
Pavel Krkoška, Jozef Hanus, Martina KováčováStálosť a trvanlivosť zirkóniových derivátov celulózybuničinových vlákien a papieraStability and durability of zirconium cellulose derivativesin cellulose fi bers and paper .................................................................................................. 373
Nencho Deliiski, Anton Geff ert, Jarmila Geff ertovaCalculation of the energy consumption for the heatingof non-frozen wood chips in the cellulose production ................................................. 380
Prílohy/Appendices
Per TomaniLignin removal from kraft pulp mills ................................................................................... 388
Ivan Topoľský, Ľuboš BekoAspects of Ecological Printing ............................................................................................... 390
Milan HronecKatalytická konverzia lignocelulózy na významné chemikálieCatalytical conversion of lignocellulosics to the value added chemicals .............. 395
Vargic LadislavEnergy savings on paper machines – Options in real time .......................................... 396
Öznur Özden, Ahsen Ezel BildikApplication for paper and paperboards packaging ....................................................... 397
Mertoglu – Elmas GulnurFiber Properties of Rumeks Crispus L. Root ...................................................................... 398
Michal Ďurovič, Hana Paulusová, Eva DytrychováHromadné odkyselování archivních dokumentů – stav v roce 2014Mass deacidifi cation of archival documents – state in 2014 ...................................... 399
Zbornik1_PA2014_10.indd 8Zbornik1_PA2014_10.indd 8 25. 2. 2014 12:11:1025. 2. 2014 12:11:10

Wood, Pulp & Paper
Polygrafi a Academica
2014
Plenárne prednáškyPlenary lectures
WPP PA
Zbornik1_PA2014_10.indd 9Zbornik1_PA2014_10.indd 9 25. 2. 2014 12:11:1025. 2. 2014 12:11:10

10 Wood, Pulp and Paper 2014
Minimizing Eff ects of Particle Board Production
on the Environment.
Can particle board manufacturing be done
in a sustainable way?
Annamarie Velič
Ikea industry/Swedspan
Abstract: During manufacturing process of particle boards, starting from wood harvesting, transportation, chipping, drying and pressing, the eff ect on environment is signifi cant and at the same time manifold – on land, air, and water. The presentation showed at the Wood, Pulp and Paper 2014 Conference and this summary paper show how some of the negative eff ects can be minimized, or in some cases fully eliminated. The paper specifi cally focuses on environmental issues associated with the use of wood as raw material, emissions from production processes and the use and re-use of water and wastewater. A defi nition of “water positive” factory is introduced and explained in terms of industry eff ects on local water cycle. Overall, the particle board production processes are evaluated to their potential to produce a sustainable product in a sustainable way.
RAW MATERIALS
The type of raw material used in board production and its quantity has major eff ect on the industry’s sustainability “scorecard” (evaluation). Being able to use less raw material and only round wood which comes from responsibly managed forests is the fi rst key to a sustainable production of particle boards.
When evaluating the use of wood as raw material, one has to look at the whole life cycle of wood and biomass. The following order – or so called cascade use of wood – should be applied to prioritize the use of wood: use for direct production, re-use into the production, recycling and lastly – the use of wood for bioenergy (incineration).
Minimizing eff ects on environment when using wood for direct production starts with responsible wood harvesting. This means either taking wood only from certifi ed forests or having internal standards for proving the origin of the wood. Taking raw materials strictly based on price is no longer acceptable and environmentally responsible companies never concur to such business.
The advantage of particle board furniture is that it can also be manufactured from up to 100 % recycled wood. Taking post-consumer recycled wood for direct production of particle board is on the highest step of the cascade use of wood – use for production. However, companies realize that in many countries the off er
Pozvaná prednáška Invited lecture
Zbornik1_PA2014_10.indd 10Zbornik1_PA2014_10.indd 10 25. 2. 2014 12:11:1025. 2. 2014 12:11:10

Wood, Pulp and Paper 2014 11
of recycling wood does not match the demand. Especially in Central and Eastern Europe, waste management companies are currently not equipped with logistic solutions which would provide the market with suffi cient quantities of suitable quality recycled wood. In countries where the round wood prices are higher, the market for recycled wood is rather developed. However in some of these countries, subsidies to renewable energy have led to unhealthy competition for better quality recycled wood between energy and furniture sectors. As a result the quality of recycled wood taken to the board plants can be rather poor – i.e. containing signifi cant percentage of stones, silica, metals, glass and other impurities. Professional multi-stage cleaning is required which is high on energy and generates corresponding amounts of separated waste streams. The key to cleaner production for board producers may be involving themselves into close-the-loop initiatives within the country of their operation and/or back-integration into waste logistics and thus securing better quality recycled wood.
Another factor signifi cantly aff ecting the amount of raw material used for particle board production is the possibility of the board factories to produce boards for its intended fi nal functionality. Producing lighter-weight boards for sides, doors or other parts of furniture using the least amount of wood required to keep the specifi cations, saves substantial amount of raw material. With this saving come others – mainly the energy and CO2 emissions from both production and transportation.
WATER USE AND RE-USE
Even though the particle board production is not on top of the list of water-intensive industries, the use of water for glue preparation, emission cleaning, knife sharpening and area cleaning, can amount to water consumption of more than 100,000 m3 annually. Much of this water leaves the factories in form of wastewater either to a local wastewater treatment plant or to a recipient after an in-house treatment. In addition to these process waters, substantial amount of rainwater enters factory premises and depending on the local regulations, leaves the site directly or – after a treatment to a local recipient. The overall water balance for an average size particle board factory can be up to 350,000 m3 of water being used for production and collected in form of precipitation and discharged annually. The exact number varies depending on rain conditions in the area, paved surfaces and other factors such as type of emission cleaning devices employed. This water is essentially taken out of “the local water cycle” and by discharging it to a recipient which fl ows far from the collection point, it is ultimately lost for the local area water cycle. Long-term this water is missing in the local water cycle creating often shortage of groundwater and possibly contributing to fl ooding downstream from the discharge point.
Environmentally conscious production should avoid this eff ect and either re-use or re-cycle as much of the waste- and rain- water as possible. The ultimate goal is a so-called “water positive” production defi ned as one which supports the local
Zbornik1_PA2014_10.indd 11Zbornik1_PA2014_10.indd 11 25. 2. 2014 12:11:1025. 2. 2014 12:11:10

12 Wood, Pulp and Paper 2014
water cycle by re-using or infi ltrating storm water in higher degree than the use of ground- and tap water. This is a new concept of water management embraced today only by a handful of environmentally conscious companies, which instead of letting the water leave the local area, are using infi ltration ponds allowing the local water table to re-charge. For particle board industry becoming “water positive” means that several uses of water and discharges of waste-water must be inter-connected and looped. Collected rainwater for example can be used instead of fresh water for emission cleaning, surface cleaning, knife sharpening and vehicle cleaning. All these uses can be looped after the waters pass a suitable water treatment station. In addition waste-waters from emission cleaning device which are highly loaded with dissolved organics can be used in glue preparation. In this way the industry’s water balance can be moved from negative hundreds of thousands m3 to a more neutral or even positive numbers if infi ltration is used.
AIR EMISSIONS
When discussing air emissions from particle board production, two main sources play a main role: emissions from drying and emissions from a press. Both will be soon governed by a new BREF (Best Available Techniques (BAT) Reference Document for the Production of Wood–based Panels) which at the time of this conference was being prepared. At present, the best available technique applied by industry to clean the emissions from the two major sources is considered to be a Wet Electrostatic Precipitator (WESP). A WESP works as a wet scrubber with electrostatic fi eld further removing electrically charged dust particles. The WESP removes emissions of dust particles as well as water soluble organics and especially formaldehyde to concentration levels required in all EU countries. Besides eff ective cleaning of particles (effi ciencies above 99 % are reported), the system operates with a close-loop water system, where the water used for scrubbing is mechanically cleaned of dust and re-used in the cleaning process. However, in this process the water is gradually enriched with organic load, saturated with formaldehyde and if not bled outside continuously, the cleaning effi ciency over a short time decreases signifi cantly. Furthermore, if the water is kept in the system without bleeding, it will contain COD in amounts closed to 100,000 mg/L making it impossible to treat and requiring expensive and environmentally undesired incineration when the WESP is cleaned for maintenance. The solution to this problem is again connected with the “water positive” principle: part of the water after being used to clean emissions should be used for glue preparation as the organic compounds dissolved in water are the same as those naturally present in wood. In this way, the used water is no longer posing harm to the environment and the WESP effi ciency can be maintained on high levels at all time. Other water closed-loops can and should be applied in the particle board manufacturing process.
CONCLUSION
Zbornik1_PA2014_10.indd 12Zbornik1_PA2014_10.indd 12 25. 2. 2014 12:11:1025. 2. 2014 12:11:10

Wood, Pulp and Paper 2014 13
Sustainability principles can be applied throughout the particle board manufacturing process. Three areas where the industry can improve its sustainability “scorecard” are raw material use, water use and emission controls. Having the cascade use in mind when using wood as well as responsible harvesting is essential for sustainable use of raw materials. Water-positive concept, still new with industry is well applicable at particle board mills and results calculated as amount of water which can be kept in a local water cycle are substantial. Lastly, emission controls which will be soon govern by a newly prepared BREF document, need to be watched closely for continuous effi ciency. This can be ensured when joining the emission cleaning eff orts with water management.
Zbornik1_PA2014_10.indd 13Zbornik1_PA2014_10.indd 13 25. 2. 2014 12:11:1025. 2. 2014 12:11:10
14 Polygrafi a Academica 2014
Recyclability of graphic products
and paper based packaging
Diana Gregor Svetec1, Janja Zule2, Graziano Elegir3
1University of Ljubljana, Faculty of Natural Sciences and Engineering,Aškerčeva 12, Ljubljana, Slovenia, [email protected]
2Pulp and Paper Institute, Bogišićeva 8, Ljubljana, Slovenia, [email protected], Paper Research Division, Via G. Colombo 83, Milano, Italy,
Abstract: Improper design of graphic or packaging product can create problems in the recycling process, lower the recycled paper quality and worsen the environmental impact. It is essential that paper based products are manufactured considering a good recyclability. For good recyclability, paper based products have to be repulpable and adhesives have to be removable, and for all white grades graphic products paper must be also deinkable. To put paper recycling – in terms of yield and quality – into optimum practice all across Europe, however, appropriate paper recycling strategies are of utmost importance. In Central Europe project EcoPaperLoop a new EPL standard method to evaluate the recycling performance of paper based packaging products has been developed and will be presented in this paper. The applicability of EPL recyclability test will be shown by presenting the results of testing three diff erent paper based packaging; corrugated box, folding boxboard, folding boxboard for liquid packaging.
Keywords: graphic papers, paper based packaging, EcoPaperLoop project, recyclability.
1. Introduction
The use of paper for recycling as a raw material involves a multi-stage treatment of paper for recycling including, separation and elimination of contaminants in order to obtain recycled pulp. For good recyclability, paper products have to be repulpable and adhesives have to be removable. That is important for all types of paper products. For all white grades paper must be also deinkable. The term deinkability, expressing the ability of a printed product to be deinked, is defi ned as removal of ink and/or toner from a printed product to a high extent by means of deinking process [1].
The goal of EcoPaperLoop project is to expand the database on recyclability and deinkability of graphic papers that already exist in some countries (Germany, Italy) to other central European countries (Poland, Hungary, Slovenia). Another goal of the project is to develop a common method for testing recyclability of paper based packaging. On the basis of extensive assessment campaign a wide database on packaging recyclability in Germany, Italy, Poland, Slovenia and
Pozvaná prednáška Invited lecture
Zbornik1_PA2014_10.indd 14Zbornik1_PA2014_10.indd 14 25. 2. 2014 12:11:1025. 2. 2014 12:11:10

Polygrafi a Academica 2014 15
Hungary will be created. A scorecard proposal will constitute the main output of this activity [2].
2. Recyclability of graphic products
For printed paper products the assessment of the recyclability is in the two aspects: deinkability and screenability of adhesives. The deinkability test is mostly performed according to INGEDE Method 11 [3], and the screening ability of adhesive applications according to INGEDE Method 12 [4]. In these tests the alkaline fl otation process steps in an industrial deinking plant are simulated under standard conditions in a laboratory scale. According to INGEDE Method 11 fi ve parameters are evaluated: luminosity, dirt particle area (subdivided into the area of particles larger than 50 μm and above 250 μm in diameter) and a* value representing colour shade on the red-green axis of deinked pulp, ink elimination and fi ltrate darkening. The fi rst three are quality parameters characterizing the deinked pulp as to brightness and cleanliness. The last two are process parameters (ink elimination, discoloration of fi ltrate) off ering information on the possible eff ects of ink carry-over on deinking [1]. Results of deinkability tests are converted into Deinkability Scores. For each of the fi ve parameters threshold and target values are defi ned [1, 5]. For a given print product, the threshold values have to be fulfi lled for all parameters. If one or more threshold values fail, the print product is considered unsuitable for deinking, though it can be well recyclable. If all thresholds are reached, the product is judged as deinkable with three various gradations: poor, fair or good [1, 5]. By INGEDE Method 12, adhesive applications are pulped together with deinking chemicals and woodfree copy paper, which is free of stickies. After screening the reject is prepared and measurement of stickies (number and size) are done by image analysis. Results are converted into Removal Scores. Benchmark for sticky potential is total macrosticky area below 2000 μm whereas the cut-off parameter Is the share of this area in comparison to the total macrosticky area. When the share is greater than 50 % the sample is assessed as “insuffi ciently removable” [1].
Deinkability test results show that the best deinkability is achieved for coated magazines, followed by uncoated magazines. On uncoated papers the adhesion of printing ink to paper depends on paper structure and surface properties, the structure of ink and and drying mechanism. The radiation curing UV inks and off set inks containing large quantitiy of oxidatively drying vegetable oils are problematic [1, 6]. Also the water based fl exographic and inkjet inks are not suffi ciently removed because the inks particles are too hydrophilic and too small for an effi cient fl otation [6]. Deinkability scores of tests with diff erent printing technologies show the best deinkability for rotogravure and digital with dry toner, followed by off set and the lowest for the fl exography, inkject prints and liquid toner. According to removal ability of adhesive applications for printed paper products hardly any label products fulfi l the recycling criteria. The thin fi lms and dispersion glues, due to their chemical nature are also problematic for recycling [6].
Zbornik1_PA2014_10.indd 15Zbornik1_PA2014_10.indd 15 25. 2. 2014 12:11:1025. 2. 2014 12:11:10
16 Polygrafi a Academica 2014
3. Recyclability of paper based packaging
To ensure improved recycling cycles packaging products have to fulfi l recyclability requirements; i.e. repulpability and removability of adhesives. The potential problems when recycling a specifi c piece of packaging are: it can be diffi cult to disintegrate, it can contain non-paper components such as plastic fi lms and it can include adhesives that are diffi cult to remove during the recycling process. Recyclability requirements are: low content of undesirable materials to avoid high losses, low fl ake content, because high content can cause sheet faults and low fragmentation behaviour of adhesive applications [5]. Non-paper components should be mechanically stable in such a way that they survive as large particles, without being comminuted, in the conditions of pulping. They have to allow mechanical separation by means of punched screens, slot screens and centrifugal purifi ers. Materials applied in very small dimensions or disintegrating into very small parts are unfavorable, because they cannot be removed using today‘s conventional screen methods.
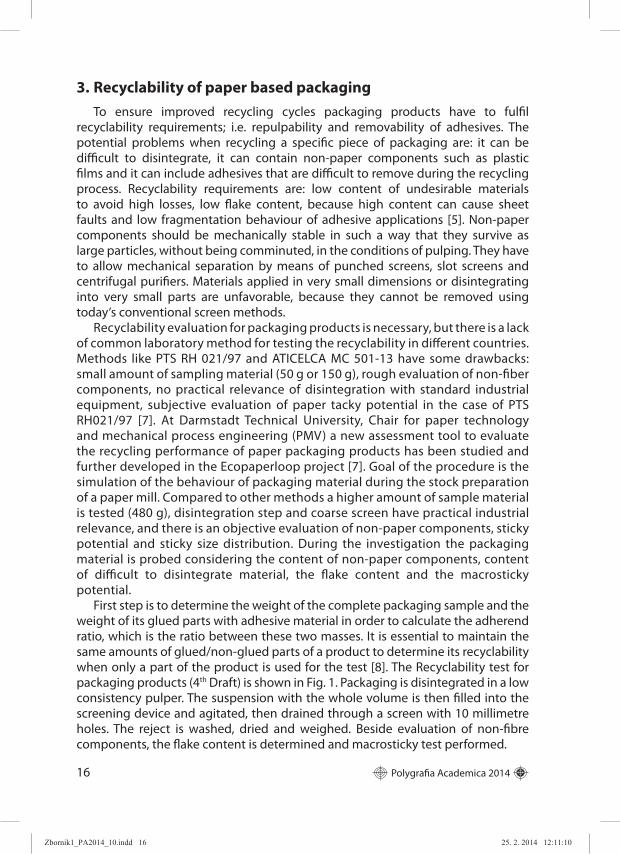
Recyclability evaluation for packaging products is necessary, but there is a lack of common laboratory method for testing the recyclability in diff erent countries. Methods like PTS RH 021/97 and ATICELCA MC 501-13 have some drawbacks: small amount of sampling material (50 g or 150 g), rough evaluation of non-fi ber components, no practical relevance of disintegration with standard industrial equipment, subjective evaluation of paper tacky potential in the case of PTS RH021/97 [7]. At Darmstadt Technical University, Chair for paper technology and mechanical process engineering (PMV) a new assessment tool to evaluate the recycling performance of paper packaging products has been studied and further developed in the Ecopaperloop project [7]. Goal of the procedure is the simulation of the behaviour of packaging material during the stock preparation of a paper mill. Compared to other methods a higher amount of sample material is tested (480 g), disintegration step and coarse screen have practical industrial relevance, and there is an objective evaluation of non-paper components, sticky potential and sticky size distribution. During the investigation the packaging material is probed considering the content of non-paper components, content of diffi cult to disintegrate material, the fl ake content and the macrosticky potential.
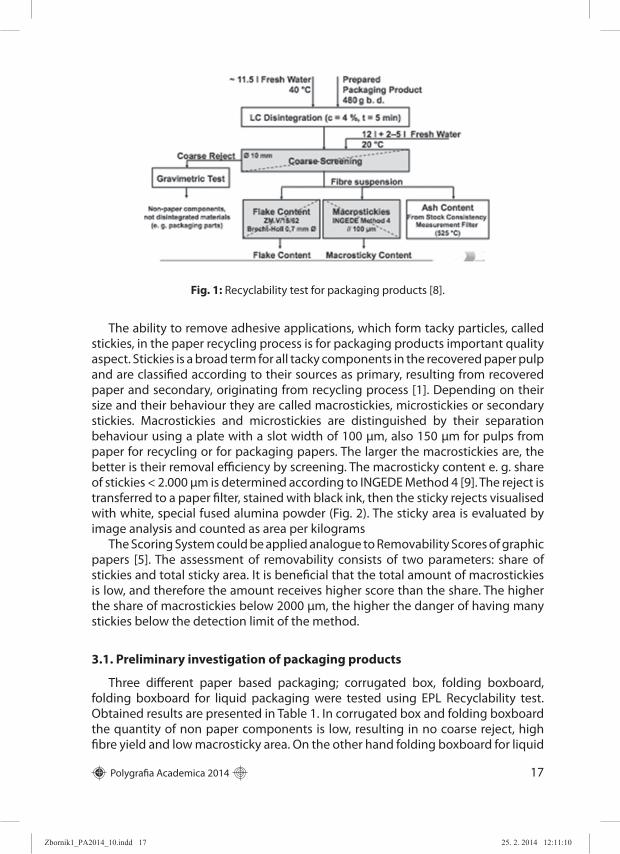
First step is to determine the weight of the complete packaging sample and the weight of its glued parts with adhesive material in order to calculate the adherend ratio, which is the ratio between these two masses. It is essential to maintain the same amounts of glued/non-glued parts of a product to determine its recyclability when only a part of the product is used for the test [8]. The Recyclability test for packaging products (4th Draft) is shown in Fig. 1. Packaging is disintegrated in a low consistency pulper. The suspension with the whole volume is then fi lled into the screening device and agitated, then drained through a screen with 10 millimetre holes. The reject is washed, dried and weighed. Beside evaluation of non-fi bre components, the fl ake content is determined and macrosticky test performed.
Zbornik1_PA2014_10.indd 16Zbornik1_PA2014_10.indd 16 25. 2. 2014 12:11:1025. 2. 2014 12:11:10
Polygrafi a Academica 2014 17
The ability to remove adhesive applications, which form tacky particles, called stickies, in the paper recycling process is for packaging products important quality aspect. Stickies is a broad term for all tacky components in the recovered paper pulp and are classifi ed according to their sources as primary, resulting from recovered paper and secondary, originating from recycling process [1]. Depending on their size and their behaviour they are called macrostickies, microstickies or secondary stickies. Macrostickies and microstickies are distinguished by their separation behaviour using a plate with a slot width of 100 μm, also 150 μm for pulps from paper for recycling or for packaging papers. The larger the macrostickies are, the better is their removal effi ciency by screening. The macrosticky content e. g. share of stickies < 2.000 μm is determined according to INGEDE Method 4 [9]. The reject is transferred to a paper fi lter, stained with black ink, then the sticky rejects visualised with white, special fused alumina powder (Fig. 2). The sticky area is evaluated by image analysis and counted as area per kilograms
The Scoring System could be applied analogue to Removability Scores of graphic papers [5]. The assessment of removability consists of two parameters: share of stickies and total sticky area. It is benefi cial that the total amount of macrostickies is low, and therefore the amount receives higher score than the share. The higher the share of macrostickies below 2000 μm, the higher the danger of having many stickies below the detection limit of the method.
3.1. Preliminary investigation of packaging products
Three diff erent paper based packaging; corrugated box, folding boxboard, folding boxboard for liquid packaging were tested using EPL Recyclability test. Obtained results are presented in Table 1. In corrugated box and folding boxboard the quantity of non paper components is low, resulting in no coarse reject, high fi bre yield and low macrosticky area. On the other hand folding boxboard for liquid
Fig. 1: Recyclability test for packaging products [8].
Zbornik1_PA2014_10.indd 17Zbornik1_PA2014_10.indd 17 25. 2. 2014 12:11:1025. 2. 2014 12:11:10

18 Polygrafi a Academica 2014
packaging is a complex packaging which is made from board and plastic fi lms and gives a lot of coarse reject and low fi bre yield. Also the macrosticky area is much higher in comparison to other two tested samples.
Tab. 1: Results of EPL Recyclability test for diff erent packaging samples: corrugated box, folding boxboard, folding boxboard for liquid packaging.
SampleAdherend ratio (%)
Coarse reject (%)
Flake content (%)
Macrosticky area (mm2/kg)
Corrugated box 2.9 ± 0.3 0.4 8.9 ± 2.7 1678Folding box 4.5 ± 0.3 0.0 0.7 ± 0.6 1362
FB – liquid packaging 10.7 ± 0.3 49.4 11.7 ± 2.5 1033
4. Conclusions The use of recycled materials is important in the development of sustainable
packaging. As recycled products are a source of future packaging materials, products’ recyclability is one of the most important criteria. To have relaible data upon recyclability the database on recyclability of graphic papers and paper based packaging is needed. The development of common method for recyclability evaluation of paper based packaging and building the database are among the most important goals of the EcoPaperLoop project.
Acknowledgement
EcoPaperLoop project is implemented through the CENTRAL EUROPE Programme and is co-fi nanced by the European Union/European Fund for Regional Development.
Fig. 2: Determination of sticky content [8].
Zbornik1_PA2014_10.indd 18Zbornik1_PA2014_10.indd 18 25. 2. 2014 12:11:1025. 2. 2014 12:11:10

Polygrafi a Academica 2014 19
5. References
1. Faul, A. M. 2010. Quality requirements in graphic paper recycling. In Cellulose Chem. Technol., Vol. 44, No. 10, pp. 451—460.
2. EcoPaperLoop: 2012. A new Central Europe Project to Improve Collection and Product Design. 1st Press Release 1/2012. Available on internet: http://www.ecopaperloop.eu/press/pr1201-en.html.
3. INGEDE Method 11. 2012. Assessment of Print Product Recyclability. Deinkability Test. 13 p.
4. INGEDE Method 12. 2009. Assesssment of the Recyclability of Printed Paper Products. 7 p.
5. Putz, H.-J., Voß, D. 2012. Recyclability Assessment — the Chance to develop EcoPaper Products. CEPI European Paperweek, Brussels. Available on internet: http://www.ecopaperloop.eu/en/events/2012-11-epw/2012-11-Putz-Paperweek.pdf
6. Stawicki, B., Read, B. 2010. The Future of Paper Recycling in Europe. Brussels: COST Offi ce. 208 p.
7. Voß, D., Putz, H.-J. 2013. Recyclability Evaluation for Packaging Products — Recyclability Seminar. Darmstadt, 22.—23. January 2013.
8. Putz, H.-J., Runte, S. 2013. Packaging Paper and Board: Raw Materials, Production, Converting and Recylability. EcoPaperLoop Seminar: Enhancing the quality of paper for recycling. Warsaw: COBRO 29. 10. 2013. pp. 59—80.
9. INGEDE Method 4. 2011. Analysis of macrostickies in pulp. 11 p.
Zbornik1_PA2014_10.indd 19Zbornik1_PA2014_10.indd 19 25. 2. 2014 12:11:1125. 2. 2014 12:11:11
20 Polygrafi a Academica 2014
Trendy rozvoja tlačových technológií
Stefan Jakucewicz1, Ján Panák2
1Zakład Technologii Poligrafi cznych, Institut Mechaniky i Poligrafi iWydział Inźinierii Produkcji, Politechnika Warszawska
2Oddelenie polygrafi e a aplikovanej fotochémie, Ústav syntetických a polymérnych materiálov
Fakulta chemickej a potravinárskej technológie, STU v Bratislave
Abstrakt: The aim of this paper is to give a brief overview of trends in the printing industry in terms of the development of the global print and printed packaging output as well as the tendency in output by category of printed product. An analysis of development trends of off set printing presses, production inkjet and electro photo-graphy digital devices are also done. Attention is paid to trends in printing inks and printed substrates.
1. Globálny prehľad stavu a trendov tlačiarenského priemyslu
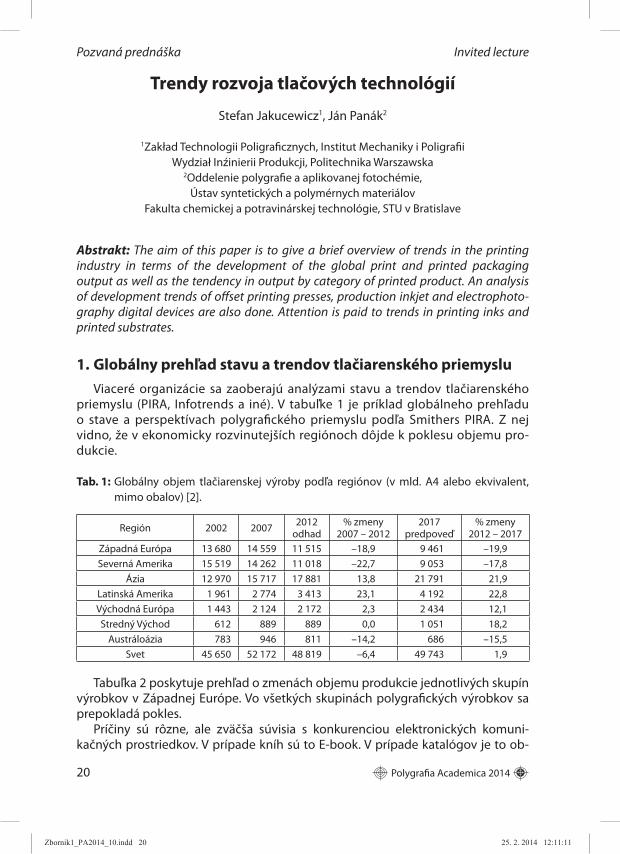
Viaceré organizácie sa zaoberajú analýzami stavu a trendov tlačiaren ského priemyslu (PIRA, Infotrends a iné). V tabuľke 1 je príklad globál neho prehľadu o stave a perspektívach polygrafi ckého priemyslu podľa Smithers PIRA. Z nej vidno, že v ekonomicky rozvinutejších regiónoch dôjde k poklesu objemu pro-dukcie.
Tab. 1: Globálny objem tlačiarenskej výroby podľa regiónov (v mld. A4 alebo ekvivalent, mimo obalov) [2].
Región 2002 2007 2012odhad
% zmeny 2007 – 2012
2017predpoveď
% zmeny2012 – 2017
Západná Európa 13 680 14 559 11 515 –18,9 9 461 –19,9
Severná Amerika 15 519 14 262 11 018 –22,7 9 053 –17,8
Ázia 12 970 15 717 17 881 13,8 21 791 21,9
Latinská Amerika 1 961 2 774 3 413 23,1 4 192 22,8
Východná Európa 1 443 2 124 2 172 2,3 2 434 12,1
Stredný Východ 612 889 889 0,0 1 051 18,2
Austráloázia 783 946 811 –14,2 686 –15,5
Svet 45 650 52 172 48 819 –6,4 49 743 1,9
Tabuľka 2 poskytuje prehľad o zmenách objemu produkcie jednotlivých skupín výrobkov v Západnej Európe. Vo všetkých skupinách polygrafi ckých výrobkov sa prepokladá pokles.
Príčiny sú rôzne, ale zväčša súvisia s konkurenciou elektronických komuni-kačných prostriedkov. V prípade kníh sú to E-book. V prípade katalógov je to ob-
Pozvaná prednáška Invited lecture
Zbornik1_PA2014_10.indd 20Zbornik1_PA2014_10.indd 20 25. 2. 2014 12:11:1125. 2. 2014 12:11:11

Polygrafi a Academica 2014 21
chodovanie cez internet. V prípade novín a časopisoch je to pokles príjmov z inzer-cie, ktorá sa presúva do elektronických médií (tab. 3).
Tab. 2 Objem tlačiarenskej výroby v Západnej Európe (v mld. A4 alebo ekvivalent, mimo obalov) [2].
Produktová skupina 2002 2007 2012odhad
% zmeny2007 – 2012
2017predpoveď
% zmeny2012 – 2017
Noviny 4 793 7 895 4 119 –15,8 2 939 –28,6
Časopisy 2 798 3 113 2 553 –18,0 2 254 –11,7
Knihy 656 689 484 –29,7 326 –32,7
Zoznamy 373 343 271 –21,0 179 –33,8
Katalógy 462 522 383 –26,6 293 –23,6
Reklamné tlačoviny 1 112 1 334 1 049 –21,4 807 –23,0
Obchodné a iné tlačoviny 2 122 2 121 1 439 –32,1 7 875 –23,5
Tlač celkovo 12 316 13 017 10 229 –20,9 7 875 –23,5
Obaly/etikety 1 364 1 542 1 516 –1,7 1 586 4,6
Tab. 3 Zmeny v objeme platenej inzercie uverejnenej v novinách a časopisoch a zmeny v počte výtlačkov podľa krajín za obdobie 2006 až 2011 [3].
KrajinaNoviny Časopisy
objem inzercie počet výtlačkov objem inzercie počet výtlačkov
USA –12,0 –3,2 –4,8 –3,3
Japonsko –9,7 –1,6 –11,9 –4,3
Veľká Británia –8,8 –2,7 –11,7 –3,2
Francúzsko 3,1 +0,8 –9,4 –2,5
Nemecko 2,8 –4,3 –2,9 –2,0
Rusko 1,3 +2,6 +0,6 –
Brazília +4,5 +2,7 +6,3 4,0
Mexiko +5,0 +3,2 +6,3 –
Čína +8,5 +1,8 +16,7 3,1
India +13,9 +5,7 +1,4 11,0
Priaznivejšia situácia je v objeme produkcie potlačených obalov a etikiet, kde sa predpokladá nárast. Dôvodom je, že elektronické médiá nekonkurujú obalom.
Tabuľka 4 vyjadruje podieľ jednotlivých techník tlače na globálnom objeme tla-čiarenského priemyslu ako aj trendy vývoja. Výrazný pokles kotúčového ofsetu, tak novinového (CSWO) ako aj akcidenčného (HSWO) súvisí s poklesom objemu pro-dukcie novín a časopisov.
Jednoznačne najdynamickejšie sa rozvíjajú digitálne techniky tlače. Tlačiaren-ský priemysel dnes nie je iba výrobcom tovarov ale najmä poskyto vateľom služieb, ktorý sa musí podriaďovať požiadavkám zo strany zákaz níkov a prispôsobovať sa zmenám na trhu. Týmito sú najmä – pokles výšky nákladov, požiadavka na kratšie výrobné termíny, konkurencia na trhu tlačiarenských služieb, požiadavky na varia-
Zbornik1_PA2014_10.indd 21Zbornik1_PA2014_10.indd 21 25. 2. 2014 12:11:1125. 2. 2014 12:11:11

22 Polygrafi a Academica 2014
bilitu a personalizácia tlačovín. Tomuto trendu vyhovujú digitálne techniky tlače tak v oblasti polygrafi ckej výroby ako aj v oblasti potlačených obalov.
Podľa InfoTrends materiálov oblasťami v ktorých by sa mala najviac presadiť di-gitálna tlač sú: knihy, brožúry, direct-mail a traspromo tlačoviny.
2. Trendy v oblasti klasických tlačových techník – ofsetová tlač
Najväčšiu pozornosť si zaslúži ofsetová tlač a v rámci nej najmä univerzál na hár-ková tlač. V techológii Computer to Plate, ktorá výrazne prispela k stabilite a kvalite ofsetovej tlači možno v najbližšom období očakávať iba evolučné zmeny.
Výrobcovia hárkových strojov sa zamerali na zvýšenie efektivity a produkti vity tlače cestou minimalizácie prípravných časov a času potreb ného na dosiahnutie a udržanie požadovanej kvality tlače, ako aj zvýšenie pridanej hodnoty inline la-kovaním a razbou. Vďaka rosiahlej implementácie elektroniky, inline kontrolných systémov, možno stroj prestaviť na novú zákazku v čas kratšom ako 10 – 15 mi-nút. Ešte efektívna výška nákladu sa posunula k hodnote okolo 750 hárkov. Ďalším trendom je hybridizácia ofseto vých strojov zarade ním inline inkjetovej jednotky pre tlač variabilných dát. Rozšírením využívania UV farieb, ktoré umožňujú okamži-tú spracovateľnosť výtlačok sa zvýšila konkurencie schopnosť ofsetovej tlače voči digitalnej tlači. Tvalou prednosťou ofsetovej tlače zostáva univerzálnosť z hľadis-ka potláča ného papiera, možnosť nákupu tlačových farieb od viacerých výrobcov a vysoká kvalita tlače a jej štandardnosť.
3. Trendy v oblasti digitálnej elektrofotografi ckej tlače
Významnou zmenou v oblasti tak elektrofotografi ckej ako aj inkjetovej tlače je zvýšenie formátu na B2. To umožňuje využiť existujúce zariadenia pre dokončova-
Tab. 4 Globálny objem produkcie polygrafi ckého a obalového priemyslu podľa techník tla-če v období 2002 až 2017 v mld. v cenách z roku 2012 [2].
tlačová technika 2002 2007 2012
odhad% zmeny
2007 – 20122017
predpoveď% zmeny
2012 – 2017hárkový ofset 183,1 203,1 194,8 –4,1 197,5 1,4
HSWO 145,3 146,9 118,0 –19,6 102,8 –12,9
CSWO 119,8 124,0 98,8 –6,5 80,1 –18,9
hĺbkotlač 74,3 82,6 77,2 –6,5 78,7 1,9
fl exotlač 133,9 149,3 151,6 1,6 171,8 13,3
sieťotlač 29,1 25,9 19,5 –24,7 14,4 –26,0
kníhtlač 8,7 8,7 5,0 –42,7 4,2 –14,5
iné 62,2 64,7 70,2 8,5 83,5 19,0
elektrofotografi a 24,5 49,4 78,7 59,3 105,7 34,4
inkjet 16,5 26,6 42,6 60,3 74,6 75,3
spolu 797,3 880,9 856,2 –2,8 913,4 6,7
Zbornik1_PA2014_10.indd 22Zbornik1_PA2014_10.indd 22 25. 2. 2014 12:11:1125. 2. 2014 12:11:11

Polygrafi a Academica 2014 23
cie spracovanie. Vývoj a zavedenie tzv. chemických práško vých tonerov vyznaču-júcich sa rozmerom častíc 5 až 8 μm s úzkou distri bučnou krivkou a zväčša ovál-nym tvarom s možnosťou kontroly štruktúry častice, výrazne zvýšilo kvalitu tlače na takmer ofsetovú, znižuje teplotu fi xácia, znižuje energe tické nároky a umožňuje potláčať i tepelne citlivé materiály.
Prednosti elektrofotografi ckej tlače s použitím kvapalných tonerov (LEP) je vše-obecne známa. Doteraz však reprezentovaná iba zariadeniami HP Indigo Press. Na drupe 2012 boli predstavené konkurenčné systémy. Océ predsta vilo kotúčový systém pre obalovú kartonážnu Océ InfoStream. Ryobi v spolu práci s Miyakoshi predstavilo hárkový Ryobi DP720 a Xeikon kotúčový Trillium. Stroj Ryobi je zatiaľ iba funkčný model a Trillium iba ako koncept. Ich deklarovanou výhodou je medzi iným recyklovateľnosť potlače ného papiera.
4. Trendy v oblasti digitálnej inkjetovej tlače
K najväčšiemu rozvoju, čo prezentovala drupa 2012 došlo v oblasti inkjetovej pl-nofarebnej produkčnej hárkovej i kotúčovej tlače. Zdokonalenia injketových hláv – zvýšenie počtu dýz, zvýšenie pracovnej frekvencie DOD systémov, zvýšenie hus-toty záznamu, zmenšebie objemu kvapiek, práca v sivotónovom móde. To všetko prispelo k zvýšenie kvality tlače, zvýšeniu rýchlosti tlače pri kotúčových systémoch na 250 metrov za minútu alebo 5 140 A4+4 strán za minútu, pri hárkových systé-moch na 3 300 B2 hárkov 4+0 za hodinu.
Pri použití UV inkjetových farieb (Heidelberg Linoprint, Screen Truepress Jet L350UV a podobne) alebo tavných farieb (Kodak CiPress) nie sú kladené na potláčaný substrát špeciálne požiadavky. Kvalita inkjetovej tlače s farbami na vodnej báze však stále závisí na použitom substráte. Pri vyššom pokrytí papiera farbou nemožno dosiahnuť kvalitu ofsetovej tlače bez špeciálnej úpravy povrchu papiera, čo obmedzuje možnosti, zvy-šuje cenu papiera. Viacerí výrobcovia tento problém rieša zaradením ovrstvovacieho zariadenia pred inkjetové jednotky (Fujifi m JetPress 720, HP TXXX, Delfax elan...).
Tento problém by mala vyriešiť technológia Landa Nanography – nepria ma, of-setová inkjetová tlač. Plnofarebné zobrazenie sa najskôr pomo cou inkjetovej farby na vodnej báze (NanoInk) vytvorí na vyhrievanom páse, kde sa odstráni voda a le-pivý fi lm farby sa tlakom prenesie na potláčaný materiál. Po vychladnutí sú vytlačky okamžite spracovateľné. Na dtrupa 2012 boli predstavené viaceré verzie hárkových (B2 a B1) a kotúčových strojov. Podľa deklarovaných parametrov by mala byť Landa Nanography revolúciou v digitálnej tlači a mala byť vážnou konkureciou ofsetovej tlače. Stroje Landa Nanography zatiaľ nie sú komerčne dostupné.
5. Trendy v oblasti tlačových farieb
Pokles objemu predaja novinových a časopiseckých ofsetových farieb zazna-menaný v rokoch 2005 až 2011, ktorý pokračoval aj v rokoch 2012 a 2013 podľa EuPIA, klesne za dekádu 2010 až 2020 o 50 resp. 40 %. Výrobcovia obalových farieb očakávajú mierny ale stabilný nárast objemu.
Zbornik1_PA2014_10.indd 23Zbornik1_PA2014_10.indd 23 25. 2. 2014 12:11:1125. 2. 2014 12:11:11

24 Polygrafi a Academica 2014
Očakáva sa nárast používania UV farieb tak v klasických, ako aj v digitál nych technikách tlače s výnimkou kotúčovej hĺbkotlače. Dôjde k rozšíreniu Komori a Toyo Ink technológie H-UV farieb. Vysoko reaktívne UV farby vyvíjajú aj iný výrob-covia v spolupráci s výrobcami energeticky úspornejších UV žiaričov. Presadzuje sa i UV LED technológia. Výhodou používania UV farieb je okamžitá spracovateľnosť výtlačkov a žiadne problémy s legislatívou týkajúcej sa VOC.
V dôsledku prísnej legislatívy budú zo zloženia farieb vylúčené látky (pigmenty, živice, rozpúšťadlá a iné) označené v zoznamoch ako škodlivé pre zdravie človeka a životné prostredie. Pričom tieto zoznamy sa neustále aktualizujú tak, ako sa rozši-rujú poznatky o škodlivosti chemických látok.
Bude pokračovať náhrada organických rozpúšťadiel, pokiaľ je to možné, pri far-bách schnúcich odparením pri nízkych teplotách (najmä fl exotlačové farby pre vrch-nú i spodnú tlač) farbami na vodnej báze s dispergovanou fi lmotvornou látkou.
Nové farby pre kotúčový ofset, CSWO i HSWO, majúce širší farbový gamut a nižšiu ťažnosť, umožnia kvalitnejšiu reprodukciu farieb pri vysokých rýchlostiach tlače.
V súvislosti s rozvojom ofsetovej obalovej tlače sa rozširuje používanie tlačo-vých farieb s nízkym migračným limitom, ktoré schnú iba zapíjaním. Tieto budú v budúcnosti nahradené nízkomigrujúcimi radikálovými farbami schnúcimi UV žia-rením alebo EB technikou.
6. Trendy v oblasti tlačových substrátov
V súvislosti s poklesom objemu prosdukcie novín a časopisov bude stagnovať až klesať produkcia novinových a časopiseckých papierov. Potvrdzujú to i údaje v tab. 5.
Očakáva sa všestranný rozvoj produkcie viacvrstvových materiálov na báze pa-piera a plastov určených pre balenie potravín. V prípade laminátov na báze plastov je tendencia k znižovaniu ich plošnej hmotnosti.
Tab. 5 Globálna spotreba potláčaných materiálov pre tlačoviny a obaly (milióny ton) [2].
potláčaný substrát 2002 2007 2012odhad
% zmeny2007 – 2012
2017predpoveď
% zmeny2012 – 2017
novinový 37,2 34,2 31,5 –7,8 28,2 –10,7
drevité natierané 15,1 18,2 15,7 –137,0 15,8 0,3
bezdrevné natierané 22,5 24,6 24,6 –7,0 26,9 9,6
drevité nenatierané 14,0 15,0 12,8 –14,2 11,9 –7,4
bezdrevné natierané 26,9 30,8 30,4 –1,5 34,9 14,9
iné papiere 2,7 3,3 3,5 5,8 4,4 26,4
obalové kartóny 83,4 103,8 107,3 3,4 115,6 7,8
fi lmy 7,9 9,8 10,6 8,0 12,1 14,2
fólie 1,9 2,3 2,7 16,9 3,4 27,5
iné substráty 10,8 12,0 12,9 7,1 16,3 26,4
spolu 218,0 255,9 252,0 –1,5 269,5 6,9
Zbornik1_PA2014_10.indd 24Zbornik1_PA2014_10.indd 24 25. 2. 2014 12:11:1125. 2. 2014 12:11:11

Polygrafi a Academica 2014 25
Balenie potravín, vrátane balenia v modifi kovanej atmosfére, si vyžiada materiá-ly s lepšími bariérovými vlastnosťami, čo bude všeobecný trend v oblasti obalových materiálov.
Dôjde k rozvoju výroby a používania biodegradabilných fl exibilných fólio vých materiálov na báze plastov.
Zvýši sa objemu produkcie papierov vyrobených zo sekundárnej vlákniny.Presadzuje sa znižovanie plošnej hmotnosti novinových, časopiseckých a iných
papierov [5].Presadí sa zmena technológie výroby papiera na viacvrstvové formovanie i pri
papieroch s nízkou plošnou hmotnosťou.
Poďakovanie
Práca bola realizovaná s fi nančnou podporou Vedeckej grantovej agentúry MŠ SR (VEGA 1/0818/13).
7. Použitá literatúra
1. Hamilton, J. Production Inkjet Technologies – A New Digital print Reality. InfoTrends Inc. May 2011 Dostupné na internete: <http://www.digitalimagingassocia.ca/.../InfoTrends_DIA_presentation.pdf>.
2. Waite, N. Overview of the Global Printing Industry. SMITHERS PIRA, graphispag.digi-tal, Barcelona, April 2013 Dostupné na internete: <http://media.fi rabcn.es/content/S049013/docs/ponencias/Ppt_Waite_Nick.pdf>.
3. Devineni, M., Green, A. Rose, J., Zuckerman, N., Zwillinberg, P. Transforming print media. The Boston Consulting Group, December 2012. Dostupné na internete:<http://www.printpower.eu/userfi les/fi les/Boston_Consulting_Group_Transforming_Print_Media_Dec_2012_pdf.pdf>.
4. Falconer, N. Adapting to change in an online world. Printn Future. NAPM Conference. Dostupné na internete: < www.napm.org.uk/FalconerPres.pdf>.
5. Ehrnrooth, T. Trends in Paper Market – How the paper industry meet the challanges. The Biofore Company UPM. Dostupné na internete: <www.era.eu.org/02/.../ERA_ac13_ehrnrooth.pdf>.
6. Schultze-Hagenedt, D. Recent develpment in digital printing – drupa 2012 and after. 22th INDEGE Symposium. 15 February 2013. Dostupné na internete: <http://www.ingede.com/ingindxe/symp/symp2013/symp2013_06_schulze-hagenest-col.pdf>.
7. Castrej’on-Pita, J. R., Baxter, W. R. S., Morgan, J., Temple, S., Martin, G. D., Hutchings, I. M. Future Opportunities and Challenges of Inkjet Technologies. Atomization and Sprays (2013). Dostupné na internete: <https://www.repository.cam.ac.uk/handle/1810/238990>.
8. White, D. E. et al. Identifi cation of trends in papers for digital printing. Dostupné na inter-nete: <http://www.cpbis.gatech.edu/fi les/papers/CPBIS-WP-07-02%20White%20et%20al%20_RIT_Sloan_Dig_Paper.pdf>
9. Europski rynek farb drukarskich – producenti farb w pogoni za wzrostem. In Poligrafi ka, 2013, č. 11. str. 48 – 50. Preklad: Eda Boogaarda „Les fabricants d‘encre d‘imprimerie en quete de croisssance” z „Nouvelles Graphiques”. 2013. nr. 9.
Zbornik1_PA2014_10.indd 25Zbornik1_PA2014_10.indd 25 25. 2. 2014 12:11:1125. 2. 2014 12:11:11

26 Polygrafi a Academica 2014
10. Forecasting the future fortunes of print tech. Dostupné na internete: <http://www.printweek.com/print-week/feature/1141435/forecasting-future-fortunes-print-tech>.
11. Eccles, S.: drupa review part 1: digital presses. Dostupné na internete: <http://www.paperandprint.com/digital-printer/features/dp-2012/september-2012/dp120628_drupa_review1_presses.aspx>.
12. Zwang, D. Recent commentary & analysis from David Zwang. Dostupné na internete: <http://whattheythink.com/articles/author/51/?startrow=26&total=48>.
13. High Speed Production Inkjet: Progress Marches on in 2013. Dostupné na internete:
<http://info.outputlinks.com/american-printer/bid/83157/High-Speed-Production-Inkjet-Progress-Marches-on-in-2013>.
14. Continuous-feed Inkjet: Paper Plays a Starring ‚Roll‘. Dostupné na internete: <http://www.piworld.com/article/paper-options-continuous-feed-inkjet-production-printing-presses/1#>.
15. Next generation printing technologies. Komori OnPress No. 79 2013. Dostupné na inter-nete: <http://www.komori.com/contents_com/onpress/pdf/op79.pdf>.
16. Sean, M. UV Continues to Grow in Europe – Gains in energy effi ciency, highly reactive inks are helping to drive growth in energy-curing technologies. Dostupné na internete: <http://www.inkworldmagazine.com/issues/2014-01/view_features/uv-continues-to-grow-in-europe/>.
17. Future of books – digital or electronic? Dostupné na internete: <http://www.inter-quest.com/articles/FutureOfBooks.pdf>.
18. Lelek, M. Archový ofset. světy se zbližují. Typografi a 7–8 (2012). ročník 115. č. 1237. str. 3 – 4.
19. Lelek, M. Kotoučový ofset – širší, rychlejší a automatizovaný. Typografi a 7–8 (2012). roč-ník 115. č. 1237. str. 5.
20. Lešikar, M. Průmysl papíru a celulózy v Evropě. Typografi a 2 (2013). ročník 116. č. 1243. str. 3 – 4.
21. Lelek, M. Ofsetový a digitální tisk v komerčních tiskárnách 1. Typografi a 5 (2013). ročník 116. č. 1244. str. 3 – 5.
22. Lelek, M. Ofsetový a digitální tisk v komerčních tiskárnách 2. Typografi a digitální 5 (2013). ročník 4. č. 34. str. 5.
23. Bělík, M. Budoucnost knih je digitální. Typografi a 7–8 (2013). ročník 116. č. 1248. str. 10. 24. Kolejne posunięcia Beny’ego Lyndy. Poligrafi ka 2013. č. 12. str. 10 – 11. 25. Croll. D. Technologies and substrates. Océ Printing Systems. Dostupné na internete:
<http://www.myoceeventinfo.com/Oc%C3%A9%20Printing%20Systems%20Technology%20and%20Paper%202012-05-13_davidcroll_fordistribution.pdf>.
26. Key Statistics European Pulp and Paper Industry 2012. Confederation of European Paper Industries. Publikované 3. 7. 2013. Dostupné na internete: <http://www.cepi.org/system/fi les/public/documents/publications/statistics/2013/Key%20Statistics%20Report%202012.pdf>.
27. Preliminary statistic 2013. Confederation of European Paper Industries. Publikované 4. 2. 2014. Dostupné na internete: <http://www.cepi.org/system/fi les/public/documents/publications/statistics/2014/Preliminary%20Statistics%202013%20Final.pdf>.
28. The State of Paper Industry 2011. Steps Toward the Environmental Vision. Environmental Paper Network. Dostupné na internete: <http://environmentalpaper.org/documents/state-of-the-paper-industry-2011-full.pdf>.
Zbornik1_PA2014_10.indd 26Zbornik1_PA2014_10.indd 26 25. 2. 2014 12:11:1125. 2. 2014 12:11:11

Wood, Pulp and Paper 2014 27
Miroslav Vajs, Štefan Boháček, Juraj Dlhopolček
Zväz celulózo-papierenskeho priemyslu SR, Lamačská cesta 3, 841 04 Bratislava, [email protected]
Abstrakt: Rastúcu konkurencieschopnosť celulózo-papierenského priemyslu SR do-kazuje jeho pozícia na trhu, realizácia najnovších poznatkov v oblasti technologické-ho rozvoja a z nich vyplývajúce komparatívne výhody. Pozitívne trendy ukazuje vývoj v oblasti produktivity, veľkosti výrobných kapacít a spotreby základných surovín, pre-dovšetkým dreva, zberového papiera a vody. Zaujímavé sú trendy v oblasti výroby bu-ničiny a papiera a lepenky. Analýze sa podrobí aj oblasť životného prostredia, poukáže sa na investičné aktivity a pozitívne výsledky odvetvia v oblasti technického rozvoja, znižovania emisií, znečisťovania povrchových vôd ale tiež v oblasti znižovania energe-tickej náročnosti výroby.
Kľúčové slová: rozvoj, papier, celulóza, konkurencieschopnosť, produktivita
1. Úvod Za posledných 14 rokov slovenský celulózo-papierenský priemysel zaznamenal
takmer neprerušený rast vo výrobe a v spotrebe papiera. Dokonca v rokoch 2008 a 2009, v dobe keď kríza zasiahla ekonomiku takmer všetkých okolitých krajinách, slovenský celulózopapierenský priemysel zaznamenal najproduktívnejšie roky v svojej histórii. Výroba dosiahla takmer milión ton – 921 tis. ton za rok. Kontinuita rastu produkcie bola prerušená až v roku 2010 odstavením prevádzky na výrobu flutingu v spoločnosti Smurfit Kappa Štúrovo, a. s.
Slovenský celulózo-papierenský priemysel, ako odvetvie orientované na export bolo krízou zasiahnuté hlavne zníženou kúpyschopnosťou obyvateľstva, ktorá bola zaznamenaná u nás aj v okolitých krajinách. Spotreba papiera na Slovensku, podobne ako v ďalších krajinách v sledovanom období klesala. Štatistické údaje ZCPP SR potvrdzujú postupné zvyšovanie spotreby papiera a v súčasnosti už do-sahuje hodnoty spred krízy.
Výroba vláknin, papierov a lepeniek má za celé obdobie od roku 2000 stúpajúcu tendenciu, až do roku 2010, keď bola zastavená výroba flutingu v Štúrove. Po po-klese výroby o cca 15 % sa postupne produkcia zvyšovala, hlavne posilnením výro-by v sortimente grafických a hygienických papierov. Spotreba dreva je prakticky od roku 2006 stabilná so silnou prevahou spotreby listnáčového dreva, ktorého podiel sa stále zvyšoval. Spotreba ihličnanového dreva od roku 2003 klesla a udržuje sa na nízkej úrovni až do súčasnosti. Počet papierenských strojov za sledované obdobie
Zbornik1_PA2014_10.indd 27Zbornik1_PA2014_10.indd 27 25. 2. 2014 12:11:1125. 2. 2014 12:11:11
28 Wood, Pulp and Paper 2014
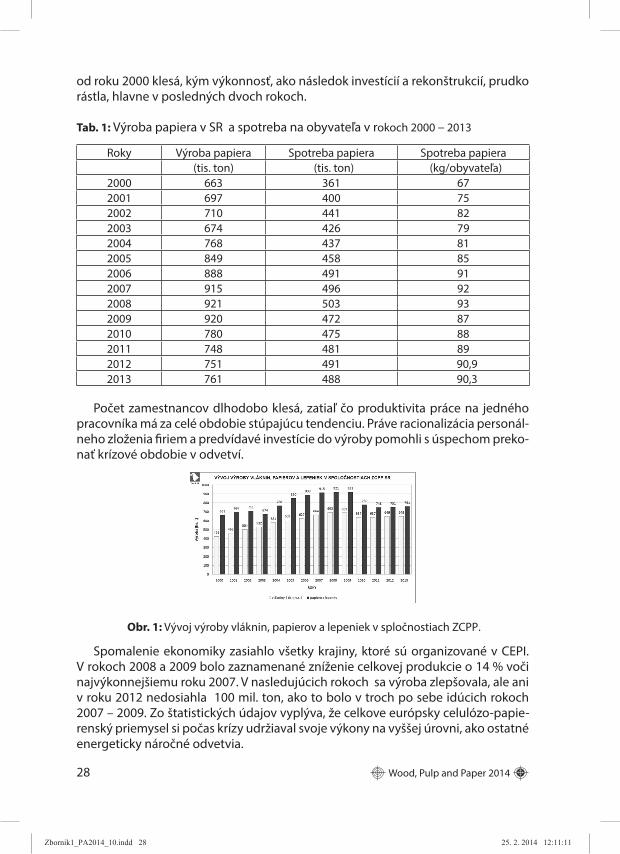
od roku 2000 klesá, kým výkonnosť, ako následok investícií a rekonštrukcií, prudko rástla, hlavne v posledných dvoch rokoch.
Tab. 1: Výroba papiera v SR a spotreba na obyvateľa v rokoch 2000 – 2013
Roky Výroba papiera Spotreba papiera Spotreba papiera(tis. ton) (tis. ton) (kg/obyvateľa)
2000 663 361 672001 697 400 752002 710 441 822003 674 426 792004 768 437 812005 849 458 852006 888 491 912007 915 496 922008 921 503 932009 920 472 872010 780 475 882011 748 481 892012 751 491 90,92013 761 488 90,3
Počet zamestnancov dlhodobo klesá, zatiaľ čo produktivita práce na jedného pracovníka má za celé obdobie stúpajúcu tendenciu. Práve racionalizácia personál-neho zloženia firiem a predvídavé investície do výroby pomohli s úspechom preko-nať krízové obdobie v odvetví.
Obr. 1: Vývoj výroby vláknin, papierov a lepeniek v spločnostiach ZCPP.
energeticky náročné odvetvia.
Spomalenie ekonomiky zasiahlo všetky krajiny, ktoré sú organizované v CEPI. V rokoch 2008 a 2009 bolo zaznamenané zníženie celkovej produkcie o 14 % voči najvýkonnejšiemu roku 2007. V nasledujúcich rokoch sa výroba zlepšovala, ale ani v roku 2012 nedosiahla 100 mil. ton, ako to bolo v troch po sebe idúcich rokoch 2007 – 2009. Zo štatistických údajov vyplýva, že celkove európsky celulózo-papie-renský priemysel si počas krízy udržiaval svoje výkony na vyššej úrovni, ako ostatné
Zbornik1_PA2014_10.indd 28Zbornik1_PA2014_10.indd 28 25. 2. 2014 12:11:1125. 2. 2014 12:11:11

Wood, Pulp and Paper 2014 29
V porovnaní s ostatnými krajinami v stredoeurópskom regióne slovenský celu-lózo-papierenský priemysel až do roku 2010 odolával negatívnemu vplyvu krízy. Najsilnejším zásahom do hospodárenia rezortu bolo zastavenie výroby v Smurfit Kappa Štúrovo, a. s. v marci 2010. Okrem poklesu výroby v roku 2010, bol výrazne znížený aj export, pretože takmer celá výroba štúrovskej prevádzky bola zameraná na vývoz.
Odstavenie výroby flutingu v Štúrove, ako najväčšieho spracovateľa zberového papiera na Slovensku, tiež silne zasiahlo trh so zberovým papierom. Nadbytočným na trhu sa stal nespracovaný zberový papier druhu OCC, ktorý tvoria vlnité lepenky a sulfátový papier, ktorého hlavným spracovateľom bola výroba flutingu.
Po poklese v rokoch 2008 – 2010 sa zber papiera stabilizoval, na úroveň cca 100 tis. ton. V súčasnosti sú na Slovensku len dvaja odberatelia zberového papiera pre svoju výrobu a to firmy SHP, a. s. Harmanec a Metsä Tissue Slovakia, s. r. o. Žilina. Produkcia obidvoch spoločností je orientovaná na výrobu hygienických papierov, preto je posilnená hlavne spotreba zberových papierov vyšších kvalitatívnych tried (3.14., 3.15. a 3.18).
Obr. 2: Vývoj spotreby v spoločnostiach ZCPP SR od roku 2000.
Obr. 3: Vývoj rozhodujúcich ukazovatelov v spoločnostiach ZCPP SR.
Zbornik1_PA2014_10.indd 29Zbornik1_PA2014_10.indd 29 25. 2. 2014 12:11:1225. 2. 2014 12:11:12

30 Wood, Pulp and Paper 2014
Z obrázku 7 je zrejmé, že spotreba zmiešaných sortimentov zberového papiera a zberu vlnitých lepeniek a sulfátových papierov slovenským celulózo-papieren-ským priemyslom dosahuje od roku 2010 takmer nulové hodnoty. Na dobrej úrovni sa udržuje spotreba zberového papiera v kvalitnejších sortimentoch, ako je papier a časopisové papiere vyššej kvality. Silné investície do rezortu, ktoré od roku 1993 do roku 2007 dosiahli takmer 40 mld. EUR, pomohli firmám, Zväzu celulózo-papie-renského priemyslu SR, lepšie prekonávať obdobie spojené s ekonomickou krízou.
Kľúčové investície podnikov organizovaných v ZCPP SR boli v posledných dvoch dekádach nasledovné:
Obr. 4: Počet papierenských strojov a ich priemerná ročná výroba.
Obr. 5: Vývoj počtu pravovníkov, miezd a prodkuktivity od roku 2000 = 100.
MONDI SCP
− Investičný projekt Impuls. 200 mil. EUR do rozšírenia výroby a OŽP a 135 mil. EUR investícia do výroby buničiny na výmenu kotla.
METSÄ TISSUE SLOVAKIA, s. r. o., Žilina
− PS1 twin-wire, yankee dryer Inštalácia: 1983 rekonštrukcia: 2008 − Hlavná rekonštrukcia: 2006 max. rýchlosť: 1 850 m/min − Kapacita: 30 000 t/r. Dodávateľ: Andritz AG, Escher – Wyss − PS2 twin.wire, Periformer, Inštalácia – 1994, celkové náklady spolu s linkou zbe-
rového papiera 100 mil. EUR, Rýchlosť 1 800 m/min., kapacita 54 000 t/r.
Zbornik1_PA2014_10.indd 30Zbornik1_PA2014_10.indd 30 25. 2. 2014 12:11:1225. 2. 2014 12:11:12

Wood, Pulp and Paper 2014 31
SHP HARMANECKÉ PAPIERNE
− Príprava látky: 2 rozvlákňovače, kapacita: 61 000 t/r inštalácia 1972, 1994 − PS 7 Yankee dryer – inštalácia v roku 1972, rekonštrukcia v roku 2009 − Previnovacie zariadenie 1 – inštalácia v roku 1995, kapacita 40 000 t/r − Energetika – 2 kotle – inštalácia v rokoch 2001, 2002, kapacita 24 t/h
Obr. 7: Spotreba ZP podľa druhov v spoloč-nostiach ZCPP SR.
Obr. 6: Vývoj zberu, spotreby papiera a ná-vratnosti zberového papiera.
BUKÓZA HOLDING
− Linka bielenia – inštalovaná v roku 1978 – rekonštruovaná v roku 2001 na postup C/DEpDHD Investícia: 30 mil. EUR
− Rozšírenie výroby buničiny zo 100 na 160 tis. ton − Rekonštrukcia turbín na výrobu energie, zvýšenie výkonu z 25 na 45 MW – 2011,
výmena starých uhoľných kotlov na spaľovanie biomasy – energetická se-bestačnosť, investícia 2 mil. EUR, inštalácia v roku 2010, kapacita: 210 tis. ton biomasy a 70 tis. ton odpadu, celková investícia 18 mil. EUR
SHP SLAVOŠOVSKÉ PAPIERNE
− Papierenský stroj PS 8 Yankee dryer – rekonštrukcia: 2002, Šírka: 3,6 m, max. rýchlosť: 1500 m/min., kapacita 20 000 t/r,
− Rezačky 8: inštalácia 2004, 2005, 2007, 2010, 2011 − linka na výrobu papierových kuchynských utierok v hodnote 160 mil. Sk − inštalácia v roku 2007, kapacita 8 300 t/rok − Energetika: kotol, inštalácia v roku 2000
Poďakovanie
Ďakujeme členským organizáciám Zväzu celulózo-papierenského priemyslu SR za poskytnutie informácií k prednáške.
Zbornik1_PA2014_10.indd 31Zbornik1_PA2014_10.indd 31 25. 2. 2014 12:11:1225. 2. 2014 12:11:12

32 Wood, Pulp and Paper 2014
3. Literatúra1. Výbošťoková, G., Dlhopolček, J. (2012) Celulózopapierenský priemysel SR v roku 2012,
Štatistické informácie ZCPP SR.2. Boháček, Š. (2001) Integrácia procesov ako základ prosperity, Prednáška, Medzinárodná
konferencia „Buničina a papier – technológie, vlastnosti, životné prostredie“, Bratislava, Zborník, s. 11 – 15, 2001.
3. Boháček, Š., Cripps, H. C., Hallas, P., Jančiak, D., Klemeš, J. (1996) Total Site Analysis for Energy Saving and Pollution Reduction in Pulp and Paper Industry, Presentation 1072, International CHISA Conference, Prague, 1996.
4. Boháček, Š. (1998) Úloha VÚPC: Zvyšovanie konkurencieschopnosti klientov – producen-tov celulózy a papiera, Prednáška, Konferencia „Chemická technológia dreva celulózy a papiera“, 23. – 25. 6. 1998, Bratislava, Zborník, s. 40 – 48.
5. Výbošťoková, G., Dlhopolček, J. (2011) Celulózopapierenský priemysel SR v roku 2011, Štatistické informácie ZCPP SR.
6. Russ, A., Schwartz, J., Boháček, Š., Lübke, H., Ihnát, V., Pažitný, A., (2013) Reuse of old corrugated cardboard in constructional and thermal insulating boards. Wood Research 58(3): 505 – 510, ISSN 1336-4561.
Zbornik1_PA2014_10.indd 32Zbornik1_PA2014_10.indd 32 25. 2. 2014 12:11:1225. 2. 2014 12:11:12
Polygrafi a Academica
2014
WPP PA
Zbornik1_PA2014_10.indd 33Zbornik1_PA2014_10.indd 33 25. 2. 2014 12:11:1225. 2. 2014 12:11:12
34 Polygrafi a Academica 2014
Color Science Behind Inks in CMYK
vs. Extended Color Gamut
vs. Spot/Pantone Ink Sets
Veronika Lovell
Sun Chemical Corporation – 1701 Westinghouse Blvd, Charlotte, NC 28273, [email protected]
Abstract: In the world of spectral color measurements and colorimetrically based quality control tools the emphasis is given to the requirements for new technologies in all types of printing ink sets. Whether we are talking CIELAB based G7 methodology for process CMYK colors or proper color gamut coverage of 6 or 7 ink sets for extended color gamut process or simply getting the best color match to the Pantone’s PMS 485C using fl exographic solvent inks on a clear fi lm backed by white, the challenges are enormous. This talk will attempt to bring light to the color technologies and science behind the color ventures within the vastly diversifi ed ink industry.
Keywords: Color, Inks, CMYK, Extended Color Gamut, Spot/Pantone
1. Introduction
Michael Sullivan writes that “the earliest color printing known in China, and indeed in the whole world, is a two-color frontispiece to a Buddhist sutra scroll”, dated 1346 [1].
Modern color printing process is based on subtractive color theory where mostly process transparent color inks Cyan (C), Magenta (M), Yellow (Y) and Black (K) are used as opposed to simpler black and white or monochrome printing. By overprinting these inks gives all other color combinations can be reached [2].
New emerging methods of extended color gamut (ECG) printing have been noticeable lately. These can be six or seven-color process ink sets (an example is Pantone’s Hexachrome system) which can add orange, violet and green ink to the traditional CMYK set for a larger and more vibrant gamut coverage.
Custom or spot colors are manufactured by pre-mixing the colorants to attain certain color renditions. Generally, the spot color inks are more opaque as opposed to the process colors [3]. Use of spot colors gives advantages over process colors for brand building and specialty job printing [4].
Due to the advancement in printing technologies, it is possible to print spot color short run jobs with high quality and desired level of consistency in color at low cost [5]. Mostly in the packaging industry, specifi c color is used for a specifi c requirement of a customer, which is called a spot color [6]. About 40 % of packaging
Pozvaná prednáška Invited lecture
Zbornik1_PA2014_10.indd 34Zbornik1_PA2014_10.indd 34 25. 2. 2014 12:11:1225. 2. 2014 12:11:12

Polygrafi a Academica 2014 35
jobs are printed fl exo, 30 % off set lithography, 22 % rotogravure and 8 % by digital and other printing processes [7].
New trends and instrumentation in color quality control areas emerge nowadays and make the process of color control more challenging not only for the ink manufacturers but also for the pre-press and press room operators.
2. Colorimetry in Ink Sets
2.1 Colorimetry in Process Inks Sets
In the past the simple CMYK or four color printing process was simply controlled by densitometry where instruments measured only the strength or ink fi lm thickness of the ink laid down on a substrate. The densitometers were simple instruments that measured light transmitted back to the sensor and by applying the proper fi lter for either Cyan or Magenta or Yellow ink they reported the number and once the number was in the specifi cation range the proof was good. The well-known specifi cation ISO 12647 (Process control for the production of half-tone colour separations, proof and production prints) [8] defi ned the density aims and dot gain for these inks, which must be printed at specifi ed fi lm weight, with pre-determined colorant concentration and usually requires high precision proofi ng.
With the introduction of spectrophotometers and colorimeters the process of color control got little more sophisticated. These instruments measure the full visible spectrum and derive either Tristimulus values or CIELAB values for specifi c
Fig. 1: Typical G7 Form for Press Calibration.
Zbornik1_PA2014_10.indd 35Zbornik1_PA2014_10.indd 35 25. 2. 2014 12:11:1225. 2. 2014 12:11:12

36 Polygrafi a Academica 2014
illuminant and standard observer combination. Some of the newer instruments can have standards saved in databases and report color diff erences in terms of Delta E straight on the panel of the instrument. All of the manufacturers also make sure that they develop software that would connect the instrument to a computer and very refi ned reports can be generated in these instances.
This new way of color measurements open ways to widen the specifi cation and include references for printing as CIELAB values and tolerances reported in diff erences in Hue values or Delta E values. This is a base for IDEAlliance GRACoL’s G7 methodology for controlling of process color printing [9]. Although these recommendations are intended to improve the visual output they do not intend to eliminate process control best practices based on TVI curves and dot gain as defi ned in the ISO 12647-2 standard. Well defi ned press forms are designed to comply with the G7 recommendations.
The G7 methodoly was established for off set printing but in recent years the fl exographic industry has been working with IDEAlliance on the adoption of the technology. The other colorimtrically based specifi cation for ink control was defi ned by Flexographic Technical Association (FTA) and published as the Flexographic Image Reproduction Specifi cations & Tolerances (FIRST) [10].
2.2. Colorimetry in Extended Color Gamut Inks Sets
Multicolor presses are able to deliver more vivid imagery than presses with lower amount of stations. This is allowing for more usable pigments leading to diff erent special eff ects, brand, logo, or Pantone Matching System (PMS) inks, which provide enriched design, but at the same time do not need to be specially blended by an ink manufacturer.
Benefi t of using extended gamut is that such system can better reproduce brand colors, and at the same time to reduce the inventory of spot color inks [11]. Make-ready times are shorter, because each job uses the same ink set and there is no need for proofi ng of spot colors. Such trend is in use by Hexachrome, employing six diff erent inks, Pantone six color patented process, or by Opaltone®, employing seven diff erent colors, CMYK + RGB, cyan, magenta yellow, black and additive primaries red, green, and blue [12].
The fi nal performance of the ink sets will be dependent on many of the factors involved and all the variables should play a crucial part in the outcome. The colorimetric values for each ink, transparency/opacity of the inks and trapping will dictate the proper ink sequence, which can then lead to even larger enhancement of the color gamut of a specifi c ink set. Most of the extended ink sets varies individually based upon gamut and the integration of colors into a workfl ow. ECG ink sets can cover diff erent areas of the color gamut space and thus they are susually altered to suite the colorimetric requiremnets of the printing jobs. Figure 2 illustrates various gamut projections of the ECG ink sets.
Many of the world’s noticeable consumer product companies, like P&G and Printpack, are showing serious interest in this technology. FTA and also IDEAlliance,
Zbornik1_PA2014_10.indd 36Zbornik1_PA2014_10.indd 36 25. 2. 2014 12:11:1225. 2. 2014 12:11:12

Polygrafi a Academica 2014 37
for fl exographic and off set inks, are looking to standardize the pigments used in the extended gamut ink sets.
2.3. Colorimetry in Spot Color /Pantone Inks Sets
A spot color is a specially mixed ink using 1–4 base colors to achieve the desired colorimetric appearance. Examples of spot colors are: Coca Cola Red, McDonalds Yellow, Kellogg’s Cheerios Yellow, Lufthansa Blue and thousands and thousands more. Some specialty inks such as metallics and fl uorescent are also considered to be spot color, but usually they are referred to as special and brand colors. It is possible to mix two or more spot colors to create further colors with interesting eff ects. This practice is employed in the 2 color duotones or tritones. Also use of tints of a spot color have been introduced to get the appearance without the expense of additional inks. The use of the base Pantone colors is also possible in the printing process, such as Refl ex Blue, used very often as a special spot color.
There are diff erent types of spot color inks systems, in the United States, the dominant spot color printing system is PANTONE. The Pantone Matching System or PMS consists of over 1,500 colors of ink. The special ink is then referred to as the PMS number, e.g. PMS 485C refers to Coke red. Many brand owner companies have established their own internal libraries of colors. Other spot color systems include TOYO, DIC, and ANPA.
In the past, in order to communicate the spot color requirements, the PMS number or color swatch was exchanged between the printer and ink manufacturer.
Fig. 2: Comparison of Diff erent ECG Color Gamuts.
Zbornik1_PA2014_10.indd 37Zbornik1_PA2014_10.indd 37 25. 2. 2014 12:11:1225. 2. 2014 12:11:12
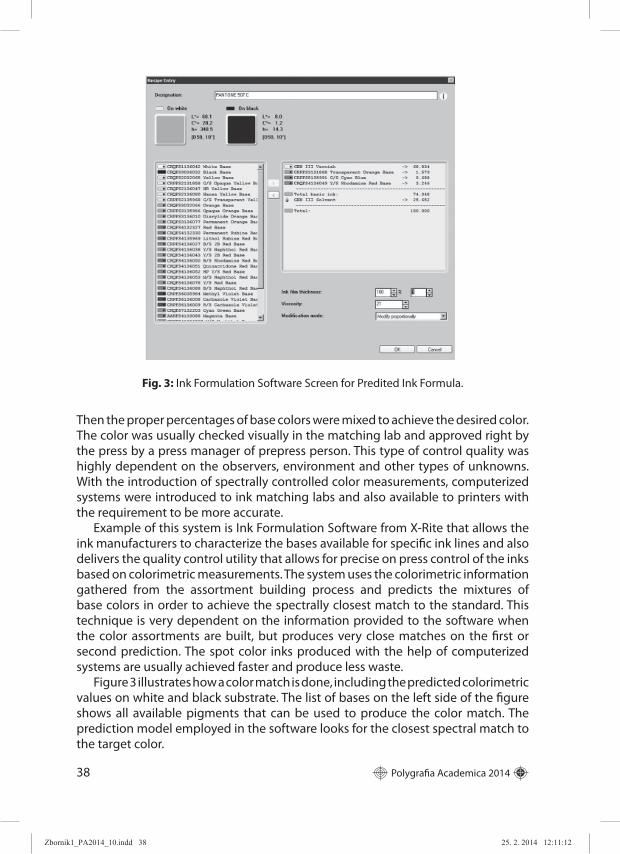
38 Polygrafi a Academica 2014
Then the proper percentages of base colors were mixed to achieve the desired color. The color was usually checked visually in the matching lab and approved right by the press by a press manager of prepress person. This type of control quality was highly dependent on the observers, environment and other types of unknowns. With the introduction of spectrally controlled color measurements, computerized systems were introduced to ink matching labs and also available to printers with the requirement to be more accurate.
Example of this system is Ink Formulation Software from X-Rite that allows the ink manufacturers to characterize the bases available for specifi c ink lines and also delivers the quality control utility that allows for precise on press control of the inks based on colorimetric measurements. The system uses the colorimetric information gathered from the assortment building process and predicts the mixtures of base colors in order to achieve the spectrally closest match to the standard. This technique is very dependent on the information provided to the software when the color assortments are built, but produces very close matches on the fi rst or second prediction. The spot color inks produced with the help of computerized systems are usually achieved faster and produce less waste.
Figure 3 illustrates how a color match is done, including the predicted colorimetric values on white and black substrate. The list of bases on the left side of the fi gure shows all available pigments that can be used to produce the color match. The prediction model employed in the software looks for the closest spectral match to the target color.
Fig. 3: Ink Formulation Software Screen for Predited Ink Formula.
Zbornik1_PA2014_10.indd 38Zbornik1_PA2014_10.indd 38 25. 2. 2014 12:11:1225. 2. 2014 12:11:12

Polygrafi a Academica 2014 39
3. Literature
1. Sullivan, M., The Arts of China (Third ed.), University of California Press, 1984, p. 203.
2. Fraser, B., Murphy, C. and Bunting, F., Real World Color Management, First Edition, Editors Place, 2003, 19–20 pp.
3. Prakhya, H. Visual Agreement of Spot Color Overprints as Displayed and as Printed, Master’s Thesis, RIT, NewYork March 2008.
4. Chung, R., Riordan, M., Prakhya, H., Predictability of Spot Color Overprints, Proceedings of the 35th IARIGAI Research Conference, Valencia, Spain, September 2008.
5. Sangmule, S. L., Fleming, P. D., and Pekarovicova. A, Lovell, V., Digital proofi ng of spot colors for Flexo packaging, Proceedings of 62th TAGA Annual Technical Conference, March 2010, San Diego.
6. Wu, Y. J., Suchy, M, Fleming, P. D., & Pekarovicova, A., Digital Proofi ng of Spot Color Printing, Proceedings of the 58th TAGA Annual Technical Conference, March 2006.
7. Pekarovicova A., (2007), Emerging Pigment Dispersion Technologies, IntertechPira, Leatherhead, UK, 1st Ed., 17 pp.
8. http://www.iso.org/iso/home/store/catalogue_tc/catalogue_detail.htm?csnumber=57816
9. http://www.idealliance.org/specifi cations/gracol/specifi cation 10. http://www.fl exography.org/04Education/fi rst.html 11. Tolliver-Nigro H., (A) Going beyond the benefi ts of fl exo: Extended gamut inks, Ink
Maker, 85, (5), June 2007, 14–16. 12. Osmond P. K., Buystedt M., Printing beyond CMYK, Flexo 30, 4, 2005, 62–64.
Zbornik1_PA2014_10.indd 39Zbornik1_PA2014_10.indd 39 25. 2. 2014 12:11:1225. 2. 2014 12:11:12

40 Polygrafi a Academica 2014
Nové technológie vyvracajú mýty
o inkjetovej tlači
Peter Mračna
Fujifi lm Europe GmbH – organizačná zložka,Rybničná 40, 831 06 Bratislava,
e-mail: peter.mracna@fujifi lm.sk
Abstrakt: Ever since Gutenberg pioneered the very fi rst presses, printing has progressed in major ways. Yet the majority of commercial print produced today is based on the same principles as those pioneered so many years ago. It’s been a great run. A long run. But the introduction of the Jet Press 720 marks the beginning of an entirely new area. Print buyers need the benefi ts that digital printing can bring now more than ever. Short runs, fast turnarounds and print-on-demand are all standard requirements in today’s fast moving world. But digital printing is still not used for many applications. With the arrival of Jet Press 720, this is set to change.
Kľúčové slová: inkjetová tlač, farebný gamut, tlačové hlavy, MicroV technológia, Jet Press 720
Úvod
Rozvoj nových inkjetových technológií postupne vyvracia staré a dlho platné mýty o inkjetovej tlači.
Spomeňme ich postupne:Komerčný digitálny inkjet nie je alternatívou ofsetu1. Komerčný digitálny inkjet nedosahuje ofsetovú kvalitu tlače2. Digitálne tlačiarne nie sú schopné tlačiť podľa ISO – 12647-2 ofset normy3. Na trhu nie je B2 digitálny inkjet, ktorý kombinuje ultra vysokú kvalitu a varia-4. bilné dáta tlačeKvalita výstupu inkjetových rotačiek obmedzuje ich použitie pre štvorfarebnú 5. tlačAktuálne workfl ow systémy nie sú schopné efektívne riadiť tlač ofsetovej a digi-6. tálnej produkcie
Zdá sa vám že všetky tieto mýty sú stále platné? Skúsme ich postupne vyvrátiť. Fujifi lm v minulých 20 rokoch značne investoval do vývoja inkjetových technológií. Využil svoje patenty z fotografi ckej oblasti, ktorá sa v tých rokoch tiež postupne digitalizovala. Kvalitný výtlačok sa nedosiahne bez kvalitného atramentu, tlačovej hlavy a bez schopnosti riadiť zasychanie a nanášanie čo najmenšej, ale na pigment bohatej kvapky atramentu.
Zbornik1_PA2014_10.indd 40Zbornik1_PA2014_10.indd 40 25. 2. 2014 12:11:1325. 2. 2014 12:11:13

Polygrafi a Academica 2014 41
1. Vývoj atramentov
1.1. Micro V technológia
Farba je pre atrament najdôležitejší aspekt. Tlačiar potrebuje verne reprodu-kovať celú farebnú škálu i jednotlivé farby. Cesta k výrobe takéhoto atramentu je jednoduchá. Stačí pridať viac pigmentu... ale kvapky atramentu padajúce na potláčaný povrch musia byť mikroskopické. Každá atramentová hlava obsahuje stovky mikroskopických trysiek ktoré sa nesmú zapchať, lebo v lepšom prípade znížia kvalitu obrazu, v horšom znehodnotia tlačovú hlavu. Pokiaľ má atrament ria-dene prejsť cez tlačové trysky aj jeho viskozita musí byť nízka. Farebné pigmenty majú prirodzenú vlastnosť zhlukovať sa, čo podporuje aj požadovaná nízka visko-zita atramentu. V neposlednom rade na atrament padajúci na potláčaný povrch pôsobí i gravitačná sila. Na technologické zvládnutiu týchto protikladov vyvinul Fujifi lm unikátnu MikroV technológiu výroby atramentov. Pigmenty v atramente sa aj napriek vysokej koncentrácii a viskozite nezhlukujú a zostávajú rovnomerne rozptýlené v atramente. Odolávajú i pôsobeniu gravitácie a neusadzujú sa. Každá čiastočka pigmentu je obalená disperznou vrstvou, ktorá zabraňuje jej usadzova-niu a zhlukovaniu. Spojenie medzi pigmentom a rozpúšťadlom zabezpečuje mole-kulárne spojivo. V takejto MicroV disperzii majú čiastočky pigmentu veľkosť zhruba od najmenšieho zrnka soli po veľkosť menšiu ako ľudská bunka – 200 nm.
Obr. 1: MikroV technológia.
1.2. Primer
Kvapka atramentu je po dopade na povrch potlačeného materiálu absorbovaná potláčaným materiálom. Adhézia kvapky na povrchu je ovplyvnená mnohými faktor-mi. Ako zabezpečiť, aby sa kvapka na povrchu nerozpíjala, či aby sa jednotlivé kvapky nespájali a netvorili príliš veľký zhluk atramentu na papieri či inom potláčanom povr-chu? Pokiaľ nezostanú v polohe, ktorá je im z tlačovej formy určená, môžeme sa roz-lúčiť s jemnými detailmi, ktoré chceme, aby na výtlačku ostali zachované. Výrobcovia inkjetových tlačiarní to riešili výrobou špeciálnych papierov určených na potlač v týchto zariadeniach. Papiere sú oproti ofsetovým drahšie, nedajú sa dobre recyklovať a stavajú inkjet do pozície podradnej technológie. Fujifi lm to vyriešil trocha inak. Pred samotnou potlačou je papier ovrstvený látkou , ktorá zaručuje to, že kvapky atra-
Zbornik1_PA2014_10.indd 41Zbornik1_PA2014_10.indd 41 25. 2. 2014 12:11:1325. 2. 2014 12:11:13

42 Polygrafi a Academica 2014
mentu zostanú v tej polohe, v akej na papier dopadli a aj v dostatočnej miere prenikli do povrchu papiera. Zároveň je možné papier bez problémov recyklovať. Túto látku nazvali Rapid coagulation primer. Nanáša sa pomocou aniloxového valca.
Obr. 2: Porovnanie 20 % rastra (magenta).
1.3. Tlačové hlavy
Sú najdôležitejšou časťou inkjetovej tlačiarne. Musia zabezpečiť opakovane pres-nú reprodukciu originálu, neochudobnenú o jemné detaily v rozlíšení primeranom použitiu výtlačku. Mnohé zariadenia ponúkajú jednotnú veľkosť kvapky. Tlačové hlavy Samba, od Fujifi lm Dimatix využívajú premenlivú veľkosť kvapky. Zariadenia používajúce tieto tlačové hlavy sú schopné tlačiť s kvapkou veľkou 2 pikolitre. Počet trysiek v jednej hlave sa mení, rovnako ako počet tlačových hláv v jednotlivých zaria-deniach podľa ich použitia. Atrament v hlavách je udržiavaný pri konštantnej teplote, aby si udržal rovnakú viskozitu a zabezpečil tak opakovateľnú reprodukciu.
Všetky tieto technológie boli použité pri výrobe prvého inkjetového tlačového stroja Jet Press 720.
Obr. 3: Tlačové hlavy Samba.
2. Jet Press 720
Základné technické parametre :rýchlosť tlače 2700 hárkov za hodinu• formát B2 (730 × 550 mm)• rozlíšenie 1200 × 1200 dpi• CMYK systém• variabilná veľkosť kvapky od 2 pl•
Zbornik1_PA2014_10.indd 42Zbornik1_PA2014_10.indd 42 25. 2. 2014 12:11:1325. 2. 2014 12:11:13

Polygrafi a Academica 2014 43
svetelná stálosť výtlačku ISO 12040• tlač podľa ISO 12647-7 (delta E3)• INGEDE test 98 bodov zo 100•
Jet Press 720 využíva rovnaký nakladač i vykladač papiera ako klasické ofsetové tlačové stroje. Po zavedení hárku do stroja je ovrstvený tenkou vrstvou RC primera. hárok je ďalej vedený špeciálnymi chytačmi papiera, ktoré zabezpečujú maximálnu presnosť posuvu a bezproblémový chod rôznych potláčaných papierov. Po nanesení primeru je hárok prenesený na obrazový valec, kde je podržaný chytačmi a vákuom. V tom okamihu sa aktivujú 4 CMYK tlačové rady s tlačovými hlavami SAMBA. Každá tlačová rada je tvorená 17-timi tlačovými hlavami. Každá hlava má 2048 tlačových trysiek. Celá tlačová hlava tak má 34816 tlačových trysiek. Hárok je potlačený všetký-mi hlavami pri jednom prechode. Po tlači je hárok vedený do sušiacej časti. Samotné sušenie prebieha teplom a vzduchom. Táto kombinácia zaručuje, že hárok je vo vykla-dači dokonale suchý a vhodný na ďalšie spracovanie. Kombinácia dvoch technológií sušenia minimalizuje deformovanie hárku ktoré býva spôsobené teplotnými šokmi a rýchlou nerovnomernou zmenou vlhkosti vo vnútri papiera. Pri výstupe je potlačený hárok skenovaný pomocou inline senzorov. Výsledok každého skenovania je porov-naný s digitálnou tlačovou formou a v prípade potreby je v reálnom čase realizovaná korekcia pomocou softvérových nástrojov. Po skenovaní prechádza hárok do vykla-dača zhodného s vykladačom používaným u ofsetových tlačových strojov.
2.1. Farebný gamut
Obr. 4: Porovnanie farebného gamutu Jet Pressu 720 s CMYK Fogra 39L.
Zbornik1_PA2014_10.indd 43Zbornik1_PA2014_10.indd 43 25. 2. 2014 12:11:1325. 2. 2014 12:11:13

44 Polygrafi a Academica 2014
Za vysokou kvalitou tlače stoja nové tlačové atramenty VIVIDIA. Sú výsledkom dlhého vývoja CMYK atramentov. Široký farebný gamut sa dosahuje na klasických materiáloch používaných v polygrafi i.
2.2. Riadenie tlačového procesu
Celý proces tlače je riadený novým Fujifi lm XMF workfl ow. Súčasná verzia 5.5 ponúka výhody Adobe škály s použitím Mercury RIP architektúry. Toto workfl ow dokáže spracovávať dáta bohaté na informácie vo vysokom rozlíšení a objemovo náročné. V kombinácii s on line job riadením, podporou web2print funkcie a online správou farieb, predstavuje XMF workfl ow budúcnosti. Variabilné dáta sú samo-zrejmosťou. XMF je schopné efektívne riadiť ofsetovú i inkjetovú tlač súčasne.
2.3. Verzie Jet Press
V súčasnosti sa Jet Press vyrába v troch rôznych verziách.Jet Press 720 je určený k tlači klasických polygrafi ckých zákaziek s hodinovou
rýchlosťou 2700 hárkov B2. Je schopný tlačiť so širším farebným gamutom ako of-set, s kvalitou tlače vyššou ako ofset.
Jet Press F je určený na tlač obalových materiálov vo formáte B2. Po skenovaní je v stroji zaradená lakovacia jednotka s možnosťou parciálneho lakovania.
Jet Press W je rotačná verzia predchádzajúcich tlačových strojov s maximálnou šírkou tlače 541 mm so štandardne voliteľným rozlíšením 600 × 600 dpi, alebo 600 × 480 dpi. Obidve rozlíšenia sú však upgradovateľné až na 1200 × 1200 dpi. Rýchlosť tlače sa pohybuje od 100 m za minútu až po 127 m za minútu v závislosti od rozlíšenia.
Obr. 5: Jet Press 720.
Zbornik1_PA2014_10.indd 44Zbornik1_PA2014_10.indd 44 25. 2. 2014 12:11:1325. 2. 2014 12:11:13

Polygrafi a Academica 2014 45
Obr. 6: Jet Press W.
Záver
Na záver odpovede na v úvode konštatované mýty o inkjetovej tlači.Komerčný digitálny inkjet nie je alternatívou ofsetu. V zákazkách do 2500 hár-1. kov je digitálna inkjetová tlač alternatívou ofsetuKomerčný digitálny inkjet nedosahuje ofsetovú kvalitu tlače. I tu sa musí konšta-2. tovať, že Jett Press 720 dosahuje kvalitu lepšiu ako ofset.Digitálne tlačiarne nie sú schopné tlačiť podľa ISO – 12647-2 ofset normy. Jett 3. Pres 720 i Jett Press F spĺňajú potrebné parametre.Na trhu nie je B2 digitálny inkjet, ktorý kombinuje ultra vysokú kvalitu a varia-4. bilné dáta tlače. I tento mýtus padol, všetky tri Jett Pressy ponúkajú tlač varia-bilných dát.Kvalita výstupu inkjetových rotačiek obmedzuje ich použitie pre štvorfarebnú 5. tlač. Jett Press W i pri použití nižšieho rozlíšenia je vhodný na tlač štvorfarebných zákaziek.Aktuálne workfl ow systémy nie sú schopné efektívne riadiť tlač ofsetovej a di-6. gitálnej produkcie. XMF workfl ow dokáže súčasne efektívne riadiť obe tlačové technológie.
3. Literatúra
1. Firemné dokumentácie spoločnosti Fujifi lm Europe GmbH.
Zbornik1_PA2014_10.indd 45Zbornik1_PA2014_10.indd 45 25. 2. 2014 12:11:1325. 2. 2014 12:11:13

46 Polygrafi a Academica 2014
Materiálový tisk nebo 3D tisk?
Michal Veselý, Petr Dzik
Fakulta chemická VUT v Brně, Purkyňova 118, 621 00 Brno,[email protected]
Abstract: Material printing means a selective coating of functional material on a surface, making patterns and also making structured objects with signifi cant all dimensions. This technology was fi rstly applied in sixties as a screen printed silver paste forming the conductive lines for electronics. At the end of eighties came a stereolithography and when new technologies as a selective laser sintering and fused deposition modelling were introduced at the beginning of millennium, they were called as 3D printing. The principles and common features of these technologies will be presented.
Keywords: 3D printing, material printing
1. Materiálový tisk
Společným rysem klasických tiskových technologií i moderního digitálního tis-ku je schopnost vzorování, tedy selektivního nanášení barvy nebo inkoustu na po-žadované místo potiskovaného média. Když je tedy možné nanést barvu v požado-vané vzorované tenké vrstvě, proč by nebylo možné nanést stejným způsobem jiný materiál, který bude mít zcela jiné užitné vlastnosti, jako například funkci fi ltrační, bariérovou, katalytickou, elektroluminiscenční, fotovoltaickou a mnoho jiných? Od této myšlenky byl jen krůček k technickým realizacím – využití klasických technolo-gií tisku pro nanášení materiálů, tedy k materiálovému tisku.
Ke slovu se tak dostaly všechny klasické tiskové techniky od sítotisku přes fl exotisk k bezvodému ofsetu a hlubotisku k inkjetovému tisku. Typickým ry-sem klasických tiskových technik v materiálovém tisku je vytváření předev ším tenkých plošných struktur s případným opakovaným nanášením dalších vrstev, vytvářejících objekty s výškou jednotek až desítek mikrometrů, ale nikdy nepře-kračujících výšku objektů 1 mm. Inkjetový tisk tvoří speciální sku pinu technik, kde výška tištěných vrstev bývá v širokém rozmezí 10 nm až 1000 μm při opako-vaném tisku.
Novým trendem materiálového tisku je spojování různých tiskových agregátů do jedné linky, umožňující tak při jednom průchodu, případně při opakovaných průchodech potiskovaného materiálu nanést strukturované vrstvy různých materi-álů o významně rozdílných tloušťkách. Klasické tiskové technologie tu bývají dopl-ňované speciálními technikami známými z oblasti plošného ovrstvování. Používají se tak agregáty hlubotiskové, fl exotiskové a rotační sítotiskové v kombinaci ovrst-vovacími technikami štěrbinovými (slot die), nožového nanášení a válcového na-
Pozvaná prednáška Invited lecture
Zbornik1_PA2014_10.indd 46Zbornik1_PA2014_10.indd 46 25. 2. 2014 12:11:1325. 2. 2014 12:11:13

Polygrafi a Academica 2014 47
nášení. Příkladem mohou být materálové tiskárny fi rem 3D-Micromac a Coatema. Zcela jistě se tedy jedná o selektivní nanášení materiálů, tedy o materi álový tisk. Ale jak je to s tzv. 3D tiskem?
Obr. 1: Materiálová tiskárna SmartCoater (Coatema)instalovaná na Fakultě chemické VUT v Brně.
Obr. 2: Materiálová tiskárna Fuji Dimatix 2830instalovaná na Fakultě chemické VUT v Brně.
Zbornik1_PA2014_10.indd 47Zbornik1_PA2014_10.indd 47 25. 2. 2014 12:11:1325. 2. 2014 12:11:13

48 Polygrafi a Academica 2014
2. 3D tisk
Relativně mladé tiskové techniky 3D tisku vytvářejí třírozměrné objekty se všemi rozměry porovnatelnými a vžily se pro ně anglické názvy jako 3D printing, direct proto-typing nebo rapid prototyping. Všechna zařízení na výrobu 3D modelů pracují na prin-cipu rozložení počítačového modelu do tenkých vrstev a jejich následném sestavení do reálného modelu v pracov ním prostoru tiskárny. Model je stavěn na základní des-ce, která po dokončení každé vrstvy poklesne dolů právě o tloušťku této vrstvy [1].
V podstatě je možné rozdělit tyto technologie podle způsobů vytváření 3D struktury na tři typy: (1) sintrování práškových materiálů v tenké vrstvě, (2) vytvrzo-vání fotopolymerů, (3) nanášení tavenin. Každý typ má velké množství modifi kací.
2.1 Selektivní sintrování práškových materiálů
Sintrování prášků využívají technologie nazývané selective laser sintering (SLS). Jedná se o spékání práškového materiálu v tenké vrstvě asi 0,1 mm laserovým pa-prskem s širokým spektrem aplikací a spékaných materiálů od kovových částic přes částice oxidů kovů a karbidů kovů po částice organic kých polymerů velikosti od stovek nanometrů po jednotky mikrometrů. [4, 5, 6, 7]
SLS technologie používají různé spojovací mechanismy částic – sintrování tu-hých částic, vznik chemické vazby, nízkoteplotní spojování částic pomocí kapali-ny a jiné. Vznikly tak technologie jako ColorJet printing, QuickMetal™ Plaster Mold Casting a jiné. [10, 11]
Obr. 3: Schéma typického uspořádání SLS tiskárny [6].
2.2 Vytvrzování fotopolymeru
Původní a nejstarší 3D technologií z roku 1986 je stereolitografi e (SLA), selektivní vytvrzování tekutého kompozitu UV zářením. Povrch fotocitlivé pryskyřice je oza-řován UV zářením přesně defi novanými vzory CAD souboru. Vzniklé radikály fotoi-niciátoru způsobí polymerizaci tekuté pryskyřice a tvorbu tuhé fáze materiálu. Poté co je tenká vrstva zpolymerizovaná, stolek se posune o defi novný krok, aby mohla
Zbornik1_PA2014_10.indd 48Zbornik1_PA2014_10.indd 48 25. 2. 2014 12:11:1325. 2. 2014 12:11:13

Polygrafi a Academica 2014 49
pokračovat polymerizace další tenké vrstvy fotocitlivé pryskyřice. Proces přidávání tekuté pryskyřice a UV polymerizace pokračuje, dokud se 3D struktura nezkomple-tuje. Používají se dvě odlišné metody ozařování: (1) laserem a (2) digitální projekcí UV záření (DMD – mikrozrcátkový čip). [10, 12, 13, 14]
Příbuznou technologií je PolyJet printing, MultiJet Printing [10], Polyjet Matrix [15] – piezoelektrickými tiskovými hlavami vystřikovaný fotopolymer (směs mo-nomeru a prepolymerů) je vytvrzován pomocí UV lampy. Používají se dva staveb-ní materiály – modelovací a podpůrný. Tloušťka vytvrzované vrstvy je 0,016 mm a podpůrný materiál se odstraňuje tlakovou vodou, Vytvrzené výrobky mají kva-litní povrch. Je možná i kombinace tiskových „inkoustů“, tedy mísení fotopolyme-rů s cílem dosažení změny mechanických vlastností na různých částech výrobku.
Obr. 4: Schéma typického uspořádání stereolitografi cké laserové tiskárny (vlevo)a stereolitografi cké UV-DMD tiskárny [14, 17].
2.3 Nanášení taveniny
Technologie selektivního nanášení taveniny (FDM – Fused Deposition Modeling) představuje selektivní nanášení roztaveného materiálu v tenké vrstvě jednou nebo
Obr. 5: Schéma typické FDM tiskárny.
Zbornik1_PA2014_10.indd 49Zbornik1_PA2014_10.indd 49 25. 2. 2014 12:11:1325. 2. 2014 12:11:13

50 Polygrafi a Academica 2014
několika tryskami. Opět se používají dva stavební materiály – modelovací a pod-půrný. Modelovacím materiálem bývá nadpří klad ABS, polyamid, polykarbonát, polyethylén a polypropylén. Tloušťka vrstvy bývá přibližně 0,25 mm. Technologie se vyznačuje malým odpadem hrubou strukturou modelu a nerovným povrchem. Podpůrný materiál se odstraňuje manuálně, často jen vodou. [8, 16]
Otázka pro samotnou diskusi po přednášce je stále zřejmá: jak s poradí uni-verzitní pracoviště ČR a SR zabývající se tiskem s novou terminologií 3D tisku a materiálového tisku? Jak si poradí s názvy jednotlivých technologií? Jak na-zveme česky a slovensky technologie FDM, SLS a jiné současné 3D technologie? Skutečně jsme ochotní tento problém nechat na překladatelech a odbornících z jiných oborů?
Poděkování
Autoři děkují Technologické agentuře České republiky za podporu projek tem TA03010548.
3. Literatura
1. Chalupa M. Jaké možnosti dnes máte s 3D tiskárnami? Geobusiness, 2012, 1, 26 – 28. www.geobusiness.cz
2. http://www.coatema.de 3. http://www.3d-micromac.com 4. Williams J. M. Bone tissue engineering using polycaprolactone scaff olds fabricated via
selective laser sintering. Biomaterials (2005), 26 ,4817 – 4827. 5. Tan K. H. et al. Scaff old development using selective laser sintering of polyetheretherke-
tone–hydroxyapatite biocomposite blends. Biomaterials (2003), 24, 3115 – 3123. 6. Kruth J.-P. Binding mechanisms in selective laser sintering and selective laser melting.
Rapid Prototyping Journal (2005), 26 – 36. 7. Shuai C. Fabrication of porous polyvinyl alcohol scaff old for bone tissue engine-
ering via selective laser sintering. Biofabrication 5 (2013), 8 p., doi: 10.1088/1758-5082/5/1/015014.
8. Novakova-Marcincinova L. et al., Experimental Testing of Materials Used in Fused Deposition Modeling Rapid Prototyping Technology. Advanced Materials Research 2013, 740, 597 – 602.
9. http://www.dreams.me.vt.edu/Facility/LaserSintering/ 10. http://www.3dsystems.com 11. http://www.zcorp.com 12. http://www.custompartnet.com/wu/stereolithography 13. Crivello J. V. Photopolymer Materials and Processes for Advanced Technolo gies. Chem.
Mater. (2014), 26, 533 – 548. 14. Skoog S. A. Stereolithography in tissue engineering. J Mater Sci: Mater Med., DOI
10.1007/s10856-013-5107-y. 15. http://www.2objet.com 16. http://www.dimensionprinting.com 17. http://www.afgrow.net/ 18. http://gronkwena.wordpress.com/2013/04/18/3d-printer-basics/
Zbornik1_PA2014_10.indd 50Zbornik1_PA2014_10.indd 50 25. 2. 2014 12:11:1325. 2. 2014 12:11:13

Polygrafi a Academica 2014 51
Inkjet printability of poly(N-vinylpyrrolidone)-
stabilized polyaniline dispersions
Markéta Držková1, Nikola Peřinka1, Patrycja Bober2, Milena Hajná2, Tomáš Syrový1, Jaroslav Stejskal2, Yvan Bonnassieux3
1Department of Graphic Arts and Photophysics, Faculty of Chemical Technology,University of Pardubice, Studentská 95, 532 10 Pardubice, Czech Republic, [email protected]
2Institute of Macromolecular Chemistry, Academy of Sciences of the Czech Republic, Heyrovsky sq. 2, 162 06 Prague 6, Czech Republic
3LPICM, Ecole Polytechnique, CNRS, 91128 Palaiseau, France
1. Introduction
Currently, the printing of functional compounds and especially conducting polymers is becoming one of the key technologies to enable the large area and fl exible electronics. The reasons are low cost, easy processability and high throughput. To implement the printing, the conducting polymers must be adjusted into a form of inks with defi ned properties. With regards to the conducting polymers applied by means of printing, besides the polythiophene based systems (namely PEDOT:PSS), the polyaniline (PANI) is nowadays the second most often studied one. The main application of PANI-based materials in electronics consists in the fi eld of sensing [1–3]. Other applications, such as actuators and electrochromic devices, electromagnetic interference shielding and antistatic coatings have been also reported [4–7]. The each printing technique puts some specifi c requirements on the fi nal ink properties. Mainly the viscosity and surface tension must be adjusted. Here, we propose the use of water-based poly(N-vinylpyrrolidone)-stabilized polyaniline dispersions (PANI/PVP), which can be applied by printing techniques with diff erent requierements on physical properties (e.g. screen printing and inkjet printing). The printing of such dispersions with screen printing was already successfully proven [8, 9]. The change of the ink properties towards the other printing techniques (inkjet printing) can be controlled by the change of the reaction mixture composition during the dispersion preparation and its further modifi cation by means of additives. In this work, we report on the fi rst results of the preparation of inkjet printing formulations. Additionally, the PANI/PVP dispersions are easy to produce and show relatively high stability at ambient conditions [10]. These facts contribute to the large versatility of such dispersions and their potential for the future applications.
2. Experimental
The colloidal PANI/PVP dispersion was prepared by means of oxidative polymerization of aniline hydrochloride (ANI·HCl) in the presence of poly(N-
Zbornik1_PA2014_10.indd 51Zbornik1_PA2014_10.indd 51 25. 2. 2014 12:11:1325. 2. 2014 12:11:13

52 Polygrafi a Academica 2014
vinylpyrrolidone) (PVP), which was used as a polymer stabilizer. The ammonium peroxodisulfate [(NH4)2S2O4, APS] was applied to induce the oxidation process. The molar concentrations of ANI·HCl and APS were set to 0.2 mol dm–3 and 0.25 mol dm–3, respectively. The fi nal mass percentage of the PVP in the prepared dispersion was accounted to 2 %. To decrease the surface tension of the resulting dispersion, the polymerization mixture contained 50 wt. % of isopropyl alcohol (IPA). The typical particle size estimated by dynamic light scattering ranged from 310 to 340 nm. After the preparation, the low-molecular-weight reaction residues and by-products were removed by means of dialysis against 0.2 M HCl. For some formulations, the dispersion was modifi ed by the addition of either ethylene glycol (EG) and glycerol or surfactant (an anionic type, sodium 1,4-bis(2-ethylhexoxy)-1,4-dioxobutane-2-sulphonate, AOT). The dilution ratio (dispersion to distilled water) was 1:1 in case of the unmodifi ed dispersion and 1:3 in case of the modifi ed ones. Prior to the printing, all formulations were fi ltered using the 0.45 μm PVDF syringe fi lter.
Tab. 1: Varied parameters of studied inkjet-printed PANI/PVP samples.
Sample Substrate Dilution ratio AdditivesSubstrate heating
Numberof layers
A PET 1:1 50 °C 1B PET 1:1 50 °C 2C PET 1:1 no 1D PET 1:1 no 2E paper 1:1 no 1F PET 1:3 EG 6 %; Glycerol 0.3 % 50 °C 1G PET 1:3 EG 6 %; Glycerol 0.3 % no 1H PET 1:3 AOT 0.3 % no 1
The dispersions were printed on the fl exible PET foil (Melinex ST 504, thickness 175 μm) and on the common offi ce paper. The printing was carried out using the Dimatix DMP-2831 inkjet printer at ambient conditions. For the printing, the 10 pl printheads (21.4 μm nozzle diameter), 10 μm drop spacing, and the voltage of 25 V on each from 16 nozzles were used. The printhead temperature was kept constant at 28 °C. One or two layers were deposited; the infl uence of increased substrate temperature was examined as well. After the printing, the samples were annealed at 125 °C for 2 minutes on the hotplate. The overview of all studied samples is given in Tab. 1. A 9 mm square printed pattern consisted of 3 mm square solids in upper left, lower left, and lower right corners; the 3 mm square area in upper right corner was fi lled with horizontal and vertical lines shaped to Г (size decreasing in 0.75 mm steps, with nominal line width of 200, 100, 50, and 25 μm, respectively). Examples of prints on both substrates are shown in Fig. 1.
The prepared samples were characterized electrically by means of two point probe (Metriso 2000) and using optical transmission spectroscopy (Specord 210, measured wavelength range of 320–1100 nm; except the print on paper). Images
Zbornik1_PA2014_10.indd 52Zbornik1_PA2014_10.indd 52 25. 2. 2014 12:11:1325. 2. 2014 12:11:13

Polygrafi a Academica 2014 53
of the whole printed pattern were captured by Olympus E-PL3; optical microscopy images (Bresser Erudit DLX with Bresser MikroCam 5.0 MP) of the bottom end of the vertical line with nominal width of 50 μm were captured as well. All images were visually evaluated. For selected samples, the line widths and aggregates sizes were determined using image analysis. Further, thickness profi les and widths of selected features were characterized by mechanical profi lometry (Dektak XT).
3. Results and discussion
The Table 2 summarizes the values of main characteristics measured for studied samples.
Tab. 2: Determined parameters of studied inkjet-printed PANI/PVP samples: sheet resistance Rsq, resistance of 200 μm vertical (RV) and horizontal (RH) line, average increase of the line width determined by image analysis (Δwi) and profi lometry (Δwp), mean thickness in the centre of the line dc.
Sample Rsq [MΩ/sq] RV [MΩ] RH [MΩ] Δwi (μm) Δwp (μm) dc (nm)A 28 143 327 122 143 407B 39 93 42 – 266 697C 36 – 1,132 – – –D 400 – – – 172 965E 4,083 30,733 362,000 259 – –F 2,807 97 602 – – –G 1,730 – – – – –H 8,523 384,667 12,800 158 200 101
Fig. 1: Samples H (left) and E (right), captured by Olympus E-PL3.
Zbornik1_PA2014_10.indd 53Zbornik1_PA2014_10.indd 53 25. 2. 2014 12:11:1425. 2. 2014 12:11:14

54 Polygrafi a Academica 2014
3.1. Electrical measurements
The sheet resistance of the prepared PANI/PVP layer measured on the printed squares ranged from several tens to thousands of MΩ/sq. The sample E printed on the paper showed approximatelly 100 times higher sheet resistance than the corresponding one deposited on the PET foil (sample C). The sheet resistance in GΩ/sq was measured also for more diluted formulations. Comparing the infl uence of additives, the formulation with AOT resulted in better defi ned pattern, but the sheet resistance of the layer increased. The measured resistance of the widest printed line ranged from tens of MΩ to hundreds of GΩ. The resistance of lines was strongly infl uenced by various defects and inhomogeneities, without any clear dependence on line orientation. Diff erences due to the heating of the substrate and the varied number of layers are not obvious as well.
3.2. Optical transmission spectroscopy
The inkjet printed layers of PANI/PVP dispersion are not homogeneous, however, it was possible to measure and qualitatively evaluate optical transmission spectra of all studied samples printed on PET foil. Comparing the positions and relative intensities of peaks in the measured spectra with those published for conductive polyaniline emeraldine salt and corresponding base [11], the spectra of studied inkjet printed layers of PANI/PVP are close to the conductive form. The position of the maximum in IR was between 730 and 845 nm and the intensity ratio of the peak in UV to peaks in VIS and IR ranged between 1.0 and 1.2.
3.3. Optical images
The mean line widths determined using image analysis from images captured by Olympus E-PL3 were generally lower than the values determined by mechanical profi lometry (see Tab. 2), which is probably related to the segmentation threshold.
Considering the nozzle diameter, the optimal size of the particles should be below 200 nm. Based on dynamic light scattering results, the prepared dispersions consisted of particles nearly twice larger; nevertheless, they were still printable. After the fi ltration, the presence of the aggregates should be entirely exluded. However, optical micrographs showed that in all printed layers are present dark agglomerates with the size ranging above 10 μm. It is therefore obvious that these particles were formed after the printing, during the drying process.
3.4. Profi lometry
Based on the evaluation of the profi les scanned across the width of the lines, the thickness in the centre of printed layers ranged from 50 nm in case of narrow horizontal lines in sample H to nearly 2.6 μm in case of widest horizontal line in sample D. On average, the thickness in the centre was around 500 nm. Considering
Zbornik1_PA2014_10.indd 54Zbornik1_PA2014_10.indd 54 25. 2. 2014 12:11:1425. 2. 2014 12:11:14
Polygrafi a Academica 2014 55
the mean thickness through the entire width, the values ranged between 179 nm and 12 μm.
With respect to the patterning, the average increase of the line width was around 200 μm, ranging from 113 to 367 μm.
4. Conclusion
In this work, we have demostrated the inkjet printability of the PANI/PVP water-based dispersions. The prepared layers were conductive and structured. The sheet resistance down to 10 MΩ/sq was measured. The thickness of the layers can be partially controlled through the dispersion dilution. The resulting thickness of the printed lines scanned by mechanical profi lometry ranged from 50 nm to 12 μm. The minimal mean width of the printed lines of 150 μm was achieved. The prepared layers contained various defects and aggregates. The satellite drops represent another undesired factor. For the future work, the quality and repeatability of the print should be improved.
Acknowledgement
This work was supported by the Technology Agency of the Czech Republic (Project No. TE01020022). N. Peřinka kindly thanks for the support of the French Government Grant (File No. 792865C).
5. References
1. Jang, J., Ha, J., Cho, J. 2007. Fabrication of water-dispersible polyaniline-poly(4-styrene-sulfonate) nanoparticles for inkjet-printed chemical-sensor applications. In Advanced Materials, roč. 19, 2007, č. 13, s. 1772–1775.
2. Morrin, A., Wilbeer, F., Ngamna,O., Moulton, S. E., Killard, A. J., Wallace, G. G., Smyth, M. R. 2005. Novel biosensor fabrication methodology based on processable conducting polyaniline nanoparticles. In Electrochemistry Communications, roč. 7, 2005, č. 3, s. 317–322.
3. Sarfraz, J., Ihalainen, P., Maattanen, A., Peltonen, J., Linden, M. 2013. Printed hydrogen sulfi de gas sensor on paper substrate based on polyaniline composite, In Thin Solid Films, roč. 539, 2013, s. 621–628.
4. Spinks, G. M., Mottaghitalab, V., Bahrami-Saniani, M., Whitten, P. G., Wallace, G. G. 2006. Carbon-nanotube-reinforced polyaniline fi bers for high-strength artifi cial muscles, In Advanced Materials, roč. 18, 2006, č. 5, s. 637–640.
5. Sydorov, D., Duboriz, I., Pud, A. 2013. Poly(3-methylthiophene)-polyaniline couple spectroelectrochemistry revisited for the complementary red-green-blue electrochromic device, In Electrochimica Acta, roč. 106, 2013, s. 114–120.
6. Gupta, T. K., Singh, B. P., Mathur, R. B., Dhakate, S. R. 2014. Multi-walled carbon nanotube-graphene-polyaniline multiphase nanocomposite with superior electromagnetic shielding eff ectiveness, In Nanoscale, roč. 6, 2014, č. 2, s. 842–851.
7. Pramanik, S., Hazarika, J., Kumar, A., Karak, N. 2013. Castor Oil Based Hyperbranched Poly(ester amide)/Polyaniline Nanofi ber Nanocomposites as Antistatic Materials, In Industrial & Engineering Chemistry Research, roč. 52, 2013, č. 16, s. 5700–5707.
Zbornik1_PA2014_10.indd 55Zbornik1_PA2014_10.indd 55 25. 2. 2014 12:11:1425. 2. 2014 12:11:14

56 Polygrafi a Academica 2014
8. Držková, M., Peřinka, N., Hajná, M., Kaplanová, M., Stejskal, J. 2013. The Application of Polyaniline Dispersions by means of Screen Printing. In Scientifi c Papers of the University of Pardubice, Series A, Faculty of Chemical Technology, roč. 19, 2013, s. 257–268.
9. Peřinka, N., Držková, M., Hajná, M., Jašúrek, B., Šulcová, P., Syrový, T., Kaplanová, M., Stejskal, J. 2014. Thermal analysis of polyaniline poly(N-vinylpyrrolidone)-stabilized dispersions, In Journal of Thermal Analysis and Calorimetry, DOI 10.1007/s10973-014-3667-9.
10. Blinova, N. V., Sapurina, I., Klimovič, J., Stejskal, J. 2005. The chemical and colloidal stability of polyaniline dispersions, In Polymer Degradation and Stability, roč. 88, 2005, s. 428–434.
11. Rozlívková, Z., Trchová, M., Šeděnková, I., Špírková, M., Stejskal, J. 2011. Structure and Stability of Thin Polyaniline Films Deposited in Situ on Silicon and Gold during Precipitation and Dispersion Polymerization of Aniline Hydrochloride, In Thin Solid Films, roč. 519, 2011, č. 18, s. 5933–5941.
Zbornik1_PA2014_10.indd 56Zbornik1_PA2014_10.indd 56 25. 2. 2014 12:11:1425. 2. 2014 12:11:14

Polygrafi a Academica 2014 57
Studium optických vlastností tenkých vrstev
připravených materiálovým tiskem
Oldřich Zmeškal1, Veronika Schmiedová1, Jan Pospíšil1, Jiří Černý2
1Vysoké učení technické v Brně, Fakulta chemická,Purkyňova 118, 612 00 Brno, Česká republika, [email protected]
2Centrum organické chemie, Rybitví 296, 533 54 Rybitví, Česká republika,[email protected]
Abstract: The paper deals with the study of optical properties of thin fi lms of organic materials suitable for the preparation of optoelectronic devices (e.g. photodiodes, phototransistors, photovoltaic cells). Thin fi lms were prepared by two methods: by spin coating and by material printing. To study the optical properties (complex refractive index, complex permittivity) were used UV -VIS spectroscopy and ellipsometry. The thickness and surface homogeneity of the prepared thin fi lm was determined by ellipsometry and profi lometry. The paper presents the results for the thin fi lm prepared from solutions of the phthalocyanines (PdPc), fullerene (PCBM 60) and their mixtures.
Key words: thin fi lms, material printing, spin coating, layer thickness, complex refractive index, complex permittivity
1. Úvod
V posledních letech dochází k prudkému rozvoji elektrických a dielektrických aplikací s využitím organických polovodičů. Kromě tradičních metod jako je vaku-ové napařování se začínají využívat i nové metody přípravy tenkých vrstev (např. nanášení ponorem – dip coating, rotační nanášení – spin coating, materiálový tisk – material printing). Vrstvy připravené těmito metodami nedosahují zatím vy-soké kvality, ale budou hrát v budoucnosti významnou roli pro svou technologic-kou jednoduchost a nízkou cenu výroby. Problém materiálového tisku spočívá pře-devším v různé povrchové energii potiskovaných materiálů (sklo, PET, ITO), ale také v kvalitě tištěných materiálů (PEDOT, TiO2, Pc, PCBM). Především druhý problém související s rozpustností roztoků použitých materiálů a jejich čistotou výrazně zhoršuje, resp. likviduje funkčnost potenciálních elektronických součástek. O příči-nách funkčnosti elektronických součástek mohou podat základní informaci optické metody pro měření tloušťky a optické homogenity (např. indexu lomu) materiálu.
2. Příprava struktur s aktivními tenkými vrstvami
K přípravě struktur tenkých vrstev materiálovým tiskem byla využita inkousto-vá tiskárna Dimatix Materials Printer DMP -2800. Tisk aktivních vrstev PCBM, PdPc
Zbornik1_PA2014_10.indd 57Zbornik1_PA2014_10.indd 57 25. 2. 2014 12:11:1425. 2. 2014 12:11:14

58 Polygrafi a Academica 2014
Obr. 1: Struktura vzorků připravených pro fotoelektrická a fotodielektrická měření.
Obr. 2: Mikrofotografi e studovaných vrstev (zleva doprava: PCBM, PdPc, mix)připravených rotačním nanášením (nahoře) a materiálovým tiskem (dole).
a jejich směsí byl realizován na skleněnou podložku s nanesenou vrstvou ITO. Na připravenou strukturu byla napařena horní Al elektroda. Příklad struktury vzorku pro fotoelektrická a fotodielektrická měření je znázorněn na obr. 1. Sestává ze šes-ti „identických“ sendvičových struktur (ITO/aktivní vrstva/Al). Pro optická měření byly aktivní vrstvy připraveny materiálovým tiskem a rotačním nanášením (Chemat technology Spin -coater) na skleněnou podložku.
Zbornik1_PA2014_10.indd 58Zbornik1_PA2014_10.indd 58 25. 2. 2014 12:11:1425. 2. 2014 12:11:14

Polygrafi a Academica 2014 59
Hlavní pozornost byla zaměřena na studium vlivu přípravy vrstev na jejich op-tické vlastnosti, tloušťku a homogenitu povrchu. Pro vzorky připravené metodou spin coating byl studován rozdíl mezi optickými vlastnostmi vrstev připravených ve statickém a dynamickém režimu, v dynamickém režimu také vliv otáček na tloušťku vrstev a jejich strukturu. Pro vrstvy připravené materiálovým tiskem byl studován vliv teploty vrstev na jejich optické, elektrické a dielektrické vlastnosti.
Na obr. 2 jsou znázorněny mikroskopické snímky povrchů vrstev PCBM, PdPc a jejich směsi (poměr PdPc:PCBM byl 9:5) připravených metodou rotačního naná-šení a materiálovým tiskem. Z porovnání barevných odstínů jsou zřejmé jednak různé tloušťky vrstev, ale tak rozdíl v jejich homogenitě. Vrstvy PCBM mají větší tendenci krystalizovat než vrstvy připravené rotačním nanášením. Vrstvy PdPc a směsi připravené materiálovým tiskem sice nekrystalizují, ale jejich tloušťka není homogenní což je zřejmé z různé sytosti barev a barevných odstínů v porovnání s mikrofotografi emi vrstev připravenými rotačním nanášením.
3. Stanovení tloušťky vrstev
Tloušťka vrstev byla stanovována třemi způsoby:přímo s využitím mechanického profi lometru Bruker Dektakt XT měřením na – rýze vytvořené v tenké vrstvě,nekontaktně z elipsometrických spekter (elipsometr UVISEL 2) na základě inter-– ference světla ve vrstvě,relativně z měření tloušťkových závislostí elipsometrických a UV VIS spekter (UV – VIS spektrometr Varian Cary 50).
Mechanický profi lometr
Příklad profi lu rýhy v tenké vrstvě směsi PCBM/PdPc (z obr. 2 a obr. 3) připra-vené rotačním nanášením stanovený pomocí mechanického profi lometru je znázorněn na obr. 4. Z obrázku je zřejmá poměrně homogenní tloušťka vrstvy mimo rýhu (do 0,28 mm a od 0,84 mm) a výraznější nehomogenita v oblasti rýhy (0,28 mm – 0,84 mm). Ze změny profi lu byla stanovena tloušťka 0,112 μm.
Tloušťky zbývajících vrstev znázorněných na obr. 2 připravené metodou rotač-ního nanášení dynamicky (kapka dopadla na rotující podložku) a staticky (kapka dopadla na podložku v klidu a poté roztočena) jsou uvedeny v tabulce 1. Nanesené množství roztoku byl 30 mikrolitů, rychlost rotující podložky byla 2000 otáček/min. Z tabulky je zřejmé, že se jedná o velmi tenké vrstvy, tloušťka je menší než 100 nm. Dále je vidět, že vrstvy PCBM připravené ve statickém režimu mají menší tloušť-ku než v režimu dynamickém, vrstvy PdPc mají přibližně stejné tloušťky, a naopak tloušťka vrstev připravených ze směsi PCBM/PdPc nanášených v dynamickém reži-mu je větší. Souvisí to jednak s viskozitou připraveného roztoku, ale také s rychlostí odpařování rozpouštědla.
V tabulce 2. jsou uvedeny tloušťky vrstev připravených rotačním nanášením (viz tabulka 1) a materiálovým tiskem na podložky zahřáté na různé teploty, stanove-
Zbornik1_PA2014_10.indd 59Zbornik1_PA2014_10.indd 59 25. 2. 2014 12:11:1425. 2. 2014 12:11:14

60 Polygrafi a Academica 2014
Obr. 3: Profi ly studovaných vrstev (zleva doprava: PCBM, PdPc, mix)připravených materiálovým tiskem (profi lometr Bruker Dektakt XT).
Obr. 4: Příklad měření tloušťky vrstvy pomocí mechanického profi lometru(vzorek PCBM/PdPc připravený v dynamickém režimu).
Tab. 1: Výsledky měření tloušťky vrstev připravených rotačním nanášením pomocí mecha-nického profi lometru a elipsometru.
dynamický režim statický režim
1. vzorek
(nm)
2. vzorek
(nm)
elipsometr
(nm)
1. vzorek
(nm)
2. vzorek
(nm)
elipsometr
(nm)
PCBM 25 30 20,9 ± 0,1 16 20 19,3 ± 0,1
PdPc 28 51 36,1 ± 0,1 28 60 30,5 ± 0,2
PCBM/PdPc 34 45 49,9 ± 0,3 112 94 61,3 ± 0,3
Zbornik1_PA2014_10.indd 60Zbornik1_PA2014_10.indd 60 25. 2. 2014 12:11:1425. 2. 2014 12:11:14

Polygrafi a Academica 2014 61
né elipsometricky. Je zřejmé, že tloušťka vrstev připravených oběma metodami je řádově stejná.
Tab. 2: Výsledky měření tloušťky vrstev připravených rotačním nanášením (staticky, dyna-micky) a materiálovým tiskem (pro různé teploty podložky) pomocí elipsometru.
PdPc (nm) PCBM (nm) PdPc/PCBM (nm)
statický 30,5 ± 0,2 19,3 ± 0,1 61,3 ± 0,3
dynamický 36,1 ± 0,1 20,9 ± 0,1 49,9 ± 0,3
30 °C 25,3 ± 0,2 16,2 ± 0,1 76,8 ± 0,4
45 °C 23,6 ± 0,2 16,0 ± 0,2 80,8 ± 0,5
60 °C 22,0 ± 0,2 11,7 ± 0,2 30,0 ± 0,2
Elipsometrická spektra
Předpokládaný elipsometrický model sestával ze dvou vrstev: skleněné podlož-ky (Quartz_osc.dsp) o tloušťce 2 mm s nanesenou aktivní vrstvou neznámé tloušť-ky obklopených opticky řidším prostředím (vzduch – void.ref ). Cílem bylo jednak zjištění tloušťky, ale především disperních závislosti komplexního indexu lomu aktivní vrstvy. Experimentální data (vzorků připravených rotačním nanášením) in-dexu lomu n a extinkčního koefi cientu k (Obr. 5) zahrnují optické vlastnosti všech vrstev (void, sklo, aktivní vrstva) včetně interferenčních jevů na ve studovaných strukturách.
Z těchto spekter byly za předpokladu znalosti optických vlastností voidu a skle-něné podložky stanoveny spektrální závislosti indexu lomu a extinkčního koefi ci-entu všech aktivních vrstev (Obr. 6, nahoře) a jejich tloušťka (Tabulka 2). Z obrázků je zřejmá poměrně velká absorpce pro krátké vlnové délky.
Na obr. 6, dole jsou uvedeny závislosti komplexního indexu lomu pro vrstvy při-pravené materiálovým tiskem připravené na podložku zahřátou na teplotu 30 °C. Z porovnání obrázků jsou zřejmé výrazné rozdíly pro PCBM, u něhož se nepodařilo vytisknout kvalitní vrstvy.
Obr. 5: Elipsometrická spektra, tj. závislosti indexu lomu a extinkčního koefi cientuna vlnové délce připravené rotačním nanášením (vzorky PCBM, PdPc, PCBM/PdPc –
dynamický režim) – experimentální data.
Zbornik1_PA2014_10.indd 61Zbornik1_PA2014_10.indd 61 25. 2. 2014 12:11:1425. 2. 2014 12:11:14

62 Polygrafi a Academica 2014
Obr. 6: Elipsometrická spektra, tj. závislosti indexu lomu a extinkčního koefi cientuna vlnové délce (vzorky PCBM, PdPc, PCBM/PdPc)
připravené rotačním nanášením (nahoře) a materiálovým tiskem (dole).
UV VIS spektra
Na obr. 7 jsou uvedena absorpční spektra tenkých vrstev připravených materiá-lovým tiskem (vlevo) a rotačním nanášením (vpravo) stanovené transmisním UV VIS spektrometrem. Z obrázků je zřejmý obdobný charakter závislostí s elipsometricky stanovenými extinkčními koefi cienty, především v poloze píků. Rozdílné intenzity souvisejí se skutečností, že absorpční spektra závisí na tloušťce vrstvy, zatímco ex-tinkční koefi cienty jsou na tloušťce vrstvy nezávislé.
Obr. 7: Závislosti absorpčního koefi cientu na vlnové délce (vzorky PCBM, PdPc,PCBM/PdPc) připravené rotačním nanášením (vlevo) a materiálovým tiskem (vpravo)
stanovené pomocí UV VIS spektrometru.
Zbornik1_PA2014_10.indd 62Zbornik1_PA2014_10.indd 62 25. 2. 2014 12:11:1525. 2. 2014 12:11:15

Polygrafi a Academica 2014 63
3. Závěr
V příspěvku jsou presentovány výsledky optických měření tenkých vrstev PdPc, PCBM a jejich směsi připravených rotačním nanášením a materiálovým tiskem. Z uvedených výsledků je zřejmé, že vrstvy připravené oběma metodami dávají pro PCBM odlišné výsledky, pro PdPc a směsi s PCBM jsou výsledky obou metod stejné. Liší se pouze intenzitou absorpčních píků.
Poděkování
Práce byla vytvořena za podpory grantového projektu TAČR (Grant TA03010548).
4. Literatura
1. Fujivara H. 2007 Spectroscopic ellipsometry, 1st ed., John Wiley & Son, Ed. London, Great Britain: John Wiley.
2. Zmeškal, O., Veselý, M., Vala, M., Bednář, P., Bžatek, T. 2007. Image Analysis Used to Study Physical Properties of Printed Organic Thin Films. In VIII Seminar in Graphic Arts. Conference Proceedings. Pardubice, Universita Pardubice. 2007. p. 131 – 137.
3. Zmeškal, O., Salyk, O., Veselý, M., Dzik, P. 2008. A study on the thickness homogeneity and refractive index of thin organic layers. Chemické listy. 2008. 102(S). p. s1033 (4 p.). ISSN 1213 -7103.
4. Zmeškal, O., Veselý, M., Dzik, P., Bžatek, T. 2009. Study of optical and electrical properties of TiO2 thin layers prepared by material printing. In IX. Seminar in Graphic Arts. fi rst. Pardubice, University of Pardubice. 2009. p. 81 – 88. ISBN 978 -80 -7395 -200 -6.
Zbornik1_PA2014_10.indd 63Zbornik1_PA2014_10.indd 63 25. 2. 2014 12:11:1525. 2. 2014 12:11:15

64 Polygrafi a Academica 2014
Spectroscopic study of inkjet inks
Silvia Káčerová1, Marta Klanjšek Gunde2, Michal Veselý1, 3
1Brno University of Technology, Faculty of Chemistry,Purkyňova 118, 612 00 Brno, Czech Republic, [email protected]
2National Institute of Chemistry, Hajdrihova 19, 1000 Ljubljana, Slovenia3Brno University of Technology, CEITEC, Technická 3058/10, 616 00 Brno, Czech Republic
Abstract: Inkjet is very popular digital technology. One of its important problems is the long-term photostability of inkjet prints. Photofading depends on (UV) light exposure, which induces complex chemical processes in the ink and substrate that leads to colour change. Resistance of a print to these processes depends on the printed layers, substrate, ink composition and possible interactions among the ink and substrate under exposure to light. In this work, the material basis of photofading of inkjet inks of three producers (CMYK system) was studied. The UV-VIS and IR spectroscopy were applied to prove the changes in electronic and molecular structures. The KBr pellets with dry inkjet inks were prepared for this purpose. The same samples were measured in both spectral regions in transmittance modes. The process was followed colorimetrically using samples printed on paper. Prints and KBr pellets were exposed to accelerated ageing in Suntest chamber for diff erent times until colour diff erence of prints reached ΔE = 10. In most cases we have observed some changes in electronic structure and molecular structure even before the colour diff erence of printed samples raised and become visible (ΔE > 2). The material changes in dry inks were analysed as a function of colour diff erence and time of light exposure.
Keywords: Photofading, inkjet inks, UV-VIS spectroscopy, infrared spectroscopy, colorimetry
1. Introduction
Inkjet printing technique has become over the last few years highly requested display technology. Consumers demand high stability of prints when exposed to environmental conditions. Each ink is diff erent and has a specifi c composition. The inkjet inks are composed from many compounds. Typical composition of an inkjet ink is given in Table 1, however, other additives could also be applied.
The changes in electronic and molecular structures of pure inks during the photofading can be observed using UV-VIS and IR spectroscopy. UV-VIS spectroscopy provides information about electronic transitions which are subject of colour. Vibrational (IR) spectroscopy has been mainly used for structural confi rmation of relatively pure dyes. The method is generally used for “fi ngerprinting” materials by spectral pattern matching, but with modern dyes the molecules can be so complex that the identifi cations by fi ngerprint becomes relatively limited.
Zbornik1_PA2014_10.indd 64Zbornik1_PA2014_10.indd 64 25. 2. 2014 12:11:1525. 2. 2014 12:11:15

Polygrafi a Academica 2014 65
Tab. 1: The typical composition of inkjet inks.
Component Compound Percentage (%)
Colorant dye or pigment 2–8
Solvent1,2-pentanediol, 1,2-hexanediol and
1,2-heptanediol, acetates, glycol ethersand ketones (methyl ethyl ketone)
35–80
Surfactant polyglycol ether 0.1–2.0Humectant diethylene glycol and 2-pyrolidone 10–30Penetrant penthane-1,5-diol 1–5
Binder phenolic resins and phenoplasts 2–5
2. Materials and methods
The entire CMYK set of HP inks were used in this study. The CMY inks are dye-based but the black one contains carbon black pigments, therefore it is pigment-based.
The ink samples were prepared in two ways, as scales (Fig. 1) and as KBr pellets (Fig. 2). The scales were applied to evaluate colour diff erences during successive light exposures, whereas KBr pellets were used for spectroscopic analyses of inks at the same illumination conditions.
The scales were printed by material printer FujiFilm Dimatix on Ilford Smooth Gloss media with HP inks. New scale for each ink from the set of inks was printed. The colour of prints was evaluated using i1 spectrophoto meter.
Fig. 1: The scale printed by FujiFilm Dimatix.
The KBr pellet technique enables to measure IR spectra of samples over the entire vibrational spectral region (4000–400 cm−1, i.e. 2.5–25 μm). Completely dry samples in powder form are required, which assures removing of water, good performance of hygroscopic KBr, and stable sample conditions during light exposures. For drying purposes, pure HP inks were applied on laboratory glass slices and dried in the vacuum chamber. KBr pellets (Fig. 2) were prepared using the mixture of dry inks and KBr powder in the laboratory pellet press equipment. Each KBr pellet was measured by UV-VIS Lambda 950 spectrophotometer over the 200–1000 nm spectral region in transmittance and refl ectance modes. The pellets were placed on entrance or on sample port of the integrating sphere with 8° incidence angle, for transmittance and refl ectance measurements, respectively. The pellets were measured also using IR spectrophotometer BRUKER IFS 66/5 in transmittance mode with collimated IR beam. The printed scales and KBr pellets were exposed in the Suntest chamber for the same time periods. After each exposure, the samples were measured for spectroscopic and
Zbornik1_PA2014_10.indd 65Zbornik1_PA2014_10.indd 65 25. 2. 2014 12:11:1525. 2. 2014 12:11:15

66 Polygrafi a Academica 2014
colorimetric purposes. The exposures were continued until colour diff erence of prints reached ΔE = 10. This implies that the individual inks were not necessarily exposed for the same cumulative times.
Fig. 2: KBr pellets with dry inks inside.
3. Results and Discussion
The colour diff erence of printed scales increases with exposure times, but this eff ect is not the same for all inks. We suppose that basic components of dry inks are colorant (dye or pigment), solvent and some traces of additives. The changes in colorant’s electron structure and molecular structure become therefore resolvable from that of the other components. The spectroscopic analysis is shown in the following only for magenta and black inks, the representatives of dye-based and pigment-based inks, respectively. The IR spectra were analysed separately from the UV-VIS spectra.
The IR spectral region gives evidence of functional groups, whose presence is revealed through the intensity of vibrational bands located at characteristic
Table 2: Possible functional groups in the magenta dye-based inks.
Region [cm−1] Group Possible compounds
3700–3100 —OH Alkohols, aldehydes, carboxylic acids
—HN; C— Amides, amines; alkynes3000–2800 —CH, —CH2—, —CH3 Aliphatic groups
1870–1650 C=OAcid halides, aldehydes, amides, amino acids, anhydrides, carboxylic acids, esters, ketones,
lactams, lactones, quinines
1650–1550 C=C, C=N, NHUnsaturated aliphatics, aromatics, unsaturated
heterocycles, amides, amines, amino acids1550–1300 NO2; CH3, CH2 Nitro compounds; alkanes, alkenes, etc.1300–1000 C—O—C, C—OH Ethers, alcohols, sugars1000–650 =C—H; —NH Alkenes, aromatic compounds; aliphatic amines
800–400C—halogen Halogen compounds
Aromatic rings Aromatic compounds
Zbornik1_PA2014_10.indd 66Zbornik1_PA2014_10.indd 66 25. 2. 2014 12:11:1525. 2. 2014 12:11:15

Polygrafi a Academica 2014 67
wavenumbers. The data for functional groups which we may expect in the magenta dye-based ink are collected in Table 2.
The transmission spectra of the magenta ink pellet were transformed to absorbance units and baseline corrected. This way the changes of IR light scattering on the same pellet with light exposures were taken into account. The so-obtained spectra show only the contributions of molecular vibrations. The corresponding spectra of the magenta ink pellet before exposure (reference) and after 44 h in the Suntest chamber are shown on Fig. 3. The most visible changes are in the region above 1000 cm−1, where the absorbances are relatively high. Thus, the weak aborptions below 1000 cm−1 were not considered here. Within 3600–3200 cm−1 spectral region the intense peak due to stretching vibrations of —OH and NH groups could appear and overlap instantaneously; they diminish rapidly with exposure. We may conclude that, most likely, this gives evidence of rapid removing of all traces of alcohols still present in the samples (OH group) and/or some changes in amines, possibly also in the dye happen. Other changes were obtained in the fi ngerprint region. Most important are those observed in the spectral region 1300–1000 cm−1. Here, two peaks were almost completely removed by the exposure, at 1276 cm−1 and 1134 cm−1. Following literature data, they were contributed to vibrations of aryl—N and R—NH—R groups, respectively. The nitrogen-containing functional groups are revealed also by peaks in the region 1650–1550 cm−1, where stretching of NO2 groups are revealed. The intensity of these peaks diminished with light exposure, but after 44 h they still exists in the IR spectrum. The described changes are started already after 1 h exposure but the changes in the fi ngerprint region are comparatively small.
Fig. 3: IR absorbance spectra of magenta ink before and after 44 h exposure to light.
Zbornik1_PA2014_10.indd 67Zbornik1_PA2014_10.indd 67 25. 2. 2014 12:11:1525. 2. 2014 12:11:15

68 Polygrafi a Academica 2014
Fig. 4 shows absorbance change in the UV spectrum of magenta ink sample during the accelerated ageing. This part of the UV-VIS spectrum was measured with resolution of 1 nm to obtain better resolution. In the range of shortest wavelengths 200–210 nm the electronic structure is changing in the fi rst hour of light exposure but remains constant with further exposure.
Fig. 4: The absorbance change of UV-VIS spectrum of magenta HP dyeduring the ageing and detail in UV region of spectrum.
Fig. 5: The absorbance IR spectrum of pellet with dry black ink during the ageing.
Zbornik1_PA2014_10.indd 68Zbornik1_PA2014_10.indd 68 25. 2. 2014 12:11:1525. 2. 2014 12:11:15

Polygrafi a Academica 2014 69
The changes observed in black ink were diff erent than in dye-based inks. While carbon black pigments highly absorb over the entire UV-VIS and IR region, there was not possible to obtain any spectral changes that could be attributed to the colorant. This is best presented by IR spectra (Fig. 5). The absorbance of the pellet with dry black ink shows no change in baseline even after the longest exposure applied to it – thus the absorbance of the pigment remains the same over the entire IR spectral range. The pigments consist of elemental carbon which does not have dipole moment; therefore no IR bands are possible. The peaks obtained in the IR spectrum are due to vibrations of other constituents in the dry ink – the binder and additives. They remain more-or-less unchanged, thus no molecular changes were caused by exposures to light.
The UV spectra of pellet with dry black ink are similar as those with magenta ink (Fig. 4). This confi rms that the electronic structure starts to change already in the fi rst hour of exposure. This may explain why the colour of the pigment-based inks is changing although no changes were obtained in IR spectra.
4. Conclusions
The spectroscopic analysis of photofading of ink-jet inks is a broad research and only a small part of it is shown here. The chemical structure of the inks were analysed separately from the printing substrate, therefore the possible interactions with the material within it were excluded. We encountered on many troubles when searching a good measurement methodology for full spectroscopic analysis in UV, visible and IR spectral regions. The best experimental procedure was the KBr pellet containing dry inks. The same pellet was applied for all spectral regions while the pure KBr pellet is completely transparent over all regions of interest. While the KBr pellet technique is the most common simple technique used in IR spectroscopy, we do not know about any application in UV-VIS spectral region. The photofading was followed spectroscopically for the exposure times, where the samples printed by the same ink on paper changes by ΔE = 10. This is of course not enough for totally destruction of the colorant.
Most important difference was observed between dye-based and pigment-based inks. For all dye-based inks we were able to detect changes in molecular structure of dry ink samples and the rapid change of the electronic band structure in UV. The carbon black pigments are much different – the IR spectra do not show any vibrational bands, thus, no differences were possible to observe.
The research described here, needs further work on detail analysis of results. This will be accomplished in the near future. Nevertheless, the results shown here are sound and promising.
Acknowledgement
Authors thank to the COST Action FP1104 for supporting the co-operation.
Zbornik1_PA2014_10.indd 69Zbornik1_PA2014_10.indd 69 25. 2. 2014 12:11:1625. 2. 2014 12:11:16

70 Polygrafi a Academica 2014
5. References
Pond, S. F. Inkjet technology and product development strategies. Carlsbad: Torrey Pines, 1. 2000. ISBN 09-700-8600-8.Gregory, P. Digital photography. Optics and laser technology. 2006, volume 38, 306–314. 2. ISSN 0030-3992.Dent, G., Chalmers, J. M. Vibrational Spectroscopy of Colors, Dyes and Pigments. 3. Handbook of Vibrational Spectroscopy. Chichester, UK: John Wiley, 2006-06-15. DOI: 10.1002/0470027320.s6905. Dostupné z: http://doi.wiley.com/10.1002/0470027320.s6905Yuen, C. W. M., Ku, S. K. A., Choi, P. S. R., Kan, C. W., Tsang, S. Y. Determining Functional 4. Groups of Commercially Available Ink-Jet Printing Reactive Dyes Using Infrared Spectroscopy. Research Journal of Textile and Apparel. 2005, Vol. 9, No. 2.Colthup, N. C., Daly, L. H., Wiberly, S. E. Introduction to Infrared and Ramn Spectroscopy. 5. Academic Press, Inc. Boston, 1990.
Zbornik1_PA2014_10.indd 70Zbornik1_PA2014_10.indd 70 25. 2. 2014 12:11:1625. 2. 2014 12:11:16
Polygrafi a Academica 2014 71
Inkjet Printed Oxide Semiconductor Layers –
– Limits and Benefi ts
Petr Dzik1, Michal Veselý1, Petr Klusoň2, Magdalena Morozová2,Urška Lavrenčič Štangar3
1Faculty of Chemistry, Brno University of Technology,Purkyňova 118, Brno, Czech Republic, [email protected]
2Institute of Chemical Process Fundamentals of the ASCR, v. v. i.,Rozvojová 135, 165 02 Prague, Czech Republic
3Laboratory for Environmental Research, University of Nova Gorica,Vipavska 13, SI-5000 Nova Gorica, Slovenia
Abstrakt: Although titania coatings can be fabricated by countless diff erent processes, wet coating techniques constitute a very popular approach. A new promising wet-coating technique has become available recently. The technique shares the basic principles with conventional inkjet printing, i.e. tiny droplets of a low-viscosity liquid are deposited onto a substrate by means of thermal or piezoelectric printhead. In the case of material printing, the ink is a specially formulated liquid used for transporting a functional component onto the substrate surface. The presentation is therefore going to give a comparative review of several recent studies conducted by the authors which share the same deposition method and ultimate product (i.e. inkjet printed oxide semiconductor patterns) but diff er siginicantly in the synthetic routes. On this set of practical examples, the benefi ts of the new technique as well as its limitations will be fairly presented.
Kyewords: titanium doxide, wet coating, inkjet printing, direct patterning
1. Introduction
For the past 4 decades, titanium dioxide has been the subject on an intensive research. What was started by Fujishima and Honda’s seminal report [1] on photoelectrochemical splitting of water on titanium dioxide electrodes, has gradually developed into a broad technological fi eld of applied photocatalysis. So far we have witnessed the proposals and successful application of photocatalytic phenomena for water purifi cation [2], dissinfection [3], toxic waste treatment [4], air purifi cation [5], self-cleaning [6] and self-disinfecting [7] surfaces as well as superhydrophilic antifogging ones [8].
2. Material Printing
Both gas phase deposition methods as well as wet coating ones were successfully adopted for the preparation of immobilized photocatalyst layers and numerous papers and reviews report on the. However, the...
Zbornik1_PA2014_10.indd 71Zbornik1_PA2014_10.indd 71 25. 2. 2014 12:11:1625. 2. 2014 12:11:16

72 Polygrafi a Academica 2014
Many diff erent coating techniques have been proposed, such as dip-, spin- or spray-coating, doctor blade spreading, roller etc. [9] While all these techniques proved to be useful, they are buried by some inherent limitations. These include, but are not limited to: sensitivity to surface defects, limited coating area, ambient humidity interference, effi ciency of precursor use. Fortunately, a new promising deposition technique has become available recently. The novel approach is usually termed inkjet material deposition or shortly material printing. The technique shares the basic principles with conventional inkjet printing [10], i.e. tiny droplets of a low-viscosity liquid are precisely deposited onto a substrate by means of thermal or piezoelectric printhead. In the case of material printing, the ink is a specially formulated liquid used for transporting a functional component onto the substrate surface [11].
This technique is very robust and outperforms the traditional ones in most aspects: • Sensitivity to surface defects is strongly suppressed, because a defect is simply
overprinted. In the worst cases it may eventually disrupt the layer homogeneity, but it certainly won’t infl uence its surroundings.
• Coating area is limited solely by the printer design. Inkjet printers handling roll media of a meter width or rigid media of several square meters area are common nowadays in the printing industry. Such printers can be easily converted for printing functional liquids instead of original colored inks.
• Environmental sealing: The ink is kept in airtight tanks and tubing until printing so evaporation and humidity absorption is eliminated.
• Effi ciency of sol consumption: A tiny fraction of the ink is consumed for print head cleaning and purging, but most of the ink is actually delivered to the substrate.
• The most important advantage this technique brings is the possibility of direct patterning, i.e. the fabrication of 2D patterns on the substrate without the need of any mechanical or optical masking.
3. Present State of the Art
Material printing has been successfully employed for the deposition of a great variety of functional materials forming thin layers, various patterns 2D (arrays, gaps, sandwich) and even 3D structures. As far as printed titania is concerned, several important papers are worth mentioning.
Yoshimura and Gallage summarized the general ideas of direct patterning in a neat review [12]. They proposed several possible pathways leading to ceramic fi lms, distinguishing between “inkjet reaction”, “inkjet deposition” and “inkjet printing” methods. However, in their illustrative example, the preparation of TiO2 fi lms by inkjet printing was limited to patterning small letters and simple shapes onto a substrate heated to 548 K.
A lot of experimental attention has been paid to explore the most direct way leading to TiO2 printed fi lms: synthesis of stable colloidal suspension of
Zbornik1_PA2014_10.indd 72Zbornik1_PA2014_10.indd 72 25. 2. 2014 12:11:1625. 2. 2014 12:11:16

Polygrafi a Academica 2014 73
nanocrystalline TiO2 followed by a delivery of this suspension onto substrate by means of inkjet printing. Kim and Mckean [13] have studied the stability aqueous dispersion of commercial TiO2 powder stabilised by proprietary polymeric dispersants. With their most stable samples, they were able to print the suspension by thermal inkjet printhead and obtained TiO2 patterns on transparent polymeric foil. However, while they focus solely on the dispersion stability issues, problems of layer fi xing and adhesion were not addressed.
Bernacka-Wojcik and coworkers recently demonstrated [14] a disposable biosensor integrating an inkjet printed, dye sensitized TiO2 photodetector to be used in conjunction with DNA detection method based on non-cross-linking hybridization of DNA-functionalized gold nanoparticles. For the photodetector preparation, a commercial dispersion of titania particles was printed by a desk-top offi ce printer equipped with a thermal inkjet head. A similar approach was adopted by Yang [15], who used an in-house synthesized dispersion of TiO2 printed by a modifi ed offi ce inkjet printer to produce an oxygen demand sensing photoanode.
Matsuo and coworkers chose a totally diff erent approach [16]. Rather than printing heterogenenous dispersion of titania particles, they employed a colloidal organometallic sol for the preparation of titania layers. Their somewhat complex approach included a two-step preparation of the printing “ink” (sol based on titanium tetraisopropoxide, ethanol and nitric acid was evaporated and then re-dissolved in a mixture of ethanol and water to give 0.02 M Ti concentration). Printing was performed by a single jet piezo device onto substrate heated to 275 °C.
Manga and co-workers [17] utilized a similar approach to prepare an inkjet printed photosensor based on graphene oxide/titanium dioxide composite layer. However, the use of traditional sol-gel method did not prove to be favorable because of limited compatibility of aqueous graphene oxide solutions with titanium alkoxide sols. Instead, an aqueous solution of ionic organotitanate salt was employed.
Recently, Arin et al. [18] demonstrated a signifi cant modifi cation of the traditional sol-gel composition. With the help of complexing agents such as citric acid, they were able to formulate a sol-gel composition with water as the main solvent. Further, they prepared photocatalytic coatings by printing this sol with a large-orifi ce (90 um) single-nozzle experimental printer.
4. Oxide Semiconductor Patterning at BUT
The authors of this paper have reported the deposition of conventional sol-gel formulations based on tetraisopropoxy titanate and acetyl acetone by a modifi ed offi ce inkjet printer [19]. In this letter, we demonstrated the benefi ts of using inkjet printing technology for the preparation of TiO2 thin layers and report about some important properties of prepared printed layers of photocatalytically active TiO2. By utilizing the well known sol-gel chemistry used so far mostly for spin- and dip coated layers of TiO2, together with the wide deposition possibilities off ered by
Zbornik1_PA2014_10.indd 73Zbornik1_PA2014_10.indd 73 25. 2. 2014 12:11:1625. 2. 2014 12:11:16

74 Polygrafi a Academica 2014
inkjet printing, we were able to prepare transparent, photocatalytic layers of TiO2 of variable thickness in a very eff ective and clean way with minimum waste.
Thick multilayer coatings were printed with the help of poly(ethylene glycol) acting as viscosity modifying, templating and anti-cracking agent [20]. This study focused on the preparation of the TiO2 thin fi lms from alkoxide solutions containing polyethylene glycol (PEG) as an anticracking agent by the sol–gel method on soda–lime glass plates. Sol application was carried out again by inkjet printing using a modifi ed offi ce inkjet printer equipped with piezoelectric print head. The grey level of the printed image was varied in order to control the sol loading of the resulting printed pattern. In all cases, we prepared transparent thin layers of TiO2 with varying thickness and surface morphology. PEG proved to be an effi cient agent suppressing the formation of cracks.
Sols based on the reverse micelle templates were also successfully adapted for inkjet [21] and printed patterns showed interesting sensing properties as well as photocatalytic activity [22]. This study dealt with the adaptation and optimization of the reverse micelles sol–gel composition to make it feasible for inkjet printing. The inkjet printing technique that enables printing of regular as well as irregular patterns was successfully applied to prepare thin TiO2 layers deposited on substrates via the template sol–gel method. The substantial sol properties as viscosity and density were successfully optimized. Xylene was found as the suitable optimal non-polar solvent for the reverse micelle sol preparation owing to its low volatility and good surface tension. The printed layers possess smooth, homogeneous and transparent surface with low amount of defects. The photoelectrochemical functionality and photocatalytic effi ciency of the inkjet printed TiO2 layers have also been discussed. The photocatalytic degradation of stearic acid revealed strong dependence of photocatalytic activity on the layers thickness. On the contrary, no infl uence of the layer thickness to photoinduced hydrophilicity has been noticed. It was proved that prepared TiO2/ITO electrodes (TiO2 thin layers on ITO glass used as photoanode) are stable and possess good photoinduced properties. The obtained electrochemical curves of layers refl ect the ability to react on UV light signal by generation of the charge carriers. The electrochemical measurements confi rmed the high potential of photoelectrochemistry for detection of the semiconductor oxides photoactivity. This study clearly proved the possibility of production of transparent functional thin layers deposited on various substrates by inkjet printing from the liquid sol utilized the reverse micelles system.
A comparative study on the properties of sol-gel originating titania layer prepared by various technique was also accired out [23, 24]. Thin sol-gel TiO2 layers deposited on the conductive ITO glass by means of three various deposition techniques (dip-coating, inkjet printing and spray-coating) were used as photoanode in the three-compartment electrochemical cell. The thin TiO2 fi lms were treated at 450 °C and after calcination all samples possessed the crystallographic form of anatase. The relationship between surface structure and photo-induced conductivity of the nanostructured layers was investigated. It was found that the used deposition
Zbornik1_PA2014_10.indd 74Zbornik1_PA2014_10.indd 74 25. 2. 2014 12:11:1625. 2. 2014 12:11:16

Polygrafi a Academica 2014 75
method signifi cantly infl uenced the structural properties of prepared layers; mainly, the formation of defects and their quantity in the prepared fi lms.
Authors of this paper have recently reported the fabrication of titania patterns by inkjet printing of rutile nanodispersion originating from the hydrothermal process [25]. Titanium dioxide colloidal dispersions were synthesized by hydrothermal synthesis in acidic pH under various process conditions. Phase structure of prepared TiO2 was identifi ed as pure rutile by X-ray diff raction analysis and crystallite sizes determined by the Scherrer equation were in the range of 10–25 nm. These values correlated with particle sizes observed by transmission electron microscopy (TEM). Afterwards, the prepared TiO2 dispersions were used for the formulation of stable inkjet printable “inks”. Thin layers of nanocrystalline TiO2 were deposited by inkjet printing onto soda-lime glass substrates. After sintering at 500 °C, thin patterned fi lms were obtained. Optical microscopy and SEM imaging revealed highly structured topography of samples surface. Layer hardness was equivalent to the B pencil as determined by the “Pencil Hardness Test”. The topology and roughness were examined by atomic force microscopy and RMS roughness was in the range of 40–100 nm. Band gap energy of TiO2 determined by UV-VIS refl ection spectroscopy was consistent with known rutile values. The photocatalytic activity of printed layers was evaluated on the basis of 2,6-dichloroindophenoldiscoloration rate monitored by UV-VIS spectroscopy and did not exceed the performance of Aeroxide P-25. Despite average photocatalytic performace of this particular TiO2 type, inkjet printing proved to be an effi cient method for the fabrication of patterned titania fi lms originating from nanocrystalline precursor.
Moreover, titania doping by iron has been also investigated [26]. Thin layers of doped titanium dioxide on Pyrex glass were prepared by the material printing technique. Titanium dioxide was synthesized by the sol-gel method employing titanium(IV)isopropoxide as the precursor. A dedicated experimental inkjet printer Fujifi lm Dimatix 2831 was used for the coating process. The infl uence of various solvents onto sol jettability was investigated. The mixture of absolute ethanol and 2-butanol was fi nally adopted because of its optimum viscosity and rate of evaporation. A series of experiments with diff erent printing conditions was carried out, the optimum printing settings were determined. Consequently, iron and silver dopants were incorporated into the sol. The infl uence of doping on the photocatalytic activity of TiO2 as well as the shift of absorption edge towards high wavelengths was investigated.
Apart from titania, other transition metals oxides have been also successfully patterned by inkjet printing. Zinc dioxide is of a high interest for its semiconducting properties. Photoinduced electrochemical functionality of uniform TiO2 and ZnO fi lms prepared by solgel method, in the former case in the reverse micelle environment, was studied using a specifi c type of ionic liquids as electrolytes [27]. The coating part was arranged as piezoelectric ink-jet printing. Ionic liquids could be regarded as nanostructured fl uids with two distinctive kinds of spatial domain: one ionic, the other non-polar. The driving force for the segregation of the nonpolar chains is energetic. They are excluded from the cohesive network
Zbornik1_PA2014_10.indd 75Zbornik1_PA2014_10.indd 75 25. 2. 2014 12:11:1625. 2. 2014 12:11:16

76 Polygrafi a Academica 2014
of positive and negative charges that is formed by the charged groups of the ions in close contact. If side-chains are too short they do not disturb the ionic network signifi cantly and, they do not possess enough conformational freedom to adopt a low energy confi guration. By increasing the chain-length the role of its spatial arrangement becomes important. Such features must be refl ected in their specifi c behaviour as electrolytes in the contact with photoactive semiconducting thin fi lms. Attention was also paid to the correlation of the values of generated photocurrent densities in layers with the fl uidity and conductivity of the used ionic liquids.
Thin transparent fi lms were prepared by dip-coating and inkjet-printing of few-layer ZnO nanosheets on glass plates [28]. The advantage of the ZnO nanosheets is the possibility to fabricate transparent and oriented surfaces with exposed high energy facets (001). The manner of the nanosheets arrangement aff ected the morphology of the fi lms from very smooth, nonporous dip-coated fi lms to rather rough inkjet-printed fi lms with a surface area in the range of ca. 100–160 m2g–1. The 4-chlorophenol photocatalytic degradation rate constants of the nanosheets-based fi lms were approximately 1.5 to 1.7 times larger when compared with the ZnO fi lms with a nanocolumn morphology or with the ZnO fi lms prepared by the sol-gel technique. We attribute the high photocatalytic activity of the ZnO nanosheets to their surface arrangement with the exposed facets (001) towards the oxidized substrate. These results suggest that the ZnO nanosheets-based fi lms have potential in the design of a wide range of applications including optical devices and dye-sensitized solar cells.
Acknowledgement
Authors thank to the Technology Agency of the Czech Republic for support through project TA03010548.
5. References
1. A. Fujishima, K. Honda, Nature 238 (1972) 37–38. 2. C. P. Silva, M. Otero, V. Esteves, Environ Pollut, 2012 Elsevier Ltd, England, 2012, pp. 38–58. 3. M. Mahmood, S. Baruah, A. Anal, J. Dutta, Environmental Chemistry Letters 10 (2012)
145–151. 4. R. Vinu, G. Madras, Journal of the Indian Institute of Science 90 (2010) 189–230. 5. S. Park, H. R. Kim, H. Bang, K. Fujimori, B. S. Kim, S. H. Kim, I. S. Kim, Journal of Applied
Polymer Science 125 (2012) 2929–2935. 6. C. Y. Wang, H. J. Tang, S. H. Pang, J. X. Qiu, Y. Tao, Rare Metal Materials and Engineering 37
(2008) 548–551. 7. J. Gamage, Z. S. Zhang, International Journal of Photoenergy (2010). 8. W. Y. Gan, S. W. Lam, K. Chiang, R. Amal, H. J. Zhao, M. P. Brungs, Journal of Materials
Chemistry 17 (2007) 952–954. 9. H. Schmidt, M. Mennig, Wet Coating Technologies for Glass, 2012, p. http://www.solgel.
com/articles/Nov00/coating.htm.
Zbornik1_PA2014_10.indd 76Zbornik1_PA2014_10.indd 76 25. 2. 2014 12:11:1625. 2. 2014 12:11:16
Polygrafi a Academica 2014 77
10. G. D. Martin, S. D. Hoath, I. M. Hutchings, Iop, Inkjet printing – the physics of manipulating liquid jets and drops, Conference on Engineering in Physics – Synergy for Success, London, ENGLAND, 2006.
11. P. Calvert, Chemistry of Materials 13 (2001) 3299–3305. 12. M. Yoshimura, R. Gallage, Journal of Solid State Electrochemistry 12 (2008) 775–782. 13. S. J. Kim, D. E. McKean, Journal of Materials Science Letters 17 (1998) 141–144. 14. I. Bernacka-Wojcik, R. Senadeera, P. J. Wojcik, L. B. Silva, G. Doria, P. Baptista, H. Aguas, E.
Fortunato, R. Martins, Biosensors & Bioelectronics 25 (2010) 1229–1234. 15. M. Yang, L. H. Li, S. Q. Zhang, G. Y. Li, H. J. Zhao, Sensors and Actuators B-Chemical 147
(2010) 622–628. 16. A. Matsuo, R. Gallage, T. Fujiwara, T. Watanabe, M. Yoshimura, Journal of Electroceramics
16 (2006) 533–536. 17. K. K. Manga, S. Wang, M. Jaiswal, Q. L. Bao, K. P. Loh, Advanced Materials 22 (2010) 5265–
5270. 18. M. Arin, P. Lommens, N. Avci, S. C. Hopkins, K. De Buysser, I. M. Arabatzis, I. Fasaki, D.
Poelman, I. Van Driessche, Journal of the European Ceramic Society 31 (2011) 1067–1074.
19. P. Dzik, M. Vesely, J. Chomoucka, Journal of Advanced Oxidation Technologies 13 (2010) 172–183.
20. M. Cerna, M. Vesely, P. Dzik, Catalysis Today 161 (2011) 97–104. 21. M. Morozova, P. Kluson, J. Krysa, P. Dzik, M. Vesely, O. Solcova, Sensors and Actuators, B:
Chemical 160 (2011) 371–378. 22. P. Dzik, M. Morozová, P. Klusoň, M. Veselý, Journal of Advanced Oxidation Technologies
15 (2012) 89–97. 23. M. Morozova, P. Kluson, J. Krysa, M. Vesely, P. Dzik, O. Solcova, Electrochemical properties
of TiO2 electrode prepared by various methods, Procedia Engineering, Prague, 2012, pp. 573–580.
24. M. Morozova, P. Kluson, P. Dzik, M. Vesely, M. Baudys, J. Krysa, O. Solcova, Journal of Sol-Gel Science and Technology 65 (2013) 452–458.
25. M. černá, M. Veselý, P. Dzik, C. Guillard, E. Puzenat, M. Lepičová, Applied Catalysis B: Environmental 138-139 (2013) 84–94.
26. M. Kralova, P. Dzik, M. Vesely, J. Cihlar, Catalysis Today (2013). 27. P. Dytrych, P. Kluson, P. Dzik, M. Vesely, M. Morozova, Z. Sedlakova, O. Solcova, Catalysis
Today (2013). 28. J. Hynek, V. Kalousek, R. Zouzelka, P. Bezdicka, P. Dzik, J. Rathousky, J. Demel, K. Lang,
Langmuir 30 (2014) 380–386.
Zbornik1_PA2014_10.indd 77Zbornik1_PA2014_10.indd 77 25. 2. 2014 12:11:1625. 2. 2014 12:11:16

78 Polygrafi a Academica 2014
Tlačené farbivom scitlivené solárne články
Milan Mikula, Pavol Gemeiner, Vladimír Dvonka, Zuzana Beková
Ústav prírodných a syntetických polymérov,Oddelenie polygrafi e a aplikovanej fotochémie, FCHPT STU,
Radlinského 9, 812 37 Bratislava, [email protected]
Abstract: Polyethylene-terephthalate (PET) foils and glass slides coated with thin conductive layers were used as substrates for TiO2 or ZnO based photoactive electrodes of dye-sensitized solar cells (DSSC) with organo-metalic Ru-dye, standard iodine electrolyte and Pt coated FTO/glass counter-electrode (CE). The diff erent compositions of nanoparticle oxides in a form of alcohol pastes as well as the CE paste were applied onto the substrates by screen printing or by doctor blade technique. Photocurrents and I-V loading characteristics were measured depending on the solar cell structure and preparation, including the oxide composition, electrode conductivity and the sensitizer dye type.
1. Úvod
Napriek veľkým očakávaniam, avizovaným možnostiam i vloženým inves tíciám, je podiel solárnej energetiky na celkovej produkcii energie stále veľmi malý, Tab. 1. Komerčne najpoužívanejšie fotovoltaické (PV) systémy sú na báze polykryštalické-ho a amorfného kremíka, využívajúceho p-n prechod na rozhraní dvoch polovodi-čov, zväčša na sklenom podloží, s účinnosťou premeny slnečnej energie na elektric-kú do 20 %. Hlavnými problémami sú vysoké materiálové, energetické a produkčné náklady spolu s ekologickými dopadmi [1].
Tab. 1: Energetické zdroje Zeme a možnosti fotovoltaiky.
Výkon
Typ Energie
súčasný*TW (1012 W)
možnýTW (1012 W)
Fosílna*** Ropa, Plyn, Uhlie
16
Jadrová (U) 2
Vodná 0,9 2Veterná 0,2 20Solárna 0,2 >20**
Geotermálna 0,05 150
*Súčasný globálny výkon: 20 TW, v jednotkách energie: 6 × 10²⁰ J/rok.**Solárny príkon na Zem: 100 000 TW. Potrebný výkon 20 TW sa získa pokrytím 0,2 % po-
vrchu Zeme (pri 20 % účinnosti). Púšte tvoria viac ako 10 %.***Záväzok EU do roku 2050: zníženie emisií o viac ako 80 %.
Zbornik1_PA2014_10.indd 78Zbornik1_PA2014_10.indd 78 25. 2. 2014 12:11:1625. 2. 2014 12:11:16

Polygrafi a Academica 2014 79
Riešenia 2. a 3. generácie solárnych článkov (SC, Tab. 2) ponúkajú mož nosti zní-ženia nákladov využitím tenkých vrstiev (s úsporou materiálu) a tiež vysokoproduk-tívnych kotúčových ovrstvovacích metód „roll-to-roll“ (R2R) včítane tlačových tech-ník, aplikovaných pokiaľ možno na tenké plastové podložky. Niektoré riešenia SC dosiahli už výrazné úspechy, pričom sa využili i tlačové, resp. R2R techniky. Medzi najúspešnejšie patria systémy CIGS, ktoré sa komerčne realizujú aj na plastových podložkách s účinnosťou až 20 % [2], tiež s využitím fl exotlače fotoaktívnej zmesi na hliníkom meta lizovanú polyesterovú fóliu (PET). Z hľadiska maso vej produkcie však predstavujú ekologickú záťaž (kovy, technológia).
Tab. 2: Vývoj fotovoltaických solárnych článkov (η – účinnosť premeny energie).
1. generácia 2. generácia 3. generáciakryštalické Si,
GaAsmikrokryštalický Si
amorfné Siorganické,
vodivé polyméry,
η nad 20 %CdTe, CIGS (CuInGaSe,
tlačiteľné na PET)nanokryštické
hybridné, DSSC, perovskit.
drahéη 10 – 20 %
lacnejšie, neekologické
η 10 – 15 %lacnejšie, ekologické
tlačiteľné, R2R
Od 3. generácie sa očakáva lacné a ekologické riešenie z hľadiska materiálu, tech-nológie i dlhodobej masovej spotreby. Tieto požiadavky čiastočne spĺňajú organické a polymérne fotočlánky (OPV), ktoré poskytujú veľkú variabilitu z chemického hľa-diska i z hľadiska tlačových možností. Využívajú fotoexcitáciu a prenos náboja na molekulovej úrovni, pričom najúspešnejšie systémy obsahujú vodivé polyméry (po-lytiofény, P3HT) v kombinácii s nano štrukturovaným uhlíkom (fulerény, nanotrubky) [3]. Ich problémom je zatiaľ nestabilita, nízka životnosť a nižšia účinnosť (pod 10 %) pri veľmi tenkých submikrónových vrstvách a . Pri väčšej hrúbke je potrebná zatiaľ problematická objemová heteroštruktúra. Riešením by mohli byť hybridné systémy kombinujúce vrstvy vodivých polymérov s nanokryšta lickými oxidmi kovov [4].
Farbivom senzibilizované solárne články (DSSC, obr. 1) predstavujú samostat-nú skupinu SC, ktorá využíva nanoštrukturovaný polovodivý oxid TiO2 (ZrO2, ZnO) nanášaný tlačovými technikami. V štandardnom prevedení je oxid senzibilizovaný naadsorbo vaným Ru-farbivom a vyplnený elektrolytom s I–/I3
– redox mediátorom, zabezpečujúci prenos náboja na protielektródu, najčastejšie pripravenú tlačou Pt nano-pasty na vodivý podklad. Na sklenej podložke dosiahol tento systém pomer-ne rýchlo účinnosť nad 10 % a bol i komerčne aplikovaný [5]. Z technologického hľadiska, i z hľadiska životnosti je však prítomnosť prchavého a agresívneho elek-trolytu veľkým problémom.
Nahradenie iodolytu tuhým prenášačom kladných dier (hole transport layer HTL), zvlášť pri využití vodivých polymérov, spája systém s kategóriou hybridných SC. Táto náhrada však naráža na problém plného, dokonalého kontaktu s nanoštruktu-rovaným oxidom. Využívajú sa tu, okrem vodivých polymérov (polytiofény, polytria-
Zbornik1_PA2014_10.indd 79Zbornik1_PA2014_10.indd 79 25. 2. 2014 12:11:1625. 2. 2014 12:11:16

80 Polygrafi a Academica 2014
rylamíny), rôzne nízkomolekulové látky [6], zvlášť arylamíny, (najúspešnejší z nich spiroOMeTAD) a tiež anorganicko-organické látky s perovskitovou štruktúrou [7].
V poslednom období boli organo-kovo-halidové (R—NH3—M—X) perovski-ty, s dobrým kontaktom na nanočastice TiO2, zvlášť CH3NH3—Pb—I, využité aj ako senzi bilizátory (absorbéry svetla), namiesto farbiva, so zachovanou funkciou transportnej HLT vrstvy. Pri doplnení tenkou transport nou HTL-vrstvou (spiro-O-MeTAD) dosiahli unikátnu účinnosť až 15 % [8].
Pri všetkých riešeniach zostáva stále veľa problémov, ako sú náhrada a tlač dra-hých transparentných elektród (Pt, ITO, FTO), aplikácia na fl exibilné podložky, vy-soký odpor vrstiev, vnútorné straty, zapuzdrenie systému pre dlhodobú stabilitu v exteriéri, a pod.
Napriek problémom sa predpokladá rýchly nárast DSSC aplikácií najmä pre prenosné zariadenia (nabíjačky, solárne tašky, bezdrôtové obrazovky), vnútorné
Obr. 1: Schéma DSSC s nano-oxidovou vrstvou na plastovej (PET) podložkes vodivou (ITO) a blokujúcou (BL) vrstvou, s vonkajším záťažovým obvodom.
Obr. 2: Fotoexcitácia a transport elektrónu v DSSC štruktúre a žáťažou R.
Zbornik1_PA2014_10.indd 80Zbornik1_PA2014_10.indd 80 25. 2. 2014 12:11:1725. 2. 2014 12:11:17
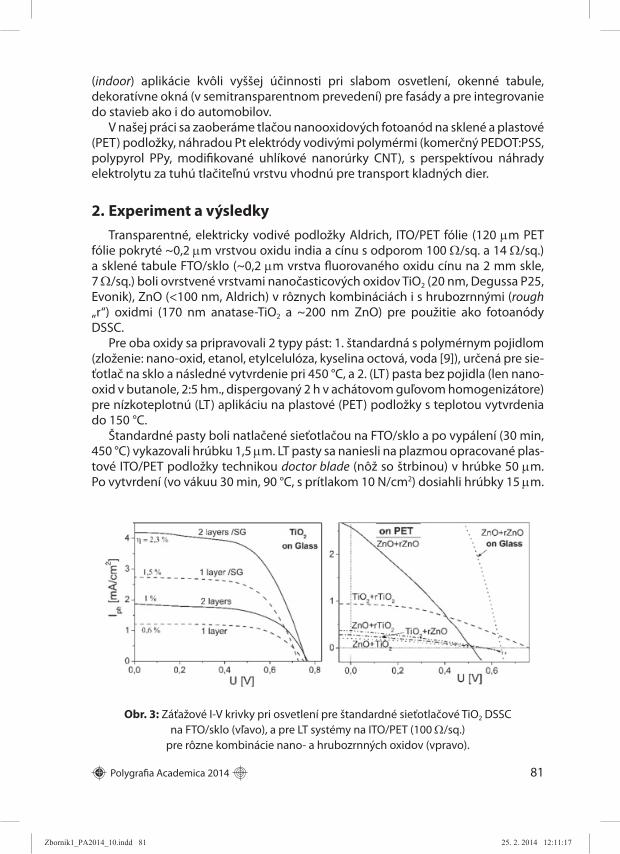
Polygrafi a Academica 2014 81
(indoor) aplikácie kvôli vyššej účinnosti pri slabom osvetlení, okenné tabule, dekoratívne okná (v semitransparentnom prevedení) pre fasády a pre integrovanie do stavieb ako i do automobilov.
V našej práci sa zaoberáme tlačou nanooxidových fotoanód na sklené a plastové (PET) podložky, náhradou Pt elektródy vodivými polymérmi (komerčný PEDOT:PSS, polypyrol PPy, modifi kované uhlíkové nanorúrky CNT), s perspektívou náhrady elektrolytu za tuhú tlačiteľnú vrstvu vhodnú pre transport kladných dier.
2. Experiment a výsledky
Transparentné, elektricky vodivé podložky Aldrich, ITO/PET fólie (120 μm PET fólie pokryté ~0,2 μm vrstvou oxidu india a cínu s odporom 100 Ω/sq. a 14 Ω/sq.) a sklené tabule FTO/sklo (~0,2 μm vrstva fl uorovaného oxidu cínu na 2 mm skle, 7 Ω/sq.) boli ovrstvené vrstvami nanočasticových oxidov TiO2 (20 nm, Degussa P25, Evonik), ZnO (<100 nm, Aldrich) v rôznych kombináciách i s hrubozrnnými (rough „r“) oxidmi (170 nm anatase-TiO2 a ~200 nm ZnO) pre použitie ako fotoanódy DSSC.
Pre oba oxidy sa pripravovali 2 typy pást: 1. štandardná s polymérnym pojidlom (zloženie: nano-oxid, etanol, etylcelulóza, kyselina octová, voda [9]), určená pre sie-ťotlač na sklo a následné vytvrdenie pri 450 °C, a 2. (LT) pasta bez pojidla (len nano-oxid v butanole, 2:5 hm., dispergovaný 2 h v achátovom guľovom homo genizátore) pre nízkoteplotnú (LT) aplikáciu na plastové (PET) podložky s te plotou vytvrdenia do 150 °C.
Štandardné pasty boli natlačené sieťotlačou na FTO/sklo a po vypálení (30 min, 450 °C) vykazovali hrúbku 1,5 μm. LT pasty sa naniesli na plazmou opracované plas-tové ITO/PET podložky technikou doctor blade (nôž so štrbinou) v hrúbke 50 μm. Po vytvrdení (vo vákuu 30 min, 90 °C, s prítlakom 10 N/cm2) dosiahli hrúbky 15 μm.
Obr. 3: Záťažové I-V krivky pri osvetlení pre štandardné sieťotlačové TiO2 DSSCna FTO/sklo (vľavo), a pre LT systémy na ITO/PET (100 Ω/sq.)
pre rôzne kombinácie nano- a hrubozrnných oxidov (vpravo).
Zbornik1_PA2014_10.indd 81Zbornik1_PA2014_10.indd 81 25. 2. 2014 12:11:1725. 2. 2014 12:11:17
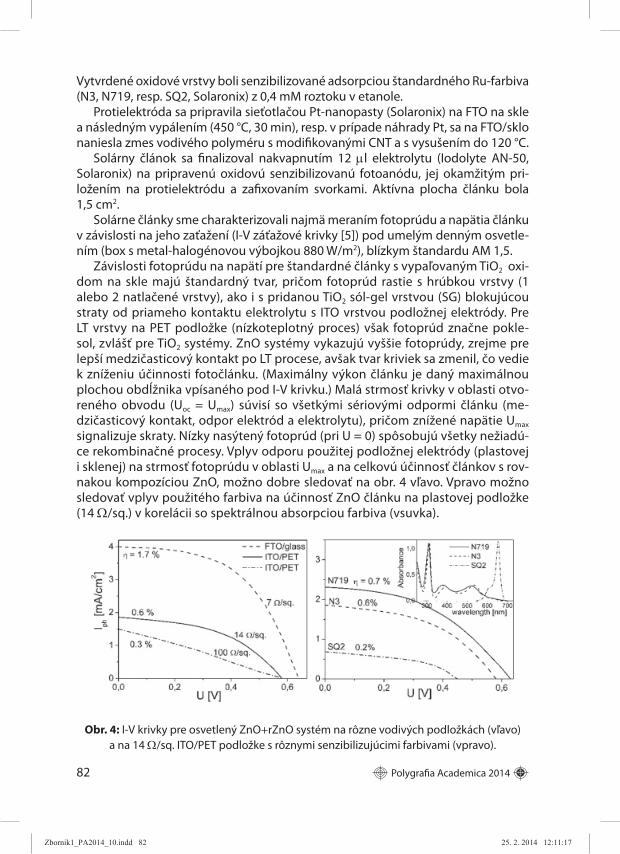
82 Polygrafi a Academica 2014
Vytvrdené oxidové vrstvy boli senzi bilizované adsorpciou štandardného Ru-farbiva (N3, N719, resp. SQ2, Solaronix) z 0,4 mM roztoku v etanole.
Protielektróda sa pripravila sieťotlačou Pt-nanopasty (Solaronix) na FTO na skle a následným vypálením (450 °C, 30 min), resp. v prípade náhrady Pt, sa na FTO/sklo naniesla zmes vodivého polyméru s modifi kovanými CNT a s vysušením do 120 °C.
Solárny článok sa fi nalizoval nakvapnutím 12 μl elektrolytu (Iodolyte AN-50, Solaronix) na pripravenú oxido vú senzibilizo vanú fotoanódu, jej okam žitým pri-ložením na protielektródu a zafi xovaním svorkami. Aktívna plocha článku bola 1,5 cm2.
Solárne články sme charakterizovali najmä meraním fotoprúdu a napätia článku v závislosti na jeho zaťažení (I-V záťažové krivky [5]) pod umelým denným osvetle-ním (box s metal-halogénovou výbojkou 880 W/m2), blízkym štandardu AM 1,5.
Závislosti fotoprúdu na napätí pre štandardné články s vypaľovaným TiO2 oxi-dom na skle majú štandardný tvar, pričom fotoprúd rastie s hrúbkou vrstvy (1 alebo 2 natlačené vrstvy), ako i s pridanou TiO2 sól-gel vrstvou (SG) blokujúcou straty od priameho kontaktu elektrolytu s ITO vrstvou podložnej elektródy. Pre LT vrstvy na PET podložke (nízkoteplotný proces) však fotoprúd značne pokle-sol, zvlášť pre TiO2 systémy. ZnO systémy vykazujú vyššie fotoprúdy, zrejme pre lepší medzičasticový kontakt po LT procese, avšak tvar kriviek sa zmenil, čo vedie k zníženiu účinnosti fotočlánku. (Maximálny výkon článku je daný maximálnou plochou obdĺžnika vpísaného pod I-V krivku.) Malá strmosť krivky v oblasti otvo-reného obvodu (Uoc = Umax) súvisí so všetkými sériovými odpormi článku (me-dzičasticový kontakt, odpor elektród a elektrolytu), pričom znížené napätie Umax signalizuje skraty. Nízky nasýtený fotoprúd (pri U = 0) spôsobujú všetky nežiadú-ce rekombinačné procesy. Vplyv odporu použitej podložnej elektródy (plastovej i sklenej) na strmosť fotoprúdu v oblasti Umax a na celkovú účinnosť článkov s rov-nakou kompozíciou ZnO, možno dobre sledovať na obr. 4 vľavo. Vpravo možno sledovať vplyv použitého farbiva na účinnosť ZnO článku na plastovej podložke (14 Ω/sq.) v korelácii so spektrálnou absorpciou farbiva (vsuvka).
Obr. 4: I-V krivky pre osvetlený ZnO+rZnO systém na rôzne vodivých podložkách (vľavo) a na 14 Ω/sq. ITO/PET podložke s rôznymi senzibilizujúcimi farbivami (vpravo).
Zbornik1_PA2014_10.indd 82Zbornik1_PA2014_10.indd 82 25. 2. 2014 12:11:1725. 2. 2014 12:11:17

Polygrafi a Academica 2014 83
Poďakovanie
Práca bola realizovaná s fi nančnou podporou Vedeckej grantovej agentúry MŠ SR (VEGA 1/0818/13) a Slovenskej technickej univerzity v rámci projektu pre mla-dých výskumníkov (FlexiCell 6436).
3. Literatúra
Krebs, F. C., ed. Polymer photovoltaics. Bellingham, USA, SPIE Press, 2008.1. Chirila, A., Reinhard, P., Pianezzi F. a kol. Potassium-induced surface modifi cation of 2. Cu(In,Ga)Se2 thin fi lms for high-effi ciency solar cells Nature Materials 12, 1107 – 1111 (2013).Chiechi, R. C. a kol. Modern plastic solar cells, Materials Today 16, 281 (2013).3. Li, S. S., Chen, C. W. Polymer metal-oxide hybrid solar cells, J. Mater. Chem. A,1, 10547 4. (2013).Hagfeldt, A., Boschloo, G. a kol. Dye-Sensitized Solar Cells: Chem. Rev. 110, 6595 – 6663 5. (2010).Bui T. T., Goubard F. Recent advances in small molecular, non-polymeric organic hole 6. transporting materials for ssDSSC. EPJ Photovoltaics 4, 40402 (2013).Heo, J., H. a kol. Effi cient inorganic–organic hybrid heterojunction solar cells containing 7. perovskite compound and polymeric hole conductors. Nature Photonics 5, 1 (2013).Burschka J., Pellet N., Gratzel M. a kol. Sequential deposition as a route to high-perfor-8. mance perovskite-sensitized solar cells. Nature 499, 316 – 319 (2013).Gemeiner P., Mikula M. Effi ciency of DSSC with various compositions of screen printed 9. photoactive electrodes. Acta Chimica Slovaca 6 (1), 29 – 34 (2013).
Zbornik1_PA2014_10.indd 83Zbornik1_PA2014_10.indd 83 25. 2. 2014 12:11:1725. 2. 2014 12:11:17

84 Polygrafi a Academica 2014
Analysis of methods appropriate
for polymer substrate ink trapping
Vesna Džimbeg Malčić, Irena Bates, Željka Barbarić-Mikočević
Faculty of Graphic Arts, University of Zagreb, Getaldićeva 2, Zagreb, Croatia,info@grf-hr
Abstract: Flexographic printing technique is a technique with the most frequent application in the fi eld of fl exible packaging due to its recognized property of quick ink drying on non-absorbent substrates. The application of conventional, solvent based, inks is still widely spread at present, however, their replacement with the energy curable inks (UV curable inks) is constantly expanding. The application of these two types of inks enables two methods of printing: wet on wet ink and wet on dry ink. The values of the last ink trap on the previously applied ink are usually determined using the Brunner, Ritz or Preucil method. The mentioned methods were developed with the use of paper as the printing substrate. In this research, ink trapping was tested in respect to the combination of process inks used in fl exography (YMC) and their sequence of printing on a polymer substrate. Densitometric measurement enabled the determination of values which were used in the calculation of trapping in the aforementioned methods. The obtained values of trapping were compared against the image analysis of overlapped patches.
Keywords: fl exographic printing, polymer substrate, solvent based ink, UV curable ink, trapping
1. Introduction
Polymer packaging is a fast growing segment of the packaging industry. Flexographic printing technique is a technique that requires only a soft pressure in order to ensure a reliable transfer of ink from the fl exible printing form. When an ink of low viscosity is used in this technique, it produces good quality multicolour reproductions on polymer (non-absorbent) substrates, which is why this technique has become the mostly frequently used technique in the fi eld of fl exible packaging [1].
Technology and control devices used in the graphic industry are advancing every day with aim of achieving the best quality print. One of the main parameters aff ecting the print quality (gray balance, the colour appearance etc.) is a satisfactory quality of an even alignment of ink to the previous ink.
Ink trapping was observed in multicolour printing when inks were overprinted. A thinner layer of ink was transferred onto an existing layer of ink then onto a blank paper. That was done because the adhesion between the overprinted ink and the underlying wet ink was weaker when compared against the adhesion between an
Zbornik1_PA2014_10.indd 84Zbornik1_PA2014_10.indd 84 25. 2. 2014 12:11:1725. 2. 2014 12:11:17

Polygrafi a Academica 2014 85
ink printed on top of a less wet ink or a completely dry ink. Depending on adhesion and the inner cohesion of inks, the thickness of the second printed ink varied. The ability of the last printed ink to evenly cover previously applied ink is called trapping. The values of trapping depend on the adhesion between inks and the inner cohesion forces of the last printed ink [2]. The percentage of ink trapping describes the diff erence between the values of the layer thickness of the last printed ink when the latter is printed on top of another ink compared to the situation when that same ink is printed on a blank substrate [3].
There are three diff erent methods (Preucil, Ritz, Brunner) for determining trapping. All of them are based on densitometric measurements and were developed by using paper as a printing substrate. A sequence of three measurements always has to be performed for credible results: 1. fi rst printed ink D1; 2. second printed ink D2 and 3. overprint Dop. Whereby the density of the ink (Di) is observed by using another colour fi lter. Trapping values obtained by a colour refl ection densitometer were not absolute measurements, but strongly depend on the characteristics of the colour fi lters actually used.
Preucil’s method is a linear correlation between the trapping value and the density value of the overprint [4, 5] and, because of its simplicity, this method is the most commonly used. The Preucil’s formula (equation 1) is:
T =Dop − D1
D2
× 100 (1)
Ritz’s method is based on the assumption that diff erences in trapping are caused by uneven spreading of the second printed ink. Such a structure of ink layer is similar to that of a screened ink layer, thus Ritz’s formula (equation 2) is described by a modifi ed Murray-Davies-formula [6]:
T =1−10−( Dop −D1 )
1−10−D2× 100 (2)
The Brunner’s method [7], like the one of Ritz, uses a modifi ed Murray-Davies-formula (equation 3):
T =1−10−Dop
1−10−( D1 +D2 ) × 100 (3)
This method reduces the impact of the fi lter characteristics on the measured result.
The purpose of this research is to identify, by using densitometric measurement and image analysis of fl exographic prints, the appropriate method for polymer substrate ink trapping. In the research presented in this paper, the image analysis was used as a control test method.
This paper also describes two printing systems, which were analysed in the research: a conventional printing system, where the solvent based inks are used and a contemporary printing system, where energy curable inks (UV curable inks) are used. In the conventional printing system, inks are printed using the wet on wet
Zbornik1_PA2014_10.indd 85Zbornik1_PA2014_10.indd 85 25. 2. 2014 12:11:1725. 2. 2014 12:11:17

86 Polygrafi a Academica 2014
method, while the system with UV curable inks, uses wet on dry ink method in the printing.
2. Methods and materials
This paper presents analysis performed on white coloured biaxially oriented polypropylene (BOPP) LWD 38. The surface energy of a polymer material after its corona treatment varied between 38 and 40 mJ/m2. The characteristics of a polymer material are presented in Table 1.
Tab. 1: Characteristics of BOPP.
Characteristics PP
Thickness (μm) 38
Density (g/cm2) 0.62
Elongation (%) machine direction (MD)The opposite direction of the machine (CD)
12030
Maximum shrinkage (%) machine direction (MD)The opposite direction of the machine (CD)
<8<4
Sample printing was performed under realistic conditions using fl exo-graphic machines with same printing plates. Printing was done at a speed of150 m/min. The screen angle on the used anilox rolls was 60°. When printing with solvent based inks, the used anilox roll had screen resolution of 400 lpcm for cyan, magenta, yellow and black ink, whereby the cell volumes varied in size between 4.8 and 5.5 cm3/m2. When printing with UV curable inks, the anilox roll had screen resolution of 405 lpcm for cyan, magenta, yellow and black ink, and the cell volumes varied in size between 3.1 and 4.2 cm3/m2. Kinematic viscosity of solvent based inks was 74–85 cSt according to DIN 4, at 20 °C, based on standard DIN 53211. The viscosity of UV curable inks was 189–275 cP according to Brookfi eld, at 25 °C.
Determining of a parameter trapping or ink acceptance was done on prints using fours fi elds with dimensions 15 × 32 mm. The fi rst three fi elds were printed with full tones of two inks (Y+M, Y+C, M+C), while the fourth one was printed with a full tone of the yellow, cyan and magenta.
The image analysis was performed using the programme ImageJ and plugin “RGB to CMYK” [8]. This plugin is based on subtractive synthesis [1]. The use of this plugin enabled the transfer of images obtained by the optical microscope with camera Leica EZ4D (enlargement 35×) into CMYK colour space. The obtained image was subsequently divided into images of individual inks. Using the image analysis, the percentage of the overall area covered with the last printed ink was determined in the image of the last printed ink.
Densitometric measurements were made using an X-rite Spectrophotometer, SpectroEye. This paper presents the method for measuring refl ectivity employing
Zbornik1_PA2014_10.indd 86Zbornik1_PA2014_10.indd 86 25. 2. 2014 12:11:1725. 2. 2014 12:11:17

Polygrafi a Academica 2014 87
d/0° geometry (illuminate D65), without polarisation fi lter with the instrument set to measure on 2° standard observers. Each sample was measured 10 times, and the results were calculated by Data Analysis and Technical Graphics OriginPro 8.5.
3. Results and discussion
From densitometric measurements (Table 2) trapping values throught Preucil (eq. 1), Ritz (eq. 2) and Brunner (eq. 3), methods were calculated.
Tab. 2: Densitometric values of full tones.
Di Solvent Based inks UV curable inks
C 1.31 1.38
M 1.61 1.28
Y 1.30 1.30
Y+M Y+C
Solvent Based ink UV curable ink Solvent Based ink UV curable ink
M+C Y+M+C
Solvent Based ink UV curable ink Solvent Based ink UV curable ink
Fig. 1: Images of the last printed ink obtained by image analysis.
The obtained values of trapping (Figure 2) obtained by Preucil method cover a wide range of values considering the measured fi elds in respect to both types of inks. Trapping values obtained with this method vary between 91.39 and 112.26 % for samples printed with solvent based inks and between 93.12 and 101.30 % for samples printed with UV curable inks. In both types of prints, trapping values calculated according to Ritz method contain minor variations considering the measured fi eld (from 99.02 do 101.56 % in case of samples printed with solvent based inks and from 99.17 to 100.18 % in case of prints made with UV curable inks). The application of Brunner method resulted in very similar values in all samples.
Zbornik1_PA2014_10.indd 87Zbornik1_PA2014_10.indd 87 25. 2. 2014 12:11:1725. 2. 2014 12:11:17
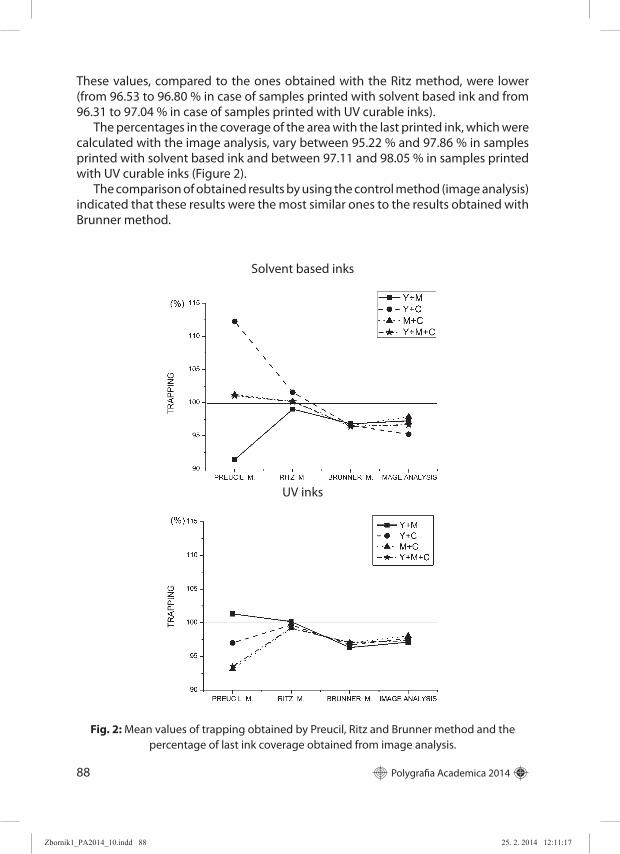
88 Polygrafi a Academica 2014
These values, compared to the ones obtained with the Ritz method, were lower (from 96.53 to 96.80 % in case of samples printed with solvent based ink and from 96.31 to 97.04 % in case of samples printed with UV curable inks).
The percentages in the coverage of the area with the last printed ink, which were calculated with the image analysis, vary between 95.22 % and 97.86 % in samples printed with solvent based ink and between 97.11 and 98.05 % in samples printed with UV curable inks (Figure 2).
The comparison of obtained results by using the control method (image analysis) indicated that these results were the most similar ones to the results obtained with Brunner method.
Solvent based inks
UV inks
Fig. 2: Mean values of trapping obtained by Preucil, Ritz and Brunner method and the percentage of last ink coverage obtained from image analysis.
Zbornik1_PA2014_10.indd 88Zbornik1_PA2014_10.indd 88 25. 2. 2014 12:11:1725. 2. 2014 12:11:17

Polygrafi a Academica 2014 89
4. Conclusions
The research presented in this paper proved that values for the ink trapping could be most precisely determined by using Brunner method in case of polymer substrates
Likewise, it also proved simillar trapping values for the printing process based on the principle “wet on wet ink” (prints with solvent based inks) and for “wet on dry ink” (prints with UV curable inks). Based on this research, it is recommended that an image analysis is used as a control method along with the use of densitometric measurements.
The research presented in this paper was focused to one type of non-absorbent substrates, so our further research activities will be based on testing these presented methods in relation to other types of non-absorbent substrates (Al foil, PVC, LDPE etc.).
5. References
1. Kipphan, H. 2001. Handbook of Print Media. Berlin: Springer, 395–398p. ISBN 978-3-540-67326-2.
2. Hauck, S., Gooran, S. 2011. An Alternative Computational Method of Trapping for the Print Machine Operators, Proceedings TAGA (Technical Association of the Graphic Arts). Sewickley: Technical Association of the Graphic Arts, pp. 363–373. ISBN 978-1-935185-03-1.
3. Field, G. G. 1999. Color and its reproduction. 2nd edition. Sewickley: GAFTPress. ISBN 13: 978-0883620885.
4. Preucil, F. 1953. Color Hue and Ink Transfer – Their Relations to Perfect Reproduction, Proceedings TAGA (Technical Association of the Graphic Arts)
5. Rochester: Technical Association of the Graphic Arts, pp.102–110.6. Preucil, F. 1958. Color and Tone errror of Multicolor Presses, Proceedings TAGA (Technical
Association of the Graphic Arts). Rochester: Technical Association of the Graphic Arts, pp.175–190.
7. Ritz, A. 1996. A Haltfone Treatment for Obtaining Multi-Color Ink Film Trapping Values, Professional Printer, Vol.40, No. 6, pp.11–17.
8. Stanton, A., Radencic, G. 2001. Ink Trapping and Colorimetric Variation, Proceedings TAGA (Technical Association of the Graphic Arts). San Diego: Technical Association of the Graphic Arts, pp. 258–281.
9. Saalfeld S., Rasband W. 2010. ImageJ, [cit. 2011-11-20]. Available on internet: <http://rsbweb.nih.gov/ij/plugins/cmyk/index.html>.
Zbornik1_PA2014_10.indd 89Zbornik1_PA2014_10.indd 89 25. 2. 2014 12:11:1725. 2. 2014 12:11:17

90 Polygrafi a Academica 2014
Chování potištěných biodegradabilních materiálů
při kompostování
Veronika Tkáčová, Jiří Hejduk
Univerzita Pardubice, Fakulta chemicko-technologická,Katedra polygrafi e a fotofyziky, Studentská 95, 532 10 Pardubice,
Abstract: This paper presents an overview of biodegradable materials in form of thin foils used nowadays. They are based on starch, cellulose and polylactide. After a surface treatment, foils were printed by laboratory fl exographic printing press using conventional solvent inks, biodegradable solvent inks and by UV curable inks. Printed pattern consisted of solid areas and line areas with total coverage of 30 %. The prints were afterwards placed in to the box with compost. The degradation of printed foils was studied over time and the results were evaluated.
Keywords: biodegradation, compost, biopolymer, biodegradable ink
1. Úvod
V dnešní době se v obalovém průmyslu stále častěji setkáváme s biodegrada-bilními materiály. Většímu využití těchto materiálů brání jejich vyšší cena, mají však nesporné výhody, pro které se používají. Biodegradabilní materiály mají velmi po-dobné vlastnosti jako konvenční plasty, jsou dostatečně pevné, dají se různě tvaro-vat a upravovat, mají i postačující životnost. K rozkladu biodegradabilních materi-álů dochází pouze při dodržení určitých podmínek, které mohou nastat například při kompostování.
Biodegradabilní materiály se často používají pro zhotovování fólií, které slouží k výrobě fl exibilních obalů. Flexibilní obaly se potiskují různými tiskovými techni-kami, nejčastěji fl exotiskem. Proto i my jsme pro potisk různých biodegradabilních fólií zvolili tuto tiskovou techniku.
2. Experimentální část
2.1. Použité materiály
Od různých výrobců a distributorů byly získány vzorky nejčastěji používaných biodegradabilních materiálů ve formě fólií. Fólie byly zhotoveny na bázi celulózy, škrobu a polymeru kyseliny mléčné. Nashromážděné vzorky byly již u výrobce po-vrchově upraveny koronou pro tisk. Přehled získaných fólií, včetně dalších údajů, je uveden v tabulce 1. Pro snadnější porovnání byly pro experiment vybrány fólie s podobnou tloušťkou.
Zbornik1_PA2014_10.indd 90Zbornik1_PA2014_10.indd 90 25. 2. 2014 12:11:1725. 2. 2014 12:11:17

Polygrafi a Academica 2014 91
Tab. 1: Přehled použitých biodegradovatelných fólií.
Název materiálu Výrobce/dodavatelSpecifi kace
materiálu
Tloušťka
[μm]
Plošná
hmotnost
[g/m2]
NatureFlexTMNMNatureFlexTMNVRNatureFlexTMNP
Mater-Bi®
Envira®
Bio-Flex®
InnoviaFilmsInnoviaFilmsInnoviaFilmsNovamontTart, s. r. o.
FKuR Kunststoff GmbH
celulózacelulózacelulóza
škrobškrob
kys. mléčná
23,323,322,620,225,125,0
33,533,532,524,035,230,1
Pro potisk výše uvedených fólií byly vybrány tři druhy tiskových barev, které jsou uvedeny v tabulce 2. Tyto barvy se běžně používají pro tisk na polymerní fólie, jsou to barvy vytvrzované UV zářením, standardní rozpouštědlové barvy a rozpouště-dlové barvy doporučené pro potisk biodegradabilních fólií. Barvy byly podle tech-nických specifi kací upraveny na potřebnou konzistenci.
Tab. 2: Přehled použitých tiskových barev.
Typ barvy Název Výrobce
Barva vytvrzovaná UV zářenímRozpouštědlová barva
Biodegradabilní rozpouštědlová barva
SolarFlexSiquafl exo
Saga
SunChemicalCIVEST GroupSunChemical
2.1. Metody
Tisk na fólie byl proveden na fl exotiskovém nátiskovém stroji FlexoProofer F.P. 100/300 (výrobce Saueressig GmbH & Co). Pro tisk byly zhotoveny dvě tiskové for-my. Pryžová pro tisk plné plochy a fotopolymerní linková, kde tisknoucí linky před-stavovaly 30% pokrytí fólií tiskovou barvou.
Stroj tiskl rychlostí 10 m/min z aniloxového válce s hustotou 100 jamek/cm a o obsahu jamek 4,2 cm3/m2. Pro sušení rozpouštědlových barev byl použit horko-vzdušný ventilátor, teplota sušení byla 50 °C. UV barva byla vytvrzena pomocí UV lampy Aerotherm UVM s výkonem 120 W/cm. Jak sušící, tak vytvrzovací zařízení je součástí tiskového stroje.
Z potištěných fólií byly nařezány stejně velké vzorky, které byly uloženy do truh-líků s kompostem na perlinkové podložky, jak je ukázáno na obrázku 1. Pro snad-nou manipulaci při kontrole vzorků byly z perlinky zhotoveny košíčky, které se zvr-chu položily na vzorky a naplnily kompostem. Stav vzorků byl kontrolován každý týden, při kontrole většinou došlo ke zničení vzorků. Proto muselo být připraveno velké množství stejných vzorků, aby bylo možné sledovat rozpad fólií delší dobu.
Pro dosažení optimální vlhkosti potřebné pro rozpad fólií bylo do každého truhlí-ku přidáno 150 ml vody. Aby nedocházelo k odpařování vody a k vysychání kompos-
Zbornik1_PA2014_10.indd 91Zbornik1_PA2014_10.indd 91 25. 2. 2014 12:11:1725. 2. 2014 12:11:17

92 Polygrafi a Academica 2014
tu, byl každý truhlík zabalen do strečové fólie. Všechny takto připravené vzorky byly umístěny do místnosti temperované na 31 °C. Každý týden byla prováděna kontrola určitého množství truhlíků, stav rozpadu fólií byl sledován a dokumentován.
Při sledování průběhu rozpadu fólií byla snaha stanovit hmotnostní úbytek nebo měřit změnu pevnosti v tahu. Žádná z těchto metod neposkytla uspokojivé výsled-
Obr. 1: Uložení vzorků potištěných fólií v truhlících.
Obr. 2: Příklad sledování rozpadu materiálu NatureFlexTM NVR potištěnéhorozpouštědlovou barvou (dva levé vzorky), rozpouštědlovou barvou
(dva prostřední vzorky) a barvou vytvrzovanou UV zářením(dva pravé vzorky) na začátku experimentu, po 7, 14 a 35 dnech.
Zbornik1_PA2014_10.indd 92Zbornik1_PA2014_10.indd 92 25. 2. 2014 12:11:1725. 2. 2014 12:11:17

Polygrafi a Academica 2014 93
ky, Tyto údaje bylo možné sledovat pouze po dobu, kdy fólie byly celistvé, po krátké době však došlo k rozpadu vzorků a nebylo možné v tomto sledování pokračovat. Vhodnou metodou vyhodnocení rozpadu byla fotografi cká dokumentace vzorků, která byla prováděna s týdenním odstupem. Při hodnocení získaných snímků velmi pomohla pravidelná struktura perlinky, z které bylo možné vyčíslit stupeň rozpadu fólií. Na obrázku 2 je uveden příklad zkrácené dokumentace rozpadu biodegrada-bilní fólie NatureFlexTM NVR.
3. Výsledky a diskuze
Při provádění experimentu se předpokládalo, že fólie které jsou potištěny tis-kovými barvami se při kompostování rozkládají pomaleji než fólie nepotištěné.
Obr. 3: Časová řada rozpadu fólie NatureFlexTM NM potištěné barvou vytvrzovanouUV zářením SolarFlex se 30 a 100% pokrytím.
Obr. 4: Časová řada rozpadu fólie NatureFlexTM NVR potištěné barvou vytvrzovanou UV zářením SolarFlex se 30 a 100% pokrytím.
Zbornik1_PA2014_10.indd 93Zbornik1_PA2014_10.indd 93 25. 2. 2014 12:11:1825. 2. 2014 12:11:18

94 Polygrafi a Academica 2014
Protože jsou fólie z jedné strany pokryty barvou, měla by tato vrstva mít vliv na zpomalení rozpadu fólií, doba kompostování by se měla prodloužit.
Jak je patrné z obrázku 3, průběh rozpadu fólie NatureFlexTM NM potištěné bar-vou vytvrzovanou UV zářením SolarFlex odpovídá danému předpokladu. Rozpad čisté fólie je rychlejší než rozpad fólie pokryté barvou ze 30 % a o to rychlejší než rozpad fólie potištěné barvou v plné ploše. Podobné výsledky byly získány u vzor-ků fólií potištěných rozpouštědlovou barvou a biodegradabilní rozpouštědlovou barvou.
Ne u všech vzoků se však projevila tato závislost. U některých fólií potištěných barvami vytvrzovanými UV zářením byly získány jiné časové řady. Takový případ je uveden na obrázku 4, kde byla použita fólie NatureFlexTM NVR. Lze předpokládat, že v tomto případu se projevuje do značné míry vliv UV záření na fólii. Vlivem toh-to záření došlo k částečnému narušení fólie a následně k rychlejšímu rozpadu při kompostování. Je zde také patrný mírný zpomalovací vliv barvy v plné ploše oproti 30% pokrytí.
4. Závěry
Pro experiment byly získány vzorky fólií, které představují tři základní skupiny biodegradabilních materiálů na bázi škrobu, celulózy a polymeru kyseliny mléčné. Tyto fólie byly upraveny pro tisk pomocí koronového výboje. Při tisku se tyto ma-teriály daly velmi dobře potisknout všemi třemi vybranými typy tiskových barev, nános barev byl rovnoměrný s dobrou přilnavostí k substrátu.
Při tisku ředidlovými barvami je třeba dbát na správnou teplotu sušení. Při pře-kročení teploty může dojít u těchto fólií k rozměrové nestálosti materiálu, může se kroutit a vytvářet faldy. Čím tenčí materiál, tím větší nebezpečí výskytu těchto ne-dostatků. Ještě složitější situace je při vytvrzování barev pomocí UV záření. Kromě tepla působí na fólie též UV záření, které způsobuje u některých typů fólií částečné narušení biodegradovatelného materiálu. Toto narušení se projeví rychlejším roz-padem při kompostování. Především u tenkých fólií se musí dbát na šetrné nasta-vení UV zářiče, při vyšším výkonu zářiče dochází ke značnému poškození zpracová-vané fólie přímo v tiskovém stroji. Vliv UV záření na pevnost fólií a rychlost rozpadu je nutné sledovat a zpracovat v další práci.
Podle předpokladu nánosy obou dvou rozpouštědlových barev a barvy vytvrzo-vané UV zářením zpomalují rozpad biodegradabilních fólií. Vliv rozpouštědlových barev je menší než vliv barev vytvrzovaných UV zářením. Proces rozpadu lze čás-tečně urychlit tím, že tisk není proveden v plné ploše, ale plocha je záměrně naru-šena například linkami nebo nepotištěnými body. Rozdíl mezi rozpouštědlovými barvami klasickými a biodegradabilními z hlediska potisku fólií a následného roz-padu v kompostu prakticky není. Biodegradabilní barvy mají pouze snížený obsah škodlivých látek na minimum, což se promítá do kvality kompostu.
Biodegradabilní fólie se v polygrafi cké praxi používají málo, řada tiskáren nemá s těmito materiály zkušenosti, proto si myslíme, že uvedená práce může být pro ně přínosem.
Zbornik1_PA2014_10.indd 94Zbornik1_PA2014_10.indd 94 25. 2. 2014 12:11:1825. 2. 2014 12:11:18

Polygrafi a Academica 2014 95
5. Literatůra
Tichý, F. 2009. Obalové fólie z biodegradabilních plastů. Svět balení, roč. 3, č. 1.1. Dočkal, M. 2013. Sporná současnost obalových bioplastů. Svět balení, roč. 7, č. 5 – 6.2. Stloukal, P., Koutný, M. 2010. Biodegradabilní plasty: současnost a perspektivy. In 3. Průmyslová ekologie: sborník konference, 24. — 26. března 2010, Žďár nad Sázavou, 1. vyd. Chrudim, Vodní zdroje Ekomonitor, 2010. ISBN 978-80-86832-50-0.Prokopová, I. Předpona bio- a zmatení jazyků: Bioplasty — základní defi nicea standardy. 4. Konference BioObaly. Praha, 24. dubna 2012.ČSN 465735. 1991. Průmyslové komposty. Praha: Vydavatelství norem5. Brožek, J. Biologicky rozložitelné polymery a jejich vlastnosti. Konference BioObaly. 6. Praha, 25. dubna 2012.ČSN EN 13432. 2001. Obaly: Požadavky na obaly využitelné ke kompostování a biodegra-7. daci. Praha: Český normalizační institut.
Zbornik1_PA2014_10.indd 95Zbornik1_PA2014_10.indd 95 25. 2. 2014 12:11:1825. 2. 2014 12:11:18

96 Polygrafi a Academica 2014
New trends in fl exographic printing forms
production
Daniel Javorský
Chemosvit Folie, a. s., Štúrova 101, 059 21 Svit, [email protected]
Abstract:new ways of preparing image data– fl at top dot technologies used on fl exographic printing forms– benefi ts of using– these technologies in the fi eld of fl exible foil packaging materials
Key words: fl exography, printing forms
1. Introduction
CHEMOSVIT FOLIE is the biggest of the Chemosvit’s companies. Their business line includes the production, converting and sales of packaging materials. They employ 912 people.
2. Technological processes
Film production:– blown PE fi lmso cast fi lms based on PE, PP, PAo
Pre-press:– complete processing of graphic data for off set, fl exoprinting and rotogravure o printing production of printing forms for rotogravure and fl exoprinting o
Film converting:– metallizationo fl exo printing using up to 10 colourso rotogravure printing using up to 11 colours, cold seal option, printing of o unique codeslamination based on solvent and solvent-free adhesiveso slittingo production of bags and poucheso
Technological innovations
Printing press technologies being developed for hundreds of years. Many of today’s industries are built on their functionality. Mainly for printing and converting
Zbornik1_PA2014_10.indd 96Zbornik1_PA2014_10.indd 96 25. 2. 2014 12:11:1825. 2. 2014 12:11:18

Polygrafi a Academica 2014 97
of fl exible packaging fi lms are the most used gravure technology, fl exography, off set printing and digital printing already.
All the above mentioned technologies have their original characteristics, but all continue in strong development. This contribution deals with the development and improvement in one of these technologies, namely fl exography. Quality base printing forms are absolutely necessary. Developing them we can achieve visible improvement of production and the commercial success compared to other technologies.
Standard digital dot formation
Fig. 1: Standard digital dot formation.
Oxygen inhibition– Dot sharpening (bullet shape dot)o Dot recessiono
Plate inking and plate impression not consistent across plate– Impression (anilox, print) needs to be optimized for best print – Wastes time, – materials
Flat top dot formation
Fig. 2: Flat top dot formation.
Zbornik1_PA2014_10.indd 97Zbornik1_PA2014_10.indd 97 25. 2. 2014 12:11:1825. 2. 2014 12:11:18

98 Polygrafi a Academica 2014
No Oxygen– Solids and Highlights are at the same heighto 1:1 copy of the digital datao
Kiss impression– Faster press setupo
Print Performance improvementssmaller printed dot– less impression– reduced mechanical dot gain–
Smaller printed dot:Expands printed gamutReduces hard edgeSmoothes fade to zero, vignettes
Consistency: eff ects of impression
Print consistency improvementsmore consistent dot gain during long run– runs cleaner–
Statements from print productionFaster press setup time–
highlight dots and solids are at the same heighto Increased line screen–
better support of fi ne highlight dots and fi ne detailo Smoother vignettes– Higher contrast– Crisp & clean print–
Flat top dot Technologies:LUX – Mac Dermid – lamination technology
Fig. 3: eff ects of diff erent level of impression.
Zbornik1_PA2014_10.indd 98Zbornik1_PA2014_10.indd 98 25. 2. 2014 12:11:1825. 2. 2014 12:11:18

Polygrafi a Academica 2014 99
Flexcel NX – Kodak – lamination technologyDigiFlow – Dupont – controlled atmosphereNext – Flint Group – UV LEDFullHD – ESKO – UV LED
Why fl at top dots and surface screening?
Compared with round shape dots, from traditionally imaged digital plates, fl at top dots, with precisely reproduced surfaces, provide all the benefi ts linked to this geometry:
Tremendous improvement of ink transfer and laydown in solids, up to 25 %– Extended gamut due to the reproduction of fi ner highlights– Low dot gain tolerances – “Flat Top Dots” are less impression sensitive– Virtually 1:1 image transfer–
Important Information!Anilox rollers– Ink type– Ink viscosity– Substrate– Tape–
Fig. 4: Surface screening examples.
Fig. 5: Application of surface screening.
Zbornik1_PA2014_10.indd 99Zbornik1_PA2014_10.indd 99 25. 2. 2014 12:11:1825. 2. 2014 12:11:18
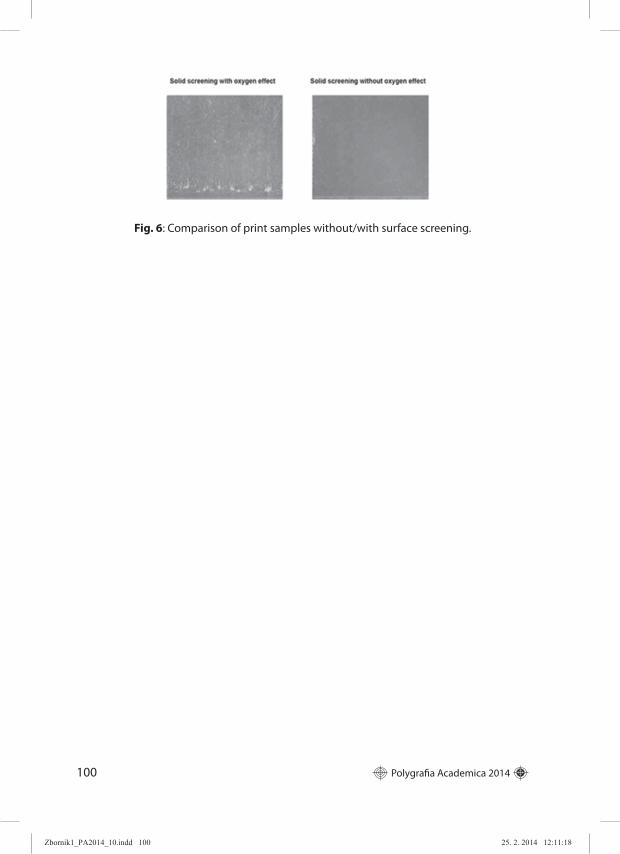
100 Polygrafi a Academica 2014
Fig. 6: Comparison of print samples without/with surface screening.
Zbornik1_PA2014_10.indd 100Zbornik1_PA2014_10.indd 100 25. 2. 2014 12:11:1825. 2. 2014 12:11:18

Polygrafi a Academica 2014 101
Surface roughness analysis of conventional
fl exo printing plate in dependence
of developing and light fi nishing phase
Sandra Dedijer, Magdolna Pal, Živko Pavlović, Dragoljub Novaković
University of Novi Sad, Faculty of Technical Sciences,Department of Graphic Engineering and Design,
Trg Dositeja Obradovica 6, 21 000 Novi Sad, Serbia, [email protected]
Abstract: This study represents evaluation of changes in surface roughness of solid tone area on conventional fl exo printing plate. The aim was to determine whether the surface roughness parameters, when diff erent processing parameters are applied (diff erent developing speed and diff erent light fi nishing time) statistically signifi cantly diff er. The experiment was conducted using conventional fl exo printing plate 1.14 mm thick. Direct profi lometric method was applied for measuring Ra – average value of the absolute profi le’s data inside an evaluation length. Statistical analysis of arithmetic average of absolute roughness values will indicate impact of processing parameters on overall surface roughness of solid tone areas on investigated conventional fl exo printing plate. The surface roughness was evaluated relative to developing direction (measuring were done in longitudinal and transverse directions). A 22 factorial experiment was used with two replicas and two center points in order to indicate a dominant, statistically signifi cant infl uence and to enable model to evaluate possible nonlinearity eff ects.
Keywords: surface roughness, fl exo printing plate, 22 factorial experiment.
1. Introduction
Flexography is a direct printing technique which uses fl exible printing plate in order to provide high quality imprints on a variety of substrates. Highly demandable graphic arts industry market has no tolerances for negative fl uctuations in imprint quality. Thus, there is constant research in the fl exographic printing plate domain since it is highly important to achieve imprints of stable, high quality. One of the parameters which are in focus having direct infl uence on fi nal imprint quality is the surface topography of the printing plate. The analyses of surface topography give relevant information to make possible prediction of behaviour of the fl exo plate surface during printing process [1]. In order to quantify the topography of material surfaces the one can use profi lometric methods, like MSP-mechanical stylus contact profi lometry or non–contact laser profi lometry or diff erent imaging methods such as SEM (Scanning Electron Microscopy) or AFM method (Atomic Force Microscopy) [2].
Zbornik1_PA2014_10.indd 101Zbornik1_PA2014_10.indd 101 25. 2. 2014 12:11:1825. 2. 2014 12:11:18

102 Polygrafi a Academica 2014
Contact profilometry was proposed several decades ago. Standard profilometric techniques for assessing surface roughness measure directly the peaks and the valleys on the surface [3]. Displacements of measuring unit (sharp diamond tip) induced by surface irregularities are recorded for a given specimen, where several test lines need to be measured and averaged [3, 4]. There are many roughness parameters which can be used for the surface characterization, but they are all influenced by the same factors: instrument type, instrument settings, the post processing of measured data and the microstructure of the measured surface [5]. Average surface roughness – Ra
is one of the most commonly used parameters in order to quantify surface topography. Ra is the arithmetic mean of the absolute values of profile deviation of mean within sampling length.
When it comes to conventional fl exo printing plates, the factors infl uencing surface roughness are main exposure time, developing speed and post exposure/light fi nishing time [4, 6, 7] meaning that inadequate exposure time or developing speed will lead to too low or too high surface roughness of the printing plate. Moderate surface roughness of fl exo printing plate is highly desirable since it enables optimal ink transfer from the printing plate to the printing substrate thereby desirable end product quality. But the excessive roughness of the solid areas cause low solid ink density due to failure to make contact between the printing plate surface and a given substrate [6]. In this study, two production parameters were varied: developing speed and light fi nishing time in order to establish signifi cance of theirs infl uence on the arithmetic average of the roughness profi le (Ra) of solid tone areas on fl exo printing plate.
2. Materials and methods
For the purpose of this study, a conventional 1.14 mm thick fl exographic printing plate (ACE, Flint group) with solvent processing was used. The processing of specimens was done on Nylofl ex Combi F1 Super device. Back exposure, main exposure and post exposure time were unchanged during experiment and they were 45 seconds, 20 minutes and 10 minutes, respectively. The varied parameters were developing speed and light fi nishing time. According to used 22 factorial experiment, two replicas and two centre points were needed (table 1).
Tab. 1: Values of varied parameters.
Factor Unit Low (–1) Centre (0) High (+1)Developing speed (A) [mm/min] 225 230 235Light fi nishing time (B) [min] 40 60 80
The measurements were done on solid tone areas on the fl exo printing plates in longitudinal and transverse directions where longitudinal direction is parallel to developing direction. Each specimen was measured fi ve times and average values
Zbornik1_PA2014_10.indd 102Zbornik1_PA2014_10.indd 102 25. 2. 2014 12:11:1825. 2. 2014 12:11:18

Polygrafi a Academica 2014 103
were used for statistical data processing. The measurement’s parameters were: sampling length 0.80 mm, traversing speed 0.135 mms–1, Gauss fi ltering method and resolution 0.01 μm compatibility with ISO 4287 standard.
3. Results and discussion
The results of 22 factorial experiment, using two replicates for corner and centre points, are presented on fi gures 1 and 2. Residual plots for Ra (fi gures 1a and 2a) indicate that model satisfi es necessary assumptions for statistical evaluation (normal distribution, constant variance, having no extreme values, and order of observations is not infl uencing the results).
Analysis of variance (ANOVA) for Ra measured in transverse direction is given in table 2. According to results presented, there is statistically signifi cant infl uence of developing speed, light fi nishing time as well as their interaction (p < 0.05) on Ra, where light fi nishing time has dominant, statistically signifi cant infl uence (p < 0.01).
Tab. 2: Analysis of Variance for Ra (transverse).
Source DF Seq SS Adj SS Adj MS F P
Main Eff ects 2 0.00385281 0.00385281 0.0019264 12.31 0.008
Speed 1 0.00097240 0.00097240 0.0009724 6.21 0.047
Time 1 0.00288041 0.00288041 0.0028804 18.41 0.005
2-Way Inter. 1 0.00100801 0.00100801 0.0010080 6.44 0.044
Speed*Time 1 0.00100801 0.00100801 0.0010080 6.44 0.044
Residual Error 6 0.00093885 0.00093885 0.0001565
Curvature 1 0.00029921 0.00029921 0.0002992 2.34 0.1877
Pure Error 5 0.00063964 0.00063964 0.0001279
Total 9 0.00579966
Statistical signifi cance of developing speed and light fi nishing time as well as their interaction on surface roughness parameter Ra is graphically presented by Pareto chart of standardised eff ects and Interaction plot (fi gure 1b and 1c), while Main eff ects plot illustrates their eff ects indicating relative infl uences. Since there is no statistically signifi cant infl uence of curvature (p > 0.05), it might be assumed that surface roughness is linearly dependant of analyzed infl uencing parameters, but according to Main eff ects plot, there is still visible deviation of central points relative to corner (factor) points. Given results also indicates that increasing developing speed results in notably decreasing average surface roughness, while increasing light fi nishing time results in notably increasing average surface roughness.
ANOVA results for parameter Ra measured in longitudinal direction are given in table 3. According to results presented in table 3, there is dominant, statistically signifi cant infl uence of developing speed (p < 0.01) on surface roughness, while there is no statistically signifi cant infl uence of light fi nishing time and their
Zbornik1_PA2014_10.indd 103Zbornik1_PA2014_10.indd 103 25. 2. 2014 12:11:1825. 2. 2014 12:11:18

104 Polygrafi a Academica 2014
interaction (p > 0.05). Pareto chart given in fi gure 2b confi rms analyzed signifi cance of developing speed on arithmetic average of the roughness profi le. Main eff ects plot (fi gure 2c) points out that increase in developing speed has exceptionally clear infl uence on decrease of Ra, while increase in light fi nishing time results in slight decrease of Ra value. Since there is expressed deviation of central points relative to corner points and signifi cant infl uence of curvature (p < 0.01, table 2), it can be stated that there is signifi cant nonlinearity eff ect.
Fig. 1: Results of statistical analysis (transverse): a) residual plots, b) Pareto chartof the standardised eff ects, c) Interaction plots, d) Main eff ects plot.
Tab. 3: Analysis of Variance for Ra (longitudinal).
Source DF Seq SS Adj SS Adj MS F P
Main Eff ects 2 0.0082078 0.0082078 0.0041039 23.70 0.003
Speed 1 0.0081026 0.0081026 0.0081026 46.79 0.001
Time 1 0.0001051 0.0001051 0.0001051 0.61 0.471
2-Way Inter. 1 0.0001328 0.0001328 0.0001328 0.77 0.421
Speed*Time 1 0.0001328 0.0001328 0.0001328 0.77 0.421
Curvature 1 0.0049151 0.0049151 0.0049151 28.38 0.003
Residual Error 5 0.0008658 0.0008658 0.0001732
Pure Error 5 0.0008658 0.0008658 0.0001732
Total 9 0.0141215
Zbornik1_PA2014_10.indd 104Zbornik1_PA2014_10.indd 104 25. 2. 2014 12:11:1925. 2. 2014 12:11:19

Polygrafi a Academica 2014 105
4. Conclusions
This paper analyzes the infl uence of developing speed and light fi nishing time on the arithmetic average of the roughness profi le (Ra) on solid tone areas of conventional fl exo printing plate. The 22 factorial experiment was conducted on results obtained using direct profi lometric measuring method where Ra parameter values were measured in longitudinal and transverse directions relative to developing direction. In both cases, it can be concluded that increasing developing speed results in decreasing average surface roughness, while increasing light fi nishing time results in increasing average surface roughness. For the measuring obtained in transverse direction, statistically signifi cant infl uence was denoted for both factors, as well as their interaction. For the measuring conducted in longitudinal direction, statistically signifi cant infl uence was denoted only for developing speed. Expressed deviation of central points relative to corner points and signifi cant infl uence of curvature pointed on the signifi cant nonlinearity eff ect indicating that further investigations should be done using three level factorial experiment (23) in order to get deeper insight in Ra dependence of two main eff ects – developing speed and light fi nishing time. The same research should be also extended on wider range of conventional fl exo printing plates.
Fig. 2: Results of statistical analysis (longitudinal): a) residual plots,b) Pareto chart of the standardised eff ects, c) Main eff ects plot.
Zbornik1_PA2014_10.indd 105Zbornik1_PA2014_10.indd 105 25. 2. 2014 12:11:1925. 2. 2014 12:11:19
106 Polygrafi a Academica 2014
Acknowledgement
This work was supported by the Serbian Ministry of Science and Technological Development, Grant No.: 35027 “The development of software model for improvement of knowledge and production in graphic arts industry”.
5. References
1. Barros, G. G., Fahlcrantz, C. M., Johansson, P.A. 2005. Topographic distribution of uncovered areas (UCA) in full tone fl exographic prints, TAGA Journal, vol. 2, no. 1, pp. 43–57.
2. Risović, D., Mahović-Poljaček, S., Gojo, M. 2009. On correlation between fractal dimension and profi lometric parameters in characterization of surface topographies, Applied Surface Science, vol. 255, no. 7, pp. 4283–4288.
3. Chappard, D., Degasne, I., Huré, G., Legrand, E., Audran, M., Baslé, M. F. 2003. On image analysis measurements of roughness by texture and fractal analysis correlate with contact profi lometry, Biomaterials, vol. 24, no. 8, pp. 1399–1407
4. Dedijer, S., Novaković, D. 2010. Determination of surface roughness factors of solid printing areas on diff erent fl exo printing plates, Proceedings of International Symposium on Novelties in Graphics, Ljubljana, Slovenia, pp. 806–812.
5. Ramon-Torregrosa, P. J., Rodríguez-Valverde, M. A., Amirfazli, A., Cabrerizo-Vílchez, M. A. 2008. Factors aff ecting the measurement of roughness factor of surfaces and its implications for wetting studies”, Colloids and surfaces a: physicochemical and engineering aspects, vol.323, no.1, pp. 83–9.
6. Choi, J., O’Brate, K. 2010. Method of Controlling Surface Roughness of a Flexographic Printing Plate, US patent 2010/0173135 A1, [Online] [cit. 2012-05-01] Available on internet: http://www.google.com/patents?id=QCXSAAAAEBAJ&printsec=abstract&zoom=4&hl=sr#v=onepage&q&f=false.
7. Johnson, J. 2008. Aspects of Flexographic Print Quality and Relationship to some Printing Parameters, Doctoral Dissertation, Karlstad University Studies.
Zbornik1_PA2014_10.indd 106Zbornik1_PA2014_10.indd 106 25. 2. 2014 12:11:1925. 2. 2014 12:11:19

Polygrafi a Academica 2014 107
Methodology of evaluation
of print abrasion resistance
Jan Vališ, Bohumil Jašúrek, Tomáš Syrový
Department of Graphic Arts and Photophysics, Faculty of chemical-technology,University of Pardubice, Studentská 95, 532 10 Pardubice, Czech Republic,
Abstract: Abrasion resistance is a very important parameter of printed materials. This work deals with the methods for evaluation of abrasion resistance of prints in laboratory conditions. General procedure is rubbing of print by unprinted material. Footprint transferred on unprinted material is evaluate by measuring of optical density or L*a*b* coordinates (colour diff erence). During this process the selection of measured areas plays an important role. In this work, various methods have been proposed and compared.
Keywords: Abrasion resistance, printing ink, print quality
1. Introduction
If two surfaces in contact one with the other are rubbed together, the result of this kind of pressure is called friction. The ability to resist of damage during the mutual friction is called “abrasion resistance”, “rub resistance” or “friction resistance”. It is an essential condition of testing for abrasion resistance of paper or cardboard prints that the printed test sample is dry.
Testing of abrasion resistance generally consists in repeated rubbing of printed and unprinted areas. The degree of damage of tested printed surface strongly depends on the surface properties of the abrasive surface and on the pressure between the tested and the abrasive surfaces. The complexity of wear processes has led to the development of numerous standard test methods and test apparatus (for example FOGRA, Prüfbau, Smithers Pira, Sutherland, Testing Machines, UGRA).
Fig. 1: Scale for evaluating the abrasion resistance [5].
Zbornik1_PA2014_10.indd 107Zbornik1_PA2014_10.indd 107 25. 2. 2014 12:11:1925. 2. 2014 12:11:19

108 Polygrafi a Academica 2014
Correlation between these methods is not generally possible, although materials are often ranked in the same order. [1–5]
While methods for testing abrasion resistance are clearly defi ned, evaluation of these tests remains largely subjective. Typically, the reference range with fi ve degrees is used for visual evaluation, see Figure 1.
Materials with high resistance to abrasion leave practically no footprint on the unprinted rubbing sample, while materials with the lowest resistance leave a signifi cant mark.
The pursuit of an objective evaluation of the resistance test leads to the use of optical methods for measuring the optical density or color coordinates L*a*b*, but generally applicable methodology is not known.
2. Used samples, devises and methods
Nine samples was used for test (see Fig. 2). There are ink-jet prints by CMYK inks on plain paper (samples A, B, C, D), prints by black off set ink on non coated (E) and various matt coated papers (F, G) and prints by magenta off set ink on glossy coated (H) and off set paper (I). Samples A–D were rubbed by UGRA Abrasion tester [6] and samples E–I by TMI Digital Ink Rub Tester [4].
Fig. 2: Tested samples.
Samples were visually evaluated according to the scale shown in Figure 1. Furthermore, the optical density values D and color coordinates L*a*b* were me-asured using a spectrophotometer X-Rite 530 (Status E, 2° observer, lighting D50).
Zbornik1_PA2014_10.indd 108Zbornik1_PA2014_10.indd 108 25. 2. 2014 12:11:1925. 2. 2014 12:11:19

Polygrafi a Academica 2014 109
Measurements were performed for each sample at 5 locations and results were averaged. From the colour coordinates L*a*b* were calculated colour diff erences (compared with coordinates of pure paper).
Because during the abrasion test the ink is not transferred to the rubbing surface uniformly (evaluated samples are not homogeneous), the spectrometric measurement is heavily infl uenced by the choice of measured areas. Another method of evaluation was therefore focused on the possibility of evaluation larger measured area. Samples were scanned and digitized by USB microscope (Ednet Digital Microscope) and also by digital camera (Olympus E-PL3 + M.ZUIKO DIGITAL ED 60 mm Macro) [6, 7]. Digital images were further processed by software Anatis 2 (contrast, separation, thresholding, segmentation, see Fig. 3) and tonal values of the test samples were determined [8].
Fig. 3: Image processing: a) captured picture (Ednet), b) separating, c) segmentation.
3. Results
The results of testing are summarized in Table 1. For each sample, the sign of abrasion was visually evaluated; the optical density D and the color diff erences ΔE were measured; the tone values F were determined by image analysis.
Samples for image analysis were taken using a manual microscope (mic) and using a digital camera (cam). The advantage of capturing with a digital camera is
Tab. 1: Results – comparison various methods of test samples evaluation.
samplevisualevaluation
D
(st. dev.)ΔE
(st. dev.)Fmic [%]
(st. dev.)Fcam/Fcam4 [%]
(st. dev.)A noticeable 0.019 (0.006) 1.6 (0.8) 1.7 (0.5) 3.2/2.8 (0.96)B noticeable 0.016 (0.004) 2.0 (0.9) 1.0 (0.4) 1.4/1.7 (0.52)C noticeable 0.015 (0.003) 1.6 (0.2) 0.8 (0.1) 1.2/1.4 (0.54)D very strong 0.262 (0.084) 20.4 (2.8) 50.0 (10.6) 43.5/44.3 (10.84)E strong 0.022 (0.009) 2.7 (1.0) 9.0 (7.7) 7.6/6.3 (1.76)F noticeable 0.010 (0.006) 0.8 (0.6) 5.9 (2.1) 3.8/3.2 (0.75)G noticeable 0.010 (0.006) 0.9 (0.2) 2.8 (0.9) 3.8/3.1 (0.75)H strong 0.020 (0.007) 3.4 (0.8) 7.6 (2.4) 10.3/10.6 (0.75)I strong 0.036 (0.022) 3.5 (2.1) 8.6 (6.5) 11.0/7.5 (3.11)
Zbornik1_PA2014_10.indd 109Zbornik1_PA2014_10.indd 109 25. 2. 2014 12:11:1925. 2. 2014 12:11:19

110 Polygrafi a Academica 2014
that it is scanned and subsequently evaluated in a larger area. In Table 1 are shown values for F obtained from the entire scanned area and from 4 smaller cutouts. Possible diff erences can document the local diff erences, i.e. inhomogeneity in the sample.
4. ConclusionsFrom the results it is clear that all methods use for evaluation of abrasion
resistance are applicable. Visual evaluation is a fairly subjective, but for basic assessment of printed materials is suffi cient. In the case of a spectrophotometric and densitometric evaluation as well as for the evaluation of tonal values for sccanned samples, the selection of the meassured spot plays an important role. From this perspective, as appropriate objective method seems to be evaluation of tonal values from larger area of tested samples (captured with a digital camera).
5. References
1. Anon. Ugra Abrasion Tester, Ugra, [cit. 11.02.2014], available from <http://www.ugra.ch/Ugra-Abrasion-Tester.phtml>.
2. Anon. Abrasion, rub and scuff resistance testing, Smithers PIRA, [cit. 11.02.2014], available from <https://www.smitherspira.com/testing/material-properties/paper/abrasion-rub-and-scuff -resistance-testing.aspx>.
3. Anon. SUTHERLAND® Rub, Chemsultants International, [cit. 11.02.2014], available from <http://www.chemsultants.com/testing-equipment-products/testing-devices/sutherland-rub.aspx>.
4. Anon. Digital Ink Rub Tester, Testing Machines, [cit. 11.02.2014], available from <http://www.testingmachines.com/10-18-digital-ink-rub-tester.html>.
5. Anon: Přehled chyb v tisku, Schneidersohne Papier Praha, s.r.o., Praha, 1998.6. Anon. M. ZUIKO DIGITAL ED 60mm 1:2.8 Macro, OLYMPUS, [cit. 11.02.2014], available
from <http://www.olympus.cz/site/cs/c/cameras_accessories/pen_om_d_cameras_accessories/pen_om_d_lenses_adapters/m_zuiko_digital_ed_60mm_1_2_8/index.html>.
7. Anon. Ednet mikroskop, Alave.cz, [cit. 11.02.2014], available from <http://www.alave.cz/ednet-mikroskop-usb-microskope:p:194358>.
8. Fribert, M. 2005. Ocena charakterystyki drukowania przez pomiar mikropróbek druku. In Poligrafi ka, vol. 57, 5, pp. 64–65.
Zbornik1_PA2014_10.indd 110Zbornik1_PA2014_10.indd 110 25. 2. 2014 12:11:1925. 2. 2014 12:11:19
Polygrafi a Academica 2014 111
Infl uence of Bending on Resistance
of Screen Printed Conductive Structures
1Kristián Petruf, 2Ondřej Mikala, 1Tomáš Syrový, 1Petr Němec
1Department of Graphic Arts and Photophysics, University of Pardubice,Studentská 95, 532 10 Pardubice, [email protected]
2Department of Wood, Pulp and Paper, University of Pardubice,Studentská 95, 532 10 Pardubice
Abstract: Printed electronics is a quickly emerging part of printing industry which provides many opportunities for new applications. Nowadays, the most used functional layers in the area of printed functionalities are usually based on materials with high conductivity. By printing techniques, it is possible to fabricate such conductive layers on diff erent printing substrates. In this work, paper based materials are used as fl exible printing substrates. The study provides the comparison of behaviour of printed conductive layers (based on silver) deposited onto paper substrates of diff erent ream weights by screen-printing. The performance of the conductive layer is strongly infl uenced by surface properties of the paper (roughness, surface free energy, porosity and closure of surface, etc.). Four coated paper substrates were used for testing the infl uence of bending of conductive structure to electric resistance. Results show that lowering or increasing of layer’s resistance is dependent on the bending extent and bending direction too. The relative change of resistance of printed structures depends also on the width of the printed line. Thinner lines exhibit larger changes in resistance than the broader ones. To conclude, this study presents results for selected basic properties of conductive layers printed on fl exible paper substrates and their dependence on its native property – fl exibility.
Key words: conductivity, resistance, silver conductive layer, screen-printing, paper, bending
1. Introduction
The use of fl exible materials as printing substrates is well known expecially for RFIDs [1, 2] but the utilization of such materials reaches out for other applications as well. Therefore it is essential to know if and how the properties of the conductive layers will change on such substrates after several bending cycles or during bending. Paper is a low cost, easy to dispose and fl exible substrate which can fi nd its utilization also in roll-to-roll processes and therefore its use in printed electronics is very challenging [3]. The main purpose of this contribution is to study the change of resistance of conductive layers at diff erent bending angles when using paper as a substrate.
Zbornik1_PA2014_10.indd 111Zbornik1_PA2014_10.indd 111 25. 2. 2014 12:11:1925. 2. 2014 12:11:19
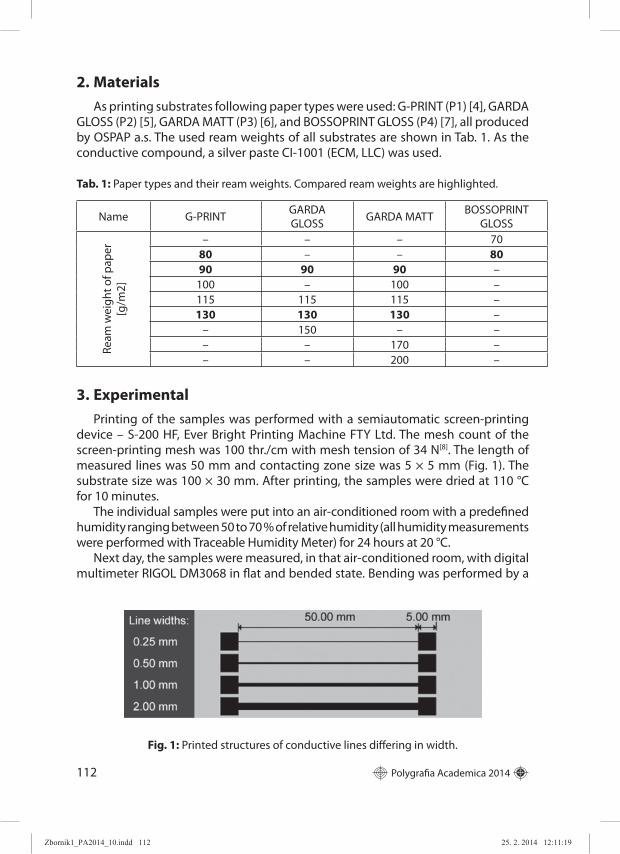
112 Polygrafi a Academica 2014
2. Materials
As printing substrates following paper types were used: G-PRINT (P1) [4], GARDA GLOSS (P2) [5], GARDA MATT (P3) [6], and BOSSOPRINT GLOSS (P4) [7], all produced by OSPAP a.s. The used ream weights of all substrates are shown in Tab. 1. As the conductive compound, a silver paste CI-1001 (ECM, LLC) was used.
Tab. 1: Paper types and their ream weights. Compared ream weights are highlighted.
Name G-PRINTGARDA GLOSS
GARDA MATTBOSSOPRINT
GLOSS
Ream
wei
ght o
f pap
er
[g/m
2]
– – – 7080 – – 80
90 90 90 –100 – 100 –115 115 115 –130 130 130 –
– 150 – –– – 170 –– – 200 –
3. Experimental
Printing of the samples was performed with a semiautomatic screen-printing device – S-200 HF, Ever Bright Printing Machine FTY Ltd. The mesh count of the screen-printing mesh was 100 thr./cm with mesh tension of 34 N[8]. The length of measured lines was 50 mm and contacting zone size was 5 × 5 mm (Fig. 1). The substrate size was 100 × 30 mm. After printing, the samples were dried at 110 °C for 10 minutes.
The individual samples were put into an air-conditioned room with a predefi ned humidity ranging between 50 to 70 % of relative humidity (all humidity measurements were performed with Traceable Humidity Meter) for 24 hours at 20 °C.
Next day, the samples were measured, in that air-conditioned room, with digital multimeter RIGOL DM3068 in fl at and bended state. Bending was performed by a
Fig. 1: Printed structures of conductive lines diff ering in width.
Zbornik1_PA2014_10.indd 112Zbornik1_PA2014_10.indd 112 25. 2. 2014 12:11:1925. 2. 2014 12:11:19

Polygrafi a Academica 2014 113
three-point bending test on TIRAtest 26005. Paper substrates were supported by a 150 g/m2 to prevent them from spontaneous bending. Then the samples were pushed down in the middle of the sample to distance 4, 8, and 12 mm with a defi ned curvature radius of 42 mm. At each distance, the resistance of the conductive line on the samples was measured. The method of bending is shown in Fig. 2. In this fi gure, the corresponding bending angles to the pushed down distance are also shown.
4. Results and discussion
Due to the varying ream weights of available paper substrates, three ream weights were chosen for comparison of the resistance for individual samples. Paper types P1 and P4 are compared at ream weights of 80 g/m2 and P1, P2, and P3 are compared at ream weights of 90 and 130 g/m2.
In Fig. 3, the results show the infl uence of ream weight on the resistance for paper type P3. It can be seen that the ream weight in fl at state of the substrate has only a small eff ect on the conductivity. For all sample types very similar results were obtained. As it can be seen the lines with width of 0.25 mm (single-layer – 1L and double-layer – 2L) and one-layered line of 0.5 mm are varying in resistance independently on the ream weight. These variations of resistance can arise from the in inhomogeneities of the substrate which cause errors in the thin line resulting in creation of higher resistance of the line.
The eff ect of the width of conductive line can be seen in Fig. 4. With this fi nding it must be said, that the conductivity changes during bending are more apparent for thinner lines. The lines with widths above 0.25 mm are not subject of research due to the small changes in resistance and therefore only lines with widths of
Fig. 2: Bending angles according to the push-down distance: a) 4 mm, b) 8 mm, c) 12 mm with Tiratest 26005.
Zbornik1_PA2014_10.indd 113Zbornik1_PA2014_10.indd 113 25. 2. 2014 12:11:1925. 2. 2014 12:11:19

114 Polygrafi a Academica 2014
0.25 mm are presented in results for the infl uence of bending on resistance of the screen printed conductive structures.
The resistances are varying due to the diff erent substrates and single or double layer designs in a wide range. According to that fi nding the results of changes in resistance due to bending are shown as the increase of resistance from the fl at state measurement of the samples. The samples were put with the silver line downwards in the TIRAtest – longitudinal outward bend. In Fig. 5, the infl uence of bending on resistance can be seen for single and double layered lines on P1, P2, P3 and P4 substrates.
The comparison of changes in resistance due to bending shows that the smallest changes are obtained for P3 paper type with ream weight of 90 g/m2. Here the resistance of both, single and double layered lines show changes of resistance
Fig. 4: Dependence of resistance change on line width on diff erent paper substrateswith ream weight of 90 g/m2.
Fig. 3: Dependence of resistance change on ream weight of paper substrateof P3 paper type. Other tested paper types show similar behavior.
Zbornik1_PA2014_10.indd 114Zbornik1_PA2014_10.indd 114 25. 2. 2014 12:11:1925. 2. 2014 12:11:19

Polygrafi a Academica 2014 115
less than 0.25 Ω. From Fig. 5 it is also obvious that the change of resistance during bending is more apparent with increasing ream weight of the paper.
5. Conclusion
This study shows that the resistance of the silver conductive lines printed on paper substrates grows with the applied bending angle. From the four paper types, the most compliant for maintaining the conductivity of the silver lines is P3 – GARDA MATT. This paper substrate showed the smallest change in resistance during bending. We suppose that the lowest resistance of silver lines achieved on P3 has been obtained due to its matt surface treatment which contributes to higher penetration of the silver paste into the substrate. Thus the conductive layer is compact and resistant against mechanical stress.
The eff ect of bending was only weekly apparent on samples with larger widths of silver lines. Due to the fi nding that the resistance of 0.25 mm wide lines is highly varying independently on the ream weight of the paper substrate, the results of
Fig. 5: Infl uence of bending on resistance change of the silver lines ona) P1, b) P2, c) P3, and d) P4 paper types with comparable ream weights.
Zbornik1_PA2014_10.indd 115Zbornik1_PA2014_10.indd 115 25. 2. 2014 12:11:1925. 2. 2014 12:11:19
116 Polygrafi a Academica 2014
bending infl uence on resistance can be aff ected by errors in these lines. By bending the errors in the conductive lines get larger thus these lines show higher changes in resistance.
Acknowledgement
Authors would like to thank OSPAP a.s. for providing research with paper substrates.
6. References
1. Xiang, Z. and W. Gang. Study on the infl uence of curving of tag antennas on performance of RFID system. in Radio Science Conference, 2004. Proceedings. 2004 Asia-Pacifi c. 2004.
2. Siden, J., et al. Performance degradation of RFID system due to the distortion in RFID tag antenna. in Microwave and Telecommunication Technology, 2001. CriMiCo 2001. 11th International Conference on. 2001.
3. Tobjörk, D. and R. Österbacka, Paper Electronics. Advanced Materials, 2011. 23(17): p. 1935-1961.
4. OSPAP, datasheet_G-PRINT, 2013: http://obchod.paperlinx.cz/doc/datasheet_G-PRINT.pdf.5. OSPAP, datasheet_GARDA_gloss, 2013, OSPAP: http://obchod.paperlinx.cz/doc/data
sheet_GARDA_gloss.pdf.6. OSPAP, datasheet_GARDA_matt, 2013, OSPAP: http://obchod.paperlinx.cz/doc/data
sheet_GARDA_matt.pdf.7. OSPAP, datasheet_BOSCOPRINT_gloss, 2013: http://obchod.paperlinx.cz/doc/data
sheet_BOSCOPRINT_gloss.pdf.8. Petruf, K., T. Syrovy, and P. Nemec, Behaviour of Printed Electroluminescent Panel in
Accordance to Order of Layers. Scientifi c Papers of University of Pardubice, Series A, 2013. 19: p. 12.
Zbornik1_PA2014_10.indd 116Zbornik1_PA2014_10.indd 116 25. 2. 2014 12:11:2025. 2. 2014 12:11:20

Polygrafi a Academica 2014 117
Svetelná a tepelná stabilita čiernobielej fotografi e
Viera Jančovičová, Zuzana Machatová, Zuzana Štromajer
Oddelenie polygrafi e a aplikovanej fotochémie ÚPSP, FCHPT STU,Radlinského 9, 812 37 Bratislava, [email protected]
Abstrakt: Black and white silver gelatin photography based on silver halides is a part of our lives for almost 150 years. Over time, image quality deterioration and other un-desireable changes occur due to improper pocessing, storing or inappropriate manip-ulation. Impact of light, heat and humidity on degradation of photographic gelatin layer was studied in this survey. Due to accelerated ageing diminishing of useful photo-graphic density range as well as highlight yellowing (increase of b* coordinate) arised, mainly during ageing under elevated humidity conditions. On the other hand, FTIR spectroscopy confi rmed presence of oxidative degradation products of gelatin mainly in connection with light and dark ageing at low relative humidity.
1. Úvod
Fotografi a tvorí významnú časť kultúrneho bohatstva ľudstva. Od jej počiatkov v roku 1826 dokumentuje vývoj civilizácie s jej radostnými i tienistými stránkami a zároveň je prostriedkom na vyjadrenie umeleckých či estetických inšpirácií, čím sama nadobúda vlastnú dokumentačnú, umeleckú a estetickú hodnotu. V priebehu rokov môže v dôsledku jej nesprávneho spracovania, uskladnenia alebo nespráv-nej manipulácie s ňou dochádzať k jej poškodeniu a k zníženiu kvality obrazu. [1]
Základná schéma stavby väčšiny fotografi ckých materiálov je pomerne ustá-lená a tvorí ju podložka a svetlocitlivá vrstva, medzi ktorými sa môže nachádzať substrátová vrstva. [2] Ako podložka sa najčastejšie používa papier, sklo, kov, ale aj porcelán, slonovina, či textílie. Medzi moderné podložky patria podložky nit-rocelulózové, acetáty celulózy a polyestery. Svetlocitlivú vrstvu tvoria najčastejšie halogenidy striebra dispergované v xerogéli želatíny. Ako disperzné prostredie sa v minulosti uplatnili aj albumín a kolódium. Substrátová vrstva sa nachádza medzi svetlocitlivou vrstvou a nosičom, u halogenidostrieborných želatínových fotografi í ju tvorí tradične síran bárnatý. U tzv. RC (z anglického „resin coated“) materiálov je to polyetylén pigmentovaný oxidom titaničitým. Obrazová vrstva je tvorená obra-zotvornou látkou po spracovaní fotografi ckého média. Môže ju tvoriť fotografi cké striebro (halogenidostrieborná fotografi a), amalgám striebra (daguerrotypia), uhlík (uhľotlač), soli kovov (cyanotypia) alebo pigmenty (gumotlač).
2. Príprava a charakterizácia fotografi ckého obrazu
V práci bol použitý barytový fotografi cký papier normálnej gradácie Fomabrom N112. Expozíciou papiera (texp = 0 – 3,6 s) a jeho následným spracovaním sme pri-
Zbornik1_PA2014_10.indd 117Zbornik1_PA2014_10.indd 117 25. 2. 2014 12:11:2025. 2. 2014 12:11:20

118 Polygrafi a Academica 2014
pravili vzorky s rôznou denzitou fotografi ckého obrazu (D0), na ktorých boli spek-trofotometrom (Spectrodens, Techkon, osvetlenie D50, štandardný pozorovateľ 2°) odmerané hodnoty denzity a súradníc L*, a*, b* (Tab. 1). S rastúcou denzitou obrazu podľa očakávania klesá hodnota súradnice L*, hodnoty súradníc a* a b* sú blízke nule, nakoľko sa jedná o achromatické farby. Mierne záporné hodnoty súrad-nice b* môžu byť spôsobené prídavkom optických zjasňovačov do fotografi ckého papiera, prítomnosť ktorých predpokladáme aj na základe meraní UV Vis spektier (UV Vis spektrofotometer CECIL CE 3055). Tvar FTIR spektra (FTIR spektrofotometer EXCALIBUR Series DIGILAB, FTS 3000 MX) nebol ovplyvnený denzitou fotografi cké-ho obrazu. [3]
Tab. 1: Optické vlastnosti fotografi ckých papierov.
Číslo vzorky
texp [s] D0 L* a* b*
1 0 0 95,4 0,8 -2,62 1,2 0,12 86,8 0,5 -1,83 2,4 0,46 67,0 0,1 -0,34 3,6 0,90 47,7 -0,3 0,2
3. Vplyv urýchleného starnutia na stabilitu fotografi ckého obrazu
Vzorky boli po dobu 28 dní podrobené trom typom urýchleného svetelného starnutia – na okne (A), pod výbojkou RVL (B) a v komore Q-sun (C), ďalej suchému starnutiu pri 80 °C (D) a dvom typom starnutia v uzavretých fľaštičkách pri 80 °C a 50 % RV (E) a pri 80 °C a 80 % RV (F). Stabilitu fotografi ckého obrazu sme sledovali pomocou kolorimetrie, denzitometrie a spektrálnych metód.
Vplyvom urýchleného starnutia dochádza na všetkých pripravených vzorkách k zmene denzity (obr. 1), a síce pri vzorkách s nižšou denzitou (D0 = 0 a D0 = 0,12) došlo k jej nárastu, a teda k tmavnutiu vzorky, čo je spôsobené vznikom degradač-ných produktov želatíny. Ostatné vzorky (D0 = 0,46 a D0 = 0,90) vplyvom urých-leného starnutia s výnimkou starnutia C vybledli. Svetelné starnutie C (v komore Q-sun) bolo jediné, pri ktorom pri všetkých starnutiach došlo k stmavnutiu vzoriek. Keďže pri tomto starnutí bola teplota v komore vyššia (teplota čierneho bodu = 65 °C), možno hovoriť o akejsi kombinácii svetelného a tepelného starnutia. Vplyvom starnutia môže účinkom vonkajších (nečistoty) ale aj vnútorných (degradačné pro-dukty želatíny) faktorov dôjsť k oxidácii Ag na Ag+ spojenej s odfarbením tmavých miest, dochádza teda k poklesu denzity. Nárast denzity v komore Q-sun môže byť spôsobený degradáciou emulznej želatínovej vrstvy spojenej so vznikom fa-rebných produktov, ako aj zmenou morfológie kryštálov striebra v dôsledku ich pohyblivosti v zdegradovanej svetlocitlivej vrstve, ktorá sa po 28 dňoch starnutia C zmenila na rozpustnú vo vode. Keď sa Ag+ ióny dostali na povrch, v dôsledku absorpcie svetla pri svetelnom starnutí C opäť došlo k ich redukcii spojenej s ná-rastom denzity, ktorá v dôsledku morfologických zmien bola vo všetkých prípa-
Zbornik1_PA2014_10.indd 118Zbornik1_PA2014_10.indd 118 25. 2. 2014 12:11:2025. 2. 2014 12:11:20

Polygrafi a Academica 2014 119
doch vyššia ako u nestarnutých vzoriek. Spomedzi starnutí v tme pri 80 °C (D – F) bola najvyššia denzita po konečnom starnutí na všetkých študovaných vzorkách nameraná po starnutí v uzavretých fľaštičkách pri 80 % RV (starnutie F), čo môže byť spôsobené degradáciou želatíny aj zmenou morfologickej štruktúry striebra, ako aj opakovanou redukciou Ag+ iónov v dôsledku oxidačno-redukčných reakcií s produktmi degradácie želatíny.
Počas všetkých typov urýchleného starnutia dochádza okrem zmeny denzity aj k farebným zmenám fotografi ckého papiera, ktoré sú charakterizované zmenami súradníc L*, a*, b*. Zmeny súradnice L* (svetlosť) korelujú so zmenami denzity, všet-ky vzorky vykazovali najnižšiu hodnotu L* po svetelnom starnutí v komore Q-sun (starnutie C) a spomedzi starnutí v tme pri starnutí pri 80 °C a RV 80 % (starnutie F). V oboch týchto prípadoch dochádza k najväčšiemu poškodeniu želatíny (pri star-nutí F želatínová vrstva zgélovatie a v prípade starnutia C sa stáva rozpustnou), čo umožňuje migráciu Ag+ iónov a ich opätovnú redukciu na Ag, spojenú s tmavnutím vzoriek.
Keďže čierna, biela a stupne šedej sú achromatické farby, hodnoty a* a b* ne-starnutých vzoriek boli blízke nule. Vplyvom urýchleného svetelného starnutia dochádza k degradácii želatíny spojenej zo vznikom produktov, ktoré môžu byť sfarbené. Zmeny súradnice a* pri všetkých typoch starnutia boli veľmi malé, pri
Obr. 1: Vplyv rôznych typov starnutia (28 dní) na denzitu fotografi ckého obrazu (N: nestarnuté vzorky, A – F: vzorky starnuté spôsobmi popísanými v časti 3).
Zbornik1_PA2014_10.indd 119Zbornik1_PA2014_10.indd 119 25. 2. 2014 12:11:2025. 2. 2014 12:11:20

120 Polygrafi a Academica 2014
starnutí na svetle (A – C) došlo k miernemu poklesu súradnice a*, pri starnutí v tme (D – F) súradnica a* mierne narástla. Významnejšie boli zmeny súradnice b*, ktorej nárast pri všetkých starnutiach a pri všetkých vzorkách bol spôsobený žltnutím fo-tografi ckého papiera v dôsledku degradácie želatíny. Žltnutie sa najviac prejavilo na najsvetlejších políčkach (vzorka 1 a 2), spomedzi všetkých starnutí boli najväčšie zmeny súradnice b* zaznamenané pri starnutí vo fľaštičkách pri 80 ºC a 80 % RH (starnutie F).
Starnutie fotografi ckého papiera je komplikovaný proces zložený z degradácie želatíny aj papierovej podložky, oxidácie Ag na Ag+, jeho opätovnej redukcie na Ag, migrácie, zmeny morfologickej štruktúry a ďalších procesov, ktoré ovplyvňujú farebnosť fotografi ckého papiera v dôsledku čoho hodnoty celkovej farebnej dife-rencie ΔE*
ab [4] nevykazujú jednoznačnú tendenciu (obr. 3). Sú totiž kombináciou viacerých farebných zmien (želatína, striebro, papier), ich interpretácia je kompli-kovaná. Predsa však možno konštatovať, že svetlejšie políčka vykazovali menšiu farebnú stabilitu pri tepelnom (predovšetkým pri starnutí F), zatiaľ čo tmavšie pri svetelnom starnutí (A a B).
Obr. 2: Vplyv starnutia na chromatické osi a* a b* fotografi ckého papiera(C: svetelné starnutie v komore Q-sun; F: starnutie v uzavretých fľaštičkách
pri 80 ºC a 80 % RV); nestarnuté vzorky; vzorky starnuté 28 dní.
Zbornik1_PA2014_10.indd 120Zbornik1_PA2014_10.indd 120 25. 2. 2014 12:11:2125. 2. 2014 12:11:21

Polygrafi a Academica 2014 121
Degradáciu želatíny v obrazovej vrstve sme pozorovali aj pomocou spektrál-nych metód (UV Vis a FTIR). V UV Vis spektrách dochádza k nárastu refl exnej denzity v oblasti nad 400 nm, čo je spojené zo žltnutím vzoriek, ktoré bolo najvýznamnejšie na vzorkách s D0 = 0, pričom hodnoty refl exnej denzity v tejto oblasti boli vyššie po svetelnom starnutí ako po starnutí v tme.
Vplyv svetelného starnutia (A – C) a starnutia v tme (D – F) na stabilitu fotogra-fi ckého papiera sme sledovali pomocou FTIR spektroskopie, pri všetkých starnu-tiach dochádza k zmenám, ktoré naznačujú určité degradačné procesy v želatíne spojené so vznikom karbonylových zlúčenín. Tieto zmeny boli pozorované najmä pri svetelnom starnutí B a C a suchom starnutí v tme (D). Podľa Rabotyagovej de-gradácia polypeptidov prebieha oxidačným mechanizmom pri nižšej relatívnej vlhkosti, zvýšenej teplote, v prítomnosti kyslíka a môže byť urýchlená teplom, svetlom a prítomnosťou iónov prechodných kovov [5]. Môžeme teda predpokla-dať, že vplyvom svetelného starnutia B a C a suchého starnutia v tme (starnutie D), kde boli naplnené horeuvedené podmienky, dochádza k degradácii želatí-novej vrstvy oxidačným mechanizmom. V prípade starnutia pri vyššej relatívnej vlhkosti (starnutie E a F) sa oxidačná degradácia želatínovej vrstvy významne ne-prejavila.
Obr. 3: Vplyv rôznych typov urýchleného starnutia (A – F, 28 dní) na ΔE*
ab fotografi ckého papiera.
Zbornik1_PA2014_10.indd 121Zbornik1_PA2014_10.indd 121 25. 2. 2014 12:11:2325. 2. 2014 12:11:23
122 Polygrafi a Academica 2014
Záverom možno skonštatovať, že vplyvom svetla, vysokej teploty a relatívnej vlkosti vzduchu dochádza k zmenšeniu užitočného rozsahu denzít fotografi ckého obrazu, ako aj degradácii želatínovej vrstvy spojenej s farebnými zmenami, na čom sa podieľajú všetky horeuvedené faktory.
Poďakovanie
Ďakujeme grantovej agentúre APVV (0324-10) a KEGA (002VŠVU-4/2012) za podporu.
4. Literatúra
Lourenço, M. J. L., Sampaio, J. P. 2009. Microbial deterioration of gelatin emulsion pho-1. tographs: Diff erences ofsusceptibility between black and white and colour materials. In: International Biodeterioration & Biodegradation, vol. 63, pp. 496 – 502.Šima, J., Čeppan, M., Jančovičová, V., Prousek, J., Velič, D. 2011. Fotochémia: Princípy 2. a aplikácie. 1. vyd. Bratislava. STU, 337 s. ISBN 978-80-227-3440-0.Matovčíková, M. 2013. Vplyv fotografi ckej podložky a zloženia kolorantu na jeho fotoche-3. mickú a termickú stabilitu. Diplomová práca. Bratislava. 82 s.Panák, J, Čeppan, M., Dvonka, V., Karpinský, Ľ, Kordoš, P., Mikula, M., Jakucewicz, S. 2008. 4. Polygrafi cké minimum. 3. vyd. Bratislava. TypoSet. 262 s. ISBN 978-80-970069-0-7. Rabotyagova, O. S., Cebe, P., Kaplan, D. L. 2008. Collagen structural hierarchy and suscep-5. tibility to degradation of ultraviolet radiation. In: Material Science and Engineering, vol. 28, pp. 1420 – 1429.
Zbornik1_PA2014_10.indd 122Zbornik1_PA2014_10.indd 122 25. 2. 2014 12:11:2525. 2. 2014 12:11:25

Polygrafi a Academica 2014 123
Vplyv reologického činidla na sieťotlačové TiO2 pasty
pre fotoanódu
farbivom senzibilizovaných solárnych článkov
Pavol Gemeiner, Milan Mikula
Oddelenie polygrafi e a aplikovanej fotochémie, FCHPT STU v Bratislave,Radlinského 9, 812 37 Bratislava, [email protected]
Abstract: TiO2 pastes for screen printing based on diff erent weight ratios of ethyl cellulose (0, 1.5, 4, 6.5 and 9 wt. %) were prepared and evaluated by rheology measurements of viscosity and thixotropy. The eff ect of ethyl cellulose wt. % has shown as crucial for TiO2 photoanode properties as thickness, roughness and amount of adsorbed dye. Moreover, the viscosities of the paste showed similar dependency on the ethyl cellulose content as effi ciencies of dye sensitized solar cells (DSSC). The highest effi ciency 2.3 % was achieved for DSSC based on the TiO2 photoanode with 4.5 μm thickness, 24 nm roughness which was screen printed from the TiO2 paste with the highest initial apparent viscosity 39.7 Pa.s (D = 10 s-1) and 6.5 wt. % of ethyl cellulose.
Kľúčové slová: sieťotlač, etylcelulóza, TiO2, fotoanóda, solárne články
1. Úvod
Farbivom senzibilizované solárne články patria do tretej generácie solárnych článkov označovanej aj ako tlačená fotovoltaika, pri ktorej je možné nanášanie funkčných vrstiev pomocou lacných, rýchlych a k životnému prostrediu šetrných tlačových techník ako napr. sieťotlač. DSSC objavené M. Grätzelom v roku 19911, využívajú vlastnosti polovodivej vrstvy z nanočastíc (~ 20 nm) TiO2 pokrytých vrstvou farbiva2. Základná štruktúra DSSC pozostáva z piatich funkčných kom-ponentov: substrátu s vrstvou transparentného vodivého oxidu, polovodivej vrstvy TiO2, farbiva s funkciou senzibilizátora absorbovaného na povrchu polovo-diča, elektrolytu obsahujúceho redoxný mediátor a opačnej elektródy schopnej regenerovať redoxný mediátor3,4. V konvenčných solárnych článkoch prebieha absorpcia žiarenia a transport náboja v jednom materiáli. Avšak, v DSSC člán-koch na rozdiel od konvenčných je generácia náboja uskutočňovaná na rozhraní polovodič (TiO2 prípadne ZnO) – farbivo a transport náboja je sprostredkovaný na rozhraní polovodič – elektrolyt. Vlastnosti polovodivej vrstvy TiO2 majú preto významný vplyv na celkovú účinnosť DSSC. Patria medzi ne mezoporozita, drs-nosť a hrúbka vrstvy, ktoré vedú k zvýšenej adsorpcii farbiva a teda efektívnejšej absorpcii žiarenia5.
Najpoužívanejšou tlačovou technikou nánosu polovodivej vrstvy v technológii DSSC sa stala vďaka svojej jednoduchosti, rýchlosti a cene sieťotlač6. Štandardné
Zbornik1_PA2014_10.indd 123Zbornik1_PA2014_10.indd 123 25. 2. 2014 12:11:2625. 2. 2014 12:11:26

124 Polygrafi a Academica 2014
zloženie sieťotlačovej pasty na báze TiO2 je terpineol ako rozpúšťadlo a etylceluló-za ako reologické činidlo. Po tlači sú vrstvy kvôli odstráneniu organického podielu a zvýšeniu prepojenia medzi časticami TiO2 sintrované pri 450 °C. Množstvo pri-daných organických látok tak ovplyvňuje vlastnosti tlačených vrstiev ako hrúbka vrstvy, drsnosť a homogenita. Preto je dôležité skúmať vplyv zloženia sieťotlačo-vých pást na báze TiO2 na výsledné polovodivé nanoporózne vrstvy.
2. Experiment
Vzorky TiO2 pást pre sieťotlač boli pripravené homogenizačným procesom po-zostávajúcim z niekoľkých krokov, pričom množstvo všetkých zložiek okrem etyl-celulózy zostávalo rovnaké. V prvom kroku boli pridané 3 g TiO2 nanočastíc (Evonik, Aeroxide P25), 0,5 ml CH3COOH a 2,5 ml H2O do mažiara a miešané počas 15 min. V druhom koru bolo pridaných k zmesi 45 ml etanolu a 15 g α-terpineolu (Aldrich, > 96 %) s násladovnou homogenizáciou v ultrazvukovom zvone (Tesla, UGA 20613) v 20 × 1 s intervaloch. V treťom kroku bolo pridaných 15 g roztoku etylcelulózy (EC, Aldrich, viskozita 22 mPa.s v toluén:etanol 80:20) v etanole s takými koncentrácia-mi aby sme získali pasty s hmotnostným zlomkom EC (hm. %) 1,5; 4; 6,5 a 9 hm. % pričom bola pripravená pasta aj bez prídavku EC – 0 hm. %. Následne bola každá vzorka homogenizovaná 20 min v ultrazvukovom kúpeli. Kvôli odstráneniu podielu etanolu boli pasty dané na 4 hod do termostatu pri 85 °C.
Pripravené vzorky TiO2 pást boli nanášané pomocou ručného sieťotlačové-ho zariadenia (PET sieťka s lineatúrou 54 lin/cm–1, priemer vlákna 64 μm, odtrh sita = 3 mm) na sklíčka s vrstvou vodivého transparentného oxidu s rozmerom 2 × 3 cm (FTO, Aldrich, 7 Ω/sq). Tlačené TiO2 vrstvy mali aktívnu plochu 1,5 cm2. Kvôli odstráneniu organických prímesí, lepšiemu prepojeniu medzi TiO2 nanočas-ticami a substrátom boli vzorky vypálené pri 450 °C v čase 30 min. Pripravené TiO2 vrstvy boli senzibilizované 24 hod v N3 – ruténiovom farbive (Solaronix, cis bis (isothiocyanato) bis (2,2´-bipyridyl-4,4´-dicarboxylato)-ruthenium(II) a výsledné solárne články boli vytvorené spojením senzibilizovaných TiO2 fotoanód s Pt pro-tielektródami pripravenými metódou „doctor blade“ na FTO sklíčkach pomocou „binder clipov“. V poslednom kroku bolo pridaných 18 μl elektrolytu (Solaronix, Iodolyte AN-50) na rozhranie elektród, ktorý pomocou kapilárnych síl prenikol k aktívnym vrstvám.
Reologické vlastnosti pripravených vzoriek pást boli charakterizované pomocou rotačného viskozimetra HAAKE (VT501, kužel 1.0 DEG, d = 2 cm) pri konštantnej teplote 24,5 °C. Štruktúra tlačených TiO2 elektród bola hodnotená pomocou optic-kej mikroskopie (Leica DM 2700M, 200× zväčšenie), drsnosť a topografi a pomocou AFM mikrokopie (AFM, Veeco DI CP-II, 5 μm skener, nekontaktný mód, polomer hro-tu 10). Hrúbka vrstiev bola hodnotená pomocou profi lometrie (Dektak 150) a FTIR spektroskopie. Množstvo adsorbovaného farbiva na TiO2 elektródach bolo určené z desorpcie farbiva do 0.1 M NaOH roztoku pomocou UV/VIS spektier. IV charakte-ristiky solárnych článkov boli namerané pri osvetlení blízkom dennému štandardu (880 W/m2) pomocou multimetrov Keithley 2000 a Metex M-3650D.
Zbornik1_PA2014_10.indd 124Zbornik1_PA2014_10.indd 124 25. 2. 2014 12:11:2625. 2. 2014 12:11:26

Polygrafi a Academica 2014 125
3. Výsledky a závery
Proces sieťotlače je zložený z niekoľkých po sebe nasledujúcich krokov, pričom každý z nich prebieha pri rozdielnych šmykových rýchlostiach (D) a nárokoch na vis-kozitu tlačenej pasty. Štandardná pasta pre sieťotlač by mala mať zdanlivú viskozitu >10 Pa.s pri D = 10 s–1 a pri vyšších D ako 1000 1/s by nemala byť < 2 Pa.s, zároveň by mala byť pseudoplastická a tixotrópna7. Závislosť viskozity (η) od šmykovej rýchlosti pripravených vzoriek TiO2 pást je zobrazená na obr. 1. Zdanlivá viskozita pást sa veľ-mi líši pri malých šmykových rýchlostiach (pri D = 10 s-1: 5,3, 5,7, 13,4, 39,7, 24,8 Pa.s. Vzorky s 0 hm. % a 1,5 hm. % mali podobný priebeh viskozity, nad D = 250 1/s takmer s newtonovským charakterom s η < 2 Pa.s. Ostatné vzorky mali prudký pokles viskozi-ty z vyšších hodnôt na hodnoty η > 2 Pa.s. Pokles pokračoval aj pri vyšších šmykových rýchlostiach D > 1000, ktoré sú potrebné pri odtrhu sieťky od substrátu. Z hľadiska tla-če bola vzorka bez prídavku EC veľmi zle tlačiteľná, čo sa preukázalo aj na výsledných vrstvách. Pokles viskozity pre vzorku s 9 hm. % EC v porovnaní so vzorkou s obsahom 6,5 hm. % môže byť spôsobený nerozpusteným prebytočným množstvom EC.
Tixotropia TiO2 pást bola hodnotená pomoc hysterézie na obojsmerných to-kových krivkách závislostí šmykového napätia (τ) od D (obr. 2). Výrazná zmena v tixotropii (hodnotila sa veľkosť integrovanej plochy medzi krivkami): 0,06, 0,45 a 3,64 MPa.s–1 medzi vzorkami s 1,5, 4 a 6,5 hm. % EC je spôsobená výraznejšími zmenami v štruktúre pást, kde dochádza k narušeniu nadmolekulovej štruktúry. Pre vzorky s veľkou hysteréziou je potrebný dlhší čas, po redukcii šmykovej rýchlos-ti, na ich vnútornú reorganizáciu. Keďže pasty pre sieťotlač by mali byť tixotrópne ako nevhodné môžeme hodnotiť vzorku s 1,5 hm. % EC a bez obsahu EC, ktorých obojsmerné tokové krivky sa takmer prekrývali.
Obr. 1 Závislosť viskozity od šmykovej rýchlosti pre vzorky TiO2 pásts rôznym obsahom etylcelulózy.
Zbornik1_PA2014_10.indd 125Zbornik1_PA2014_10.indd 125 25. 2. 2014 12:11:2625. 2. 2014 12:11:26

126 Polygrafi a Academica 2014
Povrchové a štruktúrne vlastnosti sieťotlačených TiO2 vrstiev boli hodnotené po vypálení pri 450 °C. Vrstva pripravená z pasty bez obsahu etylcelulózy mala neho-mogénny – „zvlnený“ povrch s hrúbkou ~2 μm, s prasklinami s dĺžkou > 100 μm (obr. 3 – A) a strednou kvadratickou drsnosťou (Rq) = 50 nm. Po jej tlači nedošlo k formovaniu rovnomernej vrstvy s požadovanou štruktúrou, ale len k „rozliatiu“ na substrát. Jej povrch pozostával hlavne s agregátov a zhlukov TiO2 častíc s prieme-rom > 500 nm pokrytými miestami s menšími agregátmi prípadne TiO2 nanočasti-cami. Pri vzorke s 1,5 hm. % EC sa toto množstvo ukázalo ako dostatočné na formo-vanie homogénnej vrstvy bez prasklín. Štruktúra a topografi a vrstiev pripravených z pást obsahujúcich EC bola bez výraznejších rozdielov, pričom povrch vrstvy bol zložený hlavne z ~200 nm agregátov miestami pokrytý samostatnými nanočastica-mi a menšími < 50 nm zhlukmi častíc TiO2. Množstvo pridanej etylcelulózy v pas-tách malo výrazný vplyv hlavne na hrúbku vrstiev a ich drsnosť, pričom sa dosiahli hodnoty Rq = 16, 17, 24 a 23 nm a hrúbky od 3,5 do 4,5 μm pre pasty s obsahom 1,5, 4, 5,5 a 9 hm. % EC.
Fotovoltaické parametre zostrojených DSSC boli vyhodnotené pomocou závis-lostí ich prúdovej hustoty J (mA/cm2) od napätia (V). IV charakteristiky DSSC sú zobrazené na obr. 4 (vľavo). Najvyššiu účinnosť η = 2,3 % a J = 5,4 mA/cm2 dosiahol článok s fotoanódou pripravenou z pasty s obsahom 6,5 hm. % EC. Vysoká prúdo-vá hustota súvisí hlavne s Rq, hrúbkou vrstiev a teda množstvom adsorbovaného farbiva (A) na tejto fotoanóde A = 1,92 × 10⁻⁸ mol/cm2 v porovnaní so vzorkami 0 hm. %, 1.5 hm. %, 4 hm. % a 9 hm. %, ktoré dosiahli hodnoty A = 0,97, 1,01, 1,06 a 1,00 × 10⁻⁸ mol/cm2. Napätie článkov sa pohybovalo v intervale od 0,68 do 0,70 V. Účinnosti ostaných vzoriek DSSC s obsahom EC 0, 1,5, 4 a 9 hm. % dosiahli hod-noty η = 1,5, 1,48, 1,92 a 1,89 %. Obr. 4 (vpravo) zobrazuje závislosť účinnosti DSSC
Obr. 2 Obojsmerné tokové krivky závislosti τ od D sieťotlačových TiO2 pásts rôznym obsahom etylcelulózy.
Zbornik1_PA2014_10.indd 126Zbornik1_PA2014_10.indd 126 25. 2. 2014 12:11:2625. 2. 2014 12:11:26

Polygrafi a Academica 2014 127
Obr. 3 Optická mikroskopia (vľavo) a AFM topografi a (vpravo) sieťotlačených vrstiev TiO2; A – vzorka bez obsahu EC, B – vzorka s 6,5 hm.% EC.
Obr. 4 IV charakteristika pripravených DSSC článkov (vľavo) a orovnanie závislosti účinnosti a viskozity od množstva etylcelulózy v pripravených vzorkách TiO2 pást (vpravo).
a viskozity pripravených TiO2 pást od množstva (hm. %) etylcelulózy, pričom oba sledované parametre majú podobný trend s maximom v oblasti 6,5 hm. % EC a ná-sledným poklesom. Na záver môžeme konštatovať, že množstvo etylcelulózy má priamy vplyv nielen na reologické vlastnosti TiO2 pást, ale aj na štruktúrne vlast-
Zbornik1_PA2014_10.indd 127Zbornik1_PA2014_10.indd 127 25. 2. 2014 12:11:2625. 2. 2014 12:11:26

128 Polygrafi a Academica 2014
nosti tlačených elektród ako drsnosť, hrúbka vrstvy a množstvo adsorbovaného farbiva a teda celkovú účinnosť farbivom senzibilizovaných solárnych článkov.
Poďakovanie
Práca bola realizovaná s fi nančnou podporou Slovenskej technickej univerzity v rámci projektu pre mladých výskumníkov (FlexiCell 6436) a projektu a Vedeckej gran-tovej agentúry MŠ SR (VEGA 1/0818/13).
3. Literatúra
1. O’Regan, B., Grätzel, M. A low-cost, high-effi ciency solar cell based on dye-sensitized col-loidal TiO2 fi lms. Nature, 353, 737–740 (1991).
2. Pagliaro, M., Palmisano, G., Ciriminna, R. Flexible Solar Cells. WILEY-VCH Verlag GmbH & Co. KGaA, Weinheim, (2008). ISBN: 978-3-527-32375-3.
3. Nazeerudin, M., K., Baranoff , E., Grätzel, M.: Dye-sensitized solar cells: A brief overview. Solar Energy, 85, 1172–1178 (2011).
4. Zukalovà, M., Zukal, A., Kavan, L., Nazeeruddin, M. K., Liska, P., Grätzel, M. Organized me-soporous TiO2 fi lms exhibiting greatly enhanced performance in dye-sensitized solar ce-lls. Nano. Lett., 5, 1789–1792 (2005).
5. Burnside, S., Winkel, S., Brooks, K., Shklover, V., Grätzel, M., Hinsch, A., et al. Deposition and characterization of screen-printed porous multi-layer thick fi lm structures from se-miconducting and conducting nanomaterials for use in photovoltaic devices. J. Mater. Sci. Mater. Electron., 11, 355–362 (2000).
6. Nazeeruddin, M. K., Péchy, P., Renouard, T., Zakeeruddin, S. M., Humphry-Baker, R., Comte, P., Liska, P., Le Cevey, Costa, E., Shklover, V., Spiccia, L., Deacon, B., Bignozzi, C. A, Grätzel, M. Engineering of effi cient panchromatic sensitizers for nanocrystalline TiO2-based solar cells. J. Am. Chem. Soc., 123, 1613–1624 (2001).
7. H. W. Lin, Ch. P. Chang, W. H. Hwu, M. D. Ger, Journal of Materials Processing Technology 197, 284–291 (2008).
Zbornik1_PA2014_10.indd 128Zbornik1_PA2014_10.indd 128 25. 2. 2014 12:11:2725. 2. 2014 12:11:27

Polygrafi a Academica 2014 129
Identifi kácia historických fotografi ckých techník
nedeštruktívnymi metódami
Zuzana Machatová, Viera Jančovičová, Ľubica Krovinová
Ústav prírodných a syntetických polymérovFakulta chemickej a potravinárskej technológie
Radlinského 9 812 37 Bratislava
Abstract: Identifi cation of photographic processes is a determining factor for appropriate deposition, housing, exhibition and treatment of historic photographs. Furthermore, basic identifi cation is necessary for understanding historical and artistical values of individual photographs, as well as for collection cataloguing associated with digitisation project. As photographic collections are usually large and diversifi ed, rapid and suffi ciently accurate identifi cation methods should be used. Nondestructive methods such as Fourier-transform infrared spectroscopy (FTIR) and digital microscopy represent prompt and suffi ciently precise ways for identifi cation of most common photographic emulsion layer types. Moreover, FTIR can provide additional information about state of preservation or cumulating degradation products and help to identify process variants, protective coatings and dye toners. On the other hand, digital microscopy represents low-cost and facile method of obtaining data about surface structure and grain pattern. However, supplementary elemental analysis measurements are necessary, because many photographic processes or process variants (kallitype, Van Dyke print, platinotype) may exhibit similar visual features and infrared spectra closely resembling those of support, most frequentely cellulose, pure or seized.In this study we present a brief summary of identifi cation keys of some photographic processes by means of digital microscopy and FTIR in their historic context.
1. Úvod
Vďaka bohatosti a rôznorodosti fotografi ckých zbierkových fondov, súvisiacim s popularitou, dostupnosťou a úžitkovým charakterom fotografi e, sa neustále pre-hlbuje problém adekvátnej starostlivosti o tieto zbierky. Rozdielne materiálové zlo-ženie fotografi í vytvorených konkrétnymi technikami predurčuje rozdielne nároky na uloženie a vystavovanie. Identifi kácia techniky je tiež hlavným východiskom od-borného reštaurátorského zásahu.
Už od experimentálnych začiatkov fotografi e v r. 1830 po celé 19. a 20. stor. sa vývoj fotografi e odvíjal od svetlocitlivosti zlúčenín striebra. Z hľadiska identifi kácie fotografi ckých techník je kľúčová otázka identifi kácie disperzného prostredia ha-logenidov striebra. V tejto štúdii sa budeme venovať najbežnejšie sa vyskytujúcim fotografi ckým vrstvám – albumínovej, kolódiovej a želatínovej svetlocitlivej vrstve.
Zbornik1_PA2014_10.indd 129Zbornik1_PA2014_10.indd 129 25. 2. 2014 12:11:2725. 2. 2014 12:11:27

130 Polygrafi a Academica 2014
2. Použité metódy
Pre prvotnú identifi káciu historických fotografi ckých techník často postačuje od-borné vyhodnotenie na základe makroskopických znakov techniky, prípadne typic-kých prejavov degradácie obrazovej vrstvy či fotografi e ako celku. Nedeštruktívne metódy výskumu však poskytujú účinné prostriedky ako tento nález objektivizo-vať, prípadne spresniť.
Optická mikroskopia patrí medzi základné nástroje prieskumu objektov kultúr-neho dedičstva, príručné digitálne mikroskopy s výstupom na monitor počítača predstavujú cenovo dostupnú a fl exibilnú metódu prieskumu diel priamo v de-pozitároch, alebo v priestoroch archívu. Spektroskopia v infračervenej oblasti má v súčasnosti nezastupiteľné miesto pri štúdiu vlastností materiálov pamiatkových objektov. Infračervená spektroskopia s Fourierovou transformáciou (FTIR) s použi-tím ATR techniky merania (metóda zoslabenia úplného odrazu) patrí k najpoužíva-nejším metódami prieskumu diel na papieri a fotografi í [1].
3. Identifi kácia
3.1 Albumínové fotografi cké papiere
Prvá publikovaná zmienka o príprave o albumínového papiera pochádza z ča-sopisu The Athenaeum (11. 5. 1839), autorom príspevku je monogramista „H. L.“ o ktorého identite nie je známe nič bližšie. Za vynálezcu albumínového papiera sa považuje Blanquart-Evrard (1850) a jeho receptúra sa odlišuje od starších al-bumínových svetlocitlivých vrstiev prítomnosťou chloridu sodného. Po scitlivení roztokom dusičnanu strieborného tak vzniká chlorid strieborný. Napriek mnohým prednostiam halogenovaných albumínových svetlocitlivých vrstiev boli ešte nie-koľkokrát znovuobjavené albumínové vrstvy bez prídavku solí (1865 Schultner, 1866 Schnauss) a boli odporúčané ako úspornejšia verzia albumínového procesu, keďže bolo možné použiť scitlivovací roztok dusičnanu strieborného nižšej kon-centrácie. Farebnosť obrazovej vrstvy albumínových fotografi í sa mení podľa stup-ňa degradácie od fi alovo-čiernej po svetlohnedú až okrovo-hnedú. Degradácia ob-razovej vrstvy sa najrýchlejšie prejaví na úbytku kresby detailov. Samotný albumín pôsobením svetla žltne, čo je viditeľné najmä na plochách s nízkymi hodnotami denzity. Výrobcovia albumínového papiera (napr. Wratten & Wainwrights) z tohto dôvodu ponúkali série s tónovanou svetlocitlivou vrstvou, najčastejšie ružovou, alebo svetlomodrou [2]. Lesk závisí od počtu vrstiev albumínu a úpravy povrchu po spracovaní. Medzi významné identifi kačné znaky fotografi í, ktoré neboli nalepené na kartónovú podložku, patrí tiež charakteristické skrútenie fotografi e emulznou stranou dovnútra.
Dominantným prvkom mikrofotografi e je hustá sieť prasklín, dobre viditeľných aj v ostrom bočnom osvetlení. Tento znak sa však nevyskytuje u neskorých albu-mínových fotografi í leštených za zvýšenej teploty. Keďže albumínové fotografi e nemali substrátovú vrstvu, sú vlákna papiera pri dostatočnom zväčšení dobre vi-diteľné.
Zbornik1_PA2014_10.indd 130Zbornik1_PA2014_10.indd 130 25. 2. 2014 12:11:2725. 2. 2014 12:11:27

Polygrafi a Academica 2014 131
FTIR: najvýznamnejšie štruktúry albumínovej vrstvy sú pásy pri 1640 a 1530 cm–1 [3], spektrá albumínových vrstiev na papierovom nosiči obsahujú tiež pásy patriace celulóze – 3340, 1160, 1100, 1060 a 1030 cm–1 (Obr. 2)
3.2 Kolódiový proces
Pravdepodobne prvá zmienka o použití kolódia pre fotografi cké účely je spoje-ná s publikáciou Roberta Binghama Photogenic Manipulation (1850). V tom istom roku publikoval použitie jodizovaného kolódia pre fotografi cké svetlocitlivé vrstvy aj Gustave Le Gray, avšak jeho metóda nebola prakticky použiteľná. Prvú skutočne funkčnú metódu publikoval v r. 1851 Frederick Scott Archer v časopise The Chemist. Archerova snaha smerovala k vytvoreniu negatívov na papierovej podložke, avšak problematická aplikácia kolódiových vrstiev na papier ho nasmerovala k inertným skleným podložkám. Najskôr slúžili ako dočasné nosiče svetlocitlivej vrstvy, ktorá sa po spracovaní preniesla na papierovú podložku, čoskoro sa však Archer rozhodol ponechať kolódiovú vrstvu na sklenenej podložke. Prvé kolódiové negatívy mali hnedastú farbu a na čiernom pozadí dávali slabé pozitívne obrazy. Archer navrhol bielenie chloridom ortuťnatým, ktoré spôsobilo zosvetlenie striebrom tvorených svetlých tónov a tým prispelo k lepšej čitateľnosti. Spočiatku sa v kolódiovom pro-cese uplatnil najmä jodid draselný, neskôr s prídavkom bromidu draselného, ktorý spôsobil zvýšenie citlivosti materiálu. Uplatnili sa aj halogenidy kademnaté, amón-ne a draselné, často vo vzájomných kombináciách.
Kolódiové emulzie pre papierové nosiče boli pripravované s malým množstvom kyseliny citrónovej a tartarovej s prídavkom chloridu vápenatého, strontnatého ale-bo lítneho. K emulzii sa pridávali ešte ďalšie látky (napr. glycerín a benzín) za účelom zlepšenia fl exibility fi lmu a eliminácie praskania vrstvy. Ovrstvovanie sa do r. 1889 pre-vádzalo ručne, od tohto roku boli k dispozícii aj mechanizmy pre strojové ovrstvova-nie. Po spracovaní svetlocitlivého materiálu obvykle nasledovalo tónovanie fotogra-fi e. K dispozícii boli rozličné druhy tónovačov, mnohé z nich zahŕňajú borax a chlorid zlatitý, niektoré borax nahrádzali fosforečnanom alebo wolframanom sodným.
Známe boli aj priaznivé vlastnosti protektívnych želatínových fi lmov pre kolódi-ové svetlocitlivé vrstvy, ktoré navyše umožňovali prenos týchto vrstiev z pôvodnej podložky na iné substráty alebo existenciu takejto dvojvrstvy samostatne – vo for-me fi lmu. V r. 1871 predstavil Richard Leach Maddox suchý kolódiový proces, ktorý sa pre svoju nenáročnosť takmer okamžite tešil veľkej popularite najmä medzi pu-tovnými fotografmi.
Kolódiové fotografi e sa najčastejšie vyskytujú vo farebnej škále odtieňov od hnedej po fi alovo čiernu v závislosti od toho, ako boli tónované. Najčastejšie sa používali zlúčeniny zlata a platiny, alebo ich kombinácia.
Mikroskopické charakteristiky: kolódiová vrstva na barytovom papieri vytvára homogénny hladký povrch, náchylný na mechanické poškodenie. Vo väčšine prí-padov vrstvy prekrývajú papierový nosič, vlákna papiera sú viditeľné na miestach s nízkou denzitou. Charakteristickým prvkom sú škrabance dosahujúce až na sub-strátovú vrstvu.
Zbornik1_PA2014_10.indd 131Zbornik1_PA2014_10.indd 131 25. 2. 2014 12:11:2725. 2. 2014 12:11:27
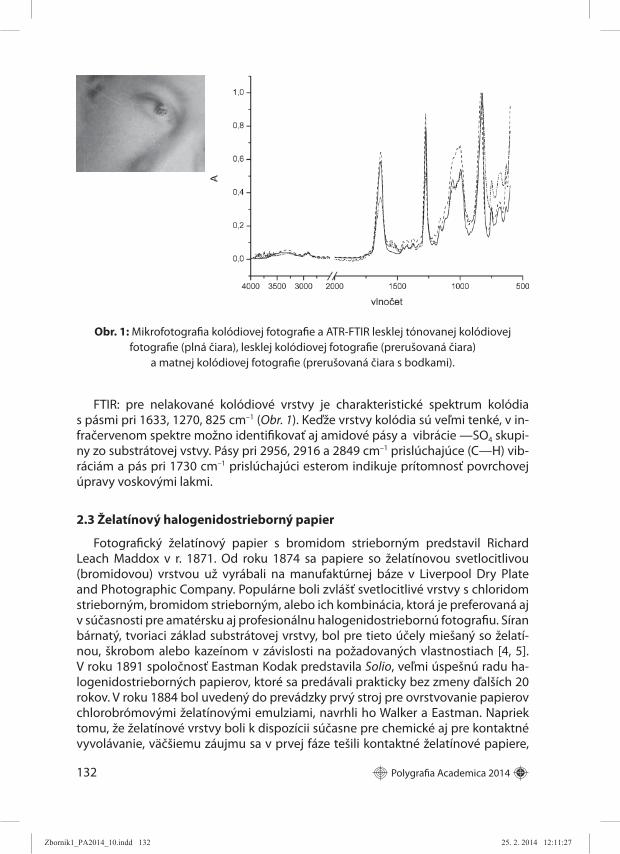
132 Polygrafi a Academica 2014
FTIR: pre nelakované kolódiové vrstvy je charakteristické spektrum kolódia s pásmi pri 1633, 1270, 825 cm–1 (Obr. 1). Keďže vrstvy kolódia sú veľmi tenké, v in-fračervenom spektre možno identifi kovať aj amidové pásy a vibrácie —SO4 skupi-ny zo substrátovej vstvy. Pásy pri 2956, 2916 a 2849 cm–1 prislúchajúce (C—H) vib-ráciám a pás pri 1730 cm–1 prislúchajúci esterom indikuje prítomnosť povrchovej úpravy voskovými lakmi.
2.3 Želatínový halogenidostrieborný papier
Fotografi cký želatínový papier s bromidom strieborným predstavil Richard Leach Maddox v r. 1871. Od roku 1874 sa papiere so želatínovou svetlocitlivou (bromidovou) vrstvou už vyrábali na manufaktúrnej báze v Liverpool Dry Plate and Photographic Company. Populárne boli zvlášť svetlocitlivé vrstvy s chloridom strieborným, bromidom strieborným, alebo ich kombinácia, ktorá je preferovaná aj v súčasnosti pre amatérsku aj profesionálnu halogenidostriebornú fotografi u. Síran bárnatý, tvoriaci základ substrátovej vrstvy, bol pre tieto účely miešaný so želatí-nou, škrobom alebo kazeínom v závislosti na požadovaných vlastnostiach [4, 5]. V roku 1891 spoločnosť Eastman Kodak predstavila Solio, veľmi úspešnú radu ha-logenidostrieborných papierov, ktoré sa predávali prakticky bez zmeny ďalších 20 rokov. V roku 1884 bol uvedený do prevádzky prvý stroj pre ovrstvovanie papierov chlorobrómovými želatínovými emulziami, navrhli ho Walker a Eastman. Napriek tomu, že želatínové vrstvy boli k dispozícii súčasne pre chemické aj pre kontaktné vyvolávanie, väčšiemu záujmu sa v prvej fáze tešili kontaktné želatínové papiere,
Obr. 1: Mikrofotografi a kolódiovej fotografi e a ATR-FTIR lesklej tónovanej kolódiovejfotografi e (plná čiara), lesklej kolódiovej fotografi e (prerušovaná čiara)
a matnej kolódiovej fotografi e (prerušovaná čiara s bodkami).
Zbornik1_PA2014_10.indd 132Zbornik1_PA2014_10.indd 132 25. 2. 2014 12:11:2725. 2. 2014 12:11:27

Polygrafi a Academica 2014 133
tzv. POP – printing-out-papers. Tento technický termín zaviedla v r. 1891 spoloč-nosť Ilford pre radu svojich chloridostriebrných fotografi ckých papierov a použí-va sa dodnes pre pomenovanie tých typov materiálov, u ktorých sa obraz vyvíja priamo expozíciou v UV časti spektra elektromagnetického žiarenia (slaný papier, albumínové fotografi cké vrstvy, kolódiové fotografi cké vrstvy). Expozícia sa preruší až vtedy, keď denzita v najtmavších tónoch dosiahne požadované hodnoty. Tento typ papierov bol najrozšírenejší v období medzi rokmi 1895 – 1905. Vznik obrazu urýchlený chemickou reakciou (developed-out-paper, DOP) s použitím vývojky sa rozšíril po roku 1905. DOP fotopapiere boli spočiatku vyrábané v dvoch modifi ká-ciách – ako lesklé a matné. Ako zmatňovacie prostriedky sa uplatnili napr. škroby a síran bárnatý. Ďalšou formou úpravy vzhľadu fotografi e bolo použitie odlišných textúr, ktoré sa dosahovalo úpravou papierovej podložky alebo barytovej vrstvy. Tónovanie želatínových fotografi í umožňuje dosiahnuť prakticky akúkoľvek žela-nú farbu. Mikroskopické charakteristiky DOP aj POP fotografi í sú veľmi podobné � barytová vrstva takmer prekrýva vlákna podložky, transparentná vrstva želatíny prehlbuje priestorový dojem viacvrstvovej štruktúry materiálu.
FTIR: infračervené spektrá emulznej vrstvy obsahujú charakteristické pásy pri 1630 a 1527 cm–1 ako aj ostatné amidové pásy charakteristické pre bielkoviny (1435, 1400 a 1336 cm–1). V spektre sa môžu objaviť aj pásy súvisiace s prítomnos-ťou plniva papierového nosiča – kaolínu. Valenčné vibrácie —OH skupín plniva sa prekrývajú s valenčnými vibráciami —OH skupín celulózy. Valenčné vibrácie ν(AlO) a ν(SiO) sa prekrývajú s ν(CO) vibráciami celulózy [6], identifi kačné pásy pre kaolín
Obr. 2: mikrofotografi a DOP fotografi e a ATR FTIR spektrum albumínovej fotografi e(čierna plná čiara), želatínovej DOP fotografi e z 50. rokov (prerušovaná čiara)
a DOP fotografi e z 20. rokov (bodkovaná čiara).
Zbornik1_PA2014_10.indd 133Zbornik1_PA2014_10.indd 133 25. 2. 2014 12:11:2925. 2. 2014 12:11:29
134 Polygrafi a Academica 2014
teda sú pri 3695 a 3619 cm–1. Ďalšie pásy pri 1031, 932 a 912 cm–1 môžu tiež pouka-zovať na prítomnosť kaolínu, ale aj BaSO4 zo substrátovej vrstvy (Obr. 2).
Poďakovanie
Táto štúdia bola podporená z grantu KEGA 002VŠVU-4/2012 a APVV 0324-10.
4. Literatúra
1. Derrick, M. R., Stulik, D., Landry, J. M. Infrared Spectroscopy in Conservation Science: Scientifi c Tools for Conservation. The Getty Conservation Institute, Los Angeles, CA, 1999. 235 strán. ISBN 0-89236-469-6.
2. Stulik, D., Kaplan, A. Silver Gelatin. The Atlas of Analytical Signatures of Photographic Processes. The Getty Conservation Institute, Los Angeles, CA. 44 strán. ISBN: 978-1-937433-04-8 (online resource).
3. Ricci, C., Bloxham, S., Kazarian, S. G. 2007. ATR-FTIR imaging of albumen photographic prints. Journal of Cultural Heritage. Vol. 8, Issue 4, s. 387–395.
4. Reilly, J. M. Care and Identifi cation of 19th-Century Photographic Prints. Kodak Books, 2001. 3. vydanie. 116 strán. ISBN 0-87985-365-4.
5. Stulik, D., Kaplan, A. Silver Gelatin. The Atlas of Analytical Signatures of Photographic Processes. The Getty Conservation Institute, Los Angeles, CA. ISBN: 978-1-937433-13-0 (online resource).
6. Hon, D. N.-S., Shirashi, N. Wood and cellulosic chemistry. Marcel Dekker: New York, 2009. 914 strán. ISBN 0-8247-002-4.
Zbornik1_PA2014_10.indd 134Zbornik1_PA2014_10.indd 134 25. 2. 2014 12:11:3025. 2. 2014 12:11:30

Polygrafi a Academica 2014 135
Study of rheological properties
of UV and Hybrid off set inks
Bohumil Jašúrek, Helena Odstrčilová, Jan Vališ, Tomáš Syrový
Department of graphic arts and photophysics, Faculty of chemical-technology,University of Pardubice, Studentská 95, 532 10 Pardubice, Czech Republic,
Abstract: In this work, rheological properties, tack and misting of process off set hybrid inks and UV curable inks were tested. The evaluated physical properties were studied for unemulsifi ed inks and also for their emulsions with fountain solution. The rheological properties of tested inks were measured by rheometr RV1 HAAKE and evaluated properties were fl ow behaviour, viscosity regeneration and thixotrophy. For off set printing inks is also important their tack. This parameter together with misting was measured by using of Tackmaster-92. All mentioned parameters were measured for temperature 32 °C.
Keywords: Off set, UV Ink, Hybrid Ink, Rheology, Tack
1. Introduction
The quality of off set printing process depends on many chemical and physical specifi cs of the materials and components involved in the process. The most important are printing inks (e.g. rheological properties, surface tension, temperature behaviour), damping solution (e.g. water hardness, additives, pH value, surface tension), printing plate (e.g. surface tension of printing and nonprinting areas, roughness), inking rollers and their blankets (e.g. surface tension and roughness, viscoelastic properties, ink acceptance and ink transfer behaviour), printing press (e.g. design of the printing, inking and damping unit, temperature control) etc. [1]
UV off set printing inks dry by chain reaction (free radical or cationic polymerization). This type of ink contains a photoinitiator which when is activated with correct wavelength of radiation (mostly UV radiation), undergoes a rapid polymerization reaction. Binders consist of monomers and oligomers and do not contain volatile organic compounds (VOCs). UV inks give a number of advantages compared to conventional off set printing inks. Between the most important ones belong rapid curing time (fractions of second), high print gloss, abrasion resistant surface, very good chemical resistance and also less problems of sample blocking.
Hybrid inks are based on conventional off set printing inks, but contain part of UV curable components as well and are able to run on conventional press machine equipped with UV radiation source. Oxidative drying of conventional
Zbornik1_PA2014_10.indd 135Zbornik1_PA2014_10.indd 135 25. 2. 2014 12:11:3025. 2. 2014 12:11:30

136 Polygrafi a Academica 2014
off set inks containing drying oils is caused by molecular linkage with oxygen from the air. One of the major advantages of hybrid ink technology is that smaller commercial printers can add inline UV varnishing to their operations at relatively low cost. The hybrid inks should be printable with blankets that are also suitable for conventional inks (NBR rubber) compared to UV inks that need special blankets (based on EPDM). [2]
2. Experimental part
In this study, two hybrid (cyan and magenta, producer XSYS Print Solution) and two UV (cyan and magenta, producer Sun Chemical) sheetfed off set printing inks were tested (Table 1). Emulsions of tested inks were prepared using fountain solution containing 90 % of water (water hardness of 8.4 °dH), 5 % of fountain solution additive V50 (POOLA) and 5 % of isopropyl alcohol.
Tab. 1: Sheetfed off set printing inks tested in this work.
Name of product Drying Ink denotation
Cyan UV Hybrid Plus/Litho UO350080 Hybrid HCMagenta UV Hybrid Plus/Litho UOH30080 Hybrid HM
Cyan Suncure Starluxe UV UVCMagenta Suncure Starluxe UV UVM
2.1 Emulsions
Duke Ink Water Emulsifi cation Tester Model D-10 (HDuke Enterprises, USA) was used for preparation of emulsions. The emulsion properties were defi ned by the amount of fountain solution pick-up (Emax) and time (t) needed for achievement of saturated emulsion. During the test, the 50 g of off set printing ink and 50 g of fountain solution was stirred (90 rpm) and after every 90 turns of stirring tools amount of fountain solution pick-up was measured. In Table 2 are summarized the results of ink emulsifi cation.
From the Table 2 is apparent that both hybrid inks have the same behaviour and UV inks are diff erent. Ink UVC picks-up the same amount of fountain solution as hybrid inks (40 %), but needs a little bit more time to reach stable emulsion. Opposite these three inks, UV magenta ink picks-up much more fountain solution (60 %) and needs longer time to reached stable emulsion. Off set inks that pick-up higher amount of fountain solution can have tendency to scumming during the print.
Tab. 2: Duke fountain solution pick-up. [3]
HC HM UVC UVM
Emax (%) 40 40 40 60t (min) 5 5 6 9
Zbornik1_PA2014_10.indd 136Zbornik1_PA2014_10.indd 136 25. 2. 2014 12:11:3025. 2. 2014 12:11:30

Polygrafi a Academica 2014 137
2.2 Flow curves
The fl ow behaviour and the viscosities of unemulsifi ed inks and emulsions were measured on rotational rheometer RotoVisco 1 (HAAKE, Germany). All tests were done with a one cone-plate measuring system (titanium cone with 10 mm radius and 1° angle). Thermostat DC 30 (HAAKE, Germany) was used for temperature control during the tests. Flow characteristics were measured at shear rates from 3 to 3,000 s–1 and temperature of 32 °C.
Characteristics of tested inks were evaluated by means of Casson model function [4]:
τ0.5 = τ00,5 + η∞
0.5 γ0.5 (1)
where τ is shear stress (Pa), τ0 Casson yield point (Pa), η∞ Casson viscosity (Pas) and γ shear rate (s–1). Table 3 summarizes parameters of Casson model for unemulsifi ed and emulsifi ed inks with determination coeffi cients. Parameter τ0/η∞ describes the tendency of inks to mist. Inks with higher τ0/η∞ have lower tendency to mist than inks with lower τ0/η∞.
Tab. 3: Characteristics of unemulsifi ed and emulsifi ed inks evaluated from fl ow curves by Casson model. [3]
Type of ink Parameters Unemulsifi ed inks Emulsions
HC
τ0 (Pa) 210.4 82.7η∞ (Pas) 12.5 3.2
R2 0.999 0.997τ0/η∞ (s-1) 16.8 25.8
HM
τ0 (Pa) 135.0 160.7η∞ (Pas) 12.7 2.0
R2 0.999 0.995τ0/η∞ (s-1) 10.7 79.0
UVC
τ0 (Pa) 45.8 42.6η∞ (Pas) 11.4 3.0
R2 0.999 0.994τ0/η∞ (s-1) 4.0 14.4
UVM
τ0 (Pa) 125.6 175.9η∞ (Pas) 8.4 3.8
R2 0.999 0.996τ0/η∞ (s-1) 15.0 46.7
Tab. 4: Viscosity regeneration of unemulsifi ed (un.) and emulsifi ed (em.) inks. [3]
Type of inkHC HM UVC UVM
un. em. un. em. un. em. un. em.Vis. reg. (%) 66.3 54.4 53.1 39.0 91.7 34.2 – 35.6
Zbornik1_PA2014_10.indd 137Zbornik1_PA2014_10.indd 137 25. 2. 2014 12:11:3125. 2. 2014 12:11:31

138 Polygrafi a Academica 2014
2.3 Thixotropy
In this work, thixotrophy of unemulsifi ed and emulsifi ed inks was evaluated by method of viscosity regeneration. The test was divided into three intervals, the fi rst interval with γ = 5 s–1 for 1 minute, the next interval with γ = 250 s–1 for 30 seconds and the last interval with γ = 5 s–1 for 3 minutes. From the fi rst and second interval, the value of parameter Δη (100 %) was determined (diff erence between viscosities). From the third interval (after 3 minutes) the percentage of regeneration was calculated. The rate of recovery is an essential factor for levelling the ink on the substrate. The results of viscosity regeneration of unemulsifi ed and emulsifi ed inks are summarized in Table 4. Unemulsifi ed inks show faster regeneration of viscosity than emulsions. Faster regeneration facilitates the ability to achieve the required layer thickness, as the ink fi lm strength is reached in shorter time. A slower rate of structural regeneration off er a good levelling behaviour, but too slow rate can cause an increase in dot gain. Both hybrid inks have faster regeneration of viscosity than UV inks.
2.4 Tack and misting
The Tackmaster-92 (Kershaw Instrumentation, USA) was used to measure the tack and misting characteristics of unemulsifi ed inks and their emulsions. The temperature of tackmaster rollers was set to 32 °C for all measurements. The ink was applied to the tackmaster with a small pipette that holds 1.2 cm3 and left at low speed (300 rpm) for 180 seconds to equilibrate. During the tack measurement (10 minutes), the speed was 1,200 rpm. Misting test was performed by placing a white paper behind the tackmaster rollers which collects the mist for 10 minutes at 1 200 rpm. The applied ink volume was triplicated (3.6 cm3) in comparison with tack measuring. Papers with misted ink were captured by digital microscope z-Pix 200 (Carson) and obtained images were analysed by Image Analysis method (software AnaTis2). The evaluated parameter was dot area of mist droplets.
The tack of the ink was characterised with two parameters (the tack reached after one minute (T1) and the fi nal tack (T2) at the end of the test (after 10 minutes)). In Table 5 are summarized results of tack for unemulsifi ed and emulsifi ed inks at 32 °C. High tack is generally desirable, but if the tack is too high it could cause picking (fi bres are pulled out of the paper). Usually the tack of off set printing inks is between 12 and 20 g/m. From this point of view, tackiness of studied inks is at lower limit and picking caused by emulsions will be low. The lowest tack shows UVM ink.
Tab. 5: Tack of unemulsifi ed (un.) and emulsifi ed (em.) inks. [3]
Type of inkHC HM UVC UVM
un. em. un. em. un. em. un. em.T1 (g/m) 13.4 14.5 12.7 10.5 10.7 14.5 7.3 8.8T2 (g/m) 16.1 17.6 14.2 13.8 13.5 17.5 10.1 13.5
Zbornik1_PA2014_10.indd 138Zbornik1_PA2014_10.indd 138 25. 2. 2014 12:11:3125. 2. 2014 12:11:31
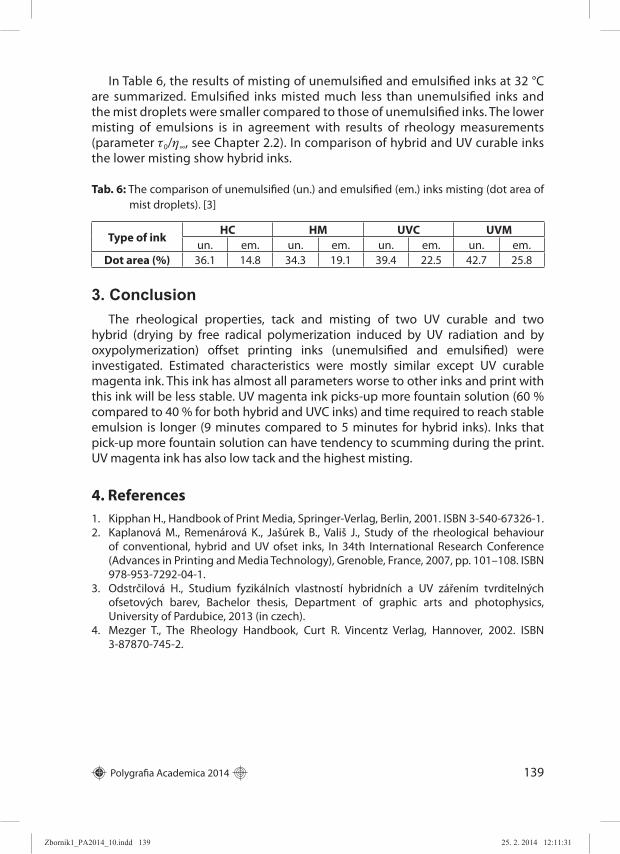
Polygrafi a Academica 2014 139
In Table 6, the results of misting of unemulsifi ed and emulsifi ed inks at 32 °C are summarized. Emulsifi ed inks misted much less than unemulsifi ed inks and the mist droplets were smaller compared to those of unemulsifi ed inks. The lower misting of emulsions is in agreement with results of rheology measurements (parameter τ0/η∞, see Chapter 2.2). In comparison of hybrid and UV curable inks the lower misting show hybrid inks.
Tab. 6: The comparison of unemulsifi ed (un.) and emulsifi ed (em.) inks misting (dot area of mist droplets). [3]
Type of inkHC HM UVC UVM
un. em. un. em. un. em. un. em.Dot area (%) 36.1 14.8 34.3 19.1 39.4 22.5 42.7 25.8
3. ConclusionThe rheological properties, tack and misting of two UV curable and two
hybrid (drying by free radical polymerization induced by UV radiation and by oxypolymerization) off set printing inks (unemulsifi ed and emulsifi ed) were investigated. Estimated characteristics were mostly similar except UV curable magenta ink. This ink has almost all parameters worse to other inks and print with this ink will be less stable. UV magenta ink picks-up more fountain solution (60 % compared to 40 % for both hybrid and UVC inks) and time required to reach stable emulsion is longer (9 minutes compared to 5 minutes for hybrid inks). Inks that pick-up more fountain solution can have tendency to scumming during the print. UV magenta ink has also low tack and the highest misting.
4. References
Kipphan H., Handbook of Print Media, Springer-Verlag, Berlin, 2001. ISBN 3-540-67326-1.1. Kaplanová M., Remenárová K., Jašúrek B., Vališ J., Study of the rheological behaviour 2. of conventional, hybrid and UV ofset inks, In 34th International Research Conference (Advances in Printing and Media Technology), Grenoble, France, 2007, pp. 101–108. ISBN 978-953-7292-04-1.Odstrčilová H., Studium fyzikálních vlastností hybridních a UV zářením tvrditelných 3. ofsetových barev, Bachelor thesis, Department of graphic arts and photophysics, University of Pardubice, 2013 (in czech).Mezger T., The Rheology Handbook, Curt R. Vincentz Verlag, Hannover, 2002. ISBN 4. 3-87870-745-2.
Zbornik1_PA2014_10.indd 139Zbornik1_PA2014_10.indd 139 25. 2. 2014 12:11:3125. 2. 2014 12:11:31

140 Polygrafi a Academica 2014
The infl uence of NOx on the stability
white colored Inkjet prints
Slugic Ana1, Puhalo Mateja1, Majnaric Igor1,Bolanca Mirkovic Ivana1, Rehakova Milena2
1University of Zagreb Faculty of Graphic Arts, Getalciceva 2, Zagreb, Croatia,[email protected]
2Faculty of Chemical and Food Technology, Radlinskeho 9, Bratislava, Slovak Republic
Abstract: Printing on black colored and transparent substrates is impossible without application of white inks. In this case, high covering inorganic pigments based on titanium dioxide are used. Although printing of white ink can be used in conventional printing techniques (fl exographic printing, gravure printing and off set printing), it is more frequently used in Inkjet UV curing technology. Unfortunately, concentration of white pigments cannot be modifi ed in Inkjet. Therefore, optimal color values were printed in three layers on black substrate, using white UV LED curing Inkjet ink. Since stability of white Inkjet prints is still unknown, accelerated ageing method at higher temperature and increased concentration of NOx (ISO 5630-5, 6) was used. The results showed great infl uence of NOx on white UV LED Inkjet colorants. Major color changes occurred after fi rst day of exposure of the prints to NOx (∆E2layers, 1st day of exposure to NOx, 100%HV = 42.72). No signifi cant color changes happened afterwards (∆E2layers, 5th day of exposure to NOx, 100%HV = 42.89).
Keywords: Accelerated ageing with NOx, white UV LED Inkjet inks, multilayer printing, CIE Lab
1. Introduction
Together with electrophotography, Inkjet is the most developed digital printing technology. It is completely non-impact technology, in which ink is sprayed directly from tiny nozzles onto substrate. Other important characteristic of Inkjet are liquid inks. They form a single drop, which has average radius of 30 μm, while its volume amounts 14 pL. Two basic principles of Inkjet technology are continuous and drop on demand (DOD) Inkjet. Nowadays, DOD principle is applied more often and it comes in three diff erent systems: bubble jet, piezo Inkjet and electrostatic Inkjet. In piezo Inkjet, drop is generated and ejected from the nozzle using deformation of ink microchamber. When electric signals come to piezoceramic microelements, it causes the above deformation. These microelements have distortion properties during electric charge activity.
This technology may use diff erent inks. One of them are UV inks. Typical components in UV Inkjet inks are: reactive diluents (monomers), resins (oligomers), colorant (pigment), photoinitiator and additives. [1] White inkjet ink is a fairly new development within the wide-format graphics industry. [2]
Zbornik1_PA2014_10.indd 140Zbornik1_PA2014_10.indd 140 25. 2. 2014 12:11:3125. 2. 2014 12:11:31

Polygrafi a Academica 2014 141
Titanium dioxide is white pigment, mostly used in Inkjet inks. There are two forms of TiO2: anatase and rutile. Anatase pigments are much more used in liquid printing inks due to their softer structure. Rutile pigments have higher refractive index, higher opacity and somewhat rougher structure. [3]
A nitrogen oxide (NOx) is generic term for a group of highly reactive gases. Most of them are emitted in air in the form of nitic oxide (NO) and nitrogen dioxide (NO2). NOx causes a wide variety of health and environmental impacts. Together with SOx (sulfur dioxide and sulfur trioxide) is the major contributor to the “acid rain”. [4, 5]
For high temperature operations, nitrogen in the air will react with oxygen to form oxides of nitrogen, NO, and NO2. The resulting NOx concentration depends on the highest temperature and how quickly the gas cools. The higher the temperature, the greater is the formation of NOx. NO is a colorless gas with virtually no water solubility. In the presence of excess oxygen, NO will slowly convert to nitrogen dioxide. Nitrogen dioxide is also a colorless gas. [6]
Lightfastness of Inkjet prints is not particularly high. That is why this subject was researched in numerous papers. The same Inkjet ink can’t be used for generating diff erent graphic products, mainly caused by low lightfastness. Color diff erence can be tracked as a function of spectral energy distribution of UV light source. Inkjet prints can also be exposed to diff erent conditions.
Several papers researched photocatalytic oxidation of NOx gases using TiO2. They have used surface specifi c techniques to investigate the NOx adsorptive reaction at the TiO2 substrate surface. One of the main conclusions was that the reaction products observed were independent of the time of exposure or of the NOx concentration. [7]
Colored Inkjet prints changes tone value in very short period. Especially if dye and pigment Inkjet inks were used. Dye inks gave better results. The highest change took place in yellow dye ink. Inks that contain pigments showed major changes in dark cyan, magenta and yellow color. [8]
Researches in area of photocatalytic reaction of NO and NO2 and the infl uence of several parameter showed that these pollutants can aff ect the performance of stones containing TiO2. The use of TiO2 photocatalyst in combination with cementations and other construction materials has shown a favorable eff ect in the removal of nitrogen oxides. [5]
2. Experiment
Exposure prints to NOx and higher temperature aims to assure faster changes in lightfastness of the prints. Combined accelerated thermal ageing according to ISO 5630-5 and 5630-6 was employed. Samples were placed in pyrex bottles, climatized for 24 hours at 23 °C and 50 % RH. NOx in concentration of 800 ppm was inserted into selected bottles and closed with polyphenylsiloxane airtight seal with Viton® (DuPont) gasket. The samples were aged 1, 3 and 5 days at 100 °C.
Zbornik1_PA2014_10.indd 141Zbornik1_PA2014_10.indd 141 25. 2. 2014 12:11:3125. 2. 2014 12:11:31

142 Polygrafi a Academica 2014
Substrate used in experiment was Splendorlux Versus (grammage 250 g/m2 gloss 68,6 (angle of 60°), color L = 7,74; a = –1,95; b = –0,83). This is multiply one-side cast-coated paper made of ecological chlorine free pulp. [9]
Roland VersaUV LEC-300, Inkjet printing machine, which works on piezo Inkjet principle, was used for printing of samples. It uses ECO-UV inks, and in accordance with our experiment, only white ink was printed. Components of used ink, expressed in weight percentages, are: acrylic esters (30–40 %), titanium dioxide (10–20 %), hexamethylene diacrylate (10–20 %), tri(propylene glycol) diacrylate (10–20 %), phosphine oxide derivative (5–15 %), other photo sensitive monomers (0–5 %) and synthetic resins (0,5–5 %). Ink is white liquid, viscosity 6–8 mPa·s. It has characteristic odor and fl ash point (66 °C). [10]
Connection of DTP computer and Roland VersaUV LEC-300 printing machine was made through RIP software VersaWorks, which enables image conversion in screened form, using PostScript 3. RIP was set up for three diff erent types of printing: printing of white ink in one layer, printing of white ink in two layers and printing of white ink in three layers. Plate with white printing elements was generated using Adobe Illustrator CS3, and it consisted 20, 40, 60, 80 and 100 % halftone value areas.
All of the samples were measured by spectrophotometer X-Rite DTP20 “Pulse”. This instrument measures the refl ection of colored sample, and as a results it shows L*a*b*, and C* and H* valuables. Every single sample was measured six times, and measuring results were simultaneously showed on the computer by ColorShopX software. Based on the measured valuables, there were calculated average valuables that were later used for calculating color diff erence, ΔE. Thereby, mathematical formula ΔE2000 was used. Obtained results were then graphically shown, converted to two and three-dimensional diagrams, which were generated with Origin 8.5 software.
3. Results and Discussion
In order to detect changes that happened on white ink prints, due to their exposure to NOx compounds, we were analyzing their coloration. Figures 2–4 show changes in color and lightness, depending on number of layers of white ink that were printed on the substrate.
Looking at the results, it is obvious that the greatest changes, both in color and lightness occurred at the fi rst period of the exposure to NOx compounds. Change is greatest between baseline measurement and 1st day of exposure to NOx (min. concentration achieved ∆E1layer, 100% HV = 34.25; ∆E2layers, 100% HV = 42.72;
∆E3layers, 100% HV = 18.96). After that, prints are stabilizing, and no signifi cant change was spotted on 3rd and 5th day of exposure to NOx (max. concentration achieved ∆E1laye,100% HV = 34.59; ∆E2layers, 100% HV = 42.89; ∆E3layers, 100% HV = 21.15 ).
Regarding color change, the most stable samples are the ones with only one layer of white ink applied. After huge primal change, they are experiencing only minor changes in color. But, we have a completely diff erent situation when it comes
Zbornik1_PA2014_10.indd 142Zbornik1_PA2014_10.indd 142 25. 2. 2014 12:11:3125. 2. 2014 12:11:31

Polygrafi a Academica 2014 143
Fig. 3: White ink printed in three layers: a) color changes; b) lightness changes.
Fig. 1: White ink printed in one layer: a) color changes; b) lightness changes.
Fig. 2: White ink printed in two layers: a) color changes; b) lightness changes.
Zbornik1_PA2014_10.indd 143Zbornik1_PA2014_10.indd 143 25. 2. 2014 12:11:3125. 2. 2014 12:11:31

144 Polygrafi a Academica 2014
to change in lightness. Samples with three layers of white ink show the greatest stability in lightness, while two and one layers of white ink show respectably higher diff erences in lightness. In all cases of lightness change, samples are getting darker.
If we look at the changes in color (Figures 2a, 3a and 4a), we can see that no matter of number of layers of white ink applied or halftone value, all samples are changing in +b and +a direction. The change is more prominent in +b direction, what implies that samples have become yellowish.
If we observe color change in considering halftone values, there is also a trend that happens at all three fi gures. With increase of halftone values, samples are changing in +a and –b direction (green-blue color). On all fi gures that change is most noticeable at baseline measurement. Samples with two and three layers of white ink show a diff erence in behavior of 100 % halftone values. In their cases, solid tone areas are changing in +b direction, that means towards yellow color. Such diff erence in color creates specifi c curve that is also noticeable after exposure of prints to NOx.
Increase of number of layers of white ink causes higher color diff erences between diff erent halftone value areas. On Figure 2 (one layer of white ink), we can’t even distinct changes between 20 %, 40 % and 60 % halftone value, but they are very clear at Figure 4 (three layers of white ink). Also, we can notice increasing change of solid tone area with number of layers increase.
4. Conclusion
Printing white ink on black paper substrate is not suffi cient, because it does not employ in contrast high enough. Forming multiple layers of white ink will generate color diff erence of ∆E1-3layers; 100% HV = 19.59. Optimal number of layers is proved to be two. This way, suffi cient opacity will be achieved, and color diff erence compared to one layer of white ink will amount ∆E1-2layers; 100% HV = 14.51.
Exposure of the prints to NOx will result in higher deviation of white prints. The highest change will occur after one day of exposure (∆E1-3ayers; 100%HV = 34.70; ∆E1-2 layers, 100% HV = 10.75). After that, prints stabilized and no further color change was detected. Prints printed in diff erent halftone values react diff erently on the exposure of NOx. The higher halftone value, the greater the color diff erence is. Unfortunately, increasing the number of layers of white inks will cause the problem of generating low halftone values ( they will be completely lost). Therefore, white LED UV Inkjet inks are recommended for printing line art illustrations and larger sizes text (over 6 pt).
5. References
1. Photo Marketing Association International. 2004. Digital Imaging: UV-Curable Inks and HSE. no. 517. pp. 5–6.
2. Work R. 2012. Think Ink: White Inkjet Ink. [cit. 14. 1. 2014.]. Available on Internet: <http://sdgmag.com/article/printing-fi nishing/think-ink-white-inkjet-ink>.
Zbornik1_PA2014_10.indd 144Zbornik1_PA2014_10.indd 144 25. 2. 2014 12:11:3125. 2. 2014 12:11:31

Polygrafi a Academica 2014 145
3. Eldred N. 2001. What the Printer Should Know About Ink, 3rd ed. GATF, p. 350. 4. Land E., Bergin M., Huey G., 2009. Photocatalytic Degradation of NOx by TOTO’s Hydrotect
(TiO2 Impregnated) Surfaces, Georgia Institute of Technology. 5. Ballari M. M., Hunger M., Hüsken G., Brouwers H. J. H., Photocatalytic Concrete Stones
Containing TiO2 for Atmospheric NOx Removal, Faculty of Engineering Technology, University of Twente, [cit. 14. 1. 2014]. Available on Internet: <http://josbrouwers.bwk.tue.nl/publications/Conference55.pdf>.
6. NOx removal. [cit. 14. 1. 2014]. Available on Internet: <http://web.archive.org/web/20071008211011/http://www.branchenv.com/nox/nox_info.asp>.
7. Dalton J. S., Janes P. A., Jones N. G., Nicholson J. A., Hallam K. R., Allen G. C., 2002. Photocatalytic oxidation of NOx gases using TiO2: A surface spectroscopic approach. University of Bristol.
8. Lešković T., 2007. Postojanost Inkjet otisaka u kratkom vremenskom periodu, University of Zagreb, diplomski rad.
9. Fedrigoni. 2005. Spendorlux Color Intenso., p. 2. 10. Roland DG Corporation. 2009. Material Saftey Data Sheet, For immediate UV ink-curing
two UV LED lamps are being used., p. 150.
Zbornik1_PA2014_10.indd 145Zbornik1_PA2014_10.indd 145 25. 2. 2014 12:11:3125. 2. 2014 12:11:31
146 Polygrafi a Academica 2014
Investigation of writing-printing sequence
using scanning electron microscope
Adriana Jabconová1, Alena Uváčková1, Marek Rychnavský1,Michal Roščák2, Bohumil Bohunický2
1Institute of Forensic Science, Sklabinská 1, 812 72 Bratislava, [email protected], spol. s r. o.
Abstract: Sequence identifi cation of handwriting and printing is routinely solved by refl ected light microscopy. Writing agent remains its characteristic refl ective properties when passing over the toner print. On the other hand, the toner printed under handwritten line masks the characteristic gloss of the pen totally. This method becomes diffi cult when special situation occurs: toner printing itself is too glossy, pen shows no shiny refl ection, damaged pen gives non-continuous trace, black pen crosses with the black toner or when toner coverage is not continuous. In this paper we investigated the writing sequence of non-trivial cases using scanning electron microscope (SEM).
Key words: document, cross line, pen, toner, electron microscope
1. Introduction
The basic target of any sequencing examination is to establish which of two or more lines was placed onto the paper fi rst. The determination of the order of crossing lines is appropriate in cases if there are suspicions that the content of a document has been altered by adding a part to it, for instance in a will or signed legal agreement (blank signature).
The examination of the questioned intersection area is carried out through microscopic examination (standard stereomicroscopic techniques, scanning electron microscope or atomic force microscope), possibly in combination with a lifting technique. The examination concentrates on the morphological structure of the intersection area and the surroundings.
A scanning electron microscope (SEM) is a type of electron microscope that produces images of a sample by scanning it with a focused beam of electrons. The electrons interact with atoms in the sample, producing various signals that can be detected and that contain information about the sample‘s surface topography and composition.
In this study we used secondary electrons (SE), and photons of visible light to observe the cathode luminescence (CL) eff ect.
The SE image brings mostly the information about the topography (row B). The CL image shows the luminescence stimulated by electron beam. Usually, the
Zbornik1_PA2014_10.indd 146Zbornik1_PA2014_10.indd 146 25. 2. 2014 12:11:3125. 2. 2014 12:11:31

Polygrafi a Academica 2014 147
fi ller used in the paper is most active. Also pigments, inks and tonners show the electroluminescence eff ect with enough contrast to get evaluable images (rows A, C).
2. Pictures
Fig. 2: The pen trace shows minimal refl ection. In the SE imagingat 15 kV sequence solution is obvious.
Fig. 1: Easy to solve intersections. Pen creates typical shiny trace on the black toner.When toner is on top, refl ection is masked.
Scanning electron microscopy can be used as a non-destructive method for solving the writing/printing sequence identifi cation in cases where optical microscopy cannot give relevant results. The sequence is identifi ed by the structure of the toner line in the intersecting area. The SE imaging gives information about
Zbornik1_PA2014_10.indd 147Zbornik1_PA2014_10.indd 147 25. 2. 2014 12:11:3125. 2. 2014 12:11:31

148 Polygrafi a Academica 2014
the detailed surface structure of toner line continuity: cracks for printing fi rst, decomposition of toner line to particles for writing fi rst. The CL imaging can be used as high resolution alternative to the optical microscopy with signifi cantly better resolution and depth of fi eld giving clear information about the toner line continuity.
Fig. 3: Column 1, 3: Print-over-pen: The toner trace is not continuous. In the intersecting area the toner trace is decomposited to individual toner particles. To explain the
mechanism could be an interesting question. Is it because the adhesion of the inkis lower than the paper? Is it because the ink interacts with the electric charge
on selenium drum in the printer? Or is it just because the toner does not penetrateinto the groove of pen line?
Column 2, 4: Pen-over-print: The toner trace is continuous. The intersecting areais pressed down but still remains solid. Sometimes, characteristic cracks parallel
to the pen trace direction are visible (yellow arrows).
1 2 3 4
Zbornik1_PA2014_10.indd 148Zbornik1_PA2014_10.indd 148 25. 2. 2014 12:11:3125. 2. 2014 12:11:31

Polygrafi a Academica 2014 149
Acknowledgement
We would like to thank TESCAN a.s. company for supporting us with their microscopes.
3. References
1. D. Ellen. 1997. The Scientifi c Examination of Documents, Methods and Techniques, 2nd
edition. 2. R. D. Koons. 1985. Sequencing of Intersecting Lines by Combined Lifting Process and
Scanning Electron Miscroscopy. Forensic Sci. Int., Vol. 27, p. 261–276.3. P. A. Waeschle. 1979. Examination of Line Crossings by Scanning Electron Microscopy. J.
Forensic Sci., Vol. 24, p. 569–578.4. M. G. Planty. 1997. Determining the Relative Chronology of Intersecting Ball-Point Pen
Lines and Laser Printed Document Marks – Linton Godown Revisited. Int. J. Forensic Doc. Examiners, Vol. 3, p. 31–34.
5. S. Tollkamp and H. G. Fackler. 1996. Use of Low Voltage SEM in the Detection of Forgeries. Int. J. Forensic Doc. Examiners, Vol. 2, p. 333–341.
Zbornik1_PA2014_10.indd 149Zbornik1_PA2014_10.indd 149 25. 2. 2014 12:11:3225. 2. 2014 12:11:32

150 Polygrafi a Academica 2014
Forensic experts’ view on counterfeits
Adriana Jabconová, Elena Blahová,Tatiana Dugovičová, Juraj Matějka
Institute of Forensic Science, Sklabinská 1, 812 72 Bratislava,[email protected], [email protected],[email protected], [email protected]
Abstract: The poster interprets, illustrates and compares characteristic features of food vouchers, OMV coupons and vignettes counterfeits with originals and focuses on diff erences in printing processes and imitation of graphic security features and additional protection.
Key words: food vouchers, Lyoness OMV coupons, vignettes, security features, printing processes, counterfeits
1. Introduction
The poster provides an overview of security printing products with lower level of technical protection.
The weak points of the original products caused that they are easily falsifi ed.
2. Findings
Questioned products – food vouchers Chèque Déjeuner 2013, Lyoness OMV coupons 2013 and vignettes of Slovak Republic 2013, submitted for expertises, were compared with suitable originals. Each of them was researched by methods and equipment of technical document examination: macroscopic examination, microscopic examination, examination in UV light, examination in oblique light, examination in transmitted light, examination of IR absorption, examination of IR luminicsence and comparison, with the same result – “COUNTERFEITS”.
2.1. Food vouchers Chèque Déjeuner 2013
Counterfeits of food vouchers show some characteristics similar to originals: the form and the content of vouchers.
Counterfeits refl ect many diff erencies in comparison with originals:diff erent type of paper substrate (paper with imitated security fi bres)– used printing processes– quality of holographic stripe, microperforation– details of graphic elements – background printing, pre-printed texts, endless – microtext, unique identifi cation marks (bar code, numbering).
Zbornik1_PA2014_10.indd 150Zbornik1_PA2014_10.indd 150 25. 2. 2014 12:11:3225. 2. 2014 12:11:32

Polygrafi a Academica 2014 151
Fig. 1: Counterfeit (left) and original (right) of food vouchers 2013 – front side.
Fig. 2: Counterfeit (left) and original (right) of food vouchers 2013 – back side.
Fig. 3: Counterfeit (left) and original (right) of food vouchers 2013 –detail of holographic stripe and microperforation.
Zbornik1_PA2014_10.indd 151Zbornik1_PA2014_10.indd 151 25. 2. 2014 12:11:3225. 2. 2014 12:11:32

152 Polygrafi a Academica 2014
Fig. 4: Counterfeit (left) and original (right) of food vouchers 2013 –detail of background structures, numbering and denomination.
Fig. 5: Counterfeit (left) and original (right) of food vouchers 2013 –detail of bar code and MRZ.
Fig. 6: Counterfeit (left) and original (right) of food vouchers 2013 – detail of graphics.
2.2. Lyoness OMV coupons 2013
Counterfeits of Lyoness OMV coupons 2013 show some characteristics similar to originals: the form and the content of coupons.
Zbornik1_PA2014_10.indd 152Zbornik1_PA2014_10.indd 152 25. 2. 2014 12:11:3225. 2. 2014 12:11:32

Polygrafi a Academica 2014 153
Counterfeits refl ect many diff erencies in comparison with originals:diff erent type of paper substrate– used printing processes– details of graphic elements – background printing, pre-printed texts, unique – identifi cation marks (bar codes, control area)dysfunctionality of black-yellow control area– nature of endless text „OMV OMV OMV ...“.–
Fig. 7: Counterfeit (left) and original (right) of Lyoness OMV coupon 2013 – front side.
Fig. 8: Counterfeit (left) and original (right) of Lyoness OMV coupon 2013 – back side.
Fig. 9: Counterfeit (left) and original (right) of Lyoness OMV coupon 2013 –detail of bar code and control area in visible light.
Zbornik1_PA2014_10.indd 153Zbornik1_PA2014_10.indd 153 25. 2. 2014 12:11:3225. 2. 2014 12:11:32

154 Polygrafi a Academica 2014
Fig. 10: Counterfeit (left) and original (right) of Lyoness OMV coupon 2013 –detail of bar code and control area in UV light.
Fig. 11: Counterfeit (left) and original (right) of Lyoness OMV coupon 2013 –detail of endless text “OMV OMV OMV...”.
Fig. 12: Counterfeit (left) and original (right) of Lyoness OMV coupon 2013 –detail of pre-printed texts.
2.3. Vignettes 2013
Counterfeits of 1-year vignettes 2013 show some characteristics similar to originals: the form and the content of vignettes.
Counterfeits refl ect many diff erencies in comparison with originals:another type of substrate (adhesive foil, back paper)– quality of printing processes–
Zbornik1_PA2014_10.indd 154Zbornik1_PA2014_10.indd 154 25. 2. 2014 12:11:3225. 2. 2014 12:11:32

Polygrafi a Academica 2014 155
quality of hologram– details of graphic elements – background printing, endless microtext, pre-printed – texts (adhesive foil), pre-printed texts (back paper)quality of bar codes (adhesive foil)–
Fig. 13: Counterfeit (left) and original (right) of 1-year vignette 2013 –adhesive foil on the front side.
Fig. 14: Counterfeit (left) and original (right) of 1-year vignette 2013 –paper on the back side.
Fig. 15: Counterfeit (left) and original (right) of 1-year vignette 2013 –detail of bar code on the adhesive foil.
Zbornik1_PA2014_10.indd 155Zbornik1_PA2014_10.indd 155 25. 2. 2014 12:11:3225. 2. 2014 12:11:32

156 Polygrafi a Academica 2014
Fig. 16: Counterfeit (left) and original (right) of 1-year vignette 2013 –detail of endless microtext on the adhesive foil.
Fig. 17: Counterfeit (left) and original (right) of 1-year vignette 2013 –detail of graphic on the adhesive foil.
Fig. 18: Counterfeit (left) and original (right) of 1-year vignette 2013 –detail of pre-printed text on the back paper.
This contribution/publication is the result of the project implementation: Centrum excelentnosti bezpečnostného výskumu kód ITMS: 26240120034 supported by the Research & Development Operational Programme funded by the ERDF.
3. References
1. Ellen, D. 2006. Scientifi c Examination of Documents. Methods and Techniques. 3rd ed. Boca Raton. Florida: CRC Press. ISBN 0-8493-3925-1.
Zbornik1_PA2014_10.indd 156Zbornik1_PA2014_10.indd 156 25. 2. 2014 12:11:3225. 2. 2014 12:11:32
Polygrafi a Academica 2014 157
Štúdium štruktúry a identifi kácia
materiálov plastových kariet pre potreby
kriminalisticko-technických analýz
Milena Reháková, Michal Čeppan,Michaela Belovičová, Pavol Gemeiner
Slovenská technická univerzita v Bratislave,Fakulta chemickej a potravinárskej technológie,
Ústav prírodných a syntetických materiálov,Oddelenie polygrafi e a aplikovanej fotochémie,
Radlinského 9, 812 37, Bratislava, [email protected]
Abstract: The required safety of the cards can be infl uenced by observance of technological processes and used of special materials. Despite the high prices of production, global mass expansion of cards using, that carrying confi dential personal data, directly related with their counterfeiting or abusing. Avoiding the consequences of misuse of cards leads to the using of safety features (magnetic stripe, chip, hologram…), that protect data and are unique for each of the card. Thought, this application not prevent before counterfeiting. All of plastic cards are manufactured according to international standards, which defi ne the individual characteristics of cards (size, temperature and humidity resistance…), describe methods for testing these properties and traditional techniques for recording information and location of various recording strips. This work deal with the study of material composition using a Fourier Transform Infrared Spectroscopy (FTIR) and examination of selected properties of plastic cards (analysis of thickness and structure of the cards in cross-section) using optical spectrophotometer FTS 3000 MX (Digilab) and infrared microscope Varian 610-IR.
Key words: plastic cards, FTIR, spectroscopic methods
1. Úvod
Doklady nazývané plastové karty sa vo svete i na Slovensku používajú na rôzne účely predovšetkým ako doklady s personifi kačnou hodnotou – občiansky a vodič-ský preukaz, preukazy poistenca, služobné preukazy, študentské preukazy, platob-né a kreditné karty, ďalej ako telefónne, zákaznícke a klubové karty.
Plastová karta obsahuje informácie viditeľné voľným okom (jednostranná, obojstranná, jednofarebná, viacfarebná tlač, personalizačné údaje...), ako aj in-formácie, ktoré sú čitateľné len pomocou špeciálneho zariadenia. Ako prídavné ochranné prvky na prednej strane karty (Obr. 1) môžu byť použité: (1) logo banky, (2) čip, (3) hologram, (4) číslo karty, (5) logo vydavateľa karty, (6) platnosť karty
Zbornik1_PA2014_10.indd 157Zbornik1_PA2014_10.indd 157 25. 2. 2014 12:11:3225. 2. 2014 12:11:32

158 Polygrafi a Academica 2014
a (7) meno držiteľa karty, na zadnej strane: (1) magnetický prúžok, (2) podpis dr-žiteľa a (3) CVC kód.
Výroba plastových kariet sa riadi podľa medzinárodných štandardov (tab. 2).Materiál z ktorého je karta vyrobená závisí hlavne od účelu, na ktorý bude
používaná, čo znamená, že napr. materiálové zloženie karty na jedno použitie môže byť odlišné od materiálového zloženia kreditnej karty. Medzi najčastejšie používané polyméry patria: polyvinylchlorid (PVC), akrylonitryl-butadién-styrén (ABS), polyetyléntereftalát (PET), polykarbonát (PC) alebo kombinácia PVC-PET. Tieto polyméry vykazujú vynikajúcu odolnosť voči chemickému a fyzikálnemu
Tab. 1: Rozdelenie plastových kariet podľa materiálu a účelu použitia.
Priehľadné alebo polopriehľadné plastové karty Laminované plastové karty (ISO 7810) Karty s magnetickým prúžkom (ISO 7811) Čipové karty (ISO 7816) RFID karty, bezkontaktné čipové karty (ISO 14443) Plastové karty šetrné k životnému prostrediu – 100 % rozložiteľné Karty netradičných tvarov a veľkostí, hracie karty
Obr. 1: Vybrané druhy ochranných prvkov na kartách.
Tab. 2: Čísla a stručný obsah noriem používaných pri výrobe plastových kariet.
ISO/IEC 7810
Norma popisuje charakteristiky identifi kačných kariet z fyzikálne-ho hľadiska (rozmery, odolnosť voči teplote, vlhkosti, chemikáliám, ohybu, ohňu a toxicite. Táto norma uvádza aj metódy na testovanie niektorých týchto charakteristík.
ISO/IEC 7811
Norma defi nuje tradičné techniky pre zaznamenávanie identifi kač-ných kariet, reliéfnu tlač a umiestnenie rôznych magnetických zázna-mových prúžkov.
ISO 7813 Norma defi nuje ďalšie vlastnosti plastových kariet, napríklad hrúbku 0,76 ± 0,08 mm a polomer kružnice v rohoch karty 3,18 mm.
ISO 7816 Norma vymedzuje identifi kačné karty s vloženým čipom (smartcard)
ISO 14443 Norma defi nuje karty s vloženým čipom, magnetickou slučkou, auten-tifi kačným protokolom pre uloženie biometrických prvkov (RFID...).
Zbornik1_PA2014_10.indd 158Zbornik1_PA2014_10.indd 158 25. 2. 2014 12:11:3325. 2. 2014 12:11:33

Polygrafi a Academica 2014 159
vplyvu (ABS), vysokú kvalitu potlače, strednú pružnosť, tepelnú odolnosť (PVC), vysokú odolnosť voči mechanickému poškodeniu a kvalitu povrchovej úpravy (PET) a vysokú životnosť (PC).
2. Experimentálna časť a výsledky
2.1 Prieskum štruktúry plastových kariet
Skúmané vzorky, ktoré boli podrobené analýze boli získané z Kriminalistického a expertízneho ústavu Policajného zboru SR a osobným zhromažďovaním ne-používaných/nepoužiteľných kariet. Skúmané karty (41 ks) sme rozdelili podľa vizuálneho sledovania prítomnosti a druhu ochrannej fólie, magnetického pá-sika, hologramu a čipu (Tab. 3). Stúpajúce číslo skupiny označuje vyšší počet prítomných vizuálne stanovených prvkov a zároveň vyšší stupeň ochrany kariet. Rozdiel medzi skupinou 1 a 2 je v tom, že v skupine 1 prvok „fólia“ bol aplikovaný dodatočne pri personalizácii (ako laminačná fólia na fotografi i a ostatných tlače-ných osobných údajoch) a v skupine 2 „fólia“ bola nanesená na hárok v procese výroby.
Tab. 3: Rozdelenie kariet do skupín podľa prítomných vybraných prvkov/znakov.
číslo
skupinypočet kariet
vizuálne prvky
fólia magnetický pásik hologram čip1 4 + – – –2 7 + – – –3 13 – + – –4 12 – – + +5 5 – + + +
Hrúbka kariet a ich jednotlivých vrstiev sa stanovovala z mikroskopických sní-mok pod polarizačným mikroskopom Varian 610-IR pomocou odmerania rozmeru na 3 rôznych miestach rezu. Z nameraných hodnôt sa vypočítal aritmetický prie-mer. Následne sa vykonalo grafi cké rozdelenie kariet do skupín podľa priemernej celkovej hrúbky (Obr. 2). Najväčší počet kariet sa nachádzal v intervale hrúbok 0,761 – 0,780 mm a 0,781 – 0,800 mm. Celkový priemer bol 0,777 ± 0,090 mm čo vo všetkých prípadoch, s výnimkou jedného, zodpovedá predpisu ISO 7813 (0,76 ± 0,08 mm). Tenké plátky vzoriek vhodné na mikroskopické skúmanie sme získali pomocou technického zariadenia Mikrotóm MS 2 – 89, ktoré umožňuje na-stavenie hrúbky rezaných vzoriek. Z hľadiska štruktúry jednotlivých vrstiev v reze bolo preukázané, že karty s nižším stupňom ochrany sa skladali z viacerých mikro-skopicky pozorovateľných vrstiev v porovnaní s kartami s vyšším počtom ochran-ných prvkov (Obr. 3a, 3b). Pri mnohých vzorkách bolo pozorované jadro karty, pod mikroskopom javiace sa ako jeden celok napriek tomu, že sa skladá z viacerých vrstiev rovnakého polyméru spojených v procese výroby pomocou vysokej teploty a tlaku (Obr. 3b).
Zbornik1_PA2014_10.indd 159Zbornik1_PA2014_10.indd 159 25. 2. 2014 12:11:3325. 2. 2014 12:11:33

160 Polygrafi a Academica 2014
Obr. 2: Rozdelenie kariet do skupín podľa priemernej celkovej hrúbky.
Obr. 3: Priečny rez vzorky 1 (3a), a vzorky 4 (3b), zväčšenie 50-násobné.
2.2 Štúdium materiálového zloženia metódou FTIR
Identifi kácia materiálov, ktoré sú hlavnými zložkami plastových kariet sa vyko-nala metódou infračervenej mikroskopie pomocou IČ mikroskopu Varian 610-IR a spektrofotometra Excalibur series, FTS 3000 MX (Digilab). Bola použitá metóda ATR-FTIR a mikro-ATR-FTIR s prítlakom diamantového kryštálu. Frekvencia prístroja bola nastavená na 5 kHz, citlivosť 4 – 8 a počet skenov bol 30. Vyhodnotenie spek-tier sa po matematických úpravách vykonalo buď porovnaním so spektrami data-bázy referenčných spektier alebo štúdiom a priradením prítomných absorpčných pásov príslušným vibráciám skupín atómov. Skúmalo sa zloženie materiálu na po-vrchu z dvoch strán – vrchnej a spodnej (lícnej a rubovej) a v strede (v jadre) karty. Dobrá zhoda spektier všetkých vzoriek fólií skupiny 1 so spektrom z databázy re-ferenčných vzoriek svedčí o prítomnosti polyetyléntereftalátu (Obr. 4a). U vzoriek ostatných skupín bola vrchná, resp. spodná ochranná fólia zatavená k materiálu jadra pevným spojom a jej delaminácia bola možná len u niektorých vzoriek. U vzo-riek s vyšším stupňom ochrany (občiansky preukaz) sa dokázala prítomnosť poly-méru PC ktorý sa používa kvôli svojej vysokej životnosti (Obr. 4b). V prípade, že de-laminácia nebola možná, meral sa priamo líc a rub karty a zistilo sa, že materiálom u väčšiny kariet bol kopolymér polyvinylacetátu a polyvinylchloridu označovaný
Zbornik1_PA2014_10.indd 160Zbornik1_PA2014_10.indd 160 25. 2. 2014 12:11:3325. 2. 2014 12:11:33

Polygrafi a Academica 2014 161
ako PVCA (Obr. 5) a to z dôvodu jeho vysokej hustoty a vynikajúcej vodeodolnosti a v prípade použitia plastifi kátorov nadobúda ďalšiu vhodnú mechanickú vlast-nosť – elasticitu.
Obr. 4: FTIR spektrá laminačných fólií vzoriek skupiny 1 v porovnaní s PET (4a, vľavo), FTIR spektrum občianskeho preukazu v porovnaní s PC (4b, vpravo).
Obr. 5: FTIR spektrum ochrannej povrchovej vrstvy (vľavo)a FTIR spektrum jadra karty (vpravo).
3. Záver
Na začiatku výskumnej práce bola vykonaná rozsiahla literárna rešerš, týkajúca sa vývoja plastových kariet, materiálového zloženia, štruktúry a technológie výroby plastových kariet. Informácie z tejto oblasti sú predmetom obchodného tajomstva, preto nebolo jednoduché získať ich. Na základe stanovenia priemernej celkovej hrúbky sa dali skúmané karty rozdeliť do 9 skupín. Zistilo sa, že karty s najnižším stupňom ochrany sú zložené z vrstiev viacerých rôznych polymérov v porovnaní s kartami s vysokým stupňom ochrany. Stanovenie materiálového zloženia vykona-né pomocou FTIR metódy na povrchu z oboch strán a v reze karty ukázalo, že táto metóda je vhodná na identifi káciu prítomných polymérov. Pomocou nej sa okrem iného dokázala prítomnosť kopolyméru polyvinylacetátu a polyvinylchloridu, kto-rý v literatúre nie je popísaný ako najbežnejšie používaný. Napriek tomu sme ho stanovili vo väčšine skúmaných vzoriek.
Zbornik1_PA2014_10.indd 161Zbornik1_PA2014_10.indd 161 25. 2. 2014 12:11:3325. 2. 2014 12:11:33

162 Polygrafi a Academica 2014
Poďakovanie
Táto štúdia vznikla vďaka fi nančnej podpore agentúry APVV, číslo projektu 0324-10 a vďaka podpore v rámci operačného programu Výskum a vývoj pre pro-jekt Centrum excelentnosti bezpečnostného výskumu, kód ITMS 26240120034. Ďakujeme Kriminalistickému a expertíznemu ústavu PZ SR za poskytnuté vzorky.
4. Literatúra
1. Historie platebních karet [online], dostupné na internete: http://cs.wikipedia.org/wiki/Historie_platebn%C3%ADch_karet
2. Rozdelenie plastových kariet, [online], dostupné na internete: www.cardsystems.sk/produkty/riesenia/o/urove/nizsie/plastove/karty/podrobnejsie/
3. Counterfeit credit/debit card fraud: Let‘s stop it now [online], dostupné na internete: http://www.techrepublic.com/blog/security/counterfeit-creditdebit-card-fraud-lets-stop-it-now/2825
4. Milata V., Segľa P., Brezová V., Gatial A., Kováčik V., Miglierini M., Stankovský Š., Šíma J.: Aplikovaná molekulová spektroskopia, STU Bratislava, 2008.
5. Polymers and materials application [online], dostupné na internete: http://www.varianftir.com/products.php
6. The Chemistry of Credit Cards [online], dostupné na internete: http://www.elementsdatabase.com/the_chemistry_of_credit_cards.php
Zbornik1_PA2014_10.indd 162Zbornik1_PA2014_10.indd 162 25. 2. 2014 12:11:3325. 2. 2014 12:11:33
Polygrafi a Academica 2014 163
Metódy skúmania moderných písacích prostriedkov
vo forenznej vede
Eva Belányiová1, Milena Reháková1, Michal Čeppan1,Magdaléna Kadlečíková2, Ľubomír Vančo2
1Slovenská technická univerzita v Bratislave,Fakulta chemickej a potravinárskej technológie,
Ústav prírodných a syntetických polymérov,Radlinského 9, 812 37Bratislava, [email protected]
2Slovenská technická univerzita v Bratislave, Fakulta elektrotechniky a informatiky,Ústav elektroniky a fotoniky, Ilkovičova 3, Bratislava
Abstract: The aim of our study was to utilize a combination of suitable methods for forensic investigation of modern writing means. For this purpose, 19 model samples of diff erent kinds blue pens available on the Slovak market, were analyse by preliminary and instrumental analysis of inks. As preliminary analysis technique we used microscopical investigation and investigation under infrared illumination. The used spectroscopic techniques were: Fourier Transform Infrared Spectroscopy, Raman spectroscopy and Surface Enhanced Raman Spectroscopy, which helps to avoid fl uorescence and enhance certain Raman signals. It was found that combination of these analytical techniques shows great potential for distiquishing between three type of modern writing means and in obtaining important information about the quality of writing resources.
Key words: writing means, forensic analysis, FTIR, SERS
1. Úvod
Analýza písacích prostriedkov je veľmi dôležitou časťou forenzného skúmania do-kumentov. Väčšinou ide o potvrdenie/vyvrátenie zhody záznamových prostriedkov, alebo zisťovania veku či obdobia vzniku dokumentov. V súčasnosti najviac používané písacie prostriedky môžme rozdeliť podľa zloženia ich náplne na guľôčkové (B), atra-mentové (R) a gélové perá. Tieto skupiny písacích prostriedkov vykazujú navzájom od-líšiteľné vlastnosti i keď voľným okom javia totožnú farebnosť. Pri forenznej analýze záznamu sa zvyčajne najskôr aplikujú rutinné predbežné analýzy, napr. optickými – mikroskopickými metódami, ktoré môžu uľahčiť voľbu ďalšieho spôsobu skúmania dokumentu. Keďže mnohé písacie látky spĺňajú podmienky vzniku fotoluminiscencie, ďalšou v praxi veľmi využívanou metódou je skúmanie v IČ svetle. Spektroskopické metódy skúmania patria medzi tie náročnejšie, z dôvodu ich prístrojového a softvé-rového vybavenia. Zámerom našej práce bolo využitie kombinácie metód druholíni-ového (optická mikroskopia) a treťolíniového skúmania (FTIR, Ramanova spektrosko-pia, SERS) za účelom návrhu novej metodiky spracovania získaných informácií.
Zbornik1_PA2014_10.indd 163Zbornik1_PA2014_10.indd 163 25. 2. 2014 12:11:3325. 2. 2014 12:11:33

164 Polygrafi a Academica 2014
2. Experimentálna časť
2.1 Príprava vzoriek
Skúmaných bolo 19 vzoriek náplní rôznych druhov pier zo skupiny guľôčkových (B), atramentových (R) a gélových (G), ktoré boli vybraté na základe prieskumu trhu v SR. Vzorky pre skúmanie boli pripravené nanesením písacích látok na substráty, ktorým boli: papier Whatman (model čistej celulózy), bežný kancelársky papier, hli-níková doštička a sklenená podložka. Na papierových substrátoch boli vytvorené jednak plné plochy o rozmere cca (1 × 1) cm2 a tiež linky o hrúbke priemeru hrotu náplne. Údaje o skúmaných záznamových prostriedkoch sú v tab. 1. Chemické zlo-ženie náplní nebolo známe.
Tab. 1: Popis skúmaných náplní pier (guľôčkové, gélové a atramentové).
VzorkaDruh
náplne
Priemer hrotu
[mm]Výrobca
Iná špecifi kácia
výr. číslo distribútor dovozcaB1 pasta ? Slovensko 4411 Jumbo ŠEVT, a. s.B2 pasta ? 4444 ŠEVT, a. s. KOH-I-NOORB3 pasta ? 4443 ŠEVT, a. s. KOH-I-NOORB4 pasta ? PLUS ŽeliezovceB5 pasta 0,8 Pentel (France) BKL78 ŠEVT, a. s.B6 pasta ? Pentel (Taiwan) KFLT8 ŠEVT, a. s.B7 pasta 0,7 Pentel (Japan) BKS7H (INTERPOL) ŠEVT, a. s.B8 pasta 1 Pentel (Japan) BKL10 ŠEVT, a. s.B9 pasta ? PILOT (Japan) BLS-G2-5
B10 pasta 1 Parker (France) ISO 12757-2 Activa, s. r. o., SRG1 gél 1,6 Pentel (Japan) K186G2 gél 0,7 Pentel (Japan) LR7 ŠEVT, a. s.G3 gél 0,4 Pentel (Japan) KFGN4 ŠEVT, a. s.G4 gél 0,7 Pentel (Japan) BGR7 ŠEVT, a. s.G5 gél 0,7 Parker (France) Activa, s. r. o., SRR1 atrament 0,7 Germany ISO 14145-2R2 atrament 0,3 Stabilo (Germany)R3 atrament 0,5 SaKOTA (China) ADH 0488 SaKOTA, s. r. oR4 atrament 0,7 Parker (France) Activa, s. r. o., SR
2.2 Použité metódy
2.2.1 Optická mikroskopiaSkúmanie vzoriek optickou mikroskopiou bolo vykonané zosnímaním písacích
látok vo forme liniek nanesených na papieri za pomoci μFTIR mikroskopu, Varian 610-3R Series (Digilab, USA). Linky boli zosnímané integrovaným CCD snímačom a uložené vo formáte JPEG po 50- a 250-násobnom zväčšení. Vhodné svetelné pod-mienky boli zabezpečené konštantným osvetlením vzoriek.
2.2.2 Skúmanie vzoriek v IČ svetlePre experiment sme využili optické zariadenie VSC 5000 Kriminalistického a ex-
pertízneho ústavu Policajného zboru SR v Bratislave (KEÚ PZ). Pozorovania sa vyko-návali za použitia rôznych fi ltrov v rozsahu 530 – 1000 nm.
Zbornik1_PA2014_10.indd 164Zbornik1_PA2014_10.indd 164 25. 2. 2014 12:11:3325. 2. 2014 12:11:33

Polygrafi a Academica 2014 165
2.2.3 FTIR spektroskopiaVzorky boli merané na prístroji EXCALIBUR series, FTS 3000 MX (Digilab, USA) zo
strany nánosu písacích látok metódou ATR-FTIR s použitím prítlaku diamantového hrotu v rozsahu vlnočtov od 4000 – 600 cm–1. Diamantový kryštál bol v priamom kontakte so vzorkou písacej látky. Počet skenov bol nastavený na 30, rozlíšenie 4 cm–1, fi lter 1.2 a frekvencia 5 kHz. Pri meraní μFTIR technikou bolo nastavenie na nasledujúce hodnoty: frekvencia 20 kHz, fi lter 5, rozlíšenie 4 cm–1 a počet skenov na 100. Správnosť umiestnenia kryštálu pred jeho pritlačením na vzorku sa sledo-vala pomocou programu Sample Capture Application. Spektrá sa merali pomocou programu Varian Resolution Pro, kde sa následne i zobrazovali a ukladali.
2.2.4 Ramanova spektroskopia a SERSMeranie a vyhodnotenie meraní Ramanovou spektroskopiou sa uskutočnilo na
FEI STU v Bratislave, Ústav elektroniky a fotoniky, na špecializovanom pracovisku zaoberajúcom sa najmä využitím metódy SERS.
Ramanov spektrometer JobinYvon Labram 300 disponuje He-Ne laserom (633 nm). Disperzia svetla bola zabezpečená mriežkovým monochromátorom s 1800 ry-hami/mm a jeho detekcia pomocou CCD multikanálového a vzduchom chladené-ho detektora. Prístrojom je možné merať v rozsahu od 100 – 4000 cm–1. Pri meraní bol použitý výkon laserového lúča 4.25 mW a objektív 100-násobného zväčšenia.
3. Výsledky a diskusia
3.1 Optická mikroskopia
Na základe rozdielnej hrúbky liniek je možne skúmaný súbor vzoriek rozdeliť do siedmich skupín (tab. 2): od vzoriek tvoriacich najtenšiu linku (skupina 1) až po vzorky tvoriacu najhrubšiu linku (skupina 7). Porovnávajúc zistené skutočnosti s údajmi výrobcov (ak sú nimi uvedené), písacie prostriedky skupiny G a najmä R v porovnaní so skupinou B (s rovnakým priemerom hrotu) vytvárajú hrubšie linky z dôvodu zapíjania sa písacej látky do papiera. Preto hrúbka čiary nie vždy koreš-ponduje s predpokladanou hodnotou.
Tab. 2: Rozdelenie písacích látok do skupín na základe hrúbky vytvorenej čiary.
skupina 1 2 3 4 5 6 7vzorky B9 B4 B1 B5 B10 G5 G1
G3 B2 B6 G2 R1B3 B8 G4 R4B7 R3 R2
3.2 Skúmanie vzoriek v IČ svetle
Na obr. 1 možno pozorovať fl uorescenciu atramentov skupiny G a R pri rôz-nych vlnových dĺžkach. Pozorovanie sa uskutočnilo pri 668, 714, 725, 778, 823 nm.
Zbornik1_PA2014_10.indd 165Zbornik1_PA2014_10.indd 165 25. 2. 2014 12:11:3325. 2. 2014 12:11:33

166 Polygrafi a Academica 2014
Z obrázkov je zrejmé, že jednotlivé písacie látky majú rôzne chemické zloženie. Najpodobnejšie sú atramenty G2, R1 a R2, ale aj tie možno súhrnným vyhodnote-ním pri všetkých vlnových dĺžkach špecifi kovať.
Sledovaním absorpcie svetla (bodového) atramentmi (pri 530, 550, 570, 609, 648, 690, 714, 725, 778 nm) nebola zistená taká dobrá rozlíšiteľnosť písacích látok, ako predchádzajúcou technikou, ale bola tiež možná. Podobné to bolo aj pri vzor-kách guľôčkových pier.
Obr. 1: Luminiscencia vzoriek G a R pri 668 nm (vľavo), 778 nm (stred), 823 nm (vpravo).
3.3 FTIR spektroskopia
Analýza FTIR spektier bola vykonaná nájdením charakteristických absorpčných pásov písacích látok na hliníkovom substráte (označené vertikálnymi čiarami na obr. 2) a následnom skúmaní prítomnosti týchto pásov v spektrách písacích látkoch nanesených na papierovom nosiči.
Obr. 2: FTIR spektrum písacej látky B7 na hliníkovej podložke.
Vzorky všetkých skupín obsahovali výrazné charakteristické absorpčné pásy, ktoré môžu prislúchať vibráciám rôznych skupín atómov. Príkladom je prítomnosť pásu pri 1360 cm–1, ktorý sa vyskytuje len pri písacích látkach guľôčkových pier (B). Vibrácie pri tomto vlnočte vykazujú zlúčeniny obsahujúce —SO2—OX skupiny, pri-čom X je alkalický prvok. Túto skupinu obsahuje modré farbivo Acid blue 11. Je teda možné s vysloviť hypotézu, že písacie látky guľôčkových pier obsahujú toto farbivo s vyššou pravdepodobnosťou ako vzorky pier gélových a atramentových. Výrazný
Zbornik1_PA2014_10.indd 166Zbornik1_PA2014_10.indd 166 25. 2. 2014 12:11:3325. 2. 2014 12:11:33

Polygrafi a Academica 2014 167
absorpčný pás pri 1585 cm–1, nachádzajúci sa vo väčšine vzoriek, môže prislúchať vibráciám skupiny —COO–, ktorú obsahuje kyselina olejová. Tá je častou súčasťou pier obsahujúcich guľôčku, pričom plní funkciu lubrikantu, sušidla a upravuje vis-kozitu písacej látky1.
Vo všeobecnosti je možné rozdeliť FTIR spektrá vzoriek do troch skupín. Spektrá vzoriek B na rozdiel od G a R obsahujú absorpčné pásy pri 1492, 1360, 943 a 701 cm–1. Spektrá vzoriek G a R sú od seba odlíšiteľné ťažšie. Aj tie je však možné rozlíšiť prí-tomnosťou absorpčného pásu pri 1223 cm–1, ktorý sa nachádza len v spektrách vzoriek G. Podrobnou analýzou FTIR spektier písacích látok na hliníkovej podložke je možné rozdeliť súbor 19 skúmaných pier do 13 navzájom od seba odlíšiteľných skupín, ktoré sú uvedené v tabuľke 3.
Tab. 3: Rozdelenie písacích látok do skupín na základe FTIR analýzy.
skupina 1 2 3 4 5 6 7 8 9 10 11 12 13
vzorky G1 G3 G5 G2 R1 R2 R3 B1 B3 B6 B9 B10 B7G4 R4 B2 B4 B8
B5
3.4 Ramanova spektroskopia
Analýze RS bolo podrobených 17 náplní pier zo skupín B, G a R. Vzorky G5, R3, B6 a B9 boli z experimentu vylúčené, pretože neboli analyzovateľné Ramanovou spektroskopiou ani metódou SERS na pripravených substrátoch. Atrament G1 ako jediný zo sledovaných atramentov bol analyzovateľný RS v klasickom usporiadaní. Namerané Ramanove spektrum je v zhode s referenčným spektrom syntetického organického pigmentu ftalocyanínovej modrej. Podľa pásiem, ktoré sú mimo refe-renčného spektra možno usúdiť, že materiál je zmesou viacerých pigmentov fta-locyanínového radu. Vzorka vykazovala výrazné fotoluminiscenčné maximum pri vlnovej dĺžke ≈ 750 nm (obr. 7). SERS spektrum sa zhodovalo s Ramanovým spek-trom, ale bola potlačená fotoluminiscencia.
Na získanie spektier ostatných atramentov sme museli aplikovať zosilnenú Ramanovu spektroskopiu (SERS). Rozdiely v spektrách v rozsahu 620 – 1580 cm–1 umožnili identifi káciu atramentu B10 a zaradenie ostatných atramentov skupiny B do dvoch podskupín: (a) podskupina s atramentmi B1, B2, B5 a (b) podskupina s atramentmi B3, B4, B7, B8 (tab.4). Skupina (b) je charakteristická prítomnosťou maxima pri ≈ 1264 cm–1, ktorá v skupine (a) chýba. Skupina (c) (G2, G4, R1, R2, R3, R4) sa odlišuje od ostatných atramentov prítomnosťou pásma so stredom pri ≈ 1648 cm–1, ale v rámci tejto skupiny neexistuje žiadny diferenciačný znak (obr. 3).
Na základe pozorovaní a výsledkov získaných z Ramanovej spektroskopie a po-vrchovo zosilnenej Ramanovej spektroskopie je možné skúmanú množinu atra-mentov na základe prítomnosti spoločných absorpčných pásov rozdeliť do skupín uvedených v tab. 4.
Zbornik1_PA2014_10.indd 167Zbornik1_PA2014_10.indd 167 25. 2. 2014 12:11:3325. 2. 2014 12:11:33
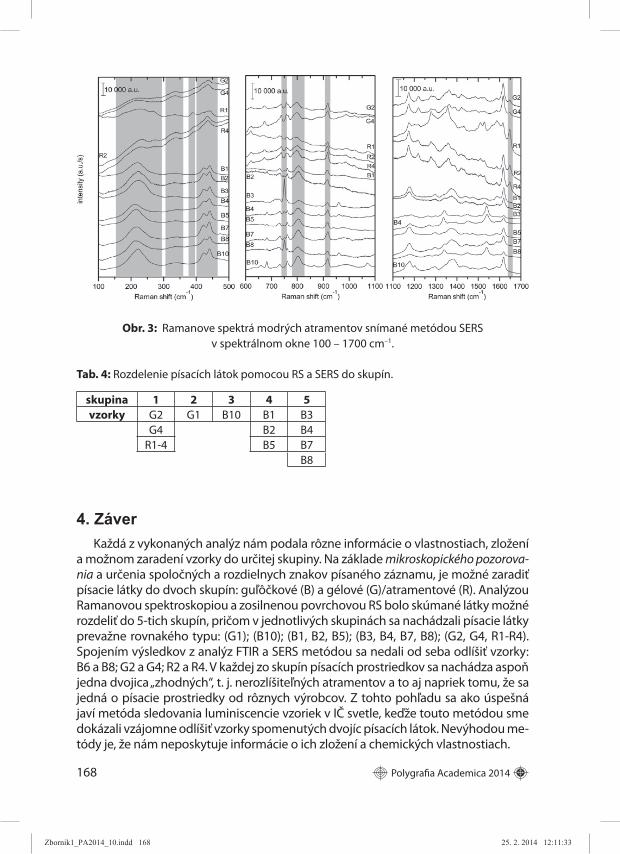
168 Polygrafi a Academica 2014
4. ZáverKaždá z vykonaných analýz nám podala rôzne informácie o vlastnostiach, zložení
a možnom zaradení vzorky do určitej skupiny. Na základe mikroskopického pozorova-nia a určenia spoločných a rozdielnych znakov písaného záznamu, je možné zaradiť písacie látky do dvoch skupín: guľôčkové (B) a gélové (G)/atramentové (R). Analýzou Ramanovou spektroskopiou a zosilnenou povrchovou RS bolo skúmané látky možné rozdeliť do 5-tich skupín, pričom v jednotlivých skupinách sa nachádzali písacie látky prevažne rovnakého typu: (G1); (B10); (B1, B2, B5); (B3, B4, B7, B8); (G2, G4, R1-R4). Spojením výsledkov z analýz FTIR a SERS metódou sa nedali od seba odlíšiť vzorky: B6 a B8; G2 a G4; R2 a R4. V každej zo skupín písacích prostriedkov sa nachádza aspoň jedna dvojica „zhodných“, t. j. nerozlíšiteľných atramentov a to aj napriek tomu, že sa jedná o písacie prostriedky od rôznych výrobcov. Z tohto pohľadu sa ako úspešná javí metóda sledovania luminiscencie vzoriek v IČ svetle, keďže touto metódou sme dokázali vzájomne odlíšiť vzorky spomenutých dvojíc písacích látok. Nevýhodou me-tódy je, že nám neposkytuje informácie o ich zložení a chemických vlastnostiach.
Obr. 3: Ramanove spektrá modrých atramentov snímané metódou SERSv spektrálnom okne 100 – 1700 cm–1.
Tab. 4: Rozdelenie písacích látok pomocou RS a SERS do skupín.
skupina 1 2 3 4 5
vzorky G2 G1 B10 B1 B3G4 B2 B4
R1-4 B5 B7B8
Zbornik1_PA2014_10.indd 168Zbornik1_PA2014_10.indd 168 25. 2. 2014 12:11:3325. 2. 2014 12:11:33

Polygrafi a Academica 2014 169
Poďakovanie
Táto práca bola podporená Agentúrou na podporu výskumu a vývoja na základe zmluvy č. APVV-0324-10. Táto štúdia vznikla aj vďaka podpore v rámci operačné-ho programu Výskum a vývoj pre projekt Centrum excelentnosti bezpečnostného výskumu, kód ITMS 26240120034, spolufi nancovaný zo zdrojov Európskeho fondu regionálneho rozvoja. Metóda SERS bola realizovaná s podporou projektu VEGA 1/0601/13. Ďakujeme zamestnancom Kriminalistického a expertízneho ústavu PZ SR, Oddelenia skúmania dokumentov za poskytnutie prístrojového vybavenia a odborné konzultácie.
5. Literatúra
1. Brunelle R. L., Crawford K. R.; Advances in the forensic analysis and dating of writing ink, Charles C. Thomas Publisher, LTD, Spriengfi eld, Illinois, USA, 2003, 213 p.
2. Zieba-Palus J., Kunicki M.; Application of the micro-FTIR spectroscopy, Raman spectros-copy and XRF method examination of inks, Journal of Forensic Research, 158 (2-3) (2006) 164 – 172.
3. Szafarska M., Wozniakiewicz, M., Pilch, M., Zieba-Palus, J., Koscelniak P., Computer analysis of ATR-FTIR spectra of paint samples for forensic purposes, Journal of Molecular Structure 924 – 926 (2009) 504 – 513.
4. Trzcińska, B. M., Writing Materials Examination in Criminalistic Research by FTIR spectros-copy, Journal of Molecular Structure, 294 (1993) 259 – 262.
Zbornik1_PA2014_10.indd 169Zbornik1_PA2014_10.indd 169 25. 2. 2014 12:11:3325. 2. 2014 12:11:33
170 Polygrafi a Academica 2014
Information design for the graphic engineering
e-learning application
Ivan Pinćjer, Dragoljub Novaković, Uroš Nedeljković, Irma Puškarević
University of Novi Sad, Faculty of technical sciences,Department of graphic engineering and design,
Trg Dositeja Obradovića 6, 21000 Novi Sad, [email protected]
Abstract: This paper presents research material focused on developing of the knowledge base applications for distance learning in the fi eld of graphic engineering and design. The knowledge base includes a complex area of theoretical knowledge as well as the visualization of graphics systems. The main objective within the knowledge base set in its area for development of information design is to develop a spatial visualization solutions of graphic systems and technologies. These solutions are implemented and designed applying 2D and 3D visualization in a way to represent operations credibly of the real graphic systems, with the ability to interact with this 3D space. Thus designed 3D environment creates a sense of belonging and immersion into the learning application. Immerison positively encourages the participants to stay active in the e-learning program. Virtual 3D space allows complex examination of all system elements with the possibility of dismantling the components, commissioning and insight into the knowledge base containing information about theoretical and practical functioning of each element. This paper demonstrates the necessity of design in 2D and 3D software applications and the creation of a virtual space that enables signifi cant improvement of e-learning using new technologies.
Keywords: information design, e-learning, virtual space, contemporary graphics systems
1. Introduction
The development of information technology has enabled the creation of content that will, beside accessibility of information, enable the integration of various viewing methods, content manipulation and interactivity. The introduction of self-assessment is an important element in enhancing and monitoring eff ectiveness of learning processes i.e. achieved level of knowledge, which is the key of increasing the learning effi ciency.
The interactive application is created in order to improve the acquisition of knowledge. This application includes various visualization methods, 3D design through presentation of internal and external parts of observed devices, as well as applied theory and theoretical knowledge about particularly observed element
Zbornik1_PA2014_10.indd 170Zbornik1_PA2014_10.indd 170 25. 2. 2014 12:11:3425. 2. 2014 12:11:34

Polygrafi a Academica 2014 171
of the system. During the research, the problem of a large percentage of drop-out rates was detected. In order to reduce the drop-out rate app provides the user with possibility to, at any moment, address exactly the focus of his interest through theoretical and the practical knowledge with the pace that suits the user.
The defi nition of e-learning by Perraton’s explains the essence of e-learning, which is defi ned as an open learning in virtual classrooms, using the computer to connect teachers and learners in the space (or) time (Perraton, H. 1988.).
2. E-learning
Modern technology allows students to control digital content, retrieve information and solve problems. To avoid the technological barriers that can occur with people who are not in daily contact with computer technology, the actions that are performed in the application are logic, and inherent, for example, if some want to inspect a specifi c part of a machine or device, logical action would be to touch that part, as it would be in the real world. This contributes active learning on which an entire application is based on, in combination with the instructions of trainers. [4]
The application that is the subject of this paper allows the user to upload it to his personal computer and use without the need of Internet access, which is additional way to make this application more available to the end users. This increases the accessibility of application for those who, for some reason, cannot access the internet.
3. Exploring the eff ectiveness of distance learning
Previous research has shown that creating online courses require more time and labor than conventional lectures [13]. Thus it is necessary to justify the eff orts for creating such applications.
It is necessary that students have a certain degree of discipline in meeting their obligations, to utilize the benefi ts of active learning.
Creation of environment which allows users of online course to immerse in computer generated reality is enabled through use of new technologies, interactive tools, and virtual space. [11] The virtual space has the ability to simply isolate students from external infl uences and thus achieves the maximum focus on subject of learning. In order to maintain the focus of student at a preferred level, as not to be aff ected by outside infl uences, the student should be given the greatest possible freedom for independent exploring in 3D space. Special attention must be directed to the level of information complexity. If it is found to be too complex there is a possibility for student to refuses participation in course or complexity can reduce the immersion of student in virtual space, which may result in drop-out.
The learning experience will be much better, work more interesting if user can achieve greater degree of freedom than in the real world (superpower eff ect). Ability to decompose research subject (in this case the graphics system) into its
Zbornik1_PA2014_10.indd 171Zbornik1_PA2014_10.indd 171 25. 2. 2014 12:11:3425. 2. 2014 12:11:34

172 Polygrafi a Academica 2014
component parts, observe it in working conditions without the “shell” of devices that block the view of the real world is one of the advantages that will defi nitely surpass the presentation face to face, which is designed so that the observer is at a safe distance from the system and can only partially perceive what is happening around not inside system (usually the input materials and output).
4. Visualization of the virtual environment as a method of learning
Research discussed methods of visualization and comparisons of the visualization approach of animated and illustrated [12].
A very important aspect of visualization is that it takes place in real time. This means that it does not build a video sequence, where the observer is forced to follow a linear action, but in a real-time, interactive, observer may aff ect the object of the visualization, manipulate its content, explore and improve knowledge about subject of interest.
Possibility to take a virtual tour through laboratory equipped with various graphics system, allowing viewer to guide himself according to his own interest, decompose system into segments, putting the devices to work and read the theory which enables operation of the system, creating an augmented reality and broadens knowledge that is not denied by any criteria. Such knowledge without any unknown factors, creates more effi cient memory because it creates a single logical unit, completes the whole process of learning in a way that theoretical parts are explained with visually-active representation, while on the other hand the visual images are precisely defi ned by theoretical text. Knowledge mastered completely is permanently retained and harder to forget. This helps to ensure quick feedback that is crucial for the effi ciency of learning [3].
Fig. 1: Developed spatial solution, shown in 2D space.
Because learning depends on the number of repetitions and the distribution of repetition, special attention was paid to the intensity of learning. Using e-learning, students can settle the intensity of the learning at their own pace and they can repeatedly go back to the learning materials for days, months or even years, opposed to conventional learning processes where students are exposed to material for a short period of time, with high intensity. Short-term learning with high intensity is suitable for simple skills while learning in short intervals, with the possibility of increasing the number of repetitions is suitable for more complex skills and knowledge acquisition.
Zbornik1_PA2014_10.indd 172Zbornik1_PA2014_10.indd 172 25. 2. 2014 12:11:3425. 2. 2014 12:11:34
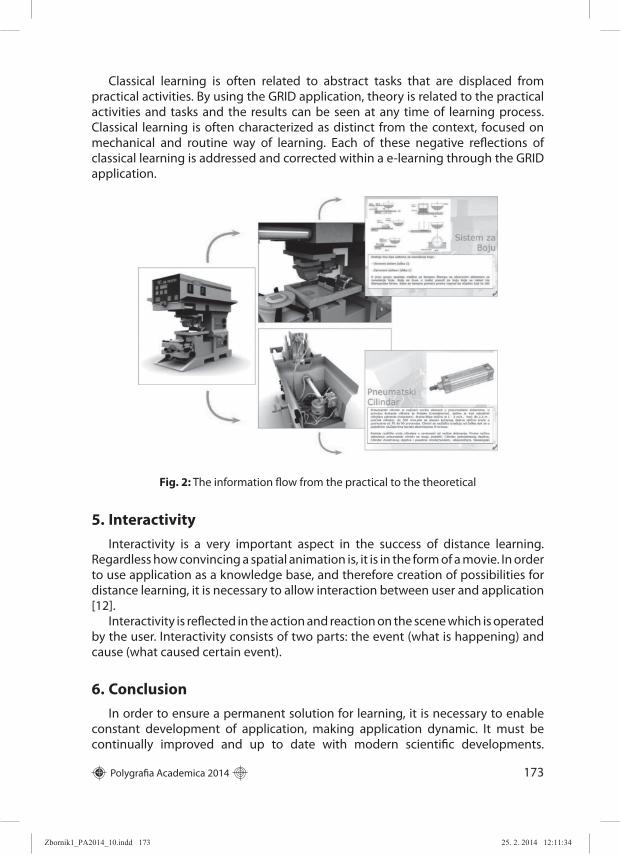
Polygrafi a Academica 2014 173
Classical learning is often related to abstract tasks that are displaced from practical activities. By using the GRID application, theory is related to the practical activities and tasks and the results can be seen at any time of learning process. Classical learning is often characterized as distinct from the context, focused on mechanical and routine way of learning. Each of these negative refl ections of classical learning is addressed and corrected within a e-learning through the GRID application.
Fig. 2: The information fl ow from the practical to the theoretical
5. Interactivity
Interactivity is a very important aspect in the success of distance learning. Regardless how convincing a spatial animation is, it is in the form of a movie. In order to use application as a knowledge base, and therefore creation of possibilities for distance learning, it is necessary to allow interaction between user and application [12].
Interactivity is refl ected in the action and reaction on the scene which is operated by the user. Interactivity consists of two parts: the event (what is happening) and cause (what caused certain event).
6. Conclusion
In order to ensure a permanent solution for learning, it is necessary to enable constant development of application, making application dynamic. It must be continually improved and up to date with modern scientifi c developments.
Zbornik1_PA2014_10.indd 173Zbornik1_PA2014_10.indd 173 25. 2. 2014 12:11:3425. 2. 2014 12:11:34

174 Polygrafi a Academica 2014
That way, software solution will not become outdated, but it must be taken into consideration from the start of software creation. Also, collecting feedback from the users is very important segment of application development.
Furthermore, feedback, in addition to functionality, will allow additional data about student interest to the learning materials, as well as which new learning materials could be incorporated into a software solution.
Courses of further development of the application can be found in the development of 3D environment, improvement of the interactivity and introduction of stereoscopic principles, in order to deepen the sense of spatial.
However, technology should not be used because of the technology, the use of technology in e-learning and learning in general must fi t the objective of learning and add new values to the process of mastering the lessons, motivation and engagement of students.
It is further necessary to conduct research on the eff ectiveness of learning compared to traditional learning, where a group of students would be tested after learning both in classical and electronic ways. The results of their tests, immediately after reviewing lessons, and after a certain period of time, would give a more realistic insight into the quality and advantages of this new type of learning.
Acknowledgements
This work was supported by the Serbian Ministry of Science and Technological Development, Grant No.: 35027 “The development of software model for improvement of knowledge and production in graphic arts industry”.
7. References
1. Allen, I., & Seaman, J. (2013). Changing Course: Ten Years of Tracking Online Education in the United States. Babson Survey Research Group. Retrieved from http://www.eric.ed.gov/ERICWebPortal/recordDetail?accno=ED541571.
2. Bonsiepe, G. (2000). Design as a tool for cognitive metabolism. … of industrial design research Ricerca+ Design, …, 1–14.
3. Byrne, C. (1996). Water on Tap The Use of Virtual Reality as an Educational Tool. Cambridge University Press, Cambridge. Retrieved from http://ebooks.cambridge.org/ref/id/CBO9780511974823.
4. Chapman, P., Selvarajh, S., & Webster, J. (1999). Engagement in Multimedia Training Systems. 32 nd Hawaii International Conference on System Sciences (Vol. 00, pp. 1–9). doi: 10.1109/HICSS.1999.772808.
5. Crilly, N., Moultrie, J., & Clarkson, P. J. (2004). Seeing things: consumer response to the visual domain in product design. Design Studies, 25(6), 547–577. doi: 10.1016/j.destud.2004.03.001.
6. Dorst, K., & Cross, N. (2001). Creativity in the design process: co-evolution of problem–solution. Design Studies, 22(5), 425–437. doi: 10.1016/S0142-694X(01)00009-6.
7. Frankel, L., & Racine, M. (2010). The Complex Field of Research: for Design, through Design, and about Design. The proceedings of the 2010 DRS Montreal Conference (p. 43).
Zbornik1_PA2014_10.indd 174Zbornik1_PA2014_10.indd 174 25. 2. 2014 12:11:3425. 2. 2014 12:11:34

Polygrafi a Academica 2014 175
8. Luck, R. (2012). “Doing designing”: On the practical analysis of design in practice. Design Studies, 33(6), 521–529. doi: 10.1016/j.destud.2012.11.002.
9. Matthews, B., & Heinemann, T. (2012). Analysing conversation: Studying design as social action. Design Studies, 33(6), 649–672. doi: 10.1016/j.destud.2012.06.008.
10. Noble, C. H., & Kumar, M. (2008). Using product design strategically to create deeper consumer connections. Business Horizons, 51(5), 441–450. doi: 10.1016/j.bushor.2008.03.006.
11. Nonis, D. (2005). Virtual Environments (3D VLE). IT Leterature Review, Educational Technology Divison, Ministry of Education, Singapore, 1–6.
12. Novaković, D., Milić, N., & Milosavljević, B. (2013). Animated vs. Illustrated Software Tutorials. The International Journal of Engineering Education2, 29(4), 0949-149X.
13. Zhang, D. (2005). Interactive Multimedia-Based E-Learning: A Study of Eff ectivness. THE AMERICAN JOURNAL OF DISTANCE EDUCATION, 19(3), 149–162.
Zbornik1_PA2014_10.indd 175Zbornik1_PA2014_10.indd 175 25. 2. 2014 12:11:3425. 2. 2014 12:11:34

176 Polygrafi a Academica 2014
Principal Component Analysis
of Vis-NIR Refl ectance Spectra
of Inkjet Inks for Forensic Analysis
Lukáš Gál, Michal Oravec,Pavol Gemeiner, Michal Čeppan
Department of Graphic Arts Technology and Applied Photochemistry,Faculty of Chemical and Food Technology,
Slovak University of Technology in Bratislava, Radlinského 9, 812 37 [email protected]
Abstract: The basic procedure of examination of the properties of graphic documents includes material analysis of documents. Currently used analytical techniques as TLC, HPTLC, GC-MS, and HPLC [1–3] require pre-treatment of a sample before analysis. This approach brings several drawbacks, which fi nally leads to the destruction of evidence. This paper is focused on the combination of fi bre optic refl ection spectroscopy in the Vis-NIR spectral regions and multivariate statistical analysis Principal Component Analysis (PCA). Combination of these methods appears to be a suitable tool for the study of properties and identifi cation of inks on documents for forensic and technical analysis. This article aims to demonstrate the potential of the fi bre optic refl ection spectroscopy in Vis-NIR spectral region with the use of PCA to forensic examination of inks from ink-jet printers. The suitability of the Principal Component Analysis as the tool for identifi cation of Vis-NIR spectra of inkjet prints was studied. The functionality of the designed PCA model was tested with test spectrum of inkjet print.
Keywords: Fibre optic refl ection spectroscopy (FORS), Principal component analysis (PCA), Forensic science, Inkjet inks
1. Introduction
Comparison of writing means in forensic analysis is performed with the aim to fi nd out whether the same writing mean was used on the document or two compared documents, or whether two writings have the same origin, or whether the writing mean is as old as it is considered etc. Currently used analytical techniques as TLC, HPTLC, GC-MS, and HPLC [1–3] require pre-treatment of a sample before analysis. This approach brings several drawbacks, which fi nally leads to the destruction of evidence. In recent years in the fi eld of forensic examination of documents increasingly greater attention is given to non-destructive methods among which the methods of molecular spectroscopy are of particular interest. These methods generally do not require pre-treatment of a sample, thus no damage of objects under examination arises.
Zbornik1_PA2014_10.indd 176Zbornik1_PA2014_10.indd 176 25. 2. 2014 12:11:3425. 2. 2014 12:11:34

Polygrafi a Academica 2014 177
This paper is focused on the combination of fi bre optic refl ection spectroscopy in the Vis-NIR spectral regions and multivariate statistical analysis Principal Component Analysis (PCA). Combination of these methods appears to be a suitable tool for the study of properties and identifi cation of inks on documents for forensic and technical analysis. The spectral data obtained with modern spectrophotometers are diffi cult to interpreting data sets containing a large amount of information, which may be partially hidden. Therefore, it is necessary to use the method to detect hidden structures in large data sets. One of the most robust multivariate statistical methods of data analysis is the Principal Components Analysis – PCA – created in 1901 by Pearson [4]. This method provides a visual representation of the relationship between samples and variables, as well as provides an insight as to how the measured values contribute to the similarity respectively to the diff erences of samples. The main idea of principal component analysis (PCA) is to reduce the dimensionality of a data set consisting of a large number of interrelated variables, while retaining as much as possible of the variation present in the data set. This is achieved by transforming to a new set of variables, the principal components (PCs), which are uncorrelated, and which are ordered so that the fi rst few retain most of the variance present in all of the original variables. [5] However, spectral data contain a large amount of information, which is partially hidden because the data are too complex to be easily interpreted. Principal Component Analysis (PCA) helps us visualize all the information contained in the spectral data set. PCA also helps fi nd out in what one sample is diff erent from another, which variables contribute most to this diff erence, and whether those variables contribute in the same way (are correlated) or independently from each other. It enables us to detect sample patterns, like any particular grouping. It also quantifi es the amount of useful information (opposed to noise or meaningless variation) contained in the data set [6–10].
The aim of this paper was study of spectral properties of inkjet prints in Vis-NIR spectral region with the use of PCA.
2. Experimental
The samples of prints (Fig. 1) were printed on standard 80 g/m2 paper (Xerox Performer) by diff erent kind of inkjet printers and setup to only black printing option.
Fig. 1: Model target.
Vis-NIR spectra were measured with an Ocean Optics fi bre optics spectrophotometer consisting of HiRes spectrometer HR 4000CG, UV-Vis-NIR light source DH-2000-BAL and standard refl ection/backscattering probe with
Zbornik1_PA2014_10.indd 177Zbornik1_PA2014_10.indd 177 25. 2. 2014 12:11:3425. 2. 2014 12:11:34

178 Polygrafi a Academica 2014
refl ection accessory with 45°/45° geometry in the wavelength range 450–1000 nm. This wavelength range was chosen because absorption by the paper substrate was more disturbing in the range of wavelengths below 450 nm and the range 500–1050 nm was believed to be appropriate on the basis of preliminary tests. For each measurement, the detector was calibrated on the blank paper near the inked area. In this way, changes in the background of the spectral data because paper inhomogenities were largely excluded. Spectra were averaged from three measurements. The original Vis-NIR spectra were interpolated in the wavelength range 450–1000 nm with steps of 2.0 nm, to obtain 275 points (this number of points was believed to be suitable for further analysis of the spectra).
Vis-NIR spectra of inkjet prints, obtained from solid surfaces of model targets (Fig. 1), have been subjected to Principal Component Analysis (PCA). In the fi rst step Matrix of Inkjet Prints Spectra – MIPS was created. Each row of the matrix contains particular spectrum of given inkjet print sample and columns contain individual wavelengths of the spectra. This matrix was the input data to the PCA. Then the numbers of signifi cant principal components of spectra data set were determined.
3. Results and discussion
In the fi gure 2 is the index graph of explained variance5, this plot indicates how much of the variance in the data is described by the diff erent number of the most signifi cant components. Total residual variance is computed as the sum of squares of the residuals for all the variables, divided by the number of degrees of freedom. In
Fig. 2: Index graph of explained variance.
Zbornik1_PA2014_10.indd 178Zbornik1_PA2014_10.indd 178 25. 2. 2014 12:11:3425. 2. 2014 12:11:34

Polygrafi a Academica 2014 179
this case the graph indicates the presence of three principal components. The graph also shows that the fi rst three principal components explain 98.91 % of variance.
In fi gure 3 is a scatter diagram of component score for the fi rst and second principal component (PC-1, PC-2). This diagram is the most important graph of principal component analysis. The plot gives information about patterns in the samples. The score plot for (PC-1,PC-2) is especially useful, since these two components summarize more variance in the data than any other pair of components. According to the disttribution the samples can be divided to the clusters. Objects lying in a given cluster are similar and not similar with samples from other clusters. Clusters lying close together are relatively similar.
Fig 3: Scatter plot of scores for the fi rst two principal components.
Based on the score values for the fi rst principal component (PC-1), which describes 87 % variability of data, we can divide samples into two groups (C1 and C2). Printouts from C1 group show negative values of score for the fi rst principal component and samples from C2 group have positive values of the score for PC1. Together with the second principal component (PC-2) describing 10 % of the data variability, it is possible to divide the samples of the spectra of the prints into six clusters (G1–G6). Because of the high positive value of the component score for the PC-2, the E2 sample can be distinguished from all other samples. Samples of the G6 group show certain degree of correlation in coordinates PC-1 and PC-2, but compared to the rest of the groups, this group is less compact.
In fi gure 4 is correlation loadings plot for PC-2, which shows that PC-2 describes the changes in spectra at wavelengths from 650–750 nm.
Zbornik1_PA2014_10.indd 179Zbornik1_PA2014_10.indd 179 25. 2. 2014 12:11:3625. 2. 2014 12:11:36

180 Polygrafi a Academica 2014
Fig. 4: Correlation loadings PC-2.
The comparison of normalized Vis-NIR spectra of inkjet prints of the groups G1 to G3 (Fig. 5) confi rms, that positive values of the score for PC-2 modelling a bathochromic shift of a broad absorption band in the region 650–700 nm.
Fig. 5: Comparison of Vis-NIR spectra of samples from groups G1–G3.
Zbornik1_PA2014_10.indd 180Zbornik1_PA2014_10.indd 180 25. 2. 2014 12:11:3825. 2. 2014 12:11:38

Polygrafi a Academica 2014 181
To test the proposed PCA model,the spectrum of print, which wasn’t used to create the model (labelled as T1B) was added to the MIPS matrix. Thus the test matrix of inkjet prints spectra was created (t-MIPS).
In fi gure 6 is a graph of component score of test set of spectra (t-MIPS) for the fi rst two principal components (PC-1, PC-2). Location of test spectrum T1B in scatter plot of component score for the fi rst two principal components, indicating the similarity of spectra obtained from the printer E1B. This result confi rms the functionality of the PCA model; because the test spectrum was obtained from out-print of another model of inkjet printer Epson SX420.
Fig. 6: Scatter score plot of testing set of Vis-NIR spectra of inkjet printsfor PC-1 and PC-2.
4. Conclusions
The suitability of the Principal Component Analysis as the tool for identifi cation of Vis-NIR spectra of inkjet prints was studied. In the Vis-NIR spectra of inkjet inks the PCA method indicates important principal components, which correspond with changes of absorption in spectral regions 450–650 and 750–1000 nm. Based on the score values of the fi rst principal component, which explains 87 % of data variability, the printouts can be divided into the two groups (C1 and C2) (Fig. 2). The samples of C1 group have negative values of component score for the fi rst principal component and samples from C2 group have positive values. Together with the second principal component, which describes 10 % of the variance of data, it is possible to divide the sample into the six clusters (G1–G6). Based on high
Zbornik1_PA2014_10.indd 181Zbornik1_PA2014_10.indd 181 25. 2. 2014 12:11:4225. 2. 2014 12:11:42

182 Polygrafi a Academica 2014
positive value of component score for second principal component it is possible to distinguish E2B sample from other samples.
The second principal component describes a bathochromic shift of samples from groups G1 and G2 against the spectra of samples from G3 group (Fig. 5). The functionality of the designed PCA model was tested with test spectrum of inkjet print. Test spectrum does not increase the number of factor of the spectra set and PCA model is able to assign the test spectrum to the right group of spectra. Correlation between the test spectrum and spectrum of sample E1B confi rm the function of designed PCA model.
Acknowledgments
This work was supported by the Slovak Research and Development Agency un-der the contract no. APVV-0324-10. This publication is the result of the project im-plementation: ITMS: 26240120016 supported by the Research and Development Operational Programme funded by the ERDF.
5. References
1. Wilson J. D. et al. Diff erentiation of black gel inks using optical and chemical techniques, J. Forensic Sci., Vol. (2004) 49, p. 364–370.
2. Weyermann, C. et al. Diff erentiation of blue ballpoint pen inks by laser desorption ionization mass spectrometry and high – performance thin – layer chromatography, J. Forensic Sci., Vol. (2007) 52, p. 216–220.
3. Hofer, R. Dating of ballpoint pen ink, J. Forensic Sci., Vol. (2004) 49., p. 1353–1357. 4. Pearson, K. On lines and planes of closest fi t to systems of points in space, Philos. Mag.,
Vol. (1901) 2, p. 559–572. 5. Jollife, I. T. Principal component analysis – second edition, Springer, New York, (2002). 6. Jackson, J. E. A Users Guide to Principal Components, Wiley & Sons Inc., 9780471622673,
New York, (1991). 7. Rao, C. R. The Use and Interpretation of Principal Component Analysis, Applied Research,
26, (1964), p. 329–358. 8. Esbensen; K. Multivariate Data Analysis – In Practice, CAMO Process AS, Oslo, (2002). 9. Mardia, K. V., Kent, J. T., Bibby, J. M. Multivariate Analysis, Academic Press Inc., London,
(1979). 10. Meloun, M., Militký J., Hill M. Počítačová analýza vícerozměrných dat v příkladech,
Academia, ISBN: 80-200-1335-0, Praha, (2005).
Zbornik1_PA2014_10.indd 182Zbornik1_PA2014_10.indd 182 25. 2. 2014 12:11:4425. 2. 2014 12:11:44

Polygrafi a Academica 2014 183
Farbivom senzibilizované solárne články
s kompozitnými elektródami na báze
PPy/Ag/f-MWCNT
Pavol Gemeiner1, Milan Mikula1, Zuzana Beková1,Ľubomír Švorc2, Mária Omastová3
1Oddelenie polygrafi e a aplikovanej fotochémie, FCHPT STU v Bratislave,Radlinského 9, 812 37 Bratislava
[email protected] analytickej chémie, FCHPT STU v Bratislave,
Radlinského 9, 812 37 Bratislava3Ústav polymérov SAV, Dúbravská cesta 9, 845 41 Bratislava
Abstrakt: Composites based on polypyrrole/silver/functionalized multiwalled carbon nanotubes (PPy/Ag/f-MWCNT) with diff erent content of f-MWCNT were prepared and deposited via doctor blade technique onto glass slides with fl uorine doped tin oxide layer (FTO). Prepared samples were used as catalytic layers of counter electrodes for dye sensitized solar cells (DSSC) and compared with standard DSSC with platinized CE. The main objective of this work is to construct functional low-cost DSSCs with mass techniques as screen printing, used for TiO2 photoanode preparation, as well as for PPy/Ag/f-MWCNT counter electrode assembly made by doctor blade.
Kľúčové slová: polypyrol, uhlíkové nanorúrky, protielektróda, farbivom senzibilizova-né solárne články
1. Úvod
Farbivom senzibilizované solárne články (z angl. Dye Senzitised Solar Cells) sú vďaka svojej ekologickej a nízko nákladovej výrobe a relatívne vysokej účinnosti alternatívou ku konvenčným článkom na báze kremíka. Aj vďaka tomu sa výskum v oblasti fotovoltaiky zamariava na novú generáciu organicko-anorganických so-lárnych článkov kam DSSC patria [1].
Štandardný DSSC článok pozostáva z nanokryštalickej TiO2 elektródy, farbiva na báze ruténiového komplexu, elektrolytu obsahujúceho redoxný pár (I3
–/I–) a Pt protielektródy [2]. Protielektróda ako nenahraditeľný komponent DSSC plní úlohu mediátora pre zber elektrónov z externého obvodu a regeneruje redoxný pár. Pt protielektródy sú na jednej strane veľmi často využívané hlavne vďaka svojej vy-sokej vodivosti a katalytickej aktivite, ale na strane druhej ich veľkou nevýhodou je vysoká cena a korózia spôsobovaná elektrolytom. Preto sa súčasný výskum zame-riava na využitie cenovo vhodnejších a stabilnejších materiálov ako sú uhlíkové na-nomateriály [3] (sadze, grafi t, grafén a uhlíkové nanorúrky) a vodivé polyméry ako
Zbornik1_PA2014_10.indd 183Zbornik1_PA2014_10.indd 183 25. 2. 2014 12:11:4425. 2. 2014 12:11:44

184 Polygrafi a Academica 2014
polypyrol, poly(3,4-etyléndioxytiofén) [4] a polyanilín [5]. Na obr. 1 je znázornená štruktúra DSSC s využitím polypyrolu v kombinácii s MWCNT ako protielektródy.
Vodivý polymér polypyrol (PPy) našiel široké uplatnenie v elektronických apli-káciách ako napr. nabíjateľné batérie, senzory a solárne články. V DSSC článkoch sa využíva hlavne ako náhrada kvapalného elektrolytu a protiľahlá elektróda. Heteroaromatická povaha a π-konjugovaný systém väzieb reťazca PPy určuje jeho stabilitu a elektrickú vodivosť. Avšak, k dostatočnej vodivosti PPy nepostačuje π-konjugovaný systém väzieb reťazca. Zvyšovanie vodivosti sa uskutočňuje pomo-cou dopovania, parciálnou extrakciou náboja z PPy reťazca. Dopovaním sa vodi-vosť neutrálneho PPy výrazne mení až na hodnoty pre kovy [6]. Nevýhodou PPy je nerozpustnosť, čo vedie následne k nižšej vodivosti disperzií, čo môže priamo ovplyvniť účinnosť článku. Avšak, vodivé polyméry môžu byť kombinované s uhlí-kovými materiálmi a tak vytvárať kompozity s veľmi dobrými elektrickými a kataly-tickými vlastnosťami [7]. Navyše kombinácia polypyrolu s nanočasticami striebra, ktoré sú odolné voči korózii a oxidácii môže zlepšiť vlastnosti katalytickej vrstvy [8]. Na obr. 1 je znázornená štruktúra pripravených DSSC zložených zo sieťotlačou pripravených TiO2 fotoanód na FTO sklách a senzibilizovaných v ruténiovom N3 farbivu, elektrolytu na báze redoxného páru jodid/trijodid a protielektródy s kata-lytickou vrstvou PPy/Ag/f-MWCNT nanesených pomocou „doctor blade“ techniky na FTO sklách.
Obr. 1: Štruktúra pripravených farbivom senzibilizovaných solárnych článkov.
2. Experiment
Pre prípravu fotoanódy bola použitá TiO2 pasta pre sieťotlač, ktorá obsahovala 3 g TiO2 nanočastíc (Evonik, Aeroxide, P25, ~22 nm), 0,5 ml kys. octovej (>96,6 %), 2,5 ml destilovanej vody a 15 g α-terpineolu (Aldrich, >96,6 %) a 1,5 g etylcelulózy. FTO sklíč-
Zbornik1_PA2014_10.indd 184Zbornik1_PA2014_10.indd 184 25. 2. 2014 12:11:4425. 2. 2014 12:11:44

Polygrafi a Academica 2014 185
ka (Aldrich, ~7 Ω/sq., 2 × 3 cm) boli pred tlačou dané do roztoku detergentu a ultra-zvuku na 10 min a boli vystavené pôsobeniu UV žiarenia na 15 min. Kvôli zvýšeniu povrchovej energie substrátov a adhézie nanášaných vrstiev boli FTO sklíčka plazmo-vané dielektrickým bariérovým výbojom pri okolitej atmosfére 30 s. Jednovrstvové fotoanódy s aktívnou plochou 1,5 cm2 boli pripravené sieťotlačou (sieťka s lineatúrou 55 lin/cm, d = 64 μm, odtrh 4 mm) TiO2 pást. Kvôli odstráneniu organických prímesí a zvýšeniu prepojenia medzi nanočasticami boli po tlači fotoanódy dané do mufl o-vej pece na 30 min a boli vypálené pri 450 °C. TiO2 vrstvy boli senzibilizované 24 h v 0,4 mM roztoku ruténiového farbiva v etanole (Solaronix, N3).
Vzorka disperzie PPy/Ag bola pripravená oxidačnou polymerizáciou 0,32 ml pyrolu v prítomnosti 1,63 g AgNO3 ako oxidačného činidla vo vodnou prostredí (100 ml) a prídavkom 4 g PVP pri izbovej teplote. MWCNT boli 8 h kovalentne funk-cionalizované v prostredí roztoku HNO3 a HCl (1:1). Aby sa získal suchý prášok funk-cionalizovaných MWCNT (f-MWCNT) bola disperzia fi ltrovaná a fi ltrát sušený 30 min pri 110 °C. Prášok f-MWCNT bol pridaný do izopropyl alkoholu, homogenizovaný v ultrazvukovom kúpeli 5 min a pridaný do disperzie PPy/Ag v takom množstve aby sa získali vzorky PPy/Ag/f-MWCNT s 0,1, 0,2 a 0,4 hm. % f-MWCNT. Katalytické vrstvy protielektród s rozmerom 1,2 × 1,8 cm boli pripravené pomocou techniky „doctor blade“ na očistené FTO sklíčka (rozmer 2 × 3 cm) a následne boli sušené vo vákuu pri 90 °C. Ako štandardná protilektróda bola použitá platina (Solaronix, Platisol T/SP), nanesená na FTO sklíčka pomocou „doctor blade“.
DSSC články boli pripravené spojením senzibilizovaných TiO2 fotoanód s pri-pravenými PPy/Ag/f-MWCNT a štandardnou Pt protilektródou pomocou binder klipov. Ako elektrolyt bol použitý štandard na báze redoxného páru jodid/trijodid (Solaronix, AN 50) pridávaný v objeme 12 μl.
3. Výsledky a závery
Topografi a a stredná kvadratická drsnosť (Rq) pripravených PPy/Ag/f-MWCNT protielektród boli hodnotené pomocou nekontaktného módu AFM. VzorkyPPy/Ag a PPy/Ag s f-MWCNT mali podobne nehomogénny povrch tvorený agregát-mi a zhlukmi polypyrolu prípadne f-MWCNT, pospájané fi lmotvorným podielom PVP, nezávisle od množstva pridaných f-MWCNT (obr. 2 vpravo). Namerané hodno-ty Rq boli 14 nm pre PPy/Ag, ~30 nm pre PPy/Ag s 0,1, 0,2 a 0,4 hm. % f-MWCNT. Tvorba agregátov mohla byť spôsobená nedostatočným homogenizačným proce-som pri príprave disperzií a celkovo ich nízkou stabilitou. V porovnaní s nimi bola protielektróda s katalytickou vrstvou Pt homogénnejšia bez zhlukov s Rq = 32 nm (obr. 2 vľavo). Štruktúra a drsnosť povrchu ovplyvňujú schopnosť transportu nábo-ja medzi protielektródou a elektrolytom (do úvahy sa musí brať aj odpor vrstvy ako aj prekrytie aktívneho povrchu polymérom PVP), pričom vyššia drsnosť by mala znamenať väčšiu aktívnu plochu pre transport.
Vplyv opracovania substrátov FTO sklíčok v plazme DBD na celkovú účinnosť a fotovoltaické parametre pripravených DSSC článkov s protielektródami s 0,1, 0,2 a 0,4 hm. % f-MWCNT je uvedený v tab. 1. Vďaka aktivácii povrchu, zvýšeniu
Zbornik1_PA2014_10.indd 185Zbornik1_PA2014_10.indd 185 25. 2. 2014 12:11:4525. 2. 2014 12:11:45

186 Polygrafi a Academica 2014
povrchovej energie plazmovaných substrátov a teda lepšej adhézie nanesených katalytických vrstiev boli namerané výrazne vyššie hodnoty účinnosti (η), skrato-vého prúdu (ISC) a napätia (UOC) pripravených DSSC s protielektródami PPy/Ag s 0,1 a 0,2 hm. % f-MWCNT. Pre PPy/Ag/ s 0,4 hm. % malo opracovanie substrátu vplyv na UOC čo súvisí hlavne so zníženým odporom na rozhraní FTO – katalytická vrstva.
Obr. 2: AFM topografi a pripravených vzoriek protielektród, vľavo – Pt, vpravo – PPy/Ag/0,2 f-MWCNT
Tab. 1: Fotoelektrické vlastnosti DSSC s PPy/Ag/f-MWCNT protielektródami pripravenými na plazmou opracované (P) a neopracované (N) FTO sklené substráty.
Sampleη [%] ISC [mA] UOC [V]
P N P N P NPPy/Ag/0,1 f-MWCNT 0,12 0,01 1,27 0,30 0,60 0,26PPy/Ag/0,2 f-MWCNT 0,39 0,24 2,53 1,28 0,60 0,59PPy/Ag/0,4 f-MWCNT 0,08 0,09 0,87 1,02 0,50 0,28
Cyklická voltametria (CV) napomáha hodnotiť vzťah medzi difúziou iónov a re-akčnou kinetikou elektrochemického systému – DSSC. Obr. 3 zobrazuje krivky CV merané pre vzorky elektród na báze Pt, PPy/Ag a PPy/Ag/0,2 f-MWCNT. Na krivke štandardnej vzorky Pt sú namerané dva páry oxidačných (1, 2) a redukčných píkov (1´, 2´), ktoré prislúchajú oxidačno redoxným reakciám I3
–/I– a I2/I3–. Vzorka PPy/Ag/0,2
f-MWCNT dosiahla najvyššiu hodnotu prúdovej hustoty (J), čo môžeme pripísať vyššej katalytickej aktivite ako pri vzorkách Pt. Naopak, vzorka PPy/Ag nepreukázala žiadnu výraznú aktivitu výmeny náboja v použitom elektrolyte.
I/V charakteristiky pripravených DSSC s rôznymi protielektródami sú zobra-zené na obr. 4. Najvyššiu účinnosť 1,81 %, Isc = 4,3 mA a Uoc = 0,7 V dosiahol člá-nok so štandardnou Pt protielektródou. Výrazný vplyv na celkové fotovoltaické parametre DSSC mal prídavok f-MWCNT k PPy/Ag a najvyššie hodnoty dosiahla
Zbornik1_PA2014_10.indd 186Zbornik1_PA2014_10.indd 186 25. 2. 2014 12:11:4525. 2. 2014 12:11:45

Polygrafi a Academica 2014 187
vzorka PPy/Ag/0,2 f-MWCNT s η = 0,38 %. Aj napriek výraznejšej aktivite pri vý-mene iónov (CV) dosiahli DSSC s touto protielektródou nižšiu η ako Pt, čo môže-me pripísať vyššiemu sériovému odporu protielektródy, ktorý je rovný Rs = RFTO ++ Rvr + Rcat, kde RFTO je odpor vrstvy transparentného oxidu, Rvr je odpor katalytic-kej vrstvy protielektródy a Rcat je odpor výmeny náboja medzi elektrolytom a ka-
Obr. 3: CV merania pre vzorky pripravených elektród na báze Pt,PPy/Ag a PPy/Ag/0,2 f-MWCNT.
Obr. 4: I/V charakteristiky pripravených DSSC s protielektródami na báze Pt,PPy/Ag a PPy/Ag s obsahom 0,1, 0,2 a 0,4 hm. % f-MWCNT.
Zbornik1_PA2014_10.indd 187Zbornik1_PA2014_10.indd 187 25. 2. 2014 12:11:4525. 2. 2014 12:11:45

188 Polygrafi a Academica 2014
talytickou vrstvou. Odpor vrstiev PPy/Ag a PPy/Ag/f-MWCNT narastá i vplyvom prítomnosti nevodivého polymérneho pojidla PVP. Tomu zodpovedá aj výrazný pokles I/V kriviek voči DSSC s Pt a zmena tvaru kriviek, ktoré zvierajú s osou x (U) menší uhol ako krivka vzorky DSSC s Pt protielektródou ako aj pokles hodnôt Uoc, pričom bol pri všetkých vzorkách použitý rovnaký elektrolyt aj fotoanóda.
Poďakovanie
Práca bola realizovaná s fi nančnou podporou Slovenskej technickej univerzity v rámci projektu pre mladých výskumníkov (FlexiCell 6436) a projektu a Vedeckej grantovej agentúry MŠ SR (VEGA 1/0818/13).
4. Literatúra
1. Nazeeruddin, M. K., Angelis, F. D., Fantacci, S., Selloni, A., Viscardi, G., Liska, P., Ito, S., Takeru, B., Grätzel, M. J. Am. Chem. Soc. 127, 16835, (2005).
2. Grätzel, M. Nature 414, str. 338 – 344 (2001).3. Wang, G., Wei Xing, Shuping Zhuo, J. Power Sources, 568 – 573 (2009).4. Ahmad, S., Yum, J. H., Zhang, X. X, Gratzel, M., Butt, H. J. J. Mater. Chem. 20, 1654 – 1658
(2010).5. H. Sun, Y. Luo, Y. Zhang, D. Li, Z. Yu, J. Phys. Chem. C 114, 11673 – 11679 (2010).6. Weng, B., Shepard, R. L., Crowley, K., Killard, A. J., Wallace, G. G. Printing conducting poly-
mers. Analyst, RSC Publishing 135, 2475 – 3012 (2010).7. Shangjie Peng et. al. Journal of Photochemistry and Photobiology A: Chemistry 223, 97 –
102 (2011).8. Omastová, M. et. al. Synthetic metals, 166, 57 – 62 (2013).
Zbornik1_PA2014_10.indd 188Zbornik1_PA2014_10.indd 188 25. 2. 2014 12:11:4525. 2. 2014 12:11:45

Polygrafi a Academica 2014 189
Forensic image analysis
of writting pen inks
Vladimír Dvonka, Pavol Gemeiner,Milena Reháková
Department of Graphic Arts and Applied Photochemistry,Institute of Natural and Synthetic Polymers,Faculty of chemical and food Technology,
Slovak University of Technology in BratislavaRadlinskeho 9, 812 37 Bratislava, [email protected]
Abstrakt: In this study was used image analysis to obtain important information from samle captured with digital microscope. Calculation of CIE L*a*b* coordinates was made from Adobe RGB color space, from witch can be calculated color diff erence ΔE*ab or other calculation in color spaces. Deformation or variation of writen pen line can be described using line spread function (LSF) and modulation transfer function (MTF) [10]. Other method for variation in space is fractal analysis [11] or using computing of noise.
Keywords: forensic analysis, color coordinates, color error, line spread function, modu-lation/modular transfer function, fractal analysis
1. Methods of measurement
1.1. Color coordinates and color diff erence
Modern measurement instruments allow to measure color coordinates from color captured sample. In our case was used Olympus metalographic microscope BX51M with Peltier cooled CCD camera DP73 (working in Adobe RGB color space, 14 bit, max. 17.29 Mpix with pixel shift, 2.1 Mpix physically resolution, pixel size 4.4 × 4.4 μm), objec-tive 20× enlarge (approximately 200× total enlarge), metal halide illumination system. Sample with blue pen drawn line on standard paper was captured using this device with camera resolution 4.1 Mpix (captured sample size 2400 × 1800 pixels, 530 × 700 μm). The same paper type from one producer was used, only the type of pen was various. (For sample type see table 1 in Belányiová contribution in this proceedings.)
The CIE L*a*b* coordinates were computed as average value from 100 × 100 pixels matrix in three diff erent positions of written line in the same place consider-ing all samples (Fig. 1).
1.2. Line spread function
Line spread function (line profi les) was used to measure the pen line width, line width variation and peak maximum variation (Fig. 2.). Every line profi le was meas-
Zbornik1_PA2014_10.indd 189Zbornik1_PA2014_10.indd 189 25. 2. 2014 12:11:4525. 2. 2014 12:11:45

190 Polygrafi a Academica 2014
ured as a average of 15 line profi les. Variation of the peak maximum inform about variation of maximum optical density of the pen line.
Sample were digitized using scanner with resolution 2400 ppi, 8 bit pixel color depth. Sample to measure optical density were scanned with 16-bit pixel color depth.
1.3. Conclusion
The results need to be inspected deeply and results need to be combined with results from infrared and optical spectroscopy.
Fig. 1: Color coordinates L*, a*, b* of micro measured pen lines.
Fig. 2: Line profi le (line spread function) of various written line of pens.
Zbornik1_PA2014_10.indd 190Zbornik1_PA2014_10.indd 190 25. 2. 2014 12:11:4525. 2. 2014 12:11:45

Polygrafi a Academica 2014 191
Acknowledgement
This work was supported by the Scientifi c Grant Agency, Ministry of Education of Slovak Republic – VEGA 1/0818/13 and Slovak Research and Development Agency under the contract no. APVV-0324-10. This publication is the result of the project implementation: ITMS: 26240120034, Centre of Excellence of Security Research.
3. Literatúra
1. Silva, C. S., Borba, F. de S. L., Pimentel, M. F., Pontes, M. J. C., Honorato, R. S., Pasquini, C. Classifi cation of blue pen ink using infrared spectroscopy and linear discriminant analy-sis. Microchemical Journal (2012). Available online [30. 3. 2012]: http://www.sciencedi-rect.com/science/article/pii/S0026265X12000719.
2. Brunelle, R. L. Ink Analysis. Document analysis, Brunelle Forensic Laboratories, Fredericksburg, VA, USA, Academica Press (2010), doi: 10.1006/rwfs.2000.0479.
3. Adam, C. D., Sherratt, S. L., Zholobenko, V. L. Classifi cation and individualisation of black ballpoint pen inks using principal component analysis of UV–vis absorption spectra. Forensic Science International, Elsevier, Vol. 174, 1 (2008), 16–25.
4. Djozan, D., Baheri, T., Karimian, G., Shahidi, M. Forensic discrimination of blue ballpoint pen inks based on thin layer chromatography and image analysis. Forensic Science International, Elsevier, Vol. 179, 2–3 (2008), 199–205.
5. Lavine, B. K., Rayens, W. S. 3.16 – Statistical Discriminant Analysis. Comprehensive Chemometrics, Chemical and Biochemical Data Analysis, Elsevier, Vol. 3 (2009), 517–540.
6. Solčáni, J. Riešenie problému krížených ťahov pomocou techník počítačového videnia (diplomová práca, vedúci: doc. RNDr. Milan Ftáčnik, CSc.). Katedra informatiky, Fakulta matematiky, fyziky a informatiky Univerzity Komenského, Bratislava (2007).
7. Neumann, C., Mazzella, W. D. Questioned Documents. FORENSIC SCIENCES, University of Lausanne, Lausanne, Switzerland, Elsevier (2005).
8. Kher, A., Mulholland, M., Green, E., Reedy, B. Forensic classifi cation of ballpoint pen inks using high performance liquid chromatography and infrared spectroscopy with prin-cipal components analysis and linear discriminant analysis. Vibrational Spectroscopy, Elsevier, Vol. 40, 2 (2006), 270–277.
9. Roux, C., Novotny, M., Evans, I., Lennard, Ch. A study to investigate the evidential value of blue and black ballpoint pen inks in Australia. Forensic Science International, Elsevier, Vol. 101, 3 (1999), 167–176.
10. Koopipat C., Tsumura N., Fujino M., Miyata K., Miyake Y., Image Evaluation and Analysis of Ink Jet Printing System (I) – MTF Measurement and Analysis of Ink Jet Images, J. Imag. Sci. Technol. 45, 6 (2001), 591–597.
11. Zmeškal O., Nežadal M., Buchniček M., Čeppan M.: Fractal Analysis of Printed Structures, J. Imag. Sci. Technol. 46, 5 (2002), 453–456.
Zbornik1_PA2014_10.indd 191Zbornik1_PA2014_10.indd 191 25. 2. 2014 12:11:4525. 2. 2014 12:11:45

192 Wood, Pulp and Paper 2014
Zbornik1_PA2014_10.indd 192Zbornik1_PA2014_10.indd 192 25. 2. 2014 12:11:4525. 2. 2014 12:11:45