Wonderfonteinspruit Catchment Area - mwrg.co.zamwrg.co.za/Reports/2008-07-08 Hot spot map to...
37
Wonderfonteinspruit Catchment Area Technical Project Working Group (WCA-TPWG) 3rd Meeting, 09.05.2008, Randfontein West Rand District Municipality Offices, Modiro Boardroom, 09:00 – 12:30 Identification and localisation of radioactively polluted sites in the Wonderfonteinspruit (WFS) catchment (‘Hot Spot Map’) – methodological considerations and first results Prof Dr Frank Winde North West University Potchefstroom Campus School of Environmental Sciences and Development 93 92 88 87 85 84 81 80 79 72 67 64 63 59 54 31 30 8 7 1 99 98 91 77 76 51 41 40 33 17 15 14 13 12 10 100 ³ 0 5 10 15 20 2,5 Kilometers Uranium contamination in the Wonderfonteinspruit catchment Map 17: Hot spots based on maximum values (water and sediment) © Winde (2008) Internal nr. Internal nr. Legend Sediment hot spots Water drink hot spots High risk (sed >2 x NNR limit) High risk (>2 x DWAF drink water limit)
-
Upload
truongcong -
Category
Documents
-
view
217 -
download
0
Transcript of Wonderfonteinspruit Catchment Area - mwrg.co.zamwrg.co.za/Reports/2008-07-08 Hot spot map to...

Wonderfonteinspruit Catchment AreaTechnical Project Working Group (WCA-TPWG)
3rd Meeting, 09.05.2008, Randfontein
West Rand District Municipality Offices, Modiro Boardroom, 09:00 – 12:30
Identification and localisation of radioactively polluted sites in the Wonderfonteinspruit (WFS) catchment
(‘Hot Spot Map’) –
methodological considerations and first results
Prof Dr Frank WindeNorth West UniversityPotchefstroom CampusSchool of Environmental Sciences and Development
93
92
88
87
85
84
81
80
7972 67
64
63 59
54
31
30
8
7
1
99
98
91
77
76
51
41
40
33
17
15
14
13
12
10
100
³0 5 10 15 202,5
Kilometers
Uranium contamination in the Wonderfonteinspruit catchmentMap 17: Hot spots based on maximum values (water and sediment)
© Winde (2008)
Internal nr.
Internal nr.
Legend
Sediment hot spots
Water drink hot spots
High risk (sed >2 x NNR limit)
High risk (>2 x DWAF drink water limit)

Contents
1. Background information - objective- constraints
2. Principle approach
3. Compiling the map Base mapData extractionRisk categorisation
4. Results
5. Overview on used studies
6. Limitations of map

1. Background
Objective- to determine sites in the WFS catchment where…
(1)… waterborne pollution (2) … with mining-related radionuclides(3) … resulted in levels of radioactive contamination(4) …that may pose a significant health risk(5)… to members of the general public
such sites are currently termed ‘hot spots’ may need to be renamed (e.g. ‘sites of concern’, ‘intervention sites’…)
Main purpose:Develop screening tool to prioritise sites that pose health risk and need intervention
Constraints- selection of data on radioactive pollution must be based solely on information generated by 3 studies:
- IWQS (1999), - WRC 1214 (2004) - BSA (2007)
Possible approach: Combine ‘hot-spots’ from previous study into single map
not possible:- used different methodologies for determining possible health risks - findings inconsistent, contested and partly contradictory- temporal and spatial representativity of data differ vastly

2. Principle approach
- focus on ‘hard data’ to avoid modelling uncertainty and its surrounding controversy measured radionuclide concentrations (mainly U238) U is most crucial ( IWQS, 1999: linear relation between U-conc and dose levels)
- employ alternative risk assessment method taking exposure probability into account
- data quality will be characterisedsampling (site selection, depth, time, frequency etc.) analytical methods (type of U-analyses, accuracy, reproducibility, provision of
accompanying parameters such as oS, grain size etc.)
- only looks at waterborne pollution related to mining (i.e. no dust- or Rn-pollution, no NUFCOR or fertilizer poll.)
- only refers to current conditions (i.e. does not include for example effects of future rewatering on pollution)
- “ water is no health risk - only sediment is”would imply that there is no need to include any water data into the hot spot map most likely based on IWQS (1999) and BSA (2007) which both agree that the drinking water
pathway does not pose a radiological health risk but:
WRC 1214 (2004): water displays U-based chemical toxicityBSA (2007): identifies number of sites where primary risks relates to the use of polluted water
- N-Cape study (1995): link between elevated U-levels in groundwater and leukaemia it seems possible that current limits may generally underestimate the health risk
therefore: - water pollution is included in the hot spot map

3. Compiling the map
1st step: satisfy need for an appropriate base map
2nd step: extract relevant data from selected studies
3rd step: Develop method to categorize extracted data in terms of associated health risk
1st step: need for an appropriate base map

Base maps used in selected studies: IWQS (1999)

Base maps used in selected studies: Council for Geoscience (2004)
Base maps used in selected studies: BSA (2007)

1. Step: Generate comprehensive base map
a) Relevant topographical features
In order to assess contamination-related risks a sound base map is needs to be created containing the - fluvial system
streams, springs, seeps, drainage lines, wetlands, dams, lakes and canals- mining features
lease areas, SDs, rock/ sand dumps, canals, met . plants, settling ponds etc.- settlements
formal, informal, updated to account for rapid growth of informal settlements- geological features
dolomite, dykes, dewatered compartments, sinkholes, dolines …
b) Results of previous studies
- geographical location of all sampling sites (incl. orig. site name/ number)- measured U238 -levels (+ Ra226)
displayed in uniform manner that may differ from maps in the original reportsdistinguishing between different media (surface water, groundwater, sediments, soil)
-Such map would not be sufficient to indicate risk these sites may pose to people In order to assist with that two more simple steps are suggested.

2. Step: Categorize mapped results
- need reduce the complexity of 100 different sites and associated U-data (screening tool needed) - categorizing all data into 3 x classes of pollution levels (low, medium, high)
for surface water, groundwater, sediment
- for categorising common benchmark needed 2 x different types
a) natural background concentrations (e.g. global/ regional)
b) regulatory limits (applicable legislation, national/ international)
- benchmark parameters can easily be changed to suit different requirements

3. Step: Assess associated risk
Risks in this context is understood as the probability of polluted media to actually cause adverse health effects in humans.
- High levels of U per se may not pose any risk to humans if no (realistic) possibility of exposure exists- additional information is required for translate pollution levels into levels of health risks.
Health Risk = Potential of health hazard x Probability of adverse health effects to occur
in this study:
Health Risk = Degree of U-pollution of certain media x Probability of exposure to such media
‘Contaminant level ‘
e.g. measured U-concentration in water and
sediment
‘Exposure probability’
3 x factors characterising access to and use of
polluted media

Quantifying risk factors
a) Contaminant level
indicates the level of radioactive pollution of a specific site.
normally this is determined by the concentration of U238 in water [μg/l = ppb] and sediment [mg/kg = ppm]
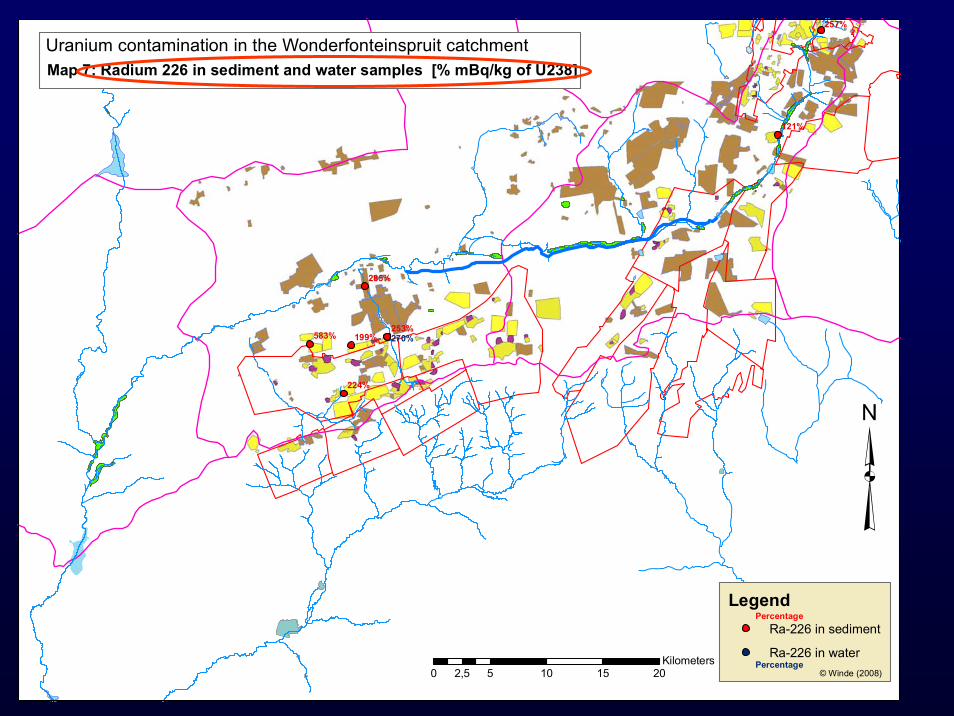
in exceptional cases Ra226 [Bq/kg] displays higher activity concentrations than U238
since Ra226 is particularly hazardous those sites will be indicated separately
b) Exposure probability
approx. measures of degree to which members of general public might be exposed to contaminated media
3 x factors are suggested

b) Exposure factors
1) ‘Accessibility’ (A)The ease at which polluted sites can be accessed by members of the public (legally and illegally): E.g. sediments in the middle of a large dams or wetlands are thought to be more difficult to access than surface water in a mine canals and streams intersected by publicly used pathways, fenced private properties are less accessible than sites in the public space)
2) ‘Access Probability’ (AP)The probability of access to occur. This mainly refers to the number of people making use of the access identified above. E.g. polluted sites on remote farms are less likely to be visited by large numbers of people than those in the close vicinity of large settlements.
3) ‘Usage Probability’ (UP)The degree to which a certain use of polluted media adversely affecting human health is likely to occur:E.g. using surface water for cooking is thought to be more common (and therefore more likely to occur) than eating contaminated sediment (pica syndrome/ geophagy.

c) Health Risk (HR) for a specific site = sum of the products of class weight and risk factor weight
HR = 0,4CL + 0,2A + 0,2AP + 0,2UP (HR: 1…4 )
d) Suggested risk class breaking values and meaning of categories (example):
low risk: 1…<2: require further studies before establishing possible need for interventions
medium risk: 2…3: require further studies, may necessitate medium-term intervention (within 1-4a)
high risk: >3…4 (= hot spot): require immediate intervention (within 1a)
Computation
a) According to significance for health risk each of the 4 x risk factor is weighted (‘risk factor weight’):
suggested weights (open for discussion): Contamination Level (CL): 0,4x Accessibility (A): 0,2xAccess Probability (AP): 0,2x
Usage Probability (UP): 0,2x
b) To make risk factors comparable each will be put in classes of different weight (class weight factor):low: 1x medium: 2x high: 4x

- data generated by 2 steps will be combined in a EXCEL-based ‘risk calculation matrix’
can accommodate changes in preference (i.e. weight of factors, benchmark types/ -values etc.)each sampling site will be categorized: low, medium, high risk
increasing level indicates rising need and urgency for intervention
Recommendations as to the nature of such intervention are, however, excluded from the brief. Intervention measures may range from sites of low risk class requiring additional investigation to restricting access to / use of contaminated media for medium class sites, to active remediation of sites in the highest class of pollution.

4. How to quantify risk factors?
a) Contamination Level’ (40% risk weight)
- concentration of U-238 generally used as sole indicator - exceptions will be indicated where other radionuclides are of greater concern (e.g. Ra 226 …) - only data generated by the following three studies will used: IWQS, 1999; WRC 1214; BSA 2007- distinguish between water, gw, sediments, soil
- at sites where more than one sample was analysed average and maximum U-concentration will be used
- categorize U-levels in low, medium, high levels of pollution: exceedance factors
Exceedance factor = measured U-conc : benchmark
Possible class breaking values for exceedance factors of different benchmarks (open for discussion):
Benchmark
Class Natural background
(global or regional)
Legislative limit
(SA or international)
low < 10x <1x
medium 10 … 100x 1…2x
high >100x >2x
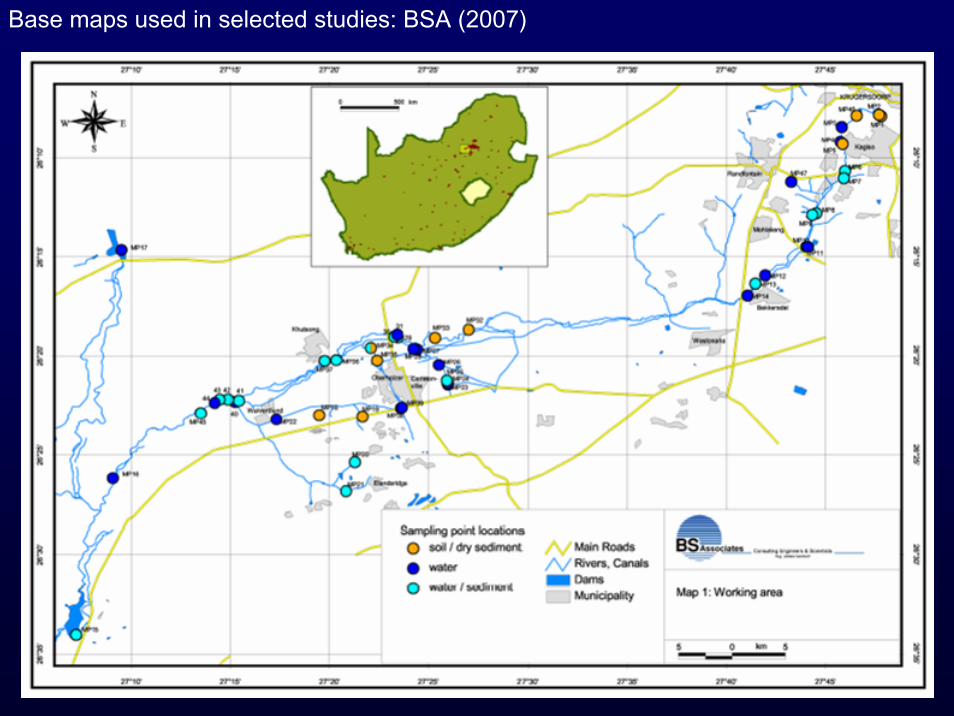
Natural background (global) Legislative limits (South Africa)
Water (DWAF, 1996)
Sediment(NNR, 2006)
Irrigation
(clay rich soil: 10μg/l Unat)
Domestic use (drinking water: TWQR: 70μg/l Unat)
Specif. activity of single radionuclide
Old: 0,2 mBq/kg (=16ppm U238)
New: 0,5 mBq/kg (= 40ppm U238)
low <4μg/l <27ppm <10μg/l <70μg/l <40ppm
medium 4…40μg/l 27…270ppm 10…20μg/l 70…140μg/l 40…80ppm
high >40μg/l >270ppm >20μg/l >140μg/l >80ppm
Water (DWAF, 1996:0,4μg/l Unat)
Sediment(Turekian & Wedepohl, 1996: 2,7ppm Unat)
Class
Resulting U-concentration classes for different media and different benchmarks:
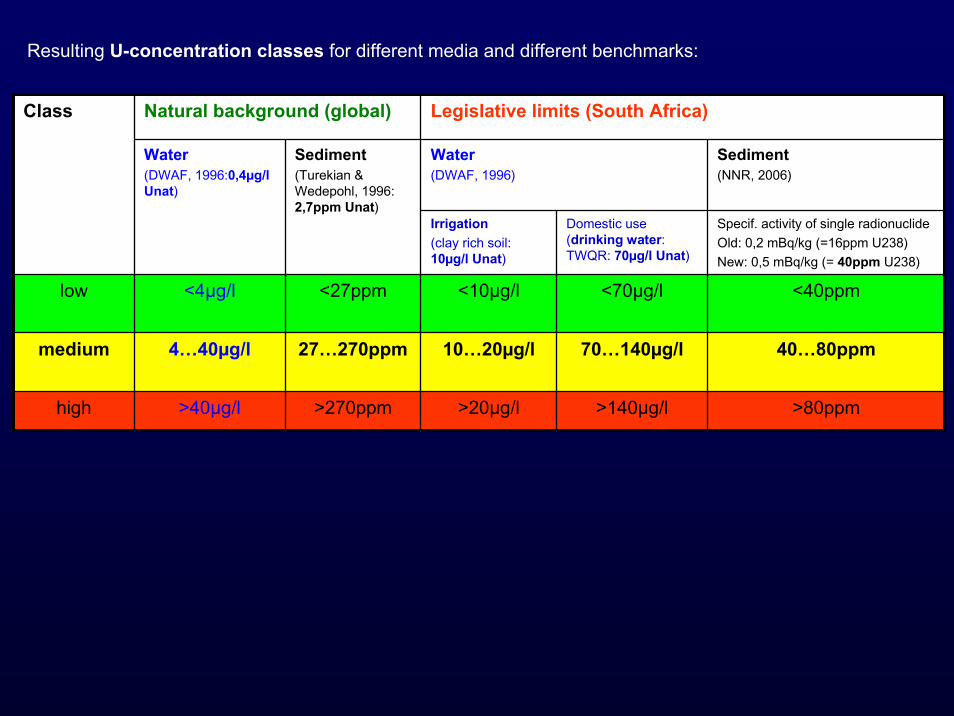
Quantifying risk factors – contin’d
b) Accessibility (20% factor weight)
- ease at which a polluted site can be accessed by members of the general public- Public areas are generally assumed to be more accessible than e.g. (fenced) private properties such as farms, mine areas etc., - however, features on private land are commonly also easily accessible to the owners and residents - private properties which are not fenced or otherwise access-controlled are regarded as public space, even in cases where such access would be illegal- Features such as roads (tarred, dirt), informal pathways and other commuting routes intersecting canals, streams, dams increase accessibility - existence of natural barriers such as streams, large wetlands covered in dense and high vegetation decrease accessibility
Suggested scale:
low (1x):areas in large wetlands, remote fenced farms, other access-controlled private properties etc.
medium (2x): public areas river banks, wetlands, stream channels, canals, dams etc. accessed by nearby roads, informal pathways etc.
high (4x): areas designated to public use e.g. functioning as established recreational sites (Donaldson Dam, A. Bailey Nature Reserve, Kdp Game Reserves etc.)

Quantifying risk factors – contin’d
c) Access Probability (20% factor weight)
- indication how likely an identified site is to be visited by members of the public - it is assumed that the frequency of visits increases with population density of surrounding area - higher AP is assumed for sites which fulfil certain functions e.g.
dams and open water wetland attract people who like fishing, mine canals may attract people as source of clean water, decommissioned slime dams may serve as areas for driving 4x4s, quad bikes, motor bikes,
mountain bikes etc.)
Suggested scale:
low (1x): - remote areas well away from larger settlements (>5km walking distance, >15km driving distance), andno special attraction (such as fishing, swimming etc.), andno of local residents <10
medium (2x): - areas in the vicinity of larger settlements (2-5km walking distance), orsome features of special attraction (such as fishing, swimming etc.), or10-30 local residents
high (4x):- areas next to larger settlements (<2km walking distance), orsite has special attraction (such as fishing, swimming etc.), or>30 local residents

Quantifying risk factors – continued
d) Usage probability (20% factor weight)
- some uses of polluted media are more common than otherse.g. using polluted water for irrigation is more common than using dam sediments as food supplement
(geophagy). ‘pica syndrom’. unintended ingestion of soil/ sediments/ tailings by children through hand to mouth contact
- uraniferous salt crust (animals by licking, children through hand to mouth activity) increased bioavailability sites may receive higher risk weight
- Using water from polluted streams or canals or dams for domestic purposes is more likely in informalsettlements than in areas with piped water supply
- Higher weight also applies if the land use relates to contaminated media e.g. farms using polluted water for irrigation, live stock watering or contaminated soil for grazing, crop production, gardening in floodplain, etc.
- readiness to use polluted media increases with decreasing access to alternative resources, inhabitants of informal settlements and other poverty-dominated areas are thought to be more likely to use
polluted media such as contaminated water than people who have access to regular water supply systems
children from informal settlements are also assumed to visit polluted sites more frequently than children who have access to supervised, designated playgrounds
exception: use of slimes dams for skate boarding, quad-biking, mountain biking etc. which is assumed to be a more dominant activity amongst rather affluent white teenagers.

Quantifying risk factors – contin’d
d) Usage probability (20% factor weight)
Suggested scale:
low (1x): - remote groundwater boreholes not used for domestic or agricultural purpose, - sediments in inaccessible areas such as large wetland with dense vegetation - sediments in sufficiently deep dams where no remobilisation occurs through normal activities (swimming, fishing….)
medium (2x): - boreholes used for domestic/ agric. purpose,- surface water (streams, dams, mine canals)- water used for fishing, swimming- sediments in shallow dams, floodplain soil at commercial farms, no nearby informal settlements
high (4x):- surface water in streams, dams, mine canals or - sediments in shallow dams, wetlands, floodplain soil in vicinity to townships/ informal settlements- areas with salt crusts- communal gardens in floodplain farming on contaminated site

Risk (HR)at individual
sampling site
U238-conc. water
Accessibility (20%)
Access probability
(20%)
Usageprobability
(20%)
Av.
U238-Ra226 ratio
Max.
Natural background
Legislative limits
medium: 1…2xexceedence factor
U238-conc.sediment
Max.
medium: 10…100xexceedence factor
Av.
Contamination level(40%)
Class factor: 1, 2 or 4Class factor: 1, 2 or 4
HR = 0,4CL + 0,2A + 0,2AP + 0,2UP
Exposure probability(60%)
Overview of risk assessment method

Site Sampling Lab/ U-238 concentrations total DoContamination level (CL) Exposure probability factors Health Risk (HR = 0,4CL Uav + 0,2A + 0,2AP + 0,2UP)
internal No in previous studies latitude longitude date anal. me Water [μg/l] Sediment [ppm] mSv/a Water based on av. U conc. Sediment and others (tailings, soil ...) Water Sediment Ra-226 Combined sed-water risk
no. name water body Study site no correspo 26°xx'xx'' 27°xx'xx'' n avU238/ Ra226
Ra226 [%U238 n av max
U238/ Ra2 Ra226 [%U238 Nat backgr. DWAF limits SA Nat backgr. NNR limit SA Accessability (A) Acc Prob.(AP) Usage Prob (UP) av. U-conc. av U-conc risk class based on:
(type) DWAF-st (= 1 : ratio) (= 1 : ratio) (0,4μg/l) 1 - low, 2- irrigation (10μg/l) domestic us(2,7ppm) class (16ppm) class ownership class nearest settlem class dominant land class low: <2 medium: 2-high: >3 low: <2 medium: 1-2 exceed. factor of U2 limits nat backgr incl. Ra-22C2H... exc. fact class exc. factclass exc. fac class exc. Facto1 - low, 2- medium, 4 - hig1 - low, 2- low:1 low:1 use of site water sedim C 16ppm 2,7ppm
(2) 4-40 exc. factor (2) 1-2 exc factor (2) 1-2 exc factor (2) 4-40 exc. Factor (2) 1-2 exc factor medium: 2 medium: 2 medium: 2 medium: 2 nat back irrig limidrink w nat backgNNR limit water sedimen70μg/l 0,4μg/lhigh: 4 high: 4 feature high: 4 high: 4 0,4μg/l 10μg/l 70μg/l 2ppm 16ppm medium: 1-2 medium: 1-2 medium risk: 2-3
1 Turk shaft upper WFS IQWS (1997) 1 152 08 23 46 00 7.1.-17.12 1997 NECSA 25 156 406 0,24 390 4 15,6 4 2 2 public 2 Kagiso/ Krug 4 natural stream 4 3,6 3,6 2,8 2,8 3,62 Rdfnt - Azaadv bridg upper WFS IQWS (1997) 2 153 09 52 46 02 7.1.-17.12 1997 NECSA 25 20 99 0,06 50 4 2,0 2 0,29 1 public 2 Kagiso 4 natural stream 4 3,6 2,8 2,4 2,4 3,63 R559 bridge upper WFS IQWS (1997) 3 154 15 57 41 58 7.1.-17.12 1997 NECSA 31 38 68 0,05 95 4 3,8 4 0,54 1 public 2 Kagiso 4 natural stream 4 3,6 3,6 2,4 2,4 3,64 inflow 1m pipe upper WFS IQWS (1997) 4 O25 17 18 40 09 7.1.-17.12 1997 NECSA 25 38 71 0,06 95 4 3,8 4 0,54 1 public 2 remote 2 natural stream 2 2,8 2,8 1,6 1,6 2,85 Vent GM pipe mine water IQWS (1997) 23 171 24 29 10 42 7.1.-17.12 1997 NECSA 28 21 52 0,08 52,5 4 2,1 4 0,30 1 private 1 remote 2 mining 2 2,6 2,6 1,4 1,4 2,66 end 1m pipe upper WFS IQWS (1997) 5 O80 19 35 24 38 7.1.-17.12 1997 NECSA 31 31 58 0,06 77,5 4 3,1 4 0,44 1 public 2 remote 2 mining 2 2,8 2,8 1,6 1,6 2,87 W-Dfnt canal mine water IQWS (1997) 7 O63 20 26 25 33 7.1.-17.12 1997 NECSA 31 126 360 0,16 315 4 12,6 4 1,80 2 public 4 Carletonv. 2 mining 4 3,6 3,6 2,8 2,8 3,68 CV- cemetary rd brdg mine water IQWS (1997) 7A 156 21 31 26 00 7.1.-17.12 1997 NECSA 31 217 607 0,27 542,5 4 21,7 4 3,10 4 public 4 Carletonv. 2 urban 4 3,6 3,6 3,6 3,6 3,69 Harry's Dam lower WFS IQWS (1997) 37 175 20 10 20 15 7.1.-17.12 1997 NECSA 17 60 100 0,08 150 4 6,0 4 0,86 1 private 2 Khutsong 2 live stock watering 4 3,2 3,2 2 2 3,210 A Bailey NR dirt rd brdge lower WFS IQWS (1997) 8 157 19 25 21 15 7.1.-17.12 1997 NECSA 31 61 222 0,08 152,5 4 6,1 4 0,87 1 public 4 Khutsong 4 recreation 4 4 4 2,8 2,8 411 Blyvoor can to Doornfnt mine water IQWS (1997) 10 158 23 15 22 24 7.1.-17.12 1997 NECSA 25 23 62 0,06 57,5 4 2,3 4 0,33 1 private 2 2 mining 4 3,2 3,2 2 2 3,212 Doornfnt Au plant disch mine water IQWS (1997) 11 159 22 31 20 12 7.1.-17.12 1997 NECSA 25 84 352 0,14 210 4 8,4 4 1,20 2 private 2 2 mining 4 3,2 3,2 2,4 2,4 3,213 Doornfnt #3 disch mine water IQWS (1997) 12 160 25 29 21 02 7.1.-17.12 1997 NECSA 23 369 2576 0,52 922,5 4 36,9 4 5,27 4 private 2 2 mining 4 3,2 3,2 3,2 3,2 3,214 WDL no 7SD Varkenslagte IQWS (1997) 15 163 26 06 20 22 7.1.-17.12 1997 NECSA 25 114 390 0,18 285 4 11,4 4 1,63 2 public 2 Wedela 4 mining 2 3,2 3,2 2,4 2,4 3,215 Nursery dam overflow Varkenslagte IQWS (1997) 16 164 26 44 20 40 7.1.-17.12 1997 NECSA 29 23 151 0,04 57,5 4 2,3 4 0,33 1 private 2 Wedela 4 gardening 2 3,2 3,2 2 2 3,216 Deelkr dam outfl Varkenslagte IQWS (1997) 17 165 27 18 19 05 7.1.-17.12 1997 NECSA 21 58 95 0,08 145 4 5,8 4 0,83 1 public 2 Wedela 4 recreation 4 3,6 3,6 2,4 2,4 3,617 Wvd C2H069 lower WFS IQWS (1997) 9 O69 22 32 13 51 7.1.-17.12 1997 NECSA 31 79 160 0,11 197,5 4 7,9 4 1,13 2 public 2 Khutsong 2 natural stream 4 3,2 3,2 2,4 2,4 3,218 Turff up eye spring IQWS (1997) 29 O13 24 29 10 42 7.1.-17.12 1997 NECSA 31 0,9 7 0,02 2,25 1 0,1 1 0,01 1 private 1 remote 2 live stock watering 4 1,8 1,8 1,8 1,8 1,819 Muiskraal bridge lower WFS IQWS (1997) 13 161 26 05 09 07 7.1.-17.12 1997 NECSA 25 19 104 0,04 47,5 4 1,9 2 0,27 1 public 2 remote 4 wetland 4 3,6 2,8 2,4 2,4 3,620 GMB eye spring IQWS (1997) 30 O11 28 37 09 09 7.1.-17.12 1997 NECSA 31 0,5 2 0,02 1,25 1 0,1 1 0,01 1 private 2 remote 2 wetland, peat minin 4 2 2 2 2 221 Bovenste eye spring IQWS (1997) 34 172 12 02 09 45 7.1.-17.12 1997 NECSA 29 0,8 9 0,02 2 1 0,1 1 0,01 1 public 2 remote 2 wetland, recreation 4 2 2 2 2 222 Boskop inflow bridge lower Mooi RiverIQWS (1997) 14 162 30 52 07 29 7.1.-17.12 1997 NECSA 31 3 10 0,02 7,5 2 0,3 1 0,04 1 public 4 oude dorp 2 water supply, recre 4 2,8 2,4 2,4 2,4 2,823 Bosk dam outflow lower Mooi RiverIQWS (1997) 35 173 39 37 05 09 7.1.-17.12 1997 NECSA 23 2 4 0,02 5 2 0,2 1 0,03 1 public 4 oude dorp 2 water supply, recre 4 2,8 2,4 2,4 2,4 2,824 Potch dam outlet lower Mooi RiverIQWS (1997) 36 174 39 42 05 11 7.1.-17.12 1997 NECSA 23 4 48 0,03 10 2 0,4 1 0,06 1 public 4 Potch/ Ikage 2 water supply, recre 4 2,8 2,4 2,4 2,4 2,825 BH Luipaardsvlei plot 40 gw IQWS (1997) 24 14 06 44 49 7.1.-17.12 1997 NECSA 20 0,7 2 0,03 1,75 1 0,1 1 0,01 1 private 2 Kagiso 1 irrigation 4 1,8 1,8 1,8 1,8 1,826 BH CV plot 9 gw IQWS (1997) 25 19 41 22 24 7.1.-17.12 1997 NECSA 20 0,8 6 0,03 2 1 0,1 1 0,01 1 private 2 Khutsong 1 irrigation 4 1,8 1,8 1,8 1,8 1,827 BH Wvd plot gw IQWS (1997) 26 22 13 19 38 7.1.-17.12 1997 NECSA 21 0,7 6 0,03 1,75 1 0,1 1 0,01 1 private 2 Khutsong 1 irrigation 4 1,8 1,8 1,8 1,8 1,828 BH Wvd munic gw IQWS (1997) 27 23 54 17 16 7.1.-17.12 1997 NECSA 27 0,9 6 0,02 2,25 1 0,1 1 0,01 1 private 2 Khutsong 1 irrigation 4 1,8 1,8 1,8 1,8 1,829 BH A Coetzee farm gw IQWS (1997) 28 23 03 12 40 7.1.-17.12 1997 NECSA 20 1,6 20 0,03 4 2 0,2 1 0,02 1 private 2 Khutsong 1 irrigation 4 2,2 1,8 1,8 1,8 2,230 Tudor Dam, south side, about 50 m dupper WFS BSA (2006) MP1 26,13175 27,79646 14.12.2006 IFR Rosse 1 2 806 2,9 96,9 299 4 50,4 4 public 4 Kagiso 4 playing 2 3,6 3,6 3,6 3,631 stream bottom 150 m downstream of upper WFS BSA (2006) MP2 26,13049 27,794941 14.12.2006 IFR Rosse 1 2 173 1,8 64 4 10,8 4 public 2 Kagiso 4 natural stream 2 3,2 3,2 3,2 3,232 upstream wetland Kagiso near Kagisoupper WFS BSA (2006) MP3 26,14065 27,76376 14.12.2006 IFR Rosse 1 23 1,1 1 56 4 2,3 4 0,3 1 public 2 Kagiso 4 wetland 2 3,2 3,2 2 1,2 1,2 2 3,233 downstream wetland Kagiso (at bridgupper WFS BSA (2006) MP4 26,4265311 27,76255 14.12.2006 IFR Rosse 1 177 27,5 1 444 4 17,7 4 2,5 4 public 2 Kagiso 4 playing 2 3,2 3,2 3,2 1,2 1,2 3,2 3,234 private garden Kagiso-SW near MP4 private garden BSA (2006) MP5 26,15517 27,76444 14.12.2006 IFR Rosse 1 1 2 0,9 1 1 0,1 1 private 2 Kagiso 4 gardening 4 2,4 2,4 2,4 2,435 stream below bridge R41 SE of Azaa tributary WFS BSA (2006) MP6 26,17779 27,76642 14.12.2006 IFR Rosse 1 9 8,5 1 11 2,3 22 2 0,9 1 0,1 1 4 2 0,7 1 public 4 Kagiso 4 natural stream 2 2 2,8 2,4 2,4 2,8 2,4 2,8 2,836 furrow downstream discharge of Sewcanal? BSA (2006) MP7 26,18376 27,76542 14.12.2006 IFR Rosse 1 4 1,0 1 2 1,1 10 2 0,4 1 0,1 1 1 1 0,1 1 public 2 Kagiso 2 fishing 4 2 2,4 2 2 1,6 1,6 2 2,437 Attenuation Dam, east side BSA (2006) MP8 26,21348 27,74201 15.12.2006 IFR Rosse 1 14 2,0 1 2 0,3 2 34 2 1,4 2 0,2 1 1 1 0,2 1 public 2 Kagiso 2 fishing 4 2 2,4 2,4 2 1,6 1,6 2 2,438 Attenuation Dam, west side, dischargupper WFS BSA (2006) MP9 26,92621471 27,73874 15.12.2006 IFR Rosse 1 10 2,7 1 23 0,8 121% 3,5 24 2 1,0 2 0,1 1 9 2 1,5 2 public 2 Kagiso 2 irrigat., live stock 4 2 2,4 2,4 2 2 2,0 1,2 2 2,439 small dam of van Greuning's farm ne farm dam BSA (2006) MP10 26,24156 27,73376 15.12.2006 IFR Rosse 1 47 1,2 1 15 1,2 10,8 117 4 4,7 4 0,7 1 6 2 1,0 2 private 2 Kagiso 2 irrigat., live stock 4 2 3,2 3,2 2 2 2,0 2 3,240 mine water pipe from Randfontein Esmine water BSA (2006) MP11 26,24152 27,73486 15.12.2006 IFR Rosse 1 460 11,0 1 20,7 1149 4 46,0 4 6,6 4 public 2 Beckersdal 2 irrigat. 4 3,2 3,2 3,2 3,2 3,241 Donaldson Bridge on road R559 upper WFS BSA (2006) MP12 26,26571 27,6908 15.12.2006 IFR Rosse 1 74 92,0 1 185 4 7,4 4 1,1 2 public 4 Beckersdal 4 recreation, fishing 4 4 4 3,2 3,2 442 Donaldson Dam northern part, fishingupper WFS BSA (2006) MP13 26,27256 27,69086 15.12.2006 IFR Rosse 1 58 24,0 1 18 6,7 2,4 145 4 5,8 4 0,8 1 7 2 1,1 2 public 4 Beckersdal 4 recreation, fishing 4 2 4 4 2,8 2,8 2,8 2,8 443 Donaldson Dam southern part, carav upper WFS BSA (2006) MP14 26,28267 27,68435 16.12.2006 IFR Rosse 1 61 76,0 1 2 153 4 6,1 4 0,9 1 public 4 Beckersdal 4 recreation, fishing 4 4 4 2,8 2,8 444 Boskop Dam (east side, near to statiolower Mooi Rive BSA (2006) MP15 26,56733 27,12004 16.12.2006 IFR Rosse 1 2 2,5 1 4 1,1 4 2 0,2 1 0,0 1 1 1 0,2 1 public 4 Beckersdal 4 recreation, fishing 4 2 3,2 2,8 2,8 2,4 2,4 2,8 3,245 wetland Muiskraal at culvert that cros lower WFS BSA (2006) MP16 26,43647 27,15119 16.12.2006 IFR Rosse 1 2 6,0 1 6 2 0,2 1 0,0 1 public 4 remote 2 wetland 2 2,4 2 2 2 2,446 Klerkskraal Dam, east side upper Mooi RiveBSA (2006) MP17 26,24425 27,1584 16.12.2006 IFR Rosse 1 3 6,7 1 8 2 0,3 1 0,0 1 public 4 remote 2 irrigation, fishing 4 2,8 2,4 2,4 2,4 2,847 runoff/seepage collection pond at slimmine water BSA (2006) MP18 26,38355 27,32476 16.12.2006 IFR Rosse 1 1 10 0,2 583% 4 2 0,6 1 public 4 Khutsong 2 drinking 4 2 2,4 2,0 4,0 2,4 2,4 4,048 stormwater canal from slime dam Blymine water BSA (2006) MP19 26,38463 27,36123 16.12.2006 IFR Rosse 1 1 77 0,5 199% 1,4 29 2 4,8 4 public 4 Khutsong 2 drinking 4 2 2,4 3,2 4,0 3,2 2,4 4,049 mine water from Doornfontein shaft amine water BSA (2006) MP20 26,42296 27,35486 17.12.2006 IFR Rosse 1 73 1,8 1 63 0,4 224% 143 181 4 7,3 4 1,0 2 23 2 3,9 4 public 4 Khutsong 2 drinking 4 2 3,6 3,6 2,8 2,4 3,2 4,0 3,2 3,6 4,050 dam NW from Elandsrand GM Varkenslagte BSA (2006) MP21 26,44754 27,34733 17.12.2006 IFR Rosse 1 42 23,6 1 15 1,1 3 105 4 4,2 4 0,6 1 5 2 0,9 1 public 4 Wedela 2 gardening 4 4 3,6 3,6 2,4 2,8 2,4 2,8 3,651 canal from Blyvooruitzicht GM, bridgemine water BSA (2006) MP22 26,38684 27,28866 17.12.2006 IFR Rosse 1 169 6,8 1 8,8 423 4 16,9 4 2,4 4 public 4 Khutsong 2 live stock watering 4 3,6 3,6 3,6 3,6 3,652 canal from West-Driefontein GM (frommine water BSA (2006) MP23 26,35765 27,43317 17.12.2006 IFR Rosse 1 54 10,8 1 2,5 135 4 5,4 4 0,8 1 public 4 Khutsong 2 live stock watering 4 3,6 3,6 2,4 2,4 3,653 canal from West-Driefontein GM (frommine water BSA (2006) MP24 26,35619 27,4329 17.12.2006 IFR Rosse 1 89 12,2 1 3,6 222 4 8,9 4 1,3 2 public 4 Khutsong 2 live stock watering 4 3,6 3,6 2,8 2,8 3,654 storage/sedimentation ponds E of Camine water BSA (2006) MP25 26,35434 27,43215 17.12.2006 IFR Rosse 1 105 16,9 1 121 2,3 7,1 262 4 10,5 4 1,5 2 45 4 7,6 4 public 4 Khutsong 2 recreation, fishing 4 2 3,6 3,6 2,8 3,2 3,2 3,2 3,655 canal from West-Driefontein GM mine water BSA (2006) MP26 26,34106 27,42544 18.12.2006 IFR Rosse 1 93 13,4 1 3,7 232 4 9,3 4 1,3 2 public 4 Khutsong 2 mining canal 4 3,6 3,6 2,8 2,8 3,656 end of 1 m pipeline, discharge into th lower WFS BSA (2006) MP27 26,32812 27,40715 18.12.2006 IFR Rosse 1 19 40,0 1 48 4 1,9 2 0,3 1 public 4 Khutsong 2 drinking 4 3,6 2,8 2,4 2,4 3,657 canal from Driefontein GM about 300 mine water BSA (2006) MP28 26,32758 27,40437 18.12.2006 IFR Rosse 1 102 14,0 1 3,9 254 4 10,2 4 1,5 2 public 4 Khutsong 2 drinking 4 3,6 3,6 2,8 2,8 3,658 Harry's Dam, upstream part lower WFS BSA (2006) MP29 26,31778 27,39096 18.12.2006 IFR Rosse 1 65 21,1 1 69 2,6 5,9 161 4 6,5 4 0,9 1 25 2 4,3 4 private 4 Khutsong 2 live stock, water bir 4 2 3,6 3,6 2,4 2,4 3,2 3,2 3,659 Harry's Dam, downstream (after cros lower WFS BSA (2006) MP30 26,31732 27,38782 18.12.2006 IFR Rosse 1 69 30,4 1 145 1,1 20 171 4 6,9 4 1,0 2 54 4 9,1 4 public 4 Khutsong 2 live stock, water bir 4 2 3,6 3,6 2,8 3,2 3,2 3,2 3,660 canal from Driefontein north of Harry' mine water BSA (2006) MP31 26,31573 27,39045 18.12.2006 IFR Rosse 1 113 14,7 1 4,4 282 4 11,3 4 1,6 2 public 4 Khutsong 2 canal 4 3,6 3,6 2,8 2,8 3,661 former riverbed of Wonderfonteinsprudry upper WFS BSA (2006) MP32 26,31151 27,4505 19.12.2006 IFR Rosse 1 1 10 0,6 12,6 4 2 0,6 1 public 4 Khutsong 2 grazing 2 2,4 2,0 2,4 2,462 former riverbed of Wonderfonteinsprudry upper WFS BSA (2006) MP33 26,31833 27,42223 19.12.2006 IFR Rosse 1 1 2 1,0 1,1 1 1 0,1 1 public 4 Khutsong 2 grazing 2 2 2,0 2 263 Water Edge Bridge Plot 68 (Paul Mat Green belt - minBSA (2006) MP34 26,32703 27,36884 19.12.2006 IFR Rosse 1 3 1,5 5 97 2,2 47,5 8 4 0,3 1 0,0 1 36 2 6,0 4 private 4 Khutsong 4 irrig, gardening 4 2 4 2,8 2,8 2,8 3,6 3,6 464 Water Edge, bridge near Agricultural Green belt - minBSA (2006) MP35 26,3374 27,3734 19.12.2006 IFR Rosse 1 1 105 0,4 285% 68,5 39 2 6,6 4 private 4 Khutsong 4 irrig, gardening 2 2,8 3,6 4,0 3,6 2,8 65 Padda Dam (western bank) lower WFS BSA (2006) MP36 26,33706 27,33899 19.12.2006 IFR Rosse 1 48 36,9 1 22 7,1 2 119 4 4,8 4 0,7 1 8 2 1,4 2 public 4 Khutsong 4 recreat, fishing 4 2 4 4 2,8 2,8 2,8 2,8 466 furrow at Khutsong bridge lower WFS BSA (2006) MP37 26,33779 27,3292 19.12.2006 IFR Rosse 1 45 31,1 1 18 2,0 2,1 113 4 4,5 4 0,6 1 7 2 1,1 2 public 4 Khutsong 4 gardening 4 4 4 4 2,8 3,2 3,2 3,2 467 bridge of R501 at Blyvooruitzicht GM mine water BSA (2006) MP38 26,37746 27,39347 20.12.2006 IFR Rosse 1 16 0,4 270% 1 121 0,4 253% 548 40 2 1,6 2 0,2 1 45 4 7,6 4 public 4 Khutsong 4 playing 2 4 2,8 2,8 2,4 4 4,0 4,0 4,0 4 4 4,068 canal crossing R501 at Blyvooruitzichmine water BSA (2006) MP39 26,37694 27,39441 20.12.2006 IFR Rosse 1 58 7,5 1 2,9 145 4 5,8 4 0,8 1 public 4 Khutsong 4 playing 2 3,6 3,6 2,4 2,4 3,669 Doornfontein canal from Blyvooruitzicmine water BSA (2006) MP40 26,37235 27,2542 20.12.2006 IFR Rosse 1 89 8,1 1 4,2 222 4 8,9 4 1,3 2 public 4 Khutsong 4 playing 2 3,6 3,6 2,8 2,8 3,670 upstream the wetland upstream of Colower WFS BSA (2006) MP41 26,3713 27,25718 20.12.2006 IFR Rosse 1 23 17,5 1 29 9,0 1,3 56 4 2,3 4 0,3 1 11 2 1,8 2 public 4 Khutsong 2 drinking, live stock 4 2 3,6 3,6 2,4 2,4 2,4 2,4 3,671 weir DWAF flow gauging station C2Hlower WFS BSA (2006) MP42 26,37031 27,24817 20.12.2006 IFR Rosse 1 21 3,4 1 109 1,7 9 52 4 2,1 4 0,3 1 40 2 6,8 4 public 4 Khutsong 2 drinking, live stock 4 2 3,6 3,6 2,4 2,4 3,2 3,2 3,672 Coetzee Dam (upstream part, stagnalower WFS BSA (2006) MP43 26,37035 27,24096 20.12.2006 IFR Rosse 1 9 2,6 1 565 3,7 15,4 22 2 0,9 1 0,1 1 209 4 35,3 4 private 4 20 residents 2 irrig, live stock 4 2 2,8 2,4 2,4 3,2 3,2 3,2 3,273 wall of Coetzee Dam (near overflow t lower WFS BSA (2006) MP44 26,37308 27,2367 20.12.2006 IFR Rosse 1 84 22,6 1 3,4 210 4 8,4 4 1,2 2 private 4 20 residents 2 irrig, live stock 4 3,6 3,6 2,8 2,8 3,674 Visser Dam (southern bank) lower WFS BSA (2006) MP45 26,263817 27,22507 20.12.2006 IFR Rosse 1 105 19,1 1 21 1,9 5 262 4 10,5 4 1,5 2 8 2 1,3 2 private 4 20 residents 2 irrig, live stock 4 2 3,6 3,6 2,8 2,4 2,4 2,8 3,675 former wetland downstream of Lancaupper WFS BSA (2006) MP46 26,13119 27,77614 21.12.2006 IFR Rosse 1 1 19 0,4 257% 25,8 7 2 1,2 2 public 4 Randfntn 2 playing 2 2 2,4 2,4 4,0 2,4 2,4 4,076 abandoned dam in Rietvalei (SE of R tributary upper WBSA (2006) MP47 26,18673 27,72115 21.12.2006 IFR Rosse 1 419 7,2 1 22,9 1048 4 41,9 4 6,0 4 public 4 Randfntn 4 playing 2 3,6 3,6 3,6 3,6 3,677 C2H060 Doornfnt canal mine water WRC 1214 (2 W1 26,370668 27,252314 23.05.2001 CGS-semiqua 1 215 80 4 13,4 4 public 2 Khutsong 2 playing 2 2,8 2,8 2,8 2,878 C2H069 Wvd lower WFS WRC 1214 (2 W2 26,370014 27,249376 23.05.2001 CGS-semiqua 1 334 124 4 20,9 4 public 2 Khutsong 2 natural stream 2 2,8 2,8 2,8 2,879 AC Dam lower WFS WRC 1214 (2 W3-6/ 26,36973 27,241581 23.05.2001 CGS-semiqua 11 272 925 101 4 17,0 4 private 2 Khutsong 2 live stock, salt crusts 4 3,2 3,2 3,2 3,280 Floodpl CV-Rdfnt rd lower WFS WRC 1214 (2 W7 26,310838 27,531313 23.05.2001 CGS-semiqua 1 123 46 4 7,7 4 public 4 Khutsong 4 natural stream 2 3,6 3,6 3,6 3,681 R559 bridge upper WFS WRC 1214 (2 W8 26,266585 27,700986 23.05.2001 CGS-semiqua 2 448 570 166 4 28,0 4 public 4 Toekomsrus 4 natural stream 2 3,6 3,6 3,6 3,682 Muiskraal bridge lower WFS WRC 1214 (2 W103 26,436383 27,151433 15.08.2001 CGS-semiqua 2 0 0 0 1 0,0 1 public 2 remote 2 wetland 2 1,6 1,6 1,6 1,683 Klerkskraal Dam upper Mooi RiveWRC 1214 (2 W105 26,225167 27,151667 15.08.2001 CGS-semiqua 1 0 0 1 0,0 1 public 2 remote 2 irrig dam, recreation 2 1,6 1,6 1,6 1,684 below SW Khutsong lower WFS WRC 1214 (2 W106 26,350039 27,313169 15.08.2001 CGS-semiqua 1 542 201 4 33,9 4 public 4 Khutsong 4 natural stream 2 3,6 3,6 3,6 3,685 below Carletonville lower WFS WRC 1214 (2 W107 26,314939 27,382778 15.08.2001 CGS-semiqua 1 578 214 4 36,1 4 public 4 Khutsong 4 natural stream 2 3,6 3,6 3,6 3,686 Attenuation Dam upper WFS WRC 1214 (2 W108 26,213355 27,7421 15.08.2001 CGS-semiqua 1 32 12 2 2,0 2 public 2 Kagiso 4 playing, fishing 2 2,4 2,4 2,4 2,487 below Kagiso upper WFS WRC 1214 (2 W109 26,156356 27,765394 15.08.2001 CGS-semiqua 1 245 91 4 15,3 4 public 2 Kagiso 4 natural stream 2 3,2 3,2 3,2 3,2
Risk calculation matrix

Number of high risk class sites of U pollution for different benchmark methods comparing calculations based on U-maxima vs. those based on U-averages (water and sediment; total sampl. sites: 100)
10
nat back irrig limit drink w limit nat backgr NNR limit limits nat background
Water (n=73) Sediment (n = 54) Comb. sed-water (n=99)
Risk benchmark type
0
10
20
30
40
50
60
70
Nr.
of
sam
plin
g s
ites
in h
igh
ris
k c
lass
46
61
31
18
13
51
Uav
5249
20
10
18
38
62
Umax
Number of high risk class sites resulting from employing:
a) different benchmark types (natur. background vs. legisl. limits) and
b) different U-data (max. vs. mean)
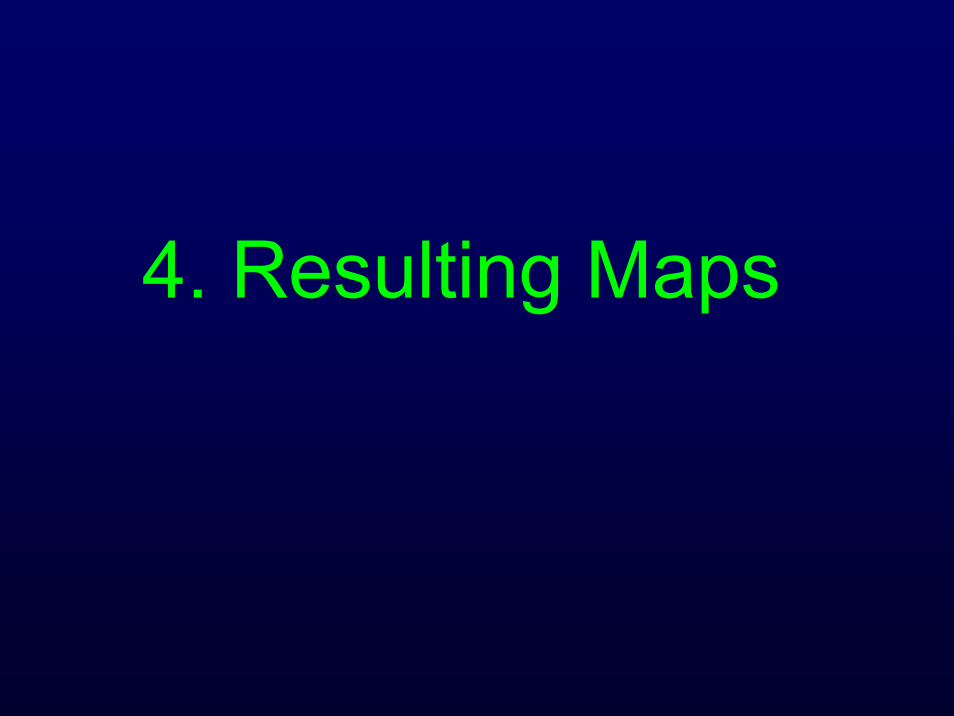
4. Resulting Maps


3
3
0
0
2
4
2
2
2
0
23
14
7770
40
21
19
21
29
18 22
97
1069
15
63
7710
18
15
23
11
264163
578
542
570
123
565 109121
105
121
173
806
448
272
³0 5 10 15 202,5
Kilometers
Uranium contamination in the Wonderfonteinspruit catchmentMap 4: U238 concentration [ppm] in sediment samples
© Winde (2008)
Legend
BSA (2006)
IWQS (1997)
WRC 1214 (2001)
U Sed - averageAverage value (italic)
Max value
Max value
Max value
257%
253%
285%
224%
199%583%
121%
270%
³0 5 10 15 202,5
Kilometers
Uranium contamination in the Wonderfonteinspruit catchmentMap 7: Radium 226 in sediment and water samples [% mBq/kg of U238]
© Winde (2008)
Legend
Ra-226 in sediment
Ra-226 in water
Percentage
Percentage
9
3
3
2
2
49
6
6
6
2
4
9
2
7
84
23
895816
45 48
69 65
19 93
89
54
42
73
61
5874
47
1014
23
20
48
10
95
62
58
52
71
68
99
111
243
252
199
419
105
105
169
460
177
104
151
390
352
222
100
607
360
406
2576
³0 5 10 15 202,5
Kilometers
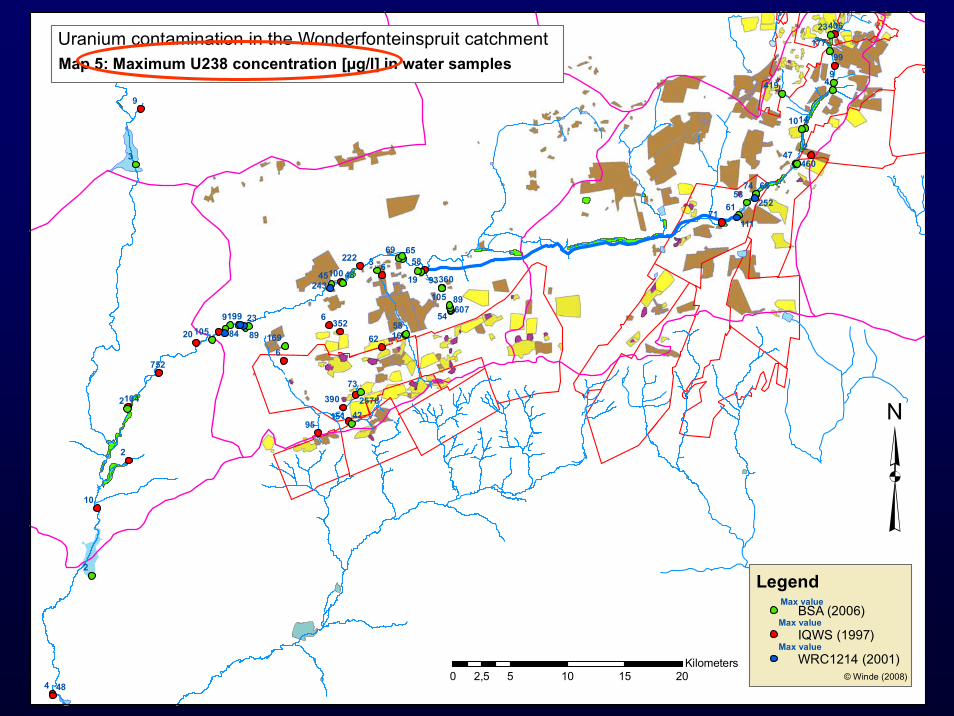
Uranium contamination in the Wonderfonteinspruit catchmentMap 5: Maximum U238 concentration [μg/l] in water samples
© Winde (2008)
Legend
BSA (2006)
IQWS (1997)
WRC1214 (2001)
Max value
Max value
Max value

93
92
88
87
85
84
81
80
7972 67
64
63 59
54
31
30
8
7
1
99
98
91
77
76
51
41
40
33
17
15
14
13
12
10
100
³0 5 10 15 202,5
Kilometers
Uranium contamination in the Wonderfonteinspruit catchmentMap 17: Hot spots based on maximum values (water and sediment)
© Winde (2008)
Internal nr.
Internal nr.
Legend
Sediment hot spots
Water drink hot spots
High risk (sed >2 x NNR limit)
High risk (>2 x DWAF drink water limit)

Spatial representativity: Nr. of sampling sites
28
96 5
8
23
17
1 0
5
47
23
17
0
7
0
5
10
15
20
25
30
35
40
45
50
in WFS-catchment
WFS-stream mine canals groundwater other
nr of sites
IWQS (1999)
WRC 1214 (2005)
BSA (2007)

Representativity: Nr. of samples
770 755
0 1541
635
0
10047 53
00
100
200
300
400
500
600
700
800
900
total water sediment other
nr of samples
IWQS (1999)
WRC 1214 (2005)
BSA (2007)

Measured U-maxima
2576
406258 258
925 925
460
177
806 806
0
500
1000
1500
2000
2500
3000
absol. WFS absol. WFS
water [ppb] sed. [ppm]
IWQS (1999)
WRC 1214 (2005)
BSA (2007)

Identified 'hot spots'
7
2
5
0
1413
10
25
9
14
2
0
5
10
15
20
25
30
nr. nr
absol. WFS mine sites others
IWQS (1999)
WRC 1214 (2005)
BSA (2007)

Risk
1,15
3,7
23
138 138
1
10
100
1000
[mSv/a] factor
max. Dose max. limit exceedance
IWQS (1999)
WRC 1214 (2005)
BSA (2007)
NN
R:
1mS
v/a
NN
R:
40pp
m
DWAF: 70ppb

6. Limitations of map
1. Data base is not exhaustiveonly 3 out of min. 35 relevant studies containing U-data of WFS catchment secondary data only, quality issuesonly hard data used, anecdotal and circumstantial evidence ignored (news papers, NGO...)
2. Limited spatial representativity of used datamost studies concenrtaed on sites which preceeding vios studies found polluted (AC dam, Tudor dam...)choice of sampling sites also influenced by accessability rather than process understandingother polluted sites are ignored (e.g. Lower dams, decant area WB, tailings spills, ... )particular of stream based on secondary datapoint data onlylocal experince/ expert advice needed
3. Limited temporal representativity of used data- esp. problematic with water (infrequent grab samples): highly dynamic, less so at sediments
e.g. current U-levels upper WFS are partly significantly higher than in IWQS (1999)
4. No biological data usedavailable U-data on food chain elements ignored: soil, vegetables, milk, fish, poultry...needed to verify risk assessment results based on modelling and transfer factorsno systematic gathering of available epedemiological evidence/ data of area or issuelatest: cancer association made newspaper claim on possible dangers
5. Point data approach ignores process responsible- To address cause of pollution and avoid re-contamination of remediated sites comprehensive understanding of responsible process is needed: e.g.
U-sources pathways transport mechanisms

6. Limitations of map
6. Risk determination influenced by benchmark choice and factor weights system allows for easy changes (transparancy) can be adjusted to suit different needs/ perceptions/ purposes
7. Other pathways of miningborne U-related health risk ignoredtailings dust Rd exhalation (living on slimes dams)use of tailings as building materialmine service water (underground workers, farmers)