WOMEN, INEQUALITY & THE FUTURE OF...
11
10/20/2014 1 10.22.14 MANUEL PASTOR WOMEN, INEQUALITY & THE FUTURE OF CALIFORNIA @Prof_MPastor
Transcript of WOMEN, INEQUALITY & THE FUTURE OF...

10/20/2014
1
10.22.14 MANUEL PASTOR
WOMEN, INEQUALITY & THE FUTURE OF CALIFORNIA
@Prof_MPastor

10/20/2014
2
67%57%
47%40% 37% 34% 32%
8%
7%
6%
6%6%
5%5%
19%
26%
32%38%
41% 43% 45%
5% 9%11% 13% 14% 14% 14%
3% 3% 3% 3% 3%
0%
10%
20%
30%
40%
50%
60%
70%
80%
90%
100%
1980 1990 2000 2010 2020 2030 2040
Changing DemographicsCalifornia, 1980‐2040
Other
Native American
Asian/PacificIslander
Latino
Black
White

10/20/2014
3

10/20/2014
4
Latina Women, $9
White Men, $40
$5
$10
$15
$20
$25
$30
$35
$40
Less than aHS Diploma
HS Diploma,no College
More than HS Diploma butless than BA Degree
BA Degreeor higher
Median Hourly Wage by Education LevelCalifornia, 2006-2010
White Women
Black Women
Latina Women
Asian/Pacific Islander Women
White Men
Black Men
Latino Men
Asian/Pacific Islander Men
Full‐time Wage & Salary Workers Only (Ages 25‐64)

10/20/2014
5
Poverty Statistics – Female-headed HouseholdsCalifornia, 2006-2010
Total Percent below poverty level
Total Percent below poverty level
Total Percent below poverty level
8,495,322 10.2% 6,166,334 6.1% 1,615,112 24.6%4,629,191 15.1% 3,169,964 8.7% 1,058,722 32.8%
8,301,406 10.2% 6,037,918 6.1% 1,566,914 24.6%5,447,834 8.2% 4,141,406 5.0% 899,165 21.9%
503,157 16.7% 229,409 5.4% 218,457 28.4%66,475 16.7% 41,170 9.6% 17,534 32.2%
1,122,706 7.8% 885,041 5.9% 158,382 17.0%30,307 10.2% 21,180 6.7% 6,037 20.5%
1,130,927 18.7% 719,712 12.9% 267,339 34.8%193,916 10.9% 128,416 5.6% 48,198 23.8%
2,714,013 17.8% 1,770,229 12.4% 629,741 33.5%3,967,947 4.9% 3,155,984 2.7% 564,229 15.4%
6,433,849 7.5% 4,683,715 4.5% 1,157,167 18.1%4,363,296 3.7% 3,247,226 2.7% 702,875 7.5%
1,529,745 24.5% 989,949 18.2% 363,537 42.7%1,634,668 13.0% 1,084,010 7.7% 372,323 27.6%2,625,401 7.8% 1,835,196 3.7% 574,311 20.0%2,705,508 2.8% 2,257,179 2.0% 304,941 8.1%
3,866,131 4.4% 2,996,370 3.3% 556,390 9.0%3,589,930 11.8% 2,430,181 6.1% 834,838 27.1%
942,181 24.7% 675,348 16.0% 198,676 52.2%97,080 42.4% 64,435 31.7% 25,208 68.4%
CaliforniaAll families Married-couple families Female householder, no husband
RACE AND HISPANIC OR LATINO ORIGIN Families with a householder who is--
Famil iesWith related children under 18 years
American Indian and Alaska Native Asian Native Hawaiian and Other Pacific Islander
One race White Black or African American
Hispanic or Latino origin (of any race)White alone, not Hispanic or Latino
Some other race Two or more races
Less than high school graduate High school graduate (includes equivalency) Some college, associate's degree
EDUCATIONAL ATTAINMENT OF HOUSEHOLDER
Householder workedHouseholder worked full-time, year-round
5 or more children
No child 1 or 2 children 3 or 4 children
Bachelor's degree or higher
NUMBER OF RELATED CHILDREN UNDER 18 YEARS
Poverty Statistics – Female-headed HouseholdsCalifornia, 2006-2010
• Percentage of children below poverty line:
• Share of children in poverty living in FHH:
• Share of children living in FHH:
• Share of children living in MC below poverty line:
• Share of children living in FHH below poverty line:
• MC = married-couple household; FHH = female-headed household• Note: Rates have only increased post- Great Recession
19%
47%
22%
11%
40%

10/20/2014
6

10/20/2014
7
10/20/2014
8
Source: U.S. Census Bureau. Notes: Areas in white are missing data.
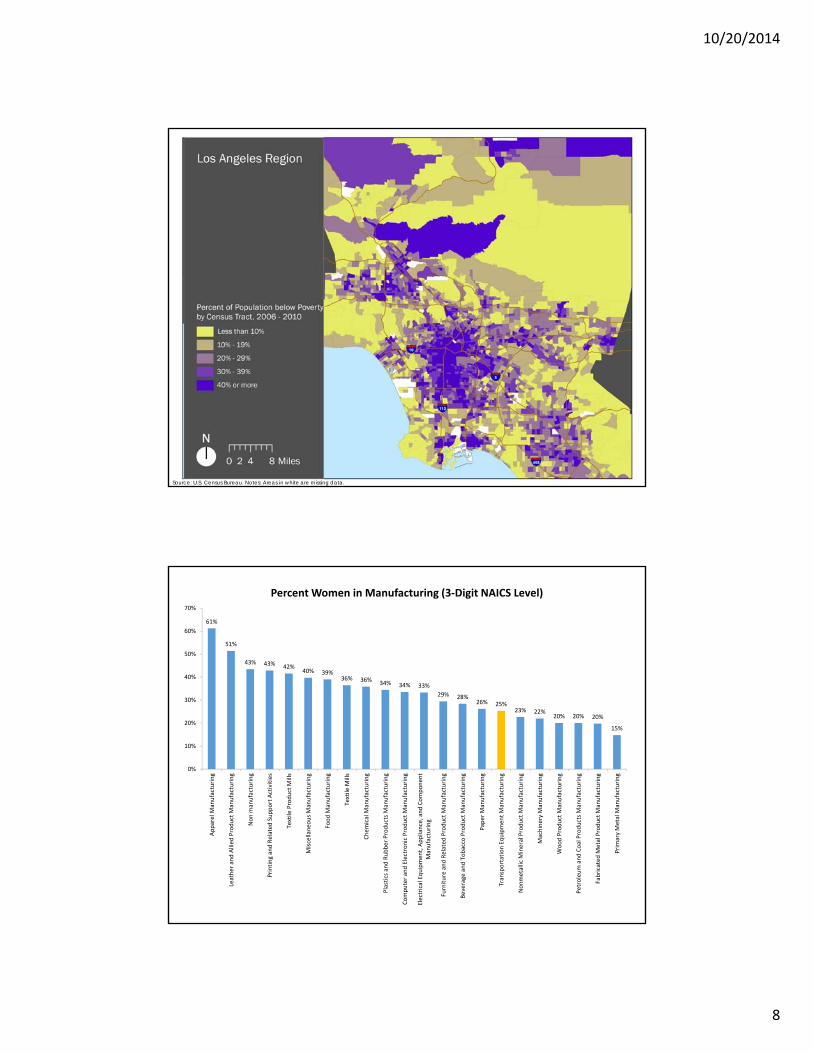
61%
51%
43% 43% 42%40% 39%
36% 36% 34% 34% 33%
29% 28%26% 25%
23% 22%20% 20% 20%
15%
0%
10%
20%
30%
40%
50%
60%
70%
Apparel M
anufacturing
Leather and Allied Product M
anufacturing
Non m
anufacturing
Printing and Related Support Activities
Textile Product M
ills
Miscellaneo
us Manufacturing
Food M
anufacturing
Textile M
ills
Chemical M
anufacturing
Plastics and Rubber Products Manufacturing
Computer and Electronic Product M
anufacturing
Electrical Equipmen
t, Appliance, and Component
Manufacturing
Furniture and Related Product M
anufacturing
Beverage
and Tobacco Product M
anufacturing
Paper M
anufacturing
Transportation Equipmen
t Manufacturing
Nonmetallic Mineral Product M
anufacturing
Machinery M
anufacturing
Wood Product M
anufacturing
Petroleum and Coal Products Manufacturing
Fabricated M
etal Product M
anufacturing
Primary Metal M
anufacturing
Percent Women in Manufacturing (3‐Digit NAICS Level)

10/20/2014
9
Employment and Median Earnings of Women, by Industry, 2008‐2012

10/20/2014
10
Percent Women in Manufacturing and Non‐Manufacturing, 2012
• Address gender bias in male-centric industries (such as manufacturing)
• Promote workplace flexibility, workplace sponsorship, and personal development
• Encourage greater inclusion of women within STEM programs and careers – diversify higher education achievement
Reducing the Gender Wage Gap
* http://www.nwlc.org/resource/fair‐pay‐women‐requires‐increasing‐minimum‐wage‐and‐tipped‐minimum‐wage

10/20/2014
11
• Raise the minimum wage- a disproportionate share of women work minimum wage jobs*
• Facilitate unionization: pathway to reducing the wage gap
• Support single mothers completing community college
• Protect immigrant rights, including administrative relief
Reducing the Gender Wage Gap
* http://www.nwlc.org/resource/fair‐pay‐women‐requires‐increasing‐minimum‐wage‐and‐tipped‐minimum‐wage