Women in Science, Technology, Engineering, and Mathematics ...
76
San Jose State University San Jose State University SJSU ScholarWorks SJSU ScholarWorks Master's Theses Master's Theses and Graduate Research Summer 2013 Women in Science, Technology, Engineering, and Mathematics Women in Science, Technology, Engineering, and Mathematics (STEM) Fields: The Importance of the Need to Belong and Self- (STEM) Fields: The Importance of the Need to Belong and Self- Esteem on the Intention to Leave a Job Esteem on the Intention to Leave a Job Jung Eun Lee San Jose State University Follow this and additional works at: https://scholarworks.sjsu.edu/etd_theses Recommended Citation Recommended Citation Lee, Jung Eun, "Women in Science, Technology, Engineering, and Mathematics (STEM) Fields: The Importance of the Need to Belong and Self-Esteem on the Intention to Leave a Job" (2013). Master's Theses. 4348. DOI: https://doi.org/10.31979/etd.5hxr-h4jn https://scholarworks.sjsu.edu/etd_theses/4348 This Thesis is brought to you for free and open access by the Master's Theses and Graduate Research at SJSU ScholarWorks. It has been accepted for inclusion in Master's Theses by an authorized administrator of SJSU ScholarWorks. For more information, please contact [email protected].
Transcript of Women in Science, Technology, Engineering, and Mathematics ...

San Jose State University San Jose State University
SJSU ScholarWorks SJSU ScholarWorks
Master's Theses Master's Theses and Graduate Research
Summer 2013
Women in Science, Technology, Engineering, and Mathematics Women in Science, Technology, Engineering, and Mathematics
(STEM) Fields: The Importance of the Need to Belong and Self-(STEM) Fields: The Importance of the Need to Belong and Self-
Esteem on the Intention to Leave a Job Esteem on the Intention to Leave a Job
Jung Eun Lee San Jose State University
Follow this and additional works at: https://scholarworks.sjsu.edu/etd_theses
Recommended Citation Recommended Citation Lee, Jung Eun, "Women in Science, Technology, Engineering, and Mathematics (STEM) Fields: The Importance of the Need to Belong and Self-Esteem on the Intention to Leave a Job" (2013). Master's Theses. 4348. DOI: https://doi.org/10.31979/etd.5hxr-h4jn https://scholarworks.sjsu.edu/etd_theses/4348
This Thesis is brought to you for free and open access by the Master's Theses and Graduate Research at SJSU ScholarWorks. It has been accepted for inclusion in Master's Theses by an authorized administrator of SJSU ScholarWorks. For more information, please contact [email protected].
WOMEN IN SCIENCE, TECHNOLOGY, ENGINEERING, AND MATHEMATICS
(STEM) FIELDS: THE IMPORTANCE OF THE NEED TO BELONG
AND SELF-ESTEEM ON THE INTENTION TO LEAVE A JOB
A Thesis
Presented to
The Faculty of the Department of Psychology
San José State University
In Partial Fulfillment
of the Requirements for the Degree
Master of Arts
by
Jung Eun Lee
August 2013

© 2013
Jung Eun Lee
ALL RIGHTS RESERVED

The Designated Thesis Committee Approves the Thesis Titled
WOMEN IN SCIENCE, TECHNOLOGY, ENGINEERING, AND MATHEMATICS
(STEM) FIELDS: THE IMPORTANCE OF THE NEED TO BELONG
AND SELF-ESTEEM ON THE INTENTION TO LEAVE A JOB
by
Jung Eun Lee
APPROVED FOR THE DEPARTMENT OF PSYCHOLOGY
SAN JOSÉ STATE UNIVERSITY
August 2013
Dr. Gregory J. Feist Department of Psychology
Dr. Ronald F. Rogers Department of Psychology
Dr. Sean Laraway Department of Psychology
ABSTRACT
WOMEN IN SCIENCE, TECHNOLOGY, ENGINEERING, AND MATHEMATICS
(STEM) FIELDS: THE IMPORTANCE OF THE NEED TO BELONG
AND SELF-ESTEEM ON THE INTENTION TO LEAVE A JOB
by Jung Eun Lee
The purpose of the study was to predict individual intentions to leave science,
technology, engineering, and mathematics (STEM) field jobs. Psychological predictors
were gender, the need to belong, self-esteem, perceived personal discrimination, and
perceived group discrimination. We used the Amazon Mechanical Turk to recruit
participants and Survey Monkey to conduct an online survey. Participants were 174 men
and women who worked or studied in STEM fields. Two-step hierarchical linear
regression analyses were performed to analyze the data. As a result, we found that all
predictors mentioned above accounted for the variance in the intention to leave a job.
Self-esteem and perceived personal discrimination were critical predictors for men in
STEM fields; self-esteem and perceived group discrimination were critical predictors for
women in STEM fields. For women, interestingly, the interaction effect of the need to
belong and self-esteem added an additional variance in predicting the intention to leave a
job. The need to belong buffered the effect of self-esteem on the intention of STEM
women to leave a job. Thus, it might be that STEM women with low self-esteem are
more likely to change a job if their need to belong is not fulfilled.

v
ACKNOWLEDGEMENTS
This thesis is the result of many individuals’ efforts. First, I give my sincerest
gratitude to my supervisor, Dr. Greg Feist, who has supported me throughout the thesis
process with inspiration, knowledge, and patience. Without his encouragement and effort,
I would not have completed this thesis. I would like to thank Dr. Ronald Rogers who
knew about my obstacles as an international student. I always appreciated the empathetic
support and practical advice he instilled in me. He also taught me the fundamentals of
psychological research and the attitude necessary to be an experimental psychologist. I
would like to thank Dr. Sean Laraway for his comments on this thesis and for offering me
a teaching assistant position in the statistics lab. This opportunity enabled me to build
confidence in my English communication with students and to experience the joy of
teaching statistics. I would also like to thank Dr. Alvarez, Dr. Asuncion, and Dr.
Tokunaga for their development, statistics, and social cognition seminars and for opening
my eyes to the connection of theory and scientific research methods. With affection, I
acknowledge my friends in the USA and Korea who have shared my adventure. Special
thanks to Susie, Wonsang & Youngok, Tom & Sunwoo-Maria, Albert, Pauline, Anthony,
and Jonathan for their valuable input to this thesis.
To my family--my late brother Ki Pho, greatly missed; Junghee; Indong; Sehyun
Michael; and Nahyun Allison--thank you for your love and support which helped me
survive. Most importantly, I would like to give the deepest thanks to my parents who
always stand behind me with endless sacrifice, endurance, and love. I am dedicating this
thesis to Kyu Il Lee and Mi Ra Song who gave me life.

vi
Table of Contents
Introduction ......................................................................................................................... 1
Gender Disparity Research ............................................................................................. 4
Preference differences ................................................................................................. 5
Environmental Threats: Minority Status and STEM Fields’ Stereotypes ...................... 7
Psychological Threats: Discrimination, Stigam, and Stereotype Threats .................... 10
The Need to Belong ...................................................................................................... 13
Self-Esteem ................................................................................................................... 17
The Need to Belong and Self-Esteem Interaction......................................................... 19
Hypotheses .................................................................................................................... 21
Method .............................................................................................................................. 21
Participants .................................................................................................................... 21
Sampling procedure ................................................................................................... 21
Amazon mechanical turk (MTurk). ........................................................................... 22
Participant characteristics. ......................................................................................... 23
Measures ....................................................................................................................... 25
The need to belong .................................................................................................... 25
Self-esteem ................................................................................................................ 26
Self-reported discrimination. ..................................................................................... 26
The intention to leave a job ....................................................................................... 27
Background information ............................................................................................ 28
Procedure ...................................................................................................................... 28
Results ............................................................................................................................... 30
Descriptive Statistics ..................................................................................................... 30
Planned Analyses .......................................................................................................... 31
All sample regression statistics .................................................................................. 31
Female regression statistics ....................................................................................... 33
Male regression statistics ........................................................................................... 35
Discussion ......................................................................................................................... 36

vii
Sociometer Theory and the Protecting Role of the Self-Esteem Theory ...................... 39
Limitations .................................................................................................................... 40
Implications................................................................................................................... 41
Future Directions .......................................................................................................... 43
References ......................................................................................................................... 44
Appendices ........................................................................................................................ 56
Appendix A. Amazon Mechanical Turk HIT List ....................................................... 56
Appendix B. Amazon Mechanical Turk Research Description Page .......................... 57
Appendix C. Survey Monkey Informed Consent ......................................................... 58
Appendix D. Survey Monkey Screening Questions..................................................... 59
Appendix E. United States Department of Labor
Standard Occupational Classification and Coding Structure .................. 60
Appendix F. Survey Question Example (SLI) and Quit Button .................................. 61
Appendix G. The Need to Belong Scale ....................................................................... 62
Appendix H. The Rosenberg Self-Esteem Scale ........................................................... 63
Appendix I. Perception of Personal Discriminations and Perception of Group
Discrimination ......................................................................................... 64
Appendix J. The Staying-or-Leaving Index ................................................................ 65
Appendix K. Demographic Questionnaire ................................................................... 66

viii
List of Tables
Table 1. Demographic Characteristics ............................................................................. 23
Table 2. Means and Standard Deviations in Males and Females .................................... 30
Table 3. Pearson Correlation Coefficients in Males and Females ................................... 31
Table 4. All Participants Hierarchical Linear Regression Coefficients ........................... 32
Table 5. Hierarchical Linear Regression Coefficients in Males and Females ................. 34

ix
List of Figures
Figure 1. The Interaction Effect of the Need to Belong and Self-Esteem
on the Intention to Leave a Job for STEM Women .......................................... 35

1
Introduction
Women are still underrepresented in science, technology, engineering, and
mathematics (STEM) fields (Hewlett et al., 2008; National Science Foundation [NSF],
2004, 2010). Although women constituted about 40% of those with graduate degrees and
post-doctoral fellowships in science and engineering in 2006, only 27% of workers in
STEM fields were women in 2007 (NSF, 2010). An unbalanced gender composition in
STEM fields has been a long-standing issue in the economy and education of the United
States. Not only the rate of attrition but also the absolute difference is of concern. Over
52% of women with technical jobs quit their occupations, which was double the turnover
rate of men in 2007 (Hewlett et al., 2008)
To understand gender disparity, researchers have explored reasons for and
solutions to the underrepresentation of women in STEM fields (U.S. Department of
Commerce Economics and Statistics Administration, 2011a, 2011b). Specifically,
researchers have investigated the causes for the loss in gender-balanced workforce
benefits for STEM industries and attractive job opportunities for women (Costello, 2012;
U.S. Congress Joint Economic Committee, 2012). The first benefit of a gender-balanced
workforce for STEM industries is innovation, which is achieved by combining
knowledge, experience, and skills among diverse employees (Dosi, 1982; Quintana-
Garca & Benavides-Velasco, 2008). In a previous study about gender and innovation,
gender diversity of a team positively associated with innovative works because the
gender diversity increased interactions between different types of competency and
knowledge within a firm (Østergaard, Timmermans, & Kristinsson, 2009).

2
As a result of a gender-balanced workforce, potential female workers fill the
shortage in the workforces of STEM fields and STEM occupations, providing economic
benefits to future female workers (U.S. Congress Joint Economic Committee, 2012).
First, according to the report from U.S. Congress Joint Economic Committee (2012), the
U.S. education system has failed to produce STEM workers to meet the growing need of
STEM industries. In 1985, 24% of bachelor’s degrees were awarded in STEM majors in
U.S. four-year universities; in 2009, only 18% of bachelor’s degrees and 14% of master’s
degrees were awarded in STEM majors in U.S. four-year universities, respectively (U.S.
Congress Joint Economic Committee, 2012). Second, STEM industries have suffered
from a lack of trained workers, despite the positive expectation of the confident STEM
job market in the future (U.S. Congress Joint Economic Committee, 2012). Specifically,
while the projected employment rate in the general job market might increase by 10%
from 2008 to 2018, the employment rate of STEM subdisciplines is predicted to expand
by 20% to 30%, implying a significant potential for employment (Costello, 2012). In
addition, average salaries of STEM workers have been higher compared to non-STEM
workers, and average salaries of female STEM workers have been higher compared to
female non-STEM workers in the United States.
According to Langdon, McKittrick, Beede, and Doms (2011), in 2009, women
had overall median annual earnings of $35,633 (USD) whereas some STEM women’s
median annual earnings ranged from $41,091 (USD) for engineering technicians to
$71,944 (USD) for electrical engineers. Although STEM women’s earnings were higher
compared to the average earnings for women, STEM women’s earnings were still 14%

3
lower than STEM men’s earnings. This 14% gender gap was smaller compared to the 21%
gender gap in non-STEM fields (Langdon et al., 2011). There is no doubt that the STEM
industries have created abundant and compelling occupations that promise higher salaries
and more opportunities compared to other industries.
Nevertheless, women who successfully navigated STEM fields and earned
degrees in STEM fields often found themselves considering turnover soon after the onset
of their careers in male-dominated STEM fields (Hewlett et al., 2008; NSF, 2004, 2010).
This early turnover intention led us to examine individual experiences in STEM fields.
The intention to leave a job has been called turnover intention, which refers to individuals’
estimated probability that they would leave their organization permanently in the near
future (Vandenberg & Nelson, 1999). Intention to leave a job has been repeatedly shown
to be the most immediate predictor of eventual turnover behaviors in previous studies
(Bluedorn, 1982; Igbaria & Greenhaus, 1992; Moore, 2000). Even though some
researchers argued that the intention to leave a job had a weak relationship with quitting
behaviors (Steel, Shane, & Griffeth, 1990), a subsequent longitudinal study showed a
significant association between the intention to leave a job and actual turnover behaviors
(Sager, 1991).
Employee turnover is a major problem for organizations, as turnover is often
extremely costly for the employer, particularly in occupations which offer higher
education and extensive on-the-job training (Cascio, 1982). Additionally, for STEM
industries, turnover of trained employee is a critical problem because turnover involves
not only the loss of personnel, knowledge, and skills, but also the loss of business
4
opportunities (Moore & Burke, 2002). Without any doubt, STEM industries showed a
higher turnover tendency compared to non-STEM industries. For example, in 2001,
information technology (IT) firms lost 15% of workers while non-IT companies lost 4%
of their workers (Information Technology Association of America, 2002).
Therefore, the current study investigates the psychological predictors of intention
to leave a job of STEM workers to increase our understanding about STEM individuals
and gender disparity in STEM fields. Our predictors are the need to belong, self-esteem,
perceived personal discrimination, and perceived group discrimination. However, before
reviewing the literature regarding the predictors, we review overall gender-disparity
research on women’s underrepresentation in math- and science-intensive fields to provide
the framework for the current research.
Gender Disparity Research
Researchers from diverse academic fields and government agencies have
investigated gender disparity in science, math abilities, and achievements (Ceci &
Williams, 2010a, 2010b). Researchers in the psychology of science, for example, have
examined gender differences in scientific thoughts, behaviors, and achievement (Feist,
2011, 2012). This literature emphasized the role of aptitude differences in math and
science as well as psychological and cultural factors that influence gender differences in
science and math (Feist, 2011). Feist (2012), for instance, wrote “… one of the more
contentious and polemical questions in the psychology of science concerns the role that
gender plays in science in general, and in scientific and mathematical abilities and

5
achievements in particular” (p. 62). He concluded that gender could sometimes predict
mathematical and scientific behaviors and abilities.
The gender difference in cognitive development and scientific performance was
one of the most argumentative topics in the study of gender disparity (Williams & Ceci,
2007). Some researchers found that men and women did not differ in innate math and
science abilities (NSF, 2009). For example, both boys and girls did not begin exhibiting
gender differences in math and science achievements until the eighth grade (Post-
Kammer & Smith, 1985). Other researchers, however, found that boys possessed
advanced math and science abilities early in life, and a greater number of boys and men
were at the highest and lowest ends of cognitive and math ability distributions (Ceci &
Williams, 2010a, 2010b; Harpern et al., 2007). That is, compared to girls, boys are more
likely to score at the lowest and highest end on standardized math tests. In summary, the
proposition that the gender difference in cognitive development and math and science
abilities is innate, has been argumentative. Moreover, these inconsistent findings have
led to another explanation for the underrepresentation of women in STEM fields, namely
preference differences.
Preference differences. Gender disparity in science and math abilities and the
gender difference in career choice may stem from preference differences. Baron-Cohen
(2003), for example, proposed that women were oriented more toward people, and men
were oriented more toward objects. Specifically, Baron-Cohen’s idea was that women
might be predisposed to learn about people and emotional interactions, whereas men
might be predisposed to learn about objects and mechanical interactions.

6
Some indirect evidence related to this argument stems from unequal gender
distributions in physical science, in which an individual studies objects, but not in social
science, in which an individual studies people (Feist, 2012). Men continue to outnumber
women in the physical sciences but not in the social sciences. For example, in a study of
career outcomes in male and female finalists of the Westinghouse competition in math,
science, and technology, both male and female finalists were equally likely to obtain
bachelor and doctoral degrees (Feist, 2006). However, 69% of men pursued physical
science, computer science, math, or engineering degrees, whereas only 46% of women
pursued the STEM degrees (Feist, 2006). Indeed, in 1995, men and women showed
unequal gender distributions in psychology, with women outnumbering men (NSF, 1999).
Specifically, 73% of undergraduate psychology degrees were awarded to women in 1995
(NSF, 1999).
In fact, psychology and other social science fields are subfields of science in
which math and cognitive abilities are necessary, although maybe to a lesser extent
compared to the physical sciences. Also, empirical research has not fully supported the
men-object and women-people preference hypothesis. For instance, girls and boys
showed similar levels of interest in mathematics during their high school and
undergraduate years (Long, 2001). Thus, the differences in preference appear to come
later in life.
Therefore, the idea that the cultural and environmental factors influence gender
disparity in math and science abilities and achievements has grown more persuasive.
Researchers have suggested that gender disparity might relate to non-biological factors,

7
such as psychological, motivational, and environmental factors (Feist, 2012; Spelke,
2005). Spelke (2005) stated that over generalizing a few specific cognitive test results
(e.g., a mental rotation test) as evidence of an outstanding engineer or mathematician was
problematic. Instead, many factors, such as preferences, motivations, and success
expectations, affected a decision to study physics or to become a mathematician (Spelke,
2005).
Environmental Threats: Minority Status and STEM Fields’ Stereotypes
Environmental conditions affecting women’s experiences in STEM fields have
been underestimated (Murphy, Steele, & Gross, 2007). Male-dominated and masculine
features in STEM environments might be threats to women, and women in STEM fields
might have negative experiences resulting from such threats. Murphy et al. (2007) and
Cheryan, Plaut, Davies, and Steele (2009) investigated the effects of women’s
underrepresentation and masculine stereotypes of STEM fields. They suggested that
environmental features of STEM fields--like masculinity--might decrease STEM
women’s sense of belonging and interest in technical fields.
Murphy et al. (2007) hypothesized that women’s minority status in STEM fields
might have intimidated women’s identity as STEM members. To test their hypothesis,
they showed two different 7 min-long conference videos depicting approximately 150
people with either a ratio of 3 men to 1 woman (gender-unbalanced video) or a ratio of 1
man to 1 woman (gender-balanced video) to male and female university students.
Murphy et al. collected physiological threat responses, such as a cardiac inter-beat
interval and a finger pulse amplitude, while participants watched a video. They also

8
collected survey data, such as a sense of belonging, desire to participate in the
conference, and a recall task about stereotypical objects in the experiment room, after
participants watched a video.
The collected data supported the hypothesis that women’s minority status was a
threat to STEM women. For instance, in the gender-unbalanced conference video
condition, female students showed threat responses, such as a high cardiac interbeat
interval and a high finger pulse amplitude. Moreover, these female students reported
lower levels of sense of belonging, lower participation desire, and more stereotypical
STEM objects, such as Star Trek posters, computer programming books, computer
software boxes, and computer game CD cases, compared to the female students in the
gender-balanced conference video condition. Murphy et al. (2007) argued that these
results to mean that women were acutely aware of their minority status and experienced
threats in the gender-unbalanced condition. In the aftermath of the threatening
experiences, the female students’ sense of belonging and intentions to participate in the
conference decreased.
In a similar vein, Cheryan et al. (2009) suggested that women’s interest and sense
of belonging to computer science might have decreased because of stereotypical objects,
such as Star Trek posters, computer programming books, computer software boxes, and
computer game CD cases, in a computer science department. Cheryan et al. showed that
women in the experiment room decorated with the above listed stereotypical objects were
less interested in computer science compared to women in the other experiment room
decorated with non-stereotypical objects, such as nature posters and furniture. According

9
to Cheryan et al., these stereotypical objects worked as situation cues that alerted women
to the possible psychological threat to their social identity as members of a computer
science department. They found that stereotypical objects decreased STEM women’s
interest in joining a group in a computer science department.
Moreover, other researchers suggested that the lack of female role models might
be a threat to women related to women’s career decisions (Sadker & Sadker, 1994; Stout,
Dasgupta, Hunsinger, & McManus, 2011). Because of the lack of female role models in
STEM fields, STEM women’s interest in science and mathematics might decrease. For
example, high school girls intrinsically made an association between science and boys
because they rarely saw female scientists in textbooks (Sadker & Sadker, 1994).
Conversely, exposure to female STEM experts was likely to enhance women’s self-
efficacy, domain identification, and commitment to pursue STEM careers (Stout et al.,
2011).
In summary, threatening STEM environments such as stereotypical features
within STEM environments (e.g., Murphy et al., 2007), women’s minority status (e.g.,
Cheryan et al., 2009), and the lack of female role models (e.g., Sadker & Sadker, 1994;
Stout et al., 2011), might steer women away from entering STEM fields. These
threatening environmental characteristics might push women to leave STEM jobs.
Moreover, these environmental threats might relate to psychological threats that increase
STEM women’s intention to leave a job. That is, in these difficult circumstances, STEM
women might experience a decreased sense of belonging and self-esteem along with

10
other psychological obstacles induced by negative stereotypes about women and
women’s math and science abilities.
Psychological Threats: Discrimination, Stigma, and Stereotype Threats
Women in STEM fields have experienced discrimination, stigma, and stereotype
threats, all of which are examples of psychological threats (Crosby, 1982; Eccles, 1987;
Fouad et al., 2010; Logel, Walton, Spencer, Iserman, & Hippel, 2009; Rosenbloom, Ash,
Dupont, & Coder, 2008; Seymour, 1995; Stout et al., 2011; Walton & Cohen, 2007). We
argue that these psychological threats might relate to STEM women’s intention to leave a
job (Birbaumer, Lebano, Ponzellini, Tolar, & Wagner, 2007; Lichtenstein et al., 2009;
Seymour, 1995; Steele, James, & Barnett, 2002).
The first psychological threat that women might experience in STEM fields is
gender discrimination, defined as “an unjustifiable negative behavior directed at a person
on the basis of his or her sex” (Nelson, 2006, p. 199). Steele et al. (2002) found that
women in STEM fields were more likely to report thinking about changing their majors
because of their experiences of discrimination.
Some researchers have focused on psychological factors that could explain the
reasons for which STEM women leave STEM jobs. These researchers have suggested
that STEM women might experience rejections through discrimination and, as a result,
recognize that their need to belong to STEM fields is not being fulfilled (Carvallo &
Pelham, 2006; Crosby, 1982; Richman & Leary, 2009; Steele et al., 2002). When
rejections occur in social interactions, the need to avoid emotional suffering tends to
force withdrawals from these interactions (Baumeister & Leary, 1995). Also, a rejected

11
individual might realize that his or her belonging motivation is not being fulfilled in the
social interactions (Baumeister & Leary, 1995). In the case of STEM women, women
who experience discrimination might be more likely to recognize that their belonging
motivation is not being fulfilled in STEM fields. Then, this unfulfilled need to belong of
STEM women might help explain, at least partially, intention to leave a job (Walton &
Cohen, 2007).
Richman and Leary (2009) studied individual reactions to threats linked to social
acceptance and belonging. They investigated diverse forms of rejections, such as
discrimination, ostracism, betrayal, and stigmatization, as well as the motivational model
that explained the occurrence of different reactions in stigmatized individuals who were
targets of rejections. They suggested that individuals reacted to the threats because of the
motivation to be valued and accepted by other people. Additionally, Zadro, Williams,
and Richardson (2004) found negative influences of ostracism on belonging motivation.
In their experimental study, they simulated incidents of ostracism in the online computer
game called Cyberball, an analogue of a ball-tossing game with a computer player
(Williams, Cheung, & Choi, 2000). Participants who experienced ostracism by a
computerized player reported lower levels of belonging motivation compared to non-
ostracized participants. Both abovementioned studies reported relatively strong
associations among rejection experiences, psychological threats experiences, and the
need to belong.
The next psychological threat that STEM women may experience is stigma,
which is defined as an attribute that extensively discredits an individual, reducing him or

12
her “from a whole and usual person to a tainted, discounted one” (Goffman, 1963, p. 3).
We argue that the stigma that STEM women experience might relate to the changes in
self-esteem (Crocker & Major, 1989; Eccleston & Major, 2006; Major, Kaiser, McCoy,
2003; Major, Quinton, & Schmader, 2003; Schmitt & Branscombe, 2002). Our reasoning
starts with the findings that STEM women’s stigma is based on the stereotype that
women have lower levels of abilities in math and science compared to men. This
stigmatization might lead women to feel devalued as group members in STEM fields,
which can result in decreased self-esteem (Crocker & Major, 1989; Eccleston & Major,
2006; Major, Kaiser et al., 2003; Major, Quinton et al., 2003; Schmitt & Branscombe,
2002).
Subsequently, math and science inability stereotype of STEM women is also
linked to a phenomenon called a stereotype threat. A stereotype threat refers to a social
psychological predicament that evolves from a negative stereotype, which negatively
affects performance (Steele & Aronson, 1995). A stereotype threat is an example of
psychological threat that STEM women might experience. Some researchers have found
that women’s math and science performances decrease because of a stereotype threat
when they are being evaluated (Logel et al., 2009; Mendoza-Denton, Shaw-Taylor, Chen
& Chang, 2009; Steele & Aronson, 1995; Stoet & Geary, 2012).
Applied to math abilities, women’s math performance decreases when a math test
is described as a diagnostic intelligence test or when the test is taken with male
participants. Women’s math performance decreases because women are well aware of
the gender stereotype that women have lower ability in math compared to men. That is,

13
if women perform poorly on a math test, they may fear that others would attribute their
poor performance to their gender. This fear is a source of a stereotype threat which relate
to decreases in math performance. Many researchers have consistently reported the
negative effect of a stereotype threat on women’s math and science performances (e.g.,
Derks, Inzlicht, & Kang, 2008; Jones et al., 1984). STEM women’s math and science
performance might decline in the presence of a stereotype threat, and poor performances
might result in decreased self-esteem (Logel et al., 2009; Mendoza-Denton et al., 2009;
Steele & Aronson, 1995; Stoet & Geary, 2012). Therefore, we suggest that STEM
women’s unfulfilled need to belong and decreased self-esteem might predict the intention
to leave a job.
In summary, we reviewed literature about environmental threats, such as
stereotypes of STEM fields (Murphy et al., 2007), women’s minority status (Cheryan et
al., 2009), the lack of role models (Sadker & Sadker, 1994; Stout et al., 2011), and their
negative influences on the need to belong and self-esteem of STEM women. In addition,
we reviewed literature on psychological threats, such as discrimination, stigma, and
stereotype threats, and their negative influences on the need to belong (Carvallo &
Pelham, 2006; Richman and Leary, 2009; Steele et al., 2002; Walton & Cohen, 2007) and
self-esteem (Crocker & Major, 1989; Eccleston & Major, 2006; Major, Kaiser et al., 2003;
Major, Quinton et al., 2003; Schmitt & Branscombe, 2002).
The Need to Belong
The need to belong is a significant predictor of women’s intention to leave STEM
jobs, and it has been emphasized as an important factor of success and retention in STEM
14
fields (Dasgupta, 2011; Good, Rattan, & Dweck, 2012; Inzlicht & Good, 2006; Walton &
Cohen, 2011). The need to belong is the motivation to have positive, constant, and
meaningful interactions and relationships with other people (Baumeister & Leary, 1995).
It has many names: the need to belong, belongingness motivation, the motive to be
accepted by others, and the desire to be relationally valued among others (Leary & Allen,
2011). People ask themselves “do I belong?” in deciding whether to enter, continue, or
abandon relationships (Walton & Cohen, 2007). For socially stigmatized individuals,
certainly, this question may be visited and revisited (Walton & Cohen, 2007). Strong
reactions may occur when others threaten his or her need to belong through rejection,
ostracism, stigmatization, and other signs, which indicate that others do not have interest
in building relationships (Leary & Allen, 2011). Moreover, individuals who belong to
disadvantaged groups find themselves in situations where their abilities are in doubt, for
instance, in high-stakes academic or professional environments, the need to belong is
likely to play an important role (Dasgupta, 2011).
The need to belong might influence behaviors and career choices (Baumeister &
Leary, 1995; MacDonald & Leary, 2005). For example, Richman, vanDellen, and Wood
(2011) argued that the need to belong was an important indicator of prosperous careers
among female professors who successfully pursued their STEM careers. They also
reported that positive experiences with female role models, family support, and social
support had a strong association with the need to belong. Moreover, Carvallo and
Pelham (2006) found that women had a tendency to minimize the extent of personal
discrimination experiences because of desire to fulfill the need to belong in relationships

15
(e.g., Crosby, 1982; Quinn, Roese, Pennington, & Olson, 1999). Carvallo and Pelham
explained this finding by the fact that people might fail to appreciate the degree to which
they have been the victims of discrimination because acknowledging discrimination
represented a threat to people’s need to belong.
Additional supporting evidence about the need to belong and other psychological
factors comes from previous studies on the experiences of racially discriminated
individuals. For instance, Walton and Cohen (2007, 2011) examined the significance of
belonging in a study of African-American students who were stigmatized in academic
fields. Walton and Cohen (2007) found that racially stigmatized students who
experienced the lack of social connections in a computer science department also
experienced decreased feeling of belonging. In their consequent study, Walton and
Cohen (2011) showed the positive effect of a brief social-belonging intervention
conducted with African-American students. Minority students who suffered constantly
from unfulfilled belonging in academic settings and experienced constant exposure to
negative stereotypes, reported improved academic and health outcomes after receiving a
brief social-belonging intervention. Walton and Cohen found that the social-belonging
intervention effectively fulfilled minority individuals’ need to belong and enhanced
overall well-being in threatening environments.
Therefore, we hypothesize that the need to belong of STEM women to STEM
fields might be insufficiently fulfilled because of environmental threats (Cheryan et al.,
2009; Murphy et al., 2007) and psychological threats (Crosby, 1982; Eccles, 1987; Fouad
et al., 2010; Logel et al., 2009; Rosenbloom et al., 2008; Seymour, 1995; Stout et al.,

16
2011; Walton & Cohen, 2007). We also hypothesize that the unfulfilled need to belong
might relate to the intention to leave a job (Richman et al., 2011; Steele et al., 2002; Stout
et al., 2011). In detail, we predict that STEM women might report higher levels of the
need to belong compared to STEM men because their need to belong to STEM fields
might not be fulfilled. When the need to belong is not fulfilled (i.e., when someone is
rejected), levels of the need to belong increase, and when the need to belong is fulfilled
(i.e., when someone is accepted), levels of the need to belong decrease (Baumeister &
Leary, 1995; Carvallo & Pelham, 2006).
In addition, we examine how personal and group discrimination relate to the need
to belong and the intention to leave a job (Carvallo & Pelham, 2006; Crosby, 1982;
Quinn et al., 1999). For instance, Carvallo and Pelham (2006) showed that participants
who reported a high need to belong (unsatisfied) reported a decrease in personal
discrimination but an increase in group discrimination. This phenomenon has been called
the personal-group discrimination discrepancy (Carvallo & Pelham, 2006; Taylor, Wright,
Moghaddam, & Lalonde, 1990). The discrepancy between personal and group
discrimination occurs when stigmatized group members minimize the extent to which
they have personally experienced discrimination and maximize the extent to which they
have suffered group discrimination as members of minority groups, such as a group of
females, African-Americans, disabled persons, or immigrants (Taylor et al., 1990).
Taylor et al. (1990) found that participants who reported low levels of the need to belong
(satisfaction) report increases in personal discrimination but decreases in group
discrimination. This result implies that an individual who could not fulfill his or her need

17
to belong might want to be accepted by others and report an increased desire to belong.
Then, he or she might report high group discrimination but low personal discrimination.
Therefore, we predicted that STEM women would report higher levels of the need
to belong than would STEM men. We also expected STEM women to report high levels
of group discrimination but low levels of personal discrimination along with a high need
to belong because they might have a strong desire to be accepted by other STEM
individuals.
Self-Esteem
Self-esteem refers to a feeling of personal self-worth (Crocker & Major, 1989).
Self-esteem has been one of the most studied individual characteristics in personality
psychology over the past several decades (Baumeister, 1999). Low self-esteem is
associated with a broad assortment of personal and social problems; high self-esteem is
associated with dramatic improvements in many aspects of human life (Baumeister,
1999). In fact, previous researchers found that individuals with high self-esteem had a
greater persistence in spite of failure, suggesting that self-esteem facilitated resilience
(Shrauger & Rosenberg, 1970). Additionally, self-esteem correlated with job
satisfactions (Greenhaus & Badin, 1974). However, individuals with low self-esteem
were vulnerable to the psychological effects indicated by mood swings and affective
reactions, which related to psychological problems, unemployment, and maladaptive
behaviors (Campbell, Chew, & Scratchley, 1991; Silverston, 1991; Waters & Moore,
2002).
18
In the current research, we investigate self-esteem of STEM women and its
relationship with other factors in predicting the intentions to leave a job. According to
the previous research, STEM women might experience changes in self-esteem because of
discrimination, stigma, and stereotype threats (Crocker & Major, 1989; Eccleston &
Major, 2006; Major, Kaiser et al., 2003; Major, Quinton et al., 2003; Schmitt &
Branscombe, 2002). Moreover, self-esteem was related to turnover intentions, job
satisfaction, organizational commitment, motivation, and performances (Pierce &
Gardner, 2004). Similarly, Gardner and Pierce (2001) found a negative relationship
between self-esteem and turnover intentions. Specifically, employees who believed that
their companies view them as important had a tendency to report low levels of turnover
intentions.
Thus, we hypothesize that the changes in self-esteem among STEM women might
relate to the intention to leave a job. In terms of the direction for self-esteem, two
patterns emerged. Some researchers found that STEM women had higher self-esteem
than did STEM men (Carvallo & Pelham, 2006; Crocker & Major, 1989; Hoyt, Aguilar,
Kaiser, Blascovich, & Lee, 2007; Major, Kaiser et al., 2003; Sechrist & Delmar, 2009),
while others reported that STEM women had lower self-esteem than did STEM men
(Anthony, Wood, & Homes, 2007; Leary & Allen, 2011; Leary & Baumeister, 2000;
Leary, Tambor, Terdal, & Downs, 1995).
Some researchers suggest that stigmatized individuals might have higher self-
esteem compared to non-stigmatized individuals because they attribute the negative
feedback about their performance to others’ prejudiced attitude against them (Carvallo &

19
Pelham, 2006; Crocker & Major, 1989; Hoyt et al., 2007; Major, Kaiser et al., 2003;
Sechrist & Delmar, 2009). For example, women who blamed others for prejudice often
had higher self-esteem compared to women who did not blame others (Major, Kaiser et
al., 2003). Similarly, Carvallo and Pelham (2006) found that women participants often
made prejudiced attributions when they tried to protect their own self-esteem from their
counterparts’ negative feedback.
According to this perspective, self-esteem of STEM women would be high
because women might try to attribute negative feedbacks and poor performances to
gender discrimination (e.g., Crocker, Voelkl, Testa, & Major, 1991; Major, Kaiser et al.,
2003). Even though self-esteem may have a protective effect and allow STEM women to
have higher self-esteem than do STEM men, some theorists argue that STEM women
may have lower self-esteem than do STEM men.
The Need to Belong and Self-Esteem Interaction
Researchers who proposed the sociometer theory of self-esteem suggested that
STEM women might have lower self-esteem compared to STEM men (Anthony et al.,
2007; Leary & Allen, 2011; Leary & Baumeister, 2000; Leary et al., 1995). In the
sociometer theory, self-esteem works as a subjective monitor to support the individual’s
relational evaluation—the degree to which other people regard their relationships with
the individual to be valuable, important, or close (Leary & Baumeister, 2000). That is,
self-esteem monitors the quality of interpersonal relationships and motivates behaviors
that help the person maintain a minimum level of acceptance by other people (Leary &
Downs, 1995). Leary and Baumeister (2000) explained that “high self-esteem reflected

20
the perception that an individual was a valued person for groups and close relationships,
whereas low self-esteem reflected the perception that his or her eligibility for social
inclusion was low” (p. 9).
According to the sociometer theory, when an individual fulfills his or her
belonging motivation, self-esteem increases; when an individual does not fulfill his or her
belonging motivation, self-esteem decreases. Furthermore, individuals with high self-
esteem feel that they are being valued by others, while individuals with low self-esteem
doubt their relational value in current and in future relationships (Anthony et al., 2007;
Leary et al., 1995). Anthony et al. (2007), for example, tested the sociometer theory’s
assumption that low self-esteem might be due to an unfulfilled need to belong. They
compared women with high self-esteem and women with low-self esteem in two different
social acceptance conditions (an obvious-acceptance condition and an ambiguous-
acceptance condition). They found significant correlations between self-esteem and
acceptance conditions. Women with low self-esteem were interested in joining the
obvious-acceptance group. However, women with high self-esteem did not show
preferences regarding the group they intended to join. They were less likely to consider
how others treated women compared to women with low self-esteem (Anthony et al.,
2007). According to the sociometer theory, self-esteem of STEM women would be low
because of an unfulfilled need to belong, and their need to belong would be high because
it would be unfulfilled (e.g., Carvallo & Pelham, 2006).
In summary, two different perspectives emerged regarding self-esteem of STEM
women. The first finding indicated that women might have high self-esteem compared to

21
men because women tried to protect their self-esteem while attributing others’ negative
feedback to group discrimination against women (e.g., Crocker et al., 1991; Major et al.,
2003). The second finding was that women might report lower self-esteem compared to
men because women have not been valued or desired in STEM fields (Anthony et al.,
2007; Leary & Allen, 2011; Leary & Baumeister, 2000; Leary et al., 1995).
Hypotheses
Based on the previous reasoning and findings, we made the following predictions:
1. Gender, the need to belong, self-esteem, personal discrimination, and group
discrimination will explain the variance in the intention to leave a job for both male and
female STEM workers.
1a. For STEM women, the need to belong, self-esteem, personal discrimination,
and group discrimination will explain the variance of their intention to leave a job.
1b. For STEM men, the need to belong and self-esteem will explain the variance
of their intention to leave a job.
2. The interaction between the need to belong and self-esteem of STEM women will
explain an additional variance in their intention to leave a job over and above the need to
belong, self-esteem, personal discrimination, and group discrimination alone.
Method
Participants
Sampling procedure. We used purposive sampling as a type of nonprobability
sampling to recruit the predefined participant group that was hard to address by random
sampling. The predefined participants in this research were men and women who work
22
or study in STEM fields. To reach this specific population, we used the Amazon
Mechanical Turk.
Amazon mechanical turk (MTurk). The MTurk (www.mturk.com) boasts a
large, diverse workforce consisting of over 100,000 users from over 100 countries who
complete tens of thousands of tasks daily (Pontin, 2007). A requester creates a Human
Intelligence Task (HIT). Then, a worker selects an available HIT and completes the HIT
using a computer or the Internet (i.e., surveys, experiments, writings, etc.). Some HITs
are basic templates, technical scripts, psychological experiments, translations, or external
online surveys (e.g., Survey Monkey). A worker gets a short description about a HIT in a
list (see Appendix A). In addition, a worker gets detailed information on the web page
that is linked to the list through the title of the HIT (see Appendix B). A worker reviews
an updated HIT list at his or her convenience and participates in a task of interest.
Burmester, Kwant, and Gosling (2011) reported that MTurk data met an acceptable
psychometric reliability standard.
A potential participant moves to an informed consent page on the Survey Monkey
web page (www.surveymonkey.com). When he or she agrees with the informed consent,
a screening procedure begins (see Appendix C). We used a few screening questions to
select STEM scientists and engineers and to avoid a possible deception about fields of
work or study reported by potential participants (see Appendix D). For example,
potential participants were not told that target participants were STEM scientists and
engineers. Instead, they were asked to select their field from an occupation list. Only a
potential participant who selected the STEM field was allowed to proceed to the

23
following questionnaires. Anyone who selected the non-STEM occupation was directed
away from the survey. We used the standard occupational classification by the U.S.
Department of Labor to build the list of STEM occupations in the screening question
(U.S. Department of Labor, 2010; see Appendix E). The qualified occupations were
computer and mathematics, architecture, engineering, life science, and physical science.
The other screening questions were age (that a worker was over 18 years old), and
English (that a worker used English as the first or second language). Finally, among the
711 MTurk workers who clicked the survey link and started the recruiting process, only
174 participants selected STEM jobs and were able to complete the screening procedure
and the online survey (see Appendix F). We collected data for two weeks.
Participant characteristics. Participants were 120 STEM men and 54 STEM
women. The demographic characteristics are presented in Table 1. The average male
respondent was a 29.78-year-old STEM employee (or self-employed) or STEM student.
About 48% of males lived in North America and about 49% of males lived in South Asia.
The average female respondent was a 29.84-year-old STEM employee (or self-employed)
or STEM student. About 52% of females lived in North America and about 45% of
females lived in South Asia or East Asia.
Table 1
Demographic Characteristics
Male
N = 120
Female
N = 54
N (%) N (%)
Job Status
Employed 53 (44.2) 24 (44.4)
Self-Employed 20 (16.7) 8 (14.8)

24
Out of Work > 1Year 1 (0.8) 2 (3.7)
Out of Work < 1Year 2 (1.7) 4 (7.4)
Graduate Student 20 (16.7) 7 (13.0)
College & University
Student 24 (20.0) 9 (16.7)
Fields of Work or Study
Computer &
Mathematics 51 (42.5) 25 (46.3)
Architecture 3 (2.5) 0 -
Engineering 51 (42.5) 15 (27.8)
Life Science 8 (6.7) 9 (16.7)
Physical Science 7 (5.8) 5 (9.3)
Work History
Less than 1year 10 (8.3) 4 (7.4)
1 year 12 (10.0) 5 (9.3)
2 years 11 (9.2) 7 (13.0)
3 years 13 (10.8) 0 -
4 years 16 (13.3) 9 (16.7)
5 years 14 (11.7) 10 (18.5)
6 years 5 (4.2) 3 (5.6)
7 years 6 (5.0) 1 (1.9)
8 years 8 (6.7) 1 (1.9)
9 years 2 (1.7) 3 (5.6)
10 years 4 (3.3) 0 -
More than 10 years 19 (15.8) 11 (20.4)
Education
Grade school or Less 1 (0.8) 0 -
High school or GED 6 (5.0) 2 (3.7)
College or
Associate Degree 20 (16.7) 10 (18.5)
Bachelor 63 (52.5) 26 (48.1)
Master 30 (25.5) 14 (25.9)
Doctoral 0 - 2 (3.7)
Language (English is)
First language 74 (61.7) 35 (64.8)
Second language 46 (38.3) 19 (35.2)
Location
North America 55 (45.8) 28 (51.9)
South America 1 (0.8) 1 (1.9)
East Asia 2 (1.7) 3 (5.6)
South Asia 59 (49.2) 21 (38.9)
Europe 2 (1.7) 1 (1.9)
Middle East 1 (0.8) 0 -

25
Ethnicity
American Indian or
Alaskan Native 3 (2.5) 0 -
Asian or
Asian American 66 (55.0) 31 (57.4)
Black or
African American 1 (0.8) 1 (1.9)
Hispanic or Latino 1 (0.8) 5 (9.3)
White or
European American 42 (35.0) 15 (27.8)
Other 7 (5.8) 2 (3.7)
Relationship Status
Single 70 (58.3) 19 (35.2)
Married 39 (32.5) 26 (48.1)
Divorced, Separated,
or Widowed 1 (0.8) 1 (1.9)
Engaged 3 (2.5) 3 (5.6)
Cohabiting 7 (5.8) 5 (9.3)
Note. - = No data available, Listwise option used for analyses.
Measures
The need to belong. We measured a belonging motivation with the revised 10-
item scale, The Need to Belong Scale (NTB; Leary, Kelly, Cottrell, & Schreindorfer,
2007; see Appendix G). This revised scale includes 10 items, such as “If other people
don’t seem to accept me, I don’t let it bother me,” and “My feelings are easily hurt when
I feel that others do not accept me.” Items were measured on a 5-point scale (1 =
strongly disagree to 5 = strongly agree). An item expressing a low level of the need to
belong was reverse scored so that higher scores reflected a higher level of the need to
belong. The high level of need to belong represents an unfulfilled belonging.
The Need to Belong Scale’s inter-item reliability was high in this research, α = .80.
The result is consistent with previous results. For example, Cronbach’s alphas generally
exceed .80 (Kelly, 1999; Leary, 1997; Leary & Cottrell, 2001). In addition, other
researchers have used this scale in their studies (e.g., Carvallo & Pelham, 2006; De

26
Cremer & Leonardelli, 2003; Pickett, Gardner, & Knowles, 2004; Walker, Green,
Richardson, & Hubertz, 1996). According to Leary et al. (2007), discriminant validity of
the Need to Belong Scale was seen in its relationship to similar but different constructs,
affiliation tendencies (i.e., affiliation motivation, sociability, extraversion). Specifically,
Leary et al. found that statistically significant but relatively low correlations between the
Need to Belong Scale with Need for Affiliation, r = .26, p < .01 (Jackson, 1967),
Sociability, r = .32, p < .001 (Cheek & Buss, 1981), and Extraversion of NEO-FFI, r
= .16, p < .05 (Costa & McCrae, 1992).
Self-esteem. We measured self-esteem using the Rosenberg Self-Esteem Scale
(Rosenberg, 1965; see Appendix H). This scale included 10 items, such as “On the
whole, I am satisfied with myself,” and “I take a positive attitude toward myself.”
Items were measured on a 4-point scale (1 = disagree to 4 = strongly agree). Rosenberg
(1965) reported an acceptable internal consistency, α = .80. We also found a similar high
internal consistency, α = .83.
Moreover, the test-retest reliability for the two-week interval of the Rosenberg
Self-Esteem was .85, whereas the seven-month interval between the two testing periods
was .63 (Silber & Tippett, 1965; Shorkey & Whiteman, 1978). Crandall (1973) found the
significant convergent and discriminant validity with Coopersmith’s Self-Esteem
Inventory (Coopersmith, 1967).
Self-reported discrimination. We measured a self-reported discrimination using
the 4-item Perceptions of Personal Discrimination (PPD) and the 4-item Perceptions of
Group Discrimination (PGD; Carvallo & Pelham, 2006; see Appendix I). Participants

27
answered on a 7-point scale (1 = strongly disagree to 7 = strongly agree). Carvallo and
Pelham modified the Perceived Discrimination Scale by Sechrist, Swim, and Mark (2003)
which included both PPD and PGD scales to assess the discrepancy between personal and
group discrimination. The personal-group discrimination discrepancy theory suggests
that a stigmatized group member might minimize the extent to which he or she has
personally experienced discrimination (Taylor et al., 1990). This minimizing tendency of
personal discrimination has been replicated in many studies (e.g., Carvallo & Pelhem,
2006; Crosby, 1982; Quinn et al., 1999). Thus, we also used both PPD and PGD scales
to avoid possible misinterpretations about discrimination experiences of STEM
individuals.
Example items of the PPD included “Prejudice against my gender group has
affected me personally,” and “I have personally experienced gender discrimination.”
The example items of the PGD included “Prejudice against my gender group has affected
the average female (male),” and “The average female (male) has experienced gender
discrimination.” In our study, PPD’s internal reliability was high, α = .95, and PGD’s
internal reliability was also high, α = .97. In another study, internal reliabilities of PPD
and PGD were high with both having α of .92 (Carvallo & Pelham, 2006).
The intention to leave a job. We measured the intention to leave a STEM job
using the Staying-or-Leaving Index (SLI; Bluedorn, 1982; see Appendix J). Original
items of the SLI were modified to accommodate the purpose of the present research. The
SLI consisted of two sets of four questions each. The first set asked about the likelihood
of still working or studying in the field in which a participant worked or studied over
28
various time spans (e.g., 3 months from now, 6 months from now, 1 year from now, and
2 years from now). The first set of SLI followed the screening question asking about a
participant’s current field of work or study. When a participant selected a STEM job, he
or she proceeded to answer the first set of SLI. The other four questions asked about the
likelihood of quitting the STEM job or study during the above four different time spans.
Example questions included “How do you rate your chances of still working or studying
in the field you just answered,” and “How would you rate your chances of quitting the
current field’s job or study in the next three months?” A participant rated his or her
chances of leaving on a 7-point scale (1 = Terrible to 7 = Excellent).
The four questions were reverse-scored before all eight questions were summed to
produce the SLI score. Higher scores indicated a greater intention to leave STEM fields’
job or study. The SLI’s internal reliability was high, α = .87, in the current study.
Bluedorn (1982) found high reliabilities in five different samples, ranging from α = .87 to
α = .95. He also found convergent validity with other similar measures ranging from r
= .48 to r = .91.
Background information. Information regarding a participant’s age, gender,
education, ethnicity, physical location, marital status, occupation or major, years in the
current job or the current STEM major, and a general job (or major) satisfaction were
collected to understand the demographic background of participants (see Appendix K).
Procedure
An MTurk worker began the study by reading a short description of the present
research in the list of available HITs and the detailed description page. The detailed

29
description included participation requirements, screening processes, the possibility of
disqualification, the instruction for completing the online survey, and compensation.
Participation depended on an MTurk worker’s voluntary decision. When an MTurk
worker clicked the survey link, a new window opened with the informed consent on the
Survey Monkey website. Then, a potential participant needed to answer a few screening
questions after the informed consent. When a potential participant passed all screening
questions, he or she proceeded to respond to the subsequent survey questions until the
completion of the survey. If a potential participant failed to pass the screening process,
he or she would reach the disqualifying page that provided the reason for terminating the
current survey. No monetary compensation was given to a potential participant who
failed the screening process.
A participant completed the online survey in approximately 10-15 min. A
participant could quit the survey anytime. A ‘quit’ button appeared on top of each survey
page. A participant completed the online survey in the following topic order: the
Staying-or-Leaving Index (Set 1), The Need to Belong, the Rosenberg Self-Esteem,
Perceptions of Personal Discrimination, Perceptions of Group Discrimination, The
Staying-or-Leaving Index (Set 2), and Demographic Questionnaire. At the end of the
online survey, a participant was asked to create a five-digit code consisting of five
different numbers to receive compensation (e.g., 45368). Then, a participant returned to
the MTurk website and reported the code. The final step was pressing the ‘submit’
button. A participant who successfully completed the entire processes received a
monetary compensation of the $ 0.50 (USD) one week after they completed the survey.
30
At the end of the survey, the email address of the researcher was provided with a thank
you message. A group-level result was shared with participants who sent a request email
within approximately two months of completing the survey.
Results
The primary goal of this study was to predict the intention to leave a job by
considering five predictors (i.e., gender, the need to belong, self-esteem, personal
discrimination, and group discrimination). The second goal was to investigate an
interaction effect of the need to belong and self-esteem on the intention to leave a job. To
achieve these goals, we performed a series of hierarchical linear regression analyses.
Descriptive Statistics
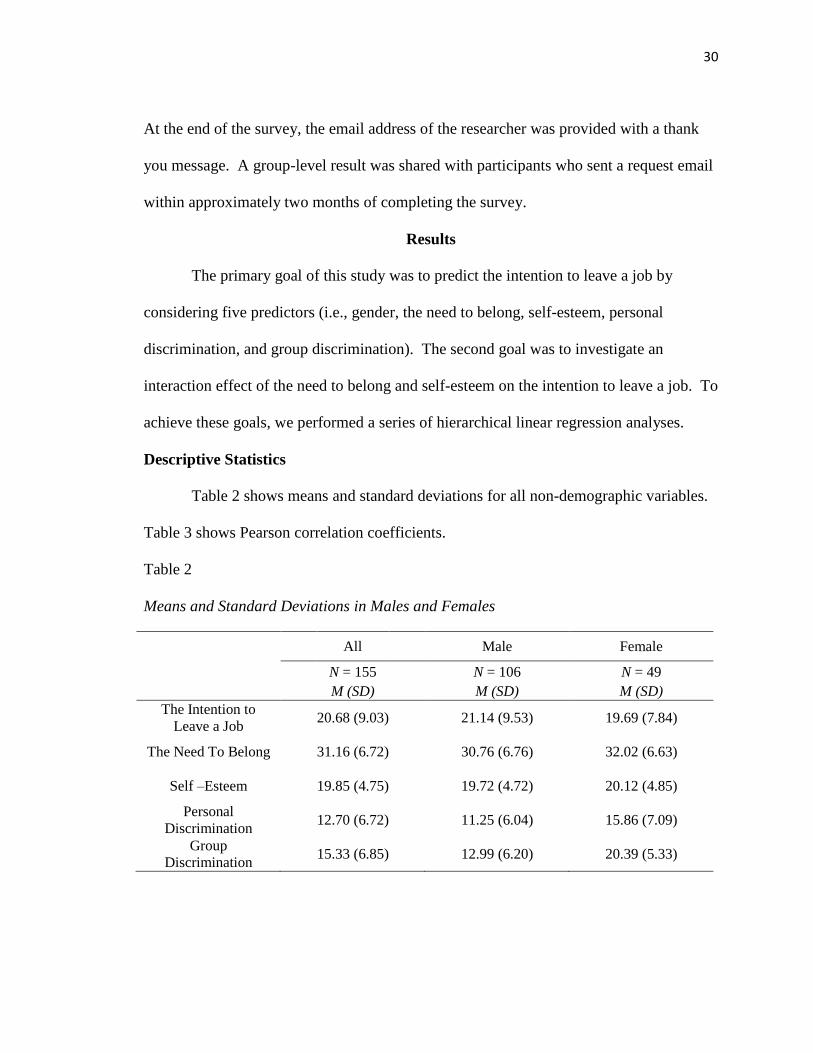
Table 2 shows means and standard deviations for all non-demographic variables.
Table 3 shows Pearson correlation coefficients.
Table 2
Means and Standard Deviations in Males and Females
All Male Female
N = 155 N = 106 N = 49
M (SD) M (SD) M (SD)
The Intention to
Leave a Job 20.68 (9.03) 21.14 (9.53) 19.69 (7.84)
The Need To Belong 31.16 (6.72) 30.76 (6.76) 32.02 (6.63)
Self –Esteem 19.85 (4.75) 19.72 (4.72) 20.12 (4.85)
Personal
Discrimination 12.70 (6.72) 11.25 (6.04) 15.86 (7.09)
Group
Discrimination 15.33 (6.85) 12.99 (6.20) 20.39 (5.33)

31
We found that STEM women’s intention to leave a job was negatively related to
their self-esteem, r = -.39, p < .01, and to group discrimination, r = -.39, p < .01. For
STEM men, the intention to leave a job was negatively related to their self-esteem, r = -
.46, p < .01, positively related to personal discrimination, r = .52, p < .01, and positively
related to group discrimination, r = .41, p < .01.
Table 3
Pearson Correlation Coefficients in Males and Females
Male /
Female
Intention to
Leave a Job
The Need
to Belong
Self-
Esteem
Personal
Discrimi-
nation
Group
Discrimi-
nation
Interaction
Intention to
Leave a Job - .18 -.46
** .52
**
.41**
-.24 *
The Need
to Belong .01 - -.24
* .08 -.04 .64
**
Self-
Esteem -.39
** -.08 - -.40
** -.29
** .58
**
Personal
Discrimi-
nation
.02 -.31* -.22 - .74
** -.26
**
Group
Discrimi-
nation
-.39**
-.23 .03 .40**
- -.27**
Interaction -.30* -.68
** .67
** -.39
** -.16 -
Note. Correlations of STEM male, N = 106, presented above the diagonal, and of STEM female, N = 49,
presented below the diagonal. Interaction = The Need to Belong by Self-Esteem. *p < .05.
**p < .01.
***p < .001., two-tailed.
Planned Analyses
All sample regression statistics. We hypothesized that gender, the need to
belong, self-esteem, personal discrimination, and group discrimination would predict the
individual intention to leave a STEM job. To test the hypothesis, we performed a series

32
of hierarchical linear regression analyses. In the first step of the regression analysis, we
added five predictors: gender, the need to belong, self-esteem, personal discrimination,
and group discrimination. In the second step, we added an interaction of the need to
belong and self-esteem to examine whether the interaction term explained a significant
amount of the variance in the intention to leave a job over and above the predictors in the
first step.
In support of Hypothesis 1, we found that all five predictors showed a statistically
significant main effect in predicting the intention to leave a job. The five predictors
together accounted for 26% of the intention to leave a job, F(5, 150) = 10.34, p < .001
(see Table 4).
Table 4
All Participants Hierarchical Linear Regression Coefficients
Predictors
β p
Step 1 Step 2
Gender -.15 .07
Need to Belong .08 .27
Self-Esteem -.34 < .001
Personal
Discrimination .27 .01
Group
Discrimination -.01 .94
Need to Belong
× Self-Esteem -.91 .06
R2 .26 .28
ΔR2 .02
F 10.34***
9.40***
.
Note. Dependent Variable: The intention to leave a job, N = 154. *p < .05.
**p < .01.
***p < .001., two-tailed.

33
Specifically, self-esteem, β = -0.34, p < .001, and personal discrimination, β =
0.27, p = .01, contributed significantly to the intention to leave a job with all samples.
However, the interaction of the need to belong and self-esteem in the entire sample did
not contribute significantly to the intention to leave a job. Gender, the need to belong,
self-esteem, personal discrimination, group discrimination, and the interaction term
together accounted for 28% of the intention to leave a job, F(6, 149) = 9.40, p < .001.
Female regression statistics. The hypothesis 1a was that STEM women’s need
to belong, self-esteem, personal discrimination, and group discrimination would predict
their intention to leave a job. In the hypothesis 2, we hypothesized that the interaction
between STEM women’s self-esteem and need to belong would explain an additional
variance in their intention to leave a job. To test these hypotheses, we conducted a
hierarchical linear regression analysis with STEM women’s data (see Table 5). We
added STEM women’s need to belong, self-esteem, personal discrimination, and group
discrimination in the first step to hold them constant and the need to belong and self-
esteem interaction in the second step.
As a result, we found that need to belong, self-esteem, personal discrimination,
and group discrimination of STEM women together accounted for 32% of the variance in
the intention to leave a job of STEM women, F(4, 44) = 5.09, p = .002. Among
predictors, group discrimination, β = -0.44, p = .003, and self-esteem, β = -0.37, p = .01,
contributed significantly to the intention to leave a job. We found that the STEM women
with low self-esteem and the STEM women with less group discrimination were more
likely to have a strong intention to leave their job.

34
Moreover, the interaction between the need to belong and self-esteem accounted
for 6% additional variance in the intention to leave a job of STEM women, F(1, 43) =
4.41, p = .04. To analyze the interaction effect of the need to belong with self-esteem on
the intention to leave a job, we created a scatter plot graph. The nature of strength in the
relationship between the self-esteem and the intention to leave a job changed depending
upon the level of need to belong (See Table 5 and Figure 1).
Table 5
Hierarchical Linear Regression Coefficients in Males and Females
Male Female
Predictors β
p β
p Step 1 Step 2 Step 1 Step 2
The Need to Belong .09 .30 -.10 .47
Self-Esteem -.28 .002 -.37 .01
Personal
Discrimination .34 .01 .09 .55
Group
Discrimination .08 .52 -.44 .003
Need to Belong
× Self-Esteem -.56 .25 -.32 .04
R2 .36 .37 .32 .38
ΔR2 .008 .25 .06 .04
F 14.07***
1.33 5.09**
4.41*
Note. Dependent variable: The intention to leave a job, Male, N = 106, Female, N = 49. *p < .05.
**p < .01.
***p < .001., two-tailed.
The relationship between self esteem and leaving intention was more negative
among women with high need to belong compared to women with low need to belong.
The need to belong might buffer the effect of self-esteem on the intention to leave a job.

35
The main effect of the need to belong was not statistically significant. However, the
result supported hypothesis 2 that the interaction of the need to belong and self-esteem of
STEM women may explain an additional variance in the intention to leave a job over and
above the variables in the first step of the regression analysis.
Figure 1. The Interaction Effect of the Need to Belong (NTB) and Self-Esteem on the
Intention to Leave a Job for STEM women
Male regression statistics. To compare STEM women’s result to STEM men’s
result, we conducted a hierarchical linear regression analysis for STEM men. We added
need to belong, self-esteem, personal discrimination, and group discrimination of STEM
Inte
nti
on
to
Le
ave
a J
ob

36
men in the first step and the need to belong and self-esteem interaction of STEM men in
the second step. We found that four predictors accounted for 36% of the variance in the
intention to leave a job of STEM men, F(4, 101) = 14.07, p < .001 (see Table 5). The
interaction of the need to belong with self-esteem of STEM men accounted for 1% of an
additional variance in the intention to leave a job, which was not statistically significant,
F(1, 100) = 1.33, p = .25. Overall, the interaction regression model of STEM men
accounted for 37% of the intention to leave a job, F(5, 100) = 11.55, p < .001. Among
predictors, self-esteem, β = -0.28, p = .002, and personal discrimination, β = 0.34, p = .01,
contributed significantly to the intention to leave a job of STEM men.
Discussion
The current research began with the question of why girls and women are
underrepresented in STEM fields. To investigate this issue, we hypothesized that
environmental threats from being in a STEM field and psychological threats from
discrimination, stigma, and stereotype experiences negatively influence the need to
belong, self-esteem, and perceived discrimination of STEM women and thus increase the
intention to leave a STEM job.
The findings were interesting. First, we found that the regression model of the
intention to leave a job with four predictors supported our hypotheses. Gender, personal
or group discrimination experience and lowered self-esteem contributed to the intention
of STEM individuals to leave their job in the overall sample. Even though the
contribution of each factor differed in the regression model, we concluded that the
psychological factors predicted the intention to leave a job (Hypothesis 1).

37
Next, the contribution of self-esteem and perceived group discrimination were
significant in the intention to leave a job for STEM women (Hypothesis 1a). For STEM
men, however, self-esteem and perceived personal discrimination were significant
predictors (Hypothesis 1b). We believe these results relate to the personal-group
discrimination discrepancy phenomenon in that stigmatized group members tend to
minimize personal discrimination experience compared to group discrimination
experience to increase a chance of being accepted by members in the field to which they
belonged (Taylor et al., 1990).
Moreover, STEM women with low self-esteem and low group discrimination had
a greater tendency to report the intention to leave their job (Hypothesis 1a). The result
was different from that predicted by our hypothesis that a high level of group
discrimination would predict a high level of intention to leave a job. This finding might
result from cultural differences between South Asian countries and North American
countries because about 50% of STEM women in our study lived in South Asia where the
caste system has survived (e.g., Ciotti, 2010; Grill & Stewart, 2011; International Dalit
Solidarity Network, 2009).
The STEM women in South Asia may experience discrimination due to the caste
system, which is a hierarchical social stratification system. The segregation of the caste
system limits one’s occupational opportunities based on social status (International Dalit
Solidarity Network, 2009). The caste system limits women’s roles to household care and
child rearing and blocks access to educational opportunities, trainings, and resources
(Grill & Stewart, 2011). Thus, the significant association between low group
38
discrimination and high intention to leave a job might reveal social obstacles that STEM
women in South Asia face (Adsul & Kamble, 2008). However, the influence of the
social barriers for STEM women is beyond the scope of the present research, and future
researchers need to investigate this topic.
For STEM men, self-esteem and personal discrimination were significant
predictors of the intention to leave a job (Hypothesis 1b). The STEM men with low self-
esteem and high personal discrimination reported a greater tendency to leave a job. The
interesting result was that men’s personal discrimination experience was a critical factor
that contributed to their intention to leave a job. A possible clue that helps explain the
relation between personal discrimination and the intention to leave a job is that about 40%
of male participants reported English as their second language. Thus, some male
participants were foreign-born employees or members of immigrant families. If some
STEM men were immigrants, they may have experienced personal discrimination due to
their ethnicities, cultural differences, or language barriers (Shin, 2006; Zeng & Xie, 2004).
Further investigations could provide more explanations about personal discrimination of
STEM men.
The next finding concerned the interaction between the need to belong and self-
esteem, but it was significant only in women (Hypothesis 2). The interaction between the
need to belong and self-esteem of STEM women explained an additional variance in the
intention to leave a job over and above either factor alone. The association between self-
esteem and the intention to leave a job was stronger for women who had an unfulfilled
need to belong than for women who had a fulfilled need to belong. Thus, we suggest that

39
the STEM women with low self-esteem tend to leave their jobs more often when they
could not fulfill their need to belong in STEM fields. In addition, the significant
interaction effect of self-esteem and the need to belong may relate to sociometer theory.
Sociometer Theory and the Protecting Role of the Self-Esteem Theory
In our study, when STEM women had an unfulfilled need to belong and low self-
esteem, the intention to leave a job increased. In other words, the effect of self-esteem on
the intention to leave a job was stronger when the need to belong was at a high level
rather than a low level. The interaction between self-esteem and the need to belong
might be supporting evidence for the sociometer theory.
In terms of the relatively high levels of self-esteem of STEM women that Crocker
and Majors (1989) found in stigmatized individuals, our result also showed a similar
tendency. According to Crocker and Major, stigmatized individuals (e.g., women,
African-Americans, other minorities) tend to report higher self-esteem compared to their
counterparts (e.g., men, European-Americans, other majorities) because stigmatized
individuals might use self-esteem to protect themselves from discrimination. In our study,
self-esteem of STEM women was slightly higher compared to self-esteem of STEM men,
although the difference was not statistically significant.
Meanwhile, our result regarding the gender difference in the intention to leave a
job was contrary to our hypothesis that STEM women would report higher levels of the
intention to leave a job compared to STEM men. STEM men in our study reported a
strong desire to leave their current STEM jobs. We belived that this result might relate to
the previous finding that STEM workers, including males, tend to leave their job more

40
frequently compared to non-STEM workers in other industries (e.g., Shropshire & Kadlec,
2012). Thus, future researchers need to investigate this issue, as it may lead to problems
in STEM industries.
Limitations
As with all studies, the current study had some limitations. First, many predictors
of turnover intentions were not included in the present study. For example, previous
studies consistently found job satisfaction and organizational commitment as significant
psychological determinants of employee turnover intentions (for an overview, see Cohn,
2000; George & Jones, 1996). In addition, job factors (e.g., job demand, role conflict,
supervisor, and co-worker social support) and organizational factors (e.g., corporate fit,
rewards, work and family balance) were significantly related to turnover intentions in
previous research (Carayon, Schoepke, Hoonakker, Haims, & Brunette, 2006). For
STEM individuals, career training and development opportunities were important
predictors (Igbaria & Wormley, 1992). Therefore, future researchers need to add more
predictor to account for their influence to turnover intentions.
Second, using the Amazon Mechanical Turk (MTurk) sample has its benefits as
well as weaknesses. A benefit of using MTurk and administering the survey via the
World Wide Web that we collected data from around the world in a relatively short
period. This created some doubts about whether the MTurk sample represented a general
population, even though there was evidence of proper reliabilities (Burmester et al.,
2011). For example, about half of participants lived in South Asia; cultural differences
might have confounded our results. Future researchers need to consider the possible
41
confounding variables when they recruit participants using the Internet. The other
weakness of the MTurk sample was that characteristics of MTurk workers were not fully
discovered. This online labor market service is a brand new system. We have not
uncovered users’ characteristics in the current research. Future researchers need to study
the MTurk users to improve the quality of studies.
Another limitation was the relatively small sample size. The total STEM
participants equaled 174 of which 54 participants were women. A larger sample would
increase statistical power. In addition, most STEM women were either Asian or White.
With various ethnicities including African-American and Hispanic women in STEM
fields, future researchers could suggest more meaningful explanations about the gender
disparity in STEM fields.
Implications
In our regression model for women, the need to belong turned out to be a
significant moderator of the relation between self-esteem and the intention to leave a job
rather than a critical predictor of the intention to leave a job. The need to belong
appeared to buffer the influence of self-esteem on STEM women’s turnover intention.
Because of this result, we proposed that interventions aimed at increasing the feelings of
belonging for STEM women might be effective in terms of buffering the influence of low
self-esteem on the intention to leave a job (Chesler & Chesler, 2002). In addition, we
believe that the intervention aimed at increasing the need to belong might be beneficial
because the level of the need to belong would be changed by extrinsic resources and

42
efforts (Holleran, Whitehead, Shmader, & Mehl, 2011; Stout et al., 2011; Walton &
Cohen, 2011).
Therefore, we suggest that an educational intervention with women role models
might increase STEM women’s self-esteem and reduce the intention to leave STEM
majors. For example, Stout et al. (2011) tested the stereotype inoculation model and
found that when women encountered other women who were experts in STEM fields,
women expressed positive implicit identifications with STEM disciplines, exerted effort
on difficult math tests, and felt efficacious about their abilities and future performance.
Introducing STEM women role models to girls and women might help increase the
feelings of connectedness between women experts and the self, which in turn promotes
self-esteem and self-efficacy and increases the opportunities to choose STEM careers in
the future (Dasgupta, 2011; Stout et al., 2011).
Moreover, social psychological interventions led by STEM companies might
reduce discrimination and prejudice from a longitudinal perspective. It is difficult to
reduce discrimination and prejudice because they are subtle, implicit, and connected to
stereotypes. However, by creating an egalitarian atmosphere (e.g., equal work
opportunities, equal promotion benefits, equal salaries) and by creating micro team
cultures that give various identities to workers in STEM fields, STEM companies and
organizations could offer indirect support to STEM women (Cohen, Garcia, Apfel, &
Master, 2006; Holleran et al., 2011; Logel et al., 2009; Lyness & Thompson, 2000;
Walton & Cohen, 2007, 2011)

43
Future Directions
Future researchers need to retest the current regression model with more
heterogeneous samples from off-line places, such as STEM companies and universities,
to overcome the limitation of the Mturk sample. In addition, future researchers could
include detailed demographic information in the main analyses. We did not examine
differences in different demographic groups (e.g., ethnicity, location, work history,
education, relationship status) because these factors exceeded the scope of the current
research.
Moreover, we did not consider developmental aspects of careers. Future
researchers need to consider collecting more detailed career behaviors and history, such
as the reasons and goals for the intention for staying or leaving STEM careers. It is
necessary to also investigate STEM men’s career attitude and behaviors because they
comprise the other half of STEM fields, and their intention and attitude might influence
on STEM environments and STEM women.
We suggest that the MTurk and online survey have considerable potentials for
psychology research. They are economical and efficient. Even though the present study
has some limitations, we offer valuable evidence for STEM workers that discrimination
coupled with the need to belong and self-esteem influence the intention to leave a job.

44
References
Adsul, R. K., & Kamble, V. (2008). Achievement motivation as a function of gender,
economic background and Caste differences in college students. Journal of the
Indian Academy of Applied Psychology, 34, 323-327.
Anthony, D. B., Wood, J. V., & Homes, J. G. (2007). Testing sociometer theory: Self-
esteem and the importance of acceptance for social decision-making. Journal of
Experimental Social Psychology, 43, 425-432. doi:10.1016/j.jesp.2006.03.002
Baron-Cohen, S. (2003). The essential difference: Men, women, and the extreme male
brain. New York, NY: Penguin Basic Books.
Baumeister, R. F. (Ed.). (1999). The self in social psychology. Philadelphia, PA:
Psychology Press.
Baumeister, R. F., & Leary, M. R. (1995). The need to belong: Desire for interpersonal
attachments as fundamental human motivation. Psychological Bulletin, 117, 497-
529.
Birbaumer, A., Lebano, A., Ponzellini, A., Tolar, M., & Wagner, I (2007). From the
margins to a field of opportunities: Life story patterns of women in ICT. Women’s
Studies International Forum, 30, 486-498. doi:10.1016/j.wsif.2007.09.001
Bluedorn, A. C. (1982). The theories of turnover: Causes, effects, and meaning. In S. B.
Bacharach (Ed.), Research in the sociology of organizations (Vol. 1, pp. 75–128).
Greenwich, CT: JAI Press.
Burmester, M., Kwant, T., & Gosling, S. D. (2011). Amazon’s mechanical turk: A new
source of inexpensive, yet high-quality, data? Perspectives on Psychological
Science, 6, 3-5. doi:10.1177/1745691610393980
Campbell, J. D., Chew, B., & Scratchley, L. S. (1991). Cognitive and emotional reactions
to daily events: The effects of self-esteem and self-complexity. Journal of
Personality, 59, 473-505.
Carayon, P., Schoepke, J., Hoonakker, P. L. T., Haims, M. C., & Brunette, M. (2006).
Evaluating causes and consequences of turnover intention among IT workers: the
development of a questionnaire survey. Behavior & Information Technology, 25,
381-397. doi:10.1080/01449290500102144

45
Carvallo, M., & Pelham, B. W. (2006). When fiends become friends: The need to belong
and perceptions of personal and group discrimination. Journal of Personality and
Social Psychology, 90, 94-108. doi: 10.1080/13594320902847927
Cascio, W. F. (1982). Costing human resources: The financial aspect of human bhavior
in organization. Boston: PWS-Kent.
Ceci, S. J., & Williams, M. W. (2010a). Sex differences in math-intensive fields. Current
Directions in Psychological Science, 19, 275-
279. doi:10.1177/0963721410383241
Ceci, S. J., & Williams, M. W. (2010b). The mathematics of sex: How biology and
society conspire to limit talented women and girls. New York, NY: Oxford
University Press.
Ceci, S. J., Williams, W. M., & Barnett, S. M. (2009). Women’s underrepresentation in
science: Sociocultural and biological considerations. Psychological Bulletin, 135,
218-261. doi:10.1177/0963721410383241
Cheek, J. M., & Buss, A. H. (1981). Shyness and sociability. Journal of Personality and
Social Psychology, 41, 330-339.
Cheryan, S., Plaut, V. C., Davies, P. G., & Steele, C. M. (2009). Ambient belonging:
How stereotypical cues impact gender participation in computer science. Journal
of Personality and Social Psychology, 97, 1045-1060. doi: 10.1037/a0016239
Chesler, M. A., & Chesler, N. C. (2002). Gender-informed mentoring strategies for
women engineering scholars: On establishing a caring community. Journal of
Engineering Education, 91, 49-55.
Ciotti, M. (2010). Futurity in words: Low caste women political activists' self-
representation and post-Dalit scenarios in north India, Contemporary South Asia,
18, 43-56, doi:10.1080/09584930903561622
Cohen, G. L., Garcia, J., Apfel, N., & Master, A. (2006, September). Reducing the racial
achievement gap: A social-psychological intervention. Science, 313, 1307-1318.
Cohn, A. (2000). The relationship between commitment forms and work outcomes: A
comparison of three models. Human Relations, 53, 387-417.
Coopersmith, S. (1967). The antecedents of self-esteem. SF, CA: Freeman.
46
Costa, P. T. Jr., & McCrae, R. R. (1992). Revised NEO Personality Inventory:
Professional manual. Odessa, FL: Psychological Assessment Resources.
Costello, C. B. (2012). Increasing opportunities for low-income women and student
parents in science, technology, engineering, and math at community colleges.
Retrieved from Institute for Women’s Policy Research:
http://www.iwpr.org/initiatives/student-parent-success-initiative/resources-
publications
Crandall, R. (1973). The measurement of self-esteem and related constructs. In J.
Robinson & P. Shaver (Eds.), Measures of social psychological attitudes (pp. 45-
167). Ann Arbor, MI: Institute for Social Research.
Crocker, J., & Major, B. (1989). Social stigma and self-esteem: The self-protective
properties of stigma. Psychological Review, 96, 608-630.
Crocker, J., Voelkl, K., Testa, M., & Major, B. (1991). Social stigma: The affective
consequences of attributional ambiguity. Journal of Personality and Social
Psychology, 60, 218-228. doi:10.1037/0022-3514.60.2.218
Crosby, F. (1982). Relative deprivation and working women. New York, NY: Oxford
University Press.
Dasgupta, N. (2011). Ingroup experts and peers as social vaccines who inoculate the self-
concept: The stereotype inoculation model. Psychological Inquiry, 22, 231-246.
doi:10.1080/1047840X.2011.607313
De Cremer, D., & Leonardelli, G. J. (2003). Cooperation in social dilemmas and the need
to belong: The moderating effect of group size. Group Dynamics: Theory,
Research, and Practice, 7, 168-174. doi:10.1037/1089-2699.7.2.168
Derks, B., Inzlicht, M., & Kang, S. (2008). The neuroscience of stigma and stereotype
threat. Group Processes & Intergroup Relations, 11, 163 – 181.
doi:10.1177/1368430207088036
Dosi, G. (1982). Technological paradigms and technological trajectories: A suggested
interpretation of the determinants and directions of technological change.
Research Policy,11,147-162.
Eccles, J. S. (1987). Gender roles and women's achievement-related decisions.
Psychology of women Quarterly,11,135-172.

47
Eccleston, C. P., & Major, B. (2006). Attributions to discrimination and self-esteem: The
role of group identification and appraisals. Group Processes and Intergroup
Relations, 9,147-162. doi:10.1177/1368430206062074
Feist, G. J. (2006). The development of scientific talent in westinghouse finalists and
members of the national academy of sciences. Journal of Adult Development, 13,
23-35. doi:10.1007/s10804-006-9002-3
Feist, G. J. (2011). Psychology of science as a new subdiscipline in psychology. Current
Direction in Psychological Science, 20, 330-334. doi:10.1037/1089-2680.10.2.92
Feist, G. J. (2012). Gender, science, and the psychology of science. In N. Kumar (Ed.),
Women in science: Is the glass-ceiling disappearing? New Delhi, India: Oxford
Press India.
Fouad, N. A., Hackett, G., Smith, P. L., Kantamneni, N., Fitzpatrick, M., Haag, S., &
Spencer, D. (2010). Barriers and supports for continuing in mathematics and
science: Gender and educational level differences. Journal of Vocational
Behavior, 77, 361-373. doi:10.1016/j.jvb.2010.06.004
Gardner, D. G., & Pierce, J. L. (2001). Self-esteem and self-efficacy within the
organizational context: A replication. Journal of Management System, 13, 31-48.
George, J. M. & Jones, G. R. (1996). The experience of work and turnover intentions:
Interactive effects of value attainment, job satisfaction, and positive mood.
Journal of Applied Psychology, 81, 318-325.
Goffman, E. (1963). Stigma: Notes on the management of spoiled identity. New York,
NY: Prentice Hall.
Good, C. D., Rattan, A., & Dweck, C. S., (2012). Why do women opt out? Sense of
belonging and women’s representation in mathematics. Journal of Personality
and Social Psychology, 102, 700-717. doi: 10.1037/a0026659
Greenhaus, J. H., Badin, I. J. (1974). Self‐esteem, performance, and satisfaction: Some
tests of a theory, Journal of Applied Psychology,54,722‐726.
Grill, R., & Stewart, D. (2011). Relevance of gender-sensitive policies and general health
indicators to compare the status of South Asian women's health. Women's Health
Issues, 21, 12-18. doi:10.1016/j.whi.2010.10.003
Harpern, D. F., Benbow, C. P., Geray, D. C., Gur, R., Hyde, J. S., & Grensbacher, M. A.
(2007). The science of sex difference in science and mathematics. Psychological

48
Science in the Public Interest, 8, 1-51. Retrieved from
http://134.173.180.115/berger/pdf/Halpern2007.SciSexDif.Pub.pdf
Hewlett, S. A., Buck Luce, C., Servon, L. J., Sherbin, L., Shiller, P., Sosnovich, E., &
Sumberg, K. (2008). The Athena Factor: Reversing the Brain Drain in Science,
Engineering, and Technology (Product no. 10094). New York: Center for Work-
Life Policy. Retrieved from
http://rachelappel.com/media/downloads/w_athena_factor.pdf
Holleran, S. E., Whitehead, J., Schmader, T., & Mehl, M. R. (2011). Talking shop and
shooting the breeze: A study of workplace conversation and job disengagement
among STEM faculty. Social Psychological and Personality Science, 2, 65-71.
doi:10.1177/1948550610379921
Hoyt, C. L., Aguilar, L., Kaiser, C. R., Blascovich, J., & Lee, K. (2007). The self-
protective and undermining effect of attributional ambiguity. Journal of
Experimental Social Psychology, 43, 884-893. doi:10.1016/j.jesp.2006.10.013
Igbaria, M. & Wormley, W. M. (1992). Organizational experiences and career success of
MIS professionals and managers: An examination of race differences. MIS
Quarterly, 16, 507-529.
Igbaria, M., & Greenhaus, J. H. (1992). Determinants of MIS employees’ turnover
intentions: a structural equation model. Communications of the ACM, 35, 35-49.
Information Technology Association of America. (2002). Bouncing back: Jobs, skills and
the continuing demand for IT workers. ITAA Executive Summary. Retrieved from
http://www.itaa.org/workforce/studies/02execsumm.pdf
International Dalit Solidarity Network (2009). Caste-Based Discrimination in South Asia:
Situational Overview, Responses and Ways Forward. Retrieved from
http://idsn.org/fileadmin/user_folder/pdf/New_files/EU/EU_StudyWithAnnexes_
Caste_Discrimination_June2009.pdf
Inzlicht, M., & Good, C. (2006). How environments can threaten academic performance,
self-knowledge, and sense of belonging. In S. Levin, & C. van Laar (Eds.), Stigma
and group inequality; Social psychological perspective (pp. 129-150). Mahwah,
NJ: Lawrence Erbaum.
Jackson, D. N. (1967). Personality Research Form Manual. Goshen, NY: Research
Psychologists Press.

49
Jones, E. E., Farina, A., Hastforf, A. H., Markus, H., Miller, D. T., & Scott, R. (1984).
Social stigma: The psychology of marked relationships. New York, NY: Freeman.
Kelly, K. M. (1999). Measurement and manifestation of the need to belong. Unpublished
dissertation, Department of Psychology, University of Tennessee, Knoxville, TN.
Kohli, A.A. (1985). Some unexplored supervisory behaviors and their influences on
salespeople's role clarity, specific self‐esteem, job satisfaction, and motivation,
Journal of Marketing Research,22,424-433.
Langdon, D., McKittrick, G., Beede, D., & Doms, M. (2011, July). STEM: Good jobs
now and for the future (ESA Issue Brief No. 03-11). Retrieved from the U.S.
Government Department of Commerce Economics & Statistics Administration
website: http://www.esa.doc.gov/Reports/stem-good-jobs-now-and-future.
Leary, M. R. (1997). People who need people: Individual differences in the need to
belong. In D. Richardson (Chair), Sociotropic orientations. Symposium
conducted at the meeting of the Southeastern Psychological Association, Atlanta,
GA.
Leary, M. R., & Baumeister, R. F. (2000). The nature and function of self-esteem:
Sociometer theory. In M. P. Zanna (Ed.), Advances in experimental social
psychology (Vol. 32, pp. 1-62). San Diego, CA: Academic Press.
Leary, M. R., & Cottrell, K. (2001). Individual differences in the need to belong. Paper
presented at the meeting of the Society for Personality and Social Psychology.
San Antonio, TX.
Leary, M. R., & Downs, D. L. (1995). Interpersonal functions of the self-esteem motive:
The self-esteem system as a sociometer. In M. H. Kernis (Ed.), Efficacy, Agency,
and Self-Esteem (pp. 123-144). New York: Plenum Press.
Leary, M. R., Kelly, K. M., Cottrell, C. A., & Schreindorfer, L. S. (2007). Individual
differences in the need to belong: Mapping the nomological network.
Unpublished manuscript, Department of Psychology, Duke University, Durham,
NC.
Leary, M. R., Tambor, E. S., Terdal, S. K., & Downs, D. L. (1995). Self-esteem as an
interpersonal monitor: The sociometer hypothesis. Journal of Personality and
Social Psychology, 68, 518-530. Retrieved from http://dtserv2.compsy.uni-
jena.de/__C125715B003DDCFC.nsf/0/1645613A4F975087C125715D006854AA
/$FILE/leary95.pdf

50
Leary, M., & Allen, A. B. (2011). Personality and persona: Personality processes in self-
presentation. Journal of Personality, 79, 1191-1218. doi:10.1111/j.1467-
6494.2010.00704.x
Lichtenstein, G., Loshbaugh, H.G., Claar, B., Chen, H. L., Jackson, K., & Sheppard, S. D.
(2009). An engineering major does not (Necessarily) an engineer make: Career
decision making among undergraduate engineering majors. Journal of
Engineering Education, 98, 227-234.
Logel, C., Walton, G. M., Spencer, S. J., Iserman, E. C., & Hippel, W. v. (2009).
Interacting with sexist men triggers social identity threat among female engineers.
Journal of Personality and Social Psychology, 96, 1089-1103.
doi:10.1037/a0015703
Long, J. S. (Ed.). (2001). From scarcity to visibility: Gender differences in the careers of
doctoral scientists and engineers. Washington, DC: National Academy Press.
Lyness, K. S., & Thompson, D. E. (2000). Climbing the corporate ladder: Do female and
male executives follow the same route? Journal of Applied Psychology, 85, 86-
101.
MacDonald, G., & Leary, M. R. (2005). Why does social exclusion hurt? The
relationship between social and physical pain. Psychological Bulletin, 131, 202–
223. doi:10.1037/0033-2909.131.2.224
Major, B. N., & O’Brien, L. T. (2005). The social psychology of stigma. Annual Review
of Psychology, 56, 393-421. doi:10.1146/annurev.psych.56.091103.070137
Major, B., Kaiser, C. R., & McCoy, S. K. (2003). It’s not my fault: When and why
attributions to prejudice protect self-esteem. Personality and Social Psychology
Bulletin, 29, 772-781. doi: 10.1177/0146167203029006009
Major, B., Quinton, W. J., & Schmader, T. (2003). Attributions to discrimination and
self-esteem: Impact of group identification and situational ambiguity. Journal of
Experimental Social Psychology, 39, 220-231. doi:10.1016/S0022-
1031(02)00547-4
Mendoza-Denton, R., Shaw-Taylor, L., Chen, S., & Chang, E. (2009). Ironic effects of
explicit gender prejudice on women’s test performance. Journal of Experimental
Social Psychology, 45, 275-278. doi:10.1016/j.jesp.2008.08.017
Moore, J. E. (2000). One road to turnover: an examination of work exhaustion in
technology professionals. MIS Quarterly, 24, 141-168.

51
Moore, J. E., & Burke, L. (2002). How to turn around ‘turnover culture’ in IT.
Communications of the ACM, 45, 73 – 78.
Murphy, M. C., Steele, C. M, & Gross, J. J. (2007). Signaling threat: How situational
cues affect women in math, science, and engineering settings. Psychological
Science, 18, 879-885.
National Science Foundation. (1999). Women, Minorities, and Persons with Disabilities
in Science and Engineering: 1998 (NSF 99-87). Arlington, VA: National Science
Foundation.
National Science Foundation. (2004, December). Broadening participation in America’s
science and engineering workforce: The 1994-2003 decennial & 2004 biennial
reports to congress by Committee on Equal Opportunities in Science and
Engineering. Retrieved from
http://www.nsf.gov/od/ceose/reports/ceose2004report.pdf
National Science Foundation. (2009). Division of science resources statistics, women,
minorities, and persons with disabilities in science and engineering (NSF 09-305),
(Arlington, VA; January 2009). Retrieved from
http://www.nsf.gov/statistics/wmpd/
National Science Foundation. (2010). Division of science resources statistics, education,
women, minorities, and persons with disabilities in science and engineering.
Retrieved April 4, 2012, from http://www.nsf.gov/statistics/women/
Nelson. T. D. (2006). The psychology of prejudice (2nd
Ed.), Boston, MA: Pearson.
Østergaard, C. R., Timmermans, B., & Kristinsson, K. (2011). Does a different view
create something new? The effect of employee diversity on innovation. Research
Policy,40, 500-509.
Pickett, C. L., Gardner, W. L., & Knowles, M. (2004). Getting a cue: The need to belong
and enhanced sensitivity to social cues. Personality and Social Psychology
Bulletin, 30, 1095-1107. doi:10.1177/0146167203262085
Pierce, J. L., & Gardner, D. G. (2004). Self-esteem within the work and organizational
context: A review of the organization-based self-esteem literature. Journal of
Management, 30, 591-622. doi:10.1016/j.jm.2003.10.001
Pontin, J. (2007, March 25). Artificial intelligence: With help from the humans. The New
York Times. Retrieved July 30 2012 from http://www.nytimes.com

52
Post-Kammer, P., & Smith, P. L. (1985). Sex differences in career self-efficacy,
consideration, and interests of eighth and ninth graders. Journal of Counseling
Psychology, 32, 551−559.
Quinn, K. A., Roese, N. J., Pennington, G. L., & Olson, J. M. (1999). The personal-group
discrimination discrepancy: The role of informational complexity. Personality
and Social Psychology Bulletin, 25, 1430-1440. Retrieved from
http://kimberlyquinn.net/QuinnEtAl_PSPB_1999.pdf
Quintana-Garca, C., & Benavides-Velasco, C. A. (2008). Innovative competence,
exploration and exploitation: The influence of technological diversification.
Research Policy,37,492-507.
Richman, L. S., & Leary, M. (2009). Reactions to discrimination, stigmatization,
ostracism, and other forms of interpersonal rejection: A dynamic, multi-motive
model. Psychological Review, 116, 365-383. doi:10.1037/a0015250
Richman, L. S., vanDellen, M., & Wood, W. (2011). How women cope: Being a
numerical minority in a male-dominated profession. Journal of Social Issues, 67,
492-509.
Rosenberg, M. (1965). Society and the adolescent self-image. Princeton. NJ: Princeton
University Press.
Rosenbloom, J. L., Ash, R. A., Dupont, B., & Coder, L. (2008). Why are there so few
women in information technology? Assessing the role of personality in career
choices. Journal of Economic Psychology, 29, 543-554.
doi:10.1016/j.joep.2007.09.005
Sadker, M., & Sadker, D. (1994). Failing at fairness: How America’s schools
shortchange girls. New York, NY: Touchstone.
Sager, J. K. (1991). The longitudinal assessment of change in sales force turnover.
Journal of the Academy of Marketing Science, 19, 25-36.
Schmitt, M. T., & Branscombe, N. R. (2002). The internal and external causal loci of
attributions to prejudice. Personality and Social Psychology Bulletin, 28, 620-628.
doi:10.1177/0146167202282006
Sechrist, G. B., & Delmar, C. (2009). When do men and women make attributions to
gender discrimination? The role of discrimination source. Sex Roles, 61, 607-620.
doi:10.1007/s11199-009-9657-x

53
Sechrist, G. B., Swim, J. K., & Mark, M. M. (2003). Mood as information in making
attributions to discrimination. Personality and Social Psychology Bulletin, 29,
524-531.
Seymour, E. (1995). The loss of women from science, mathematics, and engineering
undergraduate majors: An explanatory account. Science Education, 79, 437-473.
doi:10.1002/sce.3730790406
Shin, J. (2006). Circumventing discrimination: Gender and ethnic strategies in silicon
valley. Gender and society, 20, 177-206. doi:10.1177/0891243205285474
Shorkey, C.T., & Whiteman, V. (1977). Development of the rational behavior inventory:
Initial validity and reliability. Journal of Educational and Psychological
Measurement, 37, 527-534.
Shrauger, J. S., & Rosenberg, S. E. (1970). Self-esteem and the effects of success and
failure feedback on performance. Journal of Personality, 38, 404-417.
doi:10.1111/j.1467-6494.1970.tb00018.x
Shropshire, J., & Kadlec, C. (2012). I'm leaving the IT fields: The impact of stress, job
insecurity, and burnout on IT professionals. International Journal of Information
and Communication Technology Research, 2, 6-16.
Silber, E., & Tippett, J. (1965). Self-esteem: Clinical assessment and measurement
validation. Psychological Reports, 16, 1017-1071.
doi:10.2466/pr0.1965.16.3c.1017
Silverstone, P. H. (1991). Low self‐esteem in psychiatric conditions. British Journal of
Clinical Psychology,30,185‐198.
Spelke, E. S. (2005). Sex differences in intrinsic aptitude for mathematics and science: A
critical review. American Psychologist, 60, 950-958. doi:10.1037/0003-
066X.60.9.950
Steel, R. P., Shane, G. S., & Griffeth, R. W. (1990). Correcting turnover statistics for
comparative analysis. Academy of Management Journal, 33, 179-187.
Steele, C. M., & Aronson, J. (1995). Stereotype threat and the intellectual test
performance of African Americans. Journal of Personality and Social Psychology,
69, 797–811.
54
Steele, J., James, J. B., & Barnett, R. C. (2002). Learning in a man's world: Examining
the perceptions of undergraduate women in male-dominated academic areas.
Psychology of Women Quarterly, 26, 46-50.
Stoet, G., & Geary, D. C. (2012). Can stereotype threat explain the sex gap in
mathematics performance and achievement? Review of General Psychology, 16,
93-102. doi:10.1037/a0026617
Stout, J. G., Dasgupta, N., Hunsinger, M., & McManus, M. A. (2011). STEMing the tide:
Using ingroup experts to inoculate women’s self-concept in science, technology,
engineering, and mathematics (STEM). Journal of Personality and Social
Psychology, 100, 255-270. doi:10.1037/a0021385
Taylor, D. M., Wright, S. C., Moghaddam, F. M., & Lalonde, R. N. (1990). The personal-
group discrimination discrepancy: Perceiving my group, but not myself, to be a
target for discrimination. Personality and Social Psychology Bulletin, 16, 254-262.
doi:10. 1037/0022-3514.90.1.94
U. S. Department of Labor. (2010). Standard occupational classification and coding
structure user guide. Retrieved from
http://www.bls.gov/soc/soc_2010_class_and_coding_structure.pdf
U.S. Congress Joint Economic Committee (2012, April). STEM education: Preparing for
the jobs of future. Retrieved from http://www.jec.senate.gov/public/
U.S. Department of Commerce and the Executive Office of the President. (2012,
February). Women in America: Indicators of social and economic well-being.
Retrieved from
http://www.whitehouse.gov/sites/default/files/rss_viewer/Women_in_America.pd
f
U.S. Department of Commerce Economics and Statistics Administration. (2011a).
Women in STEM: A gender gap in innovation. (Issue Brief No. 04-11). Retrieved
from
http://www.esa.doc.gov/sites/default/files/reports/documents/womeninstemagapto
innovation8311.pdf
U.S. Department of Commerce Economics and Statistics Administration. (2011b). STEM:
Good jobs now and for the future.(Issue Brief No. 03-11). Retrieved from
http://www.esa.doc.gov/sites/default/files/reports/documents/stemfinalyjuly14_1.
55
Vandenberg, R. J., & Nelson, J. B. (1999). Disaggregating the motives underlying
turnover intentions: When do intentions predict turnover behavior? Human
Relations, 52, 1313-1336.
Walker, S., Green, L. R., Richardson, D. R., & Hubertz, M. J. (1996, November).
Correlates of the need to belong. Paper presented at the meeting of the Society of
Southeastern Social Psychologists, Virginia Beach, VA.
Walton, G. M., & Cohen, G. L. (2007). A question of belonging: Race, social fit, and
achievement. Journal of Personality and Social Psychology, 92, 82-96.
doi:10.1037/0022-3514.92.1.82
Walton, G. M., & Cohen, G. L. (2011). A brief social-belonging intervention improves
academic and health outcomes of minority students. Science, 331, 1447-1451.
doi:10.1126/science.1198364
Waters, L. E., & Moore, K. A. (2002). Self‐esteem and coping: a comparison of new-
employed and re‐employed people. Journal of Organizational Behavior, 23,1-12.
Williams, K. D., Cheung, C. K. T., & Choi, W. (2000). Cyber ostracism: Effects of being
ignored over the Internet. Journal of Personality and Social Psychology, 79, 748-
762.
Williams, W. M. & Ceci, S. J. (2007). Introduction: Striving for perspective in the debate
on women in science. In S. J. Ceci, & W. M. Williams (Eds.), Why aren’t more
Women in science? (pp. 3-23). Washington, DC: American Psychological
Association.
Zadro, L., Williams, K. D., & Richardson, R. (2004). How low can you go? Ostracism by
a computer is sufficient to lower self-reported levels of belonging, control, self-
esteem, and meaningful existence. Journal of Experimental Social Psychology, 40,
560-567. doi:10.1016/j.jesp.2003.11.006
Zeng, Z., & Xie, Y. (2004). Asian-Americans' earnings disadvantage reexamined: The
role of place of education. American Journal of Sociology, 109, 1075-1108.

56
Appendix A
Amazon Mechanical Turk HIT List
A: Title of the current research (Attitude & Gender Toward Science)
B: The name of the current researcher (Feist Lab)
C: Compensation ($ 0.50, USD)
D: Duration of the task (20 min)

57
Appendix B
Amazon Mechanical Turk Research Description Page

58
Appendix C
Survey Monkey Informed Consent

59
Appendix D
Survey Monkey Screening Question

60
Appendix E
United States Department of Labor
Standard Occupational Classification and Coding Structure
The occupations in the SOC are classified at four levels of aggregation to suit the
needs of various data users: major group, minor group, broad occupation, and detailed
occupation. Each lower level of detail identifies a more specific group of occupations.
The 23 major groups, listed below, are divided into 97 minor groups, 461 broad
occupations, and 840 detailed occupations.
(23 major groups)
1. Management
2. Business and Financial Operations
3. Computer and Mathematical (Qualified)
4. Architecture and Engineering (Qualified)
5. Life, Physical, and Social Science (Qualified)
6. Community and Social Services
7. Legal
8. Education, Training, and Library
9. Arts, Design, Entertainment, Sports, and Media
10. Healthcare Practitioners and Technical
11. Healthcare Support
12. Protective Service
13. Food Preparation and Serving Related
14. Building and Grounds Cleaning and Maintenance
15. Personal Care and Service
16. Sales and Related
17. Office and Administrative Support
18. Farming, Fishing, and Forestry
19. Construction and Extraction
20. Installation, Maintenance, and Repair
21. Production
22. Transportation and Material Moving
23. Military Specific
Note. Computer & Mathematics, Architecture, Engineering, Life Science, Physical
Science are qualified STEM fields to participate in this research.
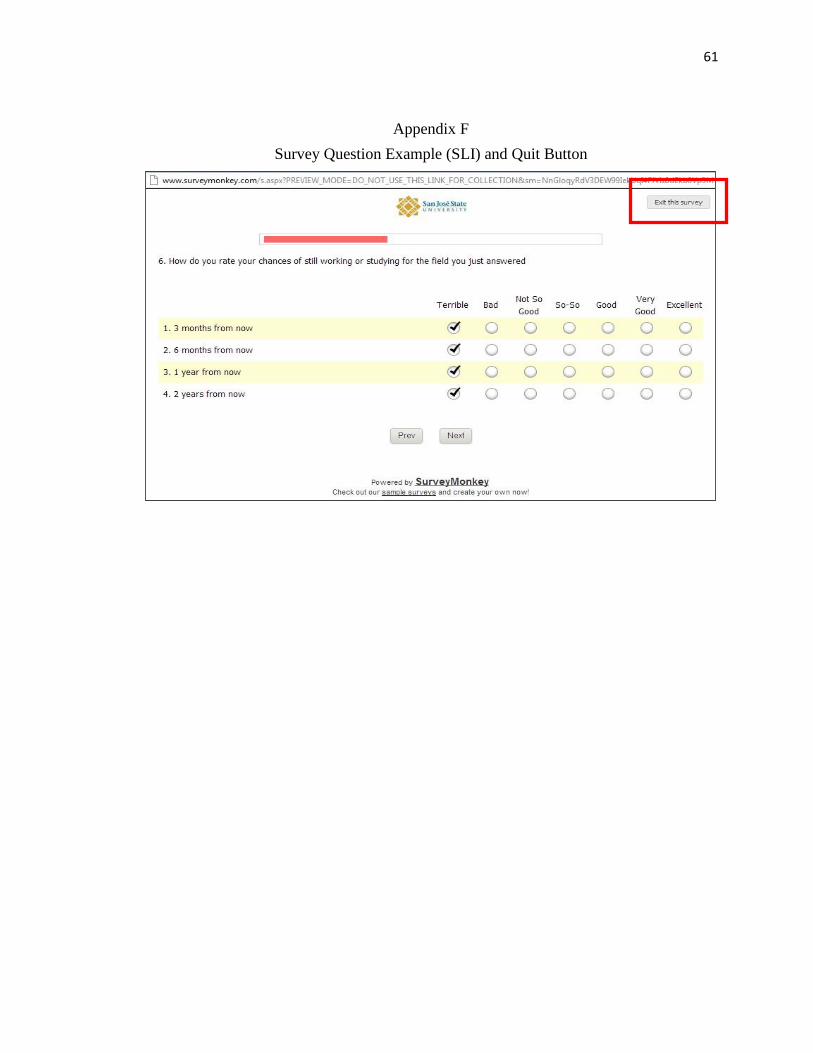
61
Appendix F
Survey Question Example (SLI) and Quit Button

62
Appendix G
The Need to Belong Scale
NTB
For each of the statements below, indicate the degree to which you agree or
disagree with the statement by writing a number in the space beside the question using
the scale below:
1 = Strongly disagree
2 = Moderately disagree
3 = Neither agree nor disagree
4 = Moderately agree
5 = Strongly agree
_____ 1. If other people don't seem to accept me, I don't let it bother me.
_____ 2. I try hard not to do things that will make other people avoid or reject me.
_____ 3. I seldom worry about whether other people care about me.
_____ 4. I need to feel that there are people I can turn to in times of need.
_____ 5. I want other people to accept me.
_____ 6. I do not like being alone.
_____ 7. Being apart from my friends for long periods of time does not bother me.
_____ 8. I have a strong need to belong.
_____ 9. It bothers me a great deal when I am not included in other people's plans.
____ 10. My feelings are easily hurt when I feel that others do not accept me.
Note. Leary, M. R., Kelly, K. M., Cottrell, C. A., & Schreindorfer, L. S. (2007).
Individual differences in the need to belong: Mapping the nomological network.
Unpublished manuscript, Department of Psychology, Duke University, Durham, NC.

63
Appendix H
The Rosenberg Self-Esteem Scale
RSE
Below is a list of statements dealing with your general feelings about yourself. If you
strongly agree, circle SA. If you agree with the statement, circle A. If you disagree, circle D. If
you strongly disagree, circle SD.
1. On the whole, I am satisfied with myself. SA A D SD
2.* At times, I think I am no good at all. SA A D SD
3. I feel that I have a number of good qualities. SA A D SD
4. I am able to do things as well as most other people. SA A D SD
5.* I feel I do not have much to be proud of. SA A D SD
6.* I certainly feel useless at times. SA A D SD
7. I feel that I’m a person of worth, at least on
an equal plane with others. SA A D SD
8.* I wish I could have more respect for myself. SA A D SD
9.* All in all, I am inclined to feel that I am a failure. SA A D SD
10. I take a positive attitude toward myself. SA A D SD
Note. Scoring: SA=3, A=2, D=1, SD=0. Items with an asterisk are reverse scored, that is,
SA=0, A=1, D=2, SD=3. Sum the scores for the 10 items. The higher the score, the
higher the self-esteem.
Rosenberg, M. (1965). Society and the adolescent self-image. Princeton. NJ: Princeton
University Press.

64
Appendix I
Perception of Personal Discrimination and Perception of Group Discrimination
PPD & PGD
Please indicate the degree to which you agree or disagree with the statement.
Strongly Agree (7) / Moderately Agree (6) / Slightly Agree (5) / Neither Agree Nor Disagree (4)
/ Slightly Disagree (3) / Moderately Disagree (2) / Strongly Disagree (1)
a. Perceptions of Personal Discrimination
1. Prejudice against my gender group has affected me personally
2. I have personally experienced gender discrimination
3. I have often been treated unfairly because of my gender
4. Because of gender discrimination, I have been deprived of opportunities that are
available to women (men)
b. Perceptions of Group Discrimination
1. Prejudice against my gender group has affected the average female (male)
2. The average female (male) has experienced gender discrimination
3. The average female (male) has often been treated unfairly because of her gender
4. Because of gender discrimination, the average female has been deprived of
opportunities that are available to men (women)
Note. Carvallo, M., & Pelham, B. W. (2006). When friends become friends: The need to
belong and perceptions of personal and group discrimination. Journal of Personality and
Social Psychology, 90, 94-108.
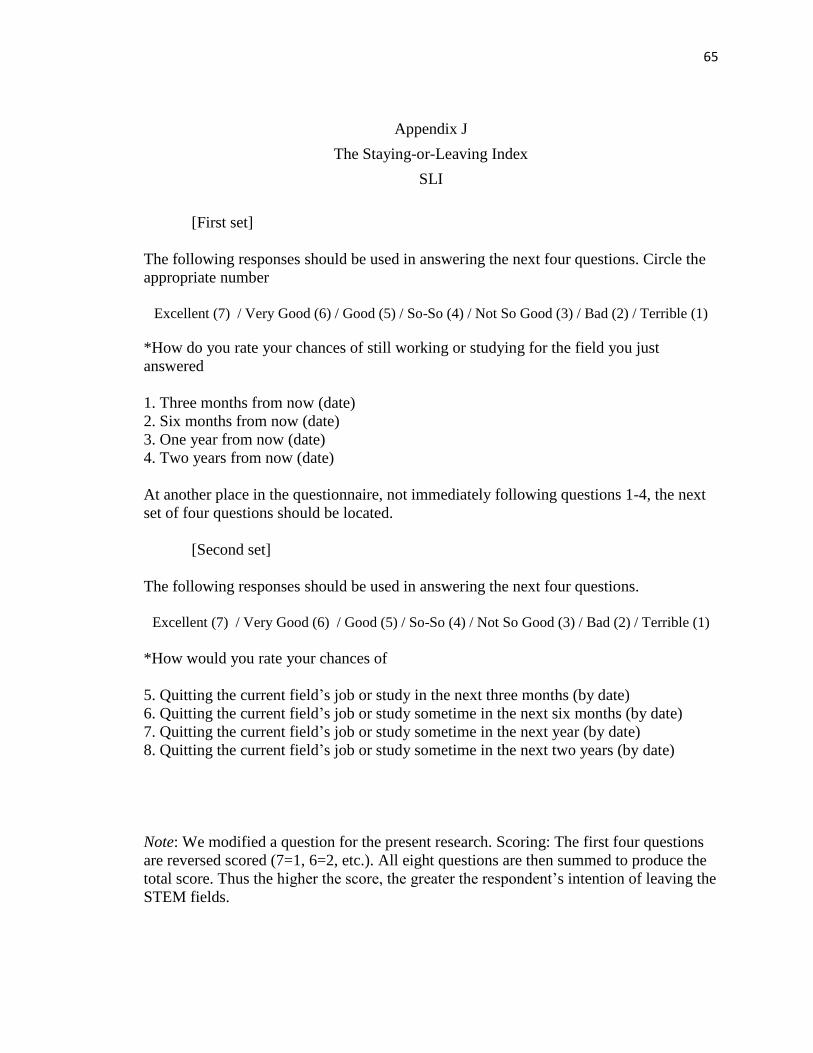
65
Appendix J
The Staying-or-Leaving Index
SLI
[First set]
The following responses should be used in answering the next four questions. Circle the
appropriate number
Excellent (7) / Very Good (6) / Good (5) / So-So (4) / Not So Good (3) / Bad (2) / Terrible (1)
*How do you rate your chances of still working or studying for the field you just
answered
1. Three months from now (date)
2. Six months from now (date)
3. One year from now (date)
4. Two years from now (date)
At another place in the questionnaire, not immediately following questions 1-4, the next
set of four questions should be located.
[Second set]
The following responses should be used in answering the next four questions.
Excellent (7) / Very Good (6) / Good (5) / So-So (4) / Not So Good (3) / Bad (2) / Terrible (1)
*How would you rate your chances of
5. Quitting the current field’s job or study in the next three months (by date)
6. Quitting the current field’s job or study sometime in the next six months (by date)
7. Quitting the current field’s job or study sometime in the next year (by date)
8. Quitting the current field’s job or study sometime in the next two years (by date)
Note: We modified a question for the present research. Scoring: The first four questions
are reversed scored (7=1, 6=2, etc.). All eight questions are then summed to produce the
total score. Thus the higher the score, the greater the respondent’s intention of leaving the
STEM fields.

66
Appendix K
Demographic Questionnaire
1. Are you? Male / Female
2. How old are you? ( ) years old
3. Where do you live?
o North America (Canada, Mexico, USA)
o South America
o East Asia (China, Japan, Korea)
o South Asia (Other Asia)
o Europe
o Africa
o Middle East
4. What is the highest level of education you have completed?
o Grade school or less (Grade 1-8)
o High school graduate or GED
o Some college or Associates degree (A.A./A.S.)
o Bachelor’s level degree (B.A./B.S.)
o Master’s level degree
o Doctoral degree or higher
5. How many years you have been in the field you just answered? ( ) years
6. What’s your relationship status?
o Single (Never been married)
o Married
o Divorced, separated, or widowed
o Engaged
o Cohabiting (A member of an unmarried couple)
7. What’s your ethnicity?
o American Indian/ Alaskan Native
o Asian/ Asian American
o Black/ African American
o Hawaiian/ Other Pacific Islander
o Hispanic/ Latino (Latina)
o White/ European or European American
o Other
8. Please indicate the degree to which you satisfied your job or major (5-point Likert type
scale, 1 = Strongly Dissatisfied to 5 = Strongly Satisfied)