Women and Power: Unpopular, Unwilling, or Held Back?web.mit.edu/urbeconlab/8 Women and...
36
* *
Transcript of Women and Power: Unpopular, Unwilling, or Held Back?web.mit.edu/urbeconlab/8 Women and...
Women and Power: Unpopular, Unwilling, or Held
Back?
Pablo Casas-Arce
Arizona State University
Albert Saiz
Massachusetts Institute of Technology
∗
Abstract
We delineate three mechanisms that could explain women's under-representation
in electoral lists and political power: voter demand, candidate supply, and internal
party dynamics. We use Spain's Equality Law, which mandates a 40 percent female
quota on electoral lists, to test these alternative theories. The law was enacted by the
Social-Democratic Party after the surprise parliamentary electoral results following the
Madrid terrorist bombings in 2004. It was therefore completely unexpected by local
political organizations. The quota only applied to towns with populations above 5,000
and forced heterogeneous growth in the number of female candidates by party. Using
pre- and post-quota data by party and municipality, we implement a triple-di�erence
design and �nd that female quotas resulted in slightly better electoral results for the
parties that started out with fewer women, and hence were most a�ected by the quota.
Our evidence is not consistent with the existence of pro-male voter preferences, or
with the hypothesis that the best female candidates e�ectively available to the parties
displayed poor quality as politicians.
JEL: J16, J71
Keywords: female political representation
∗We thank the editor, two referees, Manuel Bagues, Pamela Campa, Sonia Bhalotra, and seminar par-ticipants at IESE, Northeastern University, Ohio State University, Universitat Pompeu Fabra, Universitatde Barcelona, and conference participants at AEDE 2010, COSME 2011, PEUK 2011, Simposio de AnalisisEconomico 2011, and EEA-ESEM 2012 for their thoughtful comments. Casas-Arce acknowledges supportfrom the Ministerio de Ciencia y Tecnología (SEJ2007-64340). Casas-Arce: [email protected]; Saiz:[email protected].
1 Introduction
In most of the world's democracies, men are largely over-represented in powerful positions
in the public and private arenas. Several reasons may explain why women do not reach
in�uential positions more often. Women may be discriminated against by insiders occu-
pying powerful positions, who historically have been men. Women may prefer alternative
occupations, perhaps because they o�er a better balance between professional and personal
life. This could potentially leave a less competitive pool of available female candidates.
Additionally, in the case of political representation, voters may have preferences for male
representatives. Parties would therefore rationally respond to this bias by �elding fewer
women candidates.
We argue that it is possible to test among these hypotheses by looking at the e�ects
of introducing female candidate quotas. If local party leaders do not discriminate against
women, they should choose their candidates to maximize electoral results. We would only
observe fewer women than men if either there were not enough available high-quality female
candidates, or if their voters preferred male politicians. Hence, any constraint imposed by
female quotas on the party's selection of candidates should result in worse electoral outcomes.
In contrast, internal party dynamics may lead to female under-representation on some
candidate lists at the expense of electoral results. In this case, female quotas should increase
the voting shares of parties that were �elding fewer female candidates than would be optimal
for voters. Hence, constraints on the discretion of male party elites or on the internal
processes that cast women aside would yield better outcomes for the party as a whole.
We exploit an exogenous change in electoral rules to test whether quotas can indeed
improve the electoral results of a�ected parties. Spain's Equality Law was passed in 2007
to promote gender parity. The passage of the law�an indirect e�ect of the Madrid terrorist
bombings�had been completely unanticipated by local political parties, candidates, and
voters. It required parties to �eld lists for local elections with a minimum of 40 percent
female candidates. However, the quotas only applied to municipalities with more than 5,000
inhabitants. The law e�ectively increased the presence of women in the a�ected lists by
more than 8.5 percentage points. This represented an increase of 32 percent in the number
of female candidates. Moreover, the law forced parties to maintain the same minimum
percentage of women in every �ve-position bracket of the list. As a result, the number of
women in the top �ve positions also increased by a similar amount.
Using non-quota municipalities as controls, and �rst-di�erencing vote shares by party
1
and town between 2003 and 2007, we can factor out local and party-speci�c confounders as
well as general changes in voters' attitudes toward female politicians. We �nd that parties
a�ected by the quota increased their vote share by more than their counterparts in the control
group. Parties that were forced to make larger relative increases in the number of female
candidates slightly improved their electoral performance relative to other parties within the
same municipality.
Voter turnout in the municipalities a�ected by the quota was not reduced as a result
of the larger number of additional women candidates. Thus the evidence shows that, at
the margin, voters seemed to be happier with more balanced lists. These results are not
consistent with the existence of major voter aversion to female candidates.
We also show that parties did not have major problems �nding suitable female candidates
to comply with the quotas. The quota was not associated with increased list attrition or
di�culties forming new lists. Parties did not need to retain past female candidates more
often or to promote existing female candidates to top positions either. Together with the
results on electoral outcomes, this evidence is not consistent with the existence of major
supply constraints for high-quality female candidates.
There has been considerable research trying to understand the e�ect of female candidates
on electoral outcomes, with mixed results (Dolan, 2004; Lawless and Fox, 2010). Surveys
consistently show the importance of gender stereotypes (Koch, 2000; Lawless, 2004; Mc-
Dermott, 1997, 1998). Women candidates are seen as more liberal, having an advantage
in issues related to education, health, or poverty. But men are seen as more competent
managers when the issues relate to economics, crime, or the military (Dolan, 2005). Polls
also show that voters tend to vote for candidates of their own gender (Smith and Fox, 2001;
Plutzer and Zipp, 1996).
However, the net e�ect of these �ndings on actual electoral results is unclear. Most of
the literature in political science �nds that female candidates who run for o�ce tend to
win at similar rates as males (Darcy and Schramm, 1977; Burrell, 1992; Gaddie, Keith,
and Bullock, 1995; Fox and Oxley, 2003). Some papers claim that women candidates obtain
fewer votes (Frechette et al., 2008), while others �nd a net positive e�ect (Hogan, 2010). The
caveat is that these studies are based on correlational evidence and su�er from: i) endogeneity
problems (parties strategically choose candidate gender contingent on expected results),1 and
ii) omitted ability biases (they could re�ect voter discriminatory preferences that prevent all
but the most extraordinary women from entering competitive elections). To the best of our
knowledge, ours is the �rst attempt to measure the e�ect of female candidates on votes using
1For instance, using data from the introduction of gender quotas in France at the national legislativelevel, Murray (2008) �nds evidence that �women are indeed placed in the most di�cult seats� as candidates.
2
a quasi-experimental design that exogenously increased their number in a treatment group
of municipalities and parties and left a control group untreated. We can thus eliminate the
e�ects of potentially confounding factors on electoral outcomes.
Our paper complements previous evidence about the importance of internal political
party dynamics in accounting for female under-representation (Sanbonmatsu, 2002; Murray,
2008; Bagues and Esteve-Volart, 2009). It also relates to recent research on the policy e�ects
of women in power (e.g. Chattopadhyay and Du�o, 2004; Beaman et al., 2009).2 This
literature has focused mainly on the policy outcomes of female elected leaders, the e�ects
of quotas on the number of elected women, or the change in attitudes toward women once
they are elected, and not on the intrinsic theories that could account for women's under-
representation.
Our research follows an extensive literature on discrimination in labor markets. There
is evidence of gender discrimination in hiring (Goldin and Rouse, 2000) and in product
markets (Ayres and Siegelman, 1995). A related literature on ethnic discrimination has
studied market-driven preferences for residential segregation (e.g. Saiz and Wachter, 2011)
and in other less conventional environments (Kahn, 1991; Szymaski, 2000; Price and Wolfers,
2010). Municipal elections allow us to study a very relevant setting, yet one where a very
good performance measure is available: electoral results. Our argument that optimizing
agents should equalize the productivity of the marginal candidates from each gender closely
resembles Knowles, Persico, and Todd (2001).
Finally, the paper is distantly related to an emerging literature that tries to explain gender
inequality in outcomes using di�erences in tastes and attitudes (Crosson and Gneezy, 2008).
Women tend to display negative attitudes toward competition (Gneezy and Rustichini, 2004;
Gneezy et al., 2003; Niederle and Vesterlun, 2007). They also tend to see themselves as less
quali�ed to run for o�ce (Fox and Lawless, 2004, 2005). These theories could explain why
the average woman may be less likely to seek power. However, they cannot by themselves
account for the lack of women at the top. In competitive environments, there could be
enough women at the right tails of the ambition and ability distributions to satisfy a demand
for more balanced gender allocations. We argue that one cannot fully understand female
2The literature on the impact of women in power on parliamentary votes, budget levels, budget com-position, government stability, and government e�ciency is now quite large. Note that we do not havemuch to contribute to this speci�c literature, since we are not examining the policy impact of the additionalelected women due to the quota. Instead, we use the natural experiment to learn about the causes of fe-male under-representation on the candidate lists. For the reader interested in women politicians andtheire�ect on policy, other examples of this burgeoning literature include: Welch (1985), Swers (1998), Rehavi(2007), Clots-Figueras (2009), Funk and Gathman (2010), De Paola et al. (2010), Gallarduci and Passerman(2010), Ferreyra and Gyourko (2010), and Cavalcanti and Tavares (2011). Campa (2011) is the most relevantreference to our work: studies the impact of quotas in Spain on the provision of public goods.
3

under-representation in positions of power without considering the interaction between the
demand-side of political markets (voter preferences); the marginal supply of quali�ed female
candidates; and the industrial organization of the market: the role of parties and the degree
of competition (Becker, 1957).
The paper proceeds as follows. In section 2 we develop a simple model of electoral
competition that encompasses the theories explaining low female representation. The model
illustrates the alternative predictions about the e�ects of a newly-introduced quota according
to each theory. Section 3 describes the experimental design and data that we use to test the
di�erent theories, and section 4 presents the results. We o�er concluding remarks in section
5.
2 Female Representation and Quotas: Framework
There are several reasons for women's under-representation in powerful positions. First,
political parties may behave as if they were discriminating against women by �elding fewer
female candidates in electable positions (Sanbonmatsu, 2002, 2006; Bagues and Esteve-
Volart, 2009). This could be due to powerful elites�who are traditionally male�explicitly
failing to promote women. Alternatively, it could be due to internal organizational dynamics
that implicitly favor men (Reuben et al., 2010) or to female disadvantages in managing
internal competition for power within the parties (Gneezy et al., 2003, Verge and de la
Fuente, 2014). All of these explanations can be encompassed under what we name the
�party discrimination theory.�
A second explanation for low female participation resides in voter tastes. As long as
voters prefer to be governed by men, political parties will rationally respond by restricting
female promotion. They will do so in order to increase their chances of winning, even if the
party's internal dynamics would have resulted in gender-neutral outcomes otherwise. We
call this the �voter preference theory.�
Finally, low female participation may also be the result of self-selection into political
activities, leaving parties with a worse pool of female contenders. This explanation is re-
lated to statistical discrimination theories (Arrow, 1973). Current evidence suggests that
female politicans are equally or more e�ective once elected in o�ce (Bratton and Haynie,
1999, Anzia and Berry, 2011). Glagiarducci and Passerman (2012) report that �there are
in fact no di�erences between male and female mayors in various measures of government
e�ciency.� However, the possibility remains that the female contenders available to parties
are less e�ective electoral campaigners. Note that there are naturally few positions of power,
so explanations in this direction need to focus on the right-tails of the distribution of po-
4
litical ability. Talented women may avoid a career in politics if it o�ers a worse work-life
balance than other alternatives (Lawless and Fox, 2005; Goldin and Katz, 2008; Bertrand et
al., 2010). Attitudinal di�erences toward competition (Niederle and Vesterlun, 2007) could
disproportionally discourage high-ability women from competing in elections, even if parties
tried to encourage them. We term these kinds of explanations the �self-selection theory.�
We develop a framework that considerss all these explanations for low female represen-
tation. The model highlights the di�erent predictions of the three theories with regard to
female quotas, helping us discern their empirical validity. It is also helpful as a synthesis of
what is currently a very heterogenous literature on women in power.
2.1 Theoretical Environment
Consider N parties in a local electoral contest. We assume that the local branches of political
parties cannot choose their ideology and policies�which are set at the national level�but can
choose their candidates. They must �eld a list with a continuum of candidates of mass one,
which they do simultaneously à la Cournot. Each party has a pool of potential candidates
to choose from each gender. Let fpm and fpw be the density functions for the distributions
of the ability of men and women contenders to become candidates for party p. We denote
the corresponding distribution functions by Fpg, for g ∈ {m,w}.The share of elected candidates from a list is determined by its vote share, denoted
by φp (Vp, V−p).3 We assume that φp is increasing in Vp and decreasing in V−p, where Vp =
Ap−dv (p)Wp is a partial index of the appeal of party p's candidates to voters (V−p denotes the
corresponding index for competing parties). Ap is the average ability of party p's candidates,
and Wp is the share of women on its list. The parameter dv (p) ≥ 0 measures potential voter
distaste for female candidates among party p's constituency.
Parties choose their candidate lists with the objective of maximizing πp = φp (Vp, V−p)−dpWp, where dp measures the preference of a potential party's local leadership for having men
on the list. While we use �party discrimination� to describe this situation, an observationally-
equivalent interpretation has dp capturing internal party dynamics that make it harder for
women to move up the ranks.
The model captures with simplicity the three theories described above. The party dis-
crimination theory states that dp > 0. Under the voter discrimination theory, dv (p) > 0.
And �nally, the negative selection theory is captured by the di�erence between fpw and fpm.
3Naturally, vote shares satisfy∑N
p=1 φp = 1.
5
2.2 The Dynamics of Gender Selection
Contingent on their gender allocation, parties are interested in choosing the best male and
female candidates among their pools of contenders. Consequently, parties optimally set
minimum ability thresholds of apm and apw for their candidates. As a result:
Ap =
ˆ ∞apm
afpm (a) da+
ˆ ∞apw
afpw (a) da,
and
Wp =
ˆ ∞apw
fpw (a) da = 1− Fpw(apw)
= Fpm(apm),
Because list sizes have a �xed measure, determining an ability threshold for women also sets
the standard for men. Indeed,dapmdapw
= −fpw(apw)/fpm
(apm)and, e�ectively, party p only
has one instrument to maximize its objectives conditional on other parties' behavior: apw.
We can write party p's objective as:
maxapw
φp (Vp, V−p)− dpWp
The �rst-order condition for the party's best reaction is dφpdapw−dp dWp
dapw= 0. Di�erentiating
Ap and Wp with respect to apw, we can re-write it as:
apw − apm = dv (p) + dp
(∂φp∂Vp
)−1
This equation de�nes the optimal selection policy of party p as a reaction function of com-
peting parties' decisions. When neither parties nor voters display gender-based preferences,
dv (p) = dp = 0. In this case we should obtain apw = apm, so that men and women face the
same abilty threshold. Parties maximize the average ability of their candidate pool regard-
less of gender. However, this does not necessarily imply gender parity: more men are chosen
if they are more politically-able than women in their respective candidate pools, as when
fpm �rst-order stochastically dominates fpw due to self-selection into the candidate pool.
If parties or voters display gender-based preferences for candidates, the ability threshold
becomes higher for women. dv (p) and dp then determine the ability wedge between the
genders. For example, suppose �rst that voters prefer male candidates, but parties do not,
so that dv (p) > 0 and dp = 0. Such voters are willing to replace female candidates with
male ones. as long as di�erences in ability between them are smaller than dv (p). The party
6
targeting these voters thus composes a list with: apw − apm = dv (p).4
On the other hand, suppose that voters do not display gender-based tastes, but parties
do, so that dv (x) = 0 and dp > 0. Now the optimal selection policy sets apw − apm =
dp (∂φp/∂Vp)−1. Party leaders are willing to sacri�ce votes in order to increase the number
of male candidates. Note that ∂φp/∂Vp is e�ectively a measure of the competitiveness of
the election. If ∂φp/∂Vp is large, party p's vote share is very sensitive to the quality of its
candidates Vp. As a result, the cost of discrimination is large. If ∂φp/∂Vp is low, electoral
results are less sensitive to the number of women on the list. Hence, in environments where
ideology is more important than candidate ability, parties can get away with indulging in
candidate selection based on internal gender-biased preferences or processes.
2.3 E�ects of Female Quotas on the Under-represented Party
Next, we describe the e�ects of imposing female quotas on the candidate lists that parties
choose in equilibrium (see the appendix for the proofs and details). We assume that only
one party is forced to increase the number of women, mimicking our empirical design. We
brie�y discuss the situation in which both parties are a�ected by the quota at the end of the
section.5
Start by assuming that female under-representation is solely driven by voters' preferences
or by self-selection into political activities that results in a better pool of male candidates.
In this scenario all parties set apw−apm = dv (p) in equilibrium. If one of the parties is forced
to increase the number of women, it must lower the ability threshold for female candidates
below what the party's marginal voter would like. We can hence posit:
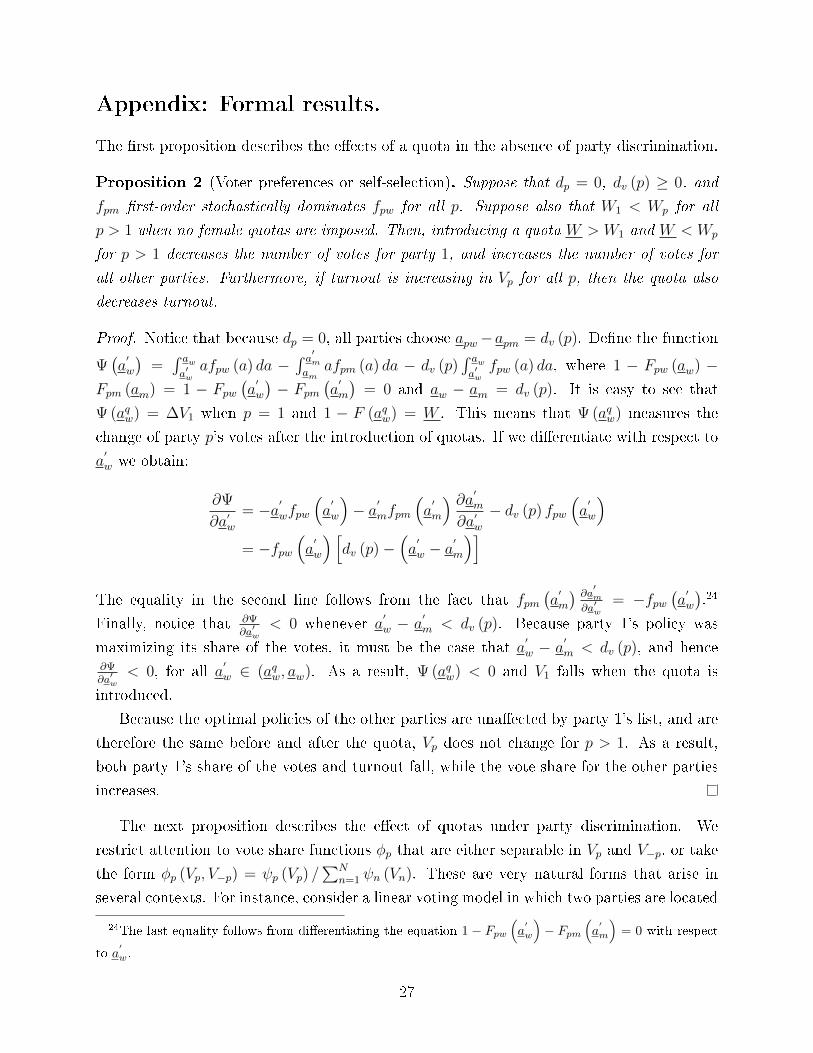
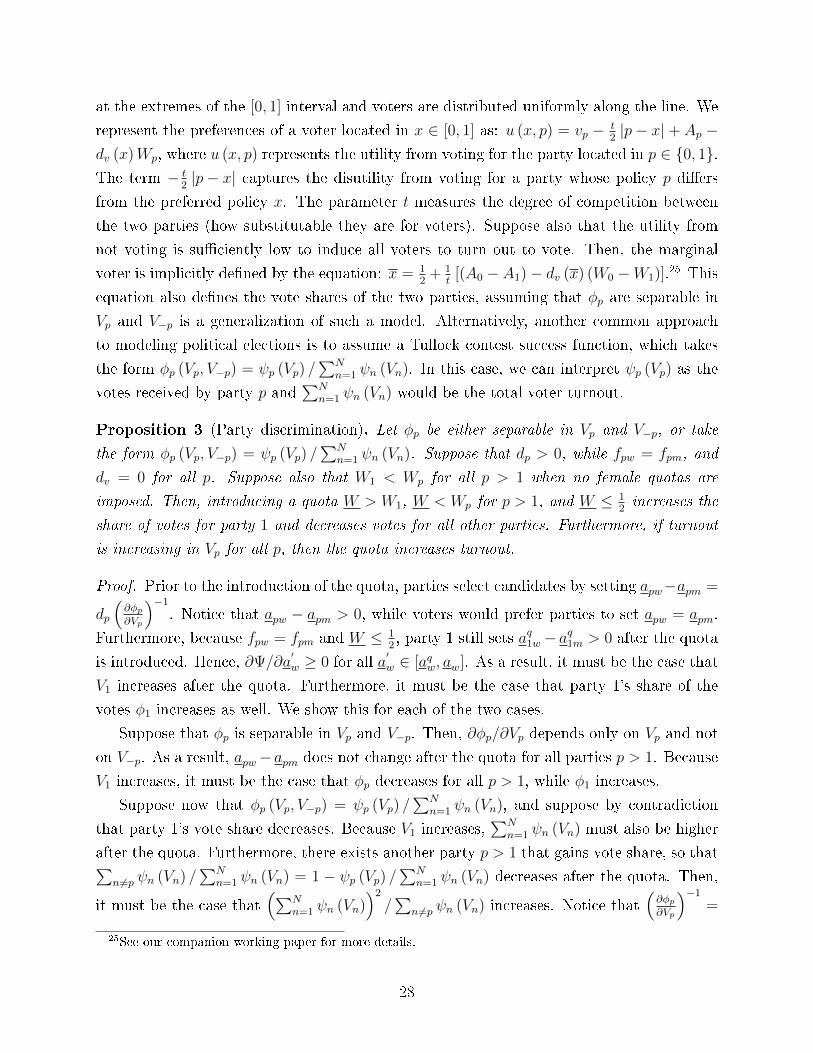
Proposition 1 (Voter preferences or self-selection). Suppose that dp = 0, dv (p) ≥ 0, and
fpm �rst-order stochastically dominates fpw for all p. Suppose also that W1 < Wp for all
p > 1 when no female quotas are imposed. Then, introducing a quota W > W1 and W < Wp
for p > 1 decreases the number of votes for party 1, and increases the number of votes for
all other parties. Furthermore, if voter turnout is increasing in Vp for all p, then the quota
also decreases electoral turnout.
Conversely, the a�ected party can only bene�t from the quota if its leadership preferences
or internal dynamics are gender-biased. In such cases, a policy that restricts the gender-
4Notice that changes in the optimal selection of candidates rely on relative abilities at the margin, anddo not depend on the distribution of talent for men and women. Nevertheless, the �nal number of womendoes depend on such distributions.
5In the empirical applications we will contrast the outcomed of parties that were a�ected by the quotawith parties in the same town that were not a�etcted as a source of identitifcation. Casas-Arce and Saizpresent the results of a theoretical model where the quota a�ects all parties.
7
biased behavior may be bene�cial for the party's electoral outcomes. To see this, consider
what happens when voters do not display gender preferences and there are no di�erences
in the distributions of talent across genders. Parties that display gender-biased preferences
limit the number of women candidates by setting apw > apm, but voters would prefer a more
gender balanced list, with apw = apm. The party that is a�ected by the quota is then forced
to increase the number of women by lowering apw. At the margin, the quota should thus
increase the average ability of the candidates on the list. As a result, the electoral appeal of
that party should increase, and the party will receive more votes.6 This argument suggests
that if the party leaders have preferences that con�ict with those of their constituents, then
limiting their discretion may have a positive e�ect.
In practice, the introduction of a quota is bound to a�ect more than one party, and
some of our empirical analyses study such cases. Theoretical results then are subtler but
similar under reasonable distributional assumptions.7 What matters now is the relative
marginal increase of female candidates. A version of proposition 1 still holds: if parties
display gender-biased preferences, the party most a�ected by the quota will tend to improve
its relative electoral results. Conversely, under the voter-preference and the self-selection
theories we expect to see the most-a�ected party lose votes. (Casas-Arce and Saiz, 2011).
While the voter-preference and candidate-quality theories yield observationally-equivalent
predictions with respect to the introduction of quotas, we can clearly distinguish these two
from the existence of internal party dynamics that hinder female advancement. In the next
section, we use the unexpected introduction of electoral female quotas to do so.
3 Experimental Environment
Town councilors in Spain are elected using closed lists (i.e., people vote for a list rather
than for an individual person). Most lists concur under the umbrella of national or regional
parties. Each list must present a number of candidates equal to the number of council seats
at stake.8 The seats are apportioned proportionally to vote shares using the d'Hont method.
The law, however, establishes a minimum vote threshold of 5% in order for a list to qualify
6If the quota is too high, then the party may be forced to set apw < apm. In that case, although somewomen will replace lower-ability men on the list, some lower-ability women will be included too, reducingthe e�ectiveness of the quota.
7In Casas-Arce and Saiz (2011) we assume that the ability distributions for di�erent genders and partiesonly di�er in their mean.
8For example, the number of seats is 11 for municipalities between 2,000 and 5,000 inhabitants, and 13for municipalities between 5,000 and 10,000. Note that, in 2003, 94 percent of the lists in these populationranges obtained fewer than 7 seats, and only one list in about 30,000 reached 11 seats. In practice, therefore,all candidates appearing after number 7-8 on a list can generally be understood as ��ller� candidates.
8
for the apportionment of seats.
Council members are drawn from each list using the exact order in which the candidates
are listed. Upon convening for the �rst time, the council elects a mayor, typically the �rst
person on the most-voted list.9 The council also acts as a representative legislative body,
passing and enacting all local budgets, laws, regulations, zoning, and tax codes for a period
of four years.
On March 22, 2007, the �Law for the Equality of Women and Men� (the Equality Law
henceforth) was passed by the Spanish Parliament. It required candidate lists in all elections
to contain at least 40 percent of candidates from each gender. Moreover, in order to prevent
parties from placing all women at the bottom of the list, the law required this proportion to
be maintained for every bracket of �ve positions. Importantly, the law declared municipalities
with fewer than 5,000 inhabitants exempt from the quota.
The law applied for the �rst time to the municipal elections held on May 27, 2007. In the
previous election of May 25, 2003, no such legal change had been contemplated. Indeed, the
passing of the law was made possible by the 2004 general election results, which were largely
unanticipated (Montalvo, 2009). Only days before the Madrid train bombings of March 11,
2004, the Christian-Democratic Party (PP) was widely expected to win the elections. The
bombings and post-attack management from the incumbent party changed the sentiment of
many voters toward the Social-Democratic Party (PSOE), which won the elections four days
after the terrorist strike.10 It is therefore quite unlikely that the share of female candidates
in the municipal elections of 2003 re�ected an anticipation of the female quotas that were
imposed in 2007.
The Spanish State Department (Ministerio del Interior) collects information related to
the electoral process. On request, we obtained a non-con�dential subset of their data. We
were provided with the names of all candidates by list in all municipal ballots in the 2007
and 2003 elections,11 their gender in 2007 (a disclosure required by the Equality Law), their
list a�liation with major parties, information about each individual's position on the lists,
and the outcome of their candidacy. We imputed gender in 2003 by using the �rst name
of the candidate. Names in Spain have a very strong gender orientation and only a very
small portion of candidates in 2003 had gender-ambiguous names. We also have information
about the number of votes for all lists presented, the fraction of null or blank votes, estimated
populations in the municipal census, and the number of registered voters in each town.
Since the law applied only to municipalities with more than 5,000 inhabitants, we can
9In fact, only the �rst person on each list can be considered in the initial mayoral vote.10Gender parity in lists had been an important point in POSE's electoral platform (Verge, 2006).11Other characteristics, such as birth date, were suppressed from the data for con�dentiality reasons.
9
only obtain meaningful results around this threshold. In order to ensure both comparability
and large-enough sample sizes, we restrict our study to municipalities with populations below
10,000 inhabitants. However, the results are not in the least sensitive to variations in this
threshold. We also collected data on unemployment rates (a very good local socioeconomic
status indicator in Spain) and other economic characteristics of the towns. These additional
characteristics never mattered for any results in the paper and are omitted inasmuch as
most speci�cations include municipal �xed e�ects. Furthermore, we found no di�erences in
observables on either side of the population level around which the quota became binding.
In contrast, there was a very strong e�ect of the quota on the number of women across lists
on both sides of this discontinuity: a di�erential increase of 8.5 percentage points in towns
with populations above 5,000. This �gure amounted to a di�erential 32 percent increase in
the number of women on lists in the towns a�ected by the quota.12
4 Do Voters Dislike Female Politicians? Evidence
4.1 Women and Electoral Results: Descriptive Evidence
While the political slogan �when women run, women win� has been used to promote female
political candidacy, the issue of the impact of women on electoral results is ultimately an
empirical one. An extensive literature has studied the impact of parties �elding female
candidates. The approaches in the literature have been based on either studying self-reported
voter preferences as captured in surveys, or on comparing outcomes by gender in single-
candidate elections. The former approach may not faithfully capture actual behavior or
provide reliable �eld predictions. Results from the latter approach need to be interpreted
with caution: because the share of women running for o�ce is low, those who actually
run constitute a very selected group. Finding no gender di�erences in vote shares between
marginal candidates is completely consistent with the existence of general voter biases against
women; these biases could explain why only a relatively small percentage of extremely-capable
female candidates can a�ord to compete.
In order to illustrate the pitfalls of correlational approaches and to understand better the
patterns of women's participation before the quotas, we start by showing the associations
between the share of women on lists and electoral outcomes in 2003. We focus on small towns
with populations below 10,000�our sample of interest. The dependent variable in Table 1
is the voting share and the unit of observation is each of the 14,377 party lists competing in
12These results are robust to considering alternative control-treatment samples and to the inclusion ofpolynomials in population, other controls, and municipal �xed e�ects. See Casas and Saiz (2011) andCampa (2011) for further analyses.
10
the relevant 4,582 municipalities. The main dependent variable is the share of women in the
top �ve positions of each list. Presumably, women vying for top positions were more visible
to voters, and we will focus on the overall female share later.13
The descriptive evidence in Table 1, column 1, shows that lists with more women at the
top fared signi�cantly worse in the elections of 2003. The results are robust to including
municipal (column 2) and party (column 3) �xed e�ects. In column 4, we focus on the two
major national parties, which amounted to 60% of lists and 67% of votes in our sample.
We �nd that whenever one of the major national parties �elded a relatively large number of
women, it tended to fare worse. These negative results are quantitatively large, suggesting
that increasing the female share of candidates at the top by 20% (one woman) was associated
with a loss in vote share of 3.6 percentage points (about 10 percent of the average vote share).
As in previous correlational studies, this evidence cannot be interpreted as capturing
voters' gender preferences or candidate ability. In fact, reverse-causality is likely a major
issue. In Panel B of Table 1 we run the inverse regression with the female candidate share
on the left-hand side, focusing on the two main national parties. Were the main parties
systematically �elding fewer women in municipalities where they were likely to win more
seats? To test this hypothesis, we instrument each party's vote share in the 2003 municipal
elections using the vote share they obtain, at the municipal level, in the 1997 European
Parliament elections. The candidates and substantive issues in such elections are common to
the whole country and are completely unrelated to local elections. While European elections
are widely perceived as irrelevant by voters, they elicit general political sentiment for or
against the major national parties (Binzer Hobolt and Wittrock, 2011). This measure of
general political orientation in the town is very strongly associated with the local vote for
one or the other party in municipal elections: the R-squared in the �rst stage of 2SLS is 0.49.14
The results of this IV strategy (Table 1, Panel B, column 2) are statistically indistinguishable
from the OLS reverse-causation equation (Table 1, Panel B, column 1). They suggest that
the correlation between the share of female candidates and electoral results is driven by the
actions of parties, not the preferences of voters.
Of course, it is possible that the local parties that were likely to win in 2003 had already
been in power previously. Historically, executive teams have tended to be male. Furthermore,
it seems likely that parties could try to minimize turnover in governing teams. Nevertheless,
13Results are very similar if we focus on the total share of women on the lists. In these local electionsmany voters can be swayed to vote for a list due to personal or family relationships with the candidate(s),regardless of their position on the lists.
14Solé-Ollé and Viladecans-Marsal (2011) show that local ideological preferences for each party in Spainare very persistent over time (since the �rst democratic elections in 1978) and do a�ect the outcomes ofmunicipal elections.
11
controlling for the lists' winning the 2003 elections (i.e. obtaining the highest vote share)
does not change the results (Table 1, Panel B, column 2, including a dummy for the most-
voted lits). Non-winner lists that expected to increase their number of seats in the local
legislative body tended to decrease their share of women at the top. Rather than winning
elections, it seemed to be winning seats that changed the internal party dynamics of female
promotion. Note that �winner status� is certainly an endogenous regressor that should be
negatively associated with the female candidate share if voters really disliked female-laden
governing teams (as opposed to women on non-governing lists). However, both variables
happen to be uncorrelated after controlling for vote shares.
It is clear that in towns where a party was generally strong and expected to gain many
seats in the municipal elections that party �elded fewer women on its list. Conversely, more
women ran for o�ce in towns where the party was in a more competitive situation. These
results are consistent with our theoretical analysis of internal party dynamics pushing women
aside from positions of power. They also illustrate the di�culties associated with studying
female electoral success in a context of substantial endogeneity.
4.2 A Natural Experiment Induced by the Quota: �Male-Holdout�
Lists
The previous results do not conclusively prove the existence of party discrimination. Fortu-
nately, the introduction of the Equality Law provides us with an experimental design that
is akin to the random forceful introduction of more women onto electoral lists. If the vote-
maximizing best response of a party to voter preferences and candidate availability was to
include fewer women, the new constraint on behavior should reduce its vote share.
We focus on a subset of lists where the quota was uniquely binding. Speci�cally, we study
the evolution of vote shares for parties that were the only ones in their municipalities �elding
fewer than two women (40%) in the top �ve positions in 2003. These �male-holdout� lists
were deviating from their local norm. Towns with a single male-holdout list are interesting
to study because we have only one party a�ected by the quota and we can directly apply the
conceptual test in Proposition 1. We implement a di�erence-in-di�erences matching design
(Smith and Todd, 2005) by comparing changes in vote shares before and after the quota,
across male-holdout lists in quota and non-quota municipalities.
Of all towns with populations under 10,000 with single male-holdout lists, we have only
111 in which the quota became binding in 2007. 1,100 towns withmale-holdout lists remained
una�ected by the quota in 2007 (populations below 5,000). We therefore have many more
observations in the non-quota group. Furthermore, the observable characteristics of the lists
12
in the quota and non-quota groups are somewhat di�erent (Table 2). Saliently, male-holdout
parties in quota towns tended to have smaller initial vote shares in the 2003 elections. Also,
the number of contending parties in the elections was larger in the quota towns, and elections
were more competitive (illustrated by a lower Her�ndahl index on the distribution of initial
vote shares).
Existing literature suggests that one should not compare treatment and control groups
that are too di�erent (Lalonde, 1996; Heckman et al., 1998). In order to produce a closely
comparable control group, we �rst estimate a propensity score equation on a quota dummy
using observable characterics, and match each of the 111 observations in the �quota male-
holdout� group with the 10 closest �non-quota male-holdout� observations by propensity
score (with repetition).15 Importantly, results are not sensitive to changing the matching
technique or the number of matched control observations. Table 2 shows that matching on
the propensity score does very well in selecting non-quota lists that were ex-ante similar to
those in the quota sample. Note that by taking �rst di�erences on the outcome of interest
we mitigate other potential omitted variables problems (Smith and Todd, 2005).
In Table 3 we compare the evolution of male-holdout parties in the quota and non-
quota groups. While all other lists in these towns were not forced to increase their female
share, they could have done so as a best reaction to the changes in male-holdout lists.
Therefore, we cross-tabulate the main outcome of interest�the 2003-2007 change in vote
share of male-holdout lists�by the reaction of their competitors (columns). In order to
operationalize the latter, we calculate the average change in the share of women in the top
�ve positions among competing parties, weighted by their 2003 vote. We then separate the
behavior of competitors into three categories based on whether their female shares did not
change (column 1), increased (column 2), or decreased (column 3) in 2007.16 Our focus is
on column 1, where only male-holdout lists substantially changed female representation due
to the quota (representing 77% of the treatment group).
In the �rst row we focus on male-holdout lists in which the quota was not enforced and
which kept fewer than two women in the top �ve positions in 2007 (compliers). These lists
su�ered a substantial drop in vote share between elections. Non-complier lists in the control
group (lists that increase their female share to at least 40%, despite not being required to
do so) experienced a lower reduction in vote shares (row 2), and so did the lists that were
15Each thusly paired �control� observation is given a weight of 1/10. Since many of the control observa-tions are matched to several treatment observations, we end up with 375 comparable male-holdout lists inmunicipalities where the quota did not apply. We use the routine �psmatch2� by Leuven and Sianesi (2012).
16The measure of municipalities with average changes exactly equal to zero is very small. Therefore, wede�ne the towns for which the competitors' female share remains approximately the same as those withaverage changes between -0.1 and 0.10: less than half a woman, out of �ve candidates on average.
13
actually subject to the quota (row 3).
There was a substantial number of non-complying lists that were not bound by the quota
but behaved as if they were. This could be due to general social change favoring more women
at the top, but also may have been related to an �encouragement e�ect� of the law. In this
environment, Wald (IV) estimates are useful in comparing relative changes in outcomes to
relative probabilities of receiving the actual treatment of interest. We therefore present
both the binding-quota e�ect proper (the overall di�erence between quota and non-quota
groups)�in row 5�and a Wald (IV) estimate of the local treatment e�ect of moving toward
gender parity in the top positions�in row 6.17 We obtain the latter by dividing the former
e�ect by the di�erence in the probability of receiving a gender-parity treatment (�elding
at least 40% women candidates) for municipalities above and below the 5,000 population
threshold. In the last column we present these results aggregating across reaction func-
tions of competing parties. Contrary to the previous correlations, lists with more women
(voluntarily or forced) tended to see slightly better electoral outcomes. Wald IV estimates
suggest that moving male-holdout lists to gender parity increased their vote share by about
4 percentage points, representing an exchange of about 60 votes in the local elections under
consideration.18
The results in Table 3 are clearly not consistent with a negative impact of women can-
didates on electoral outcomes. However, two issues complicate their interpretation. As
demonstrated in Landonde (1986), non-parametric treatment e�ect estimates could be sen-
sitive to speci�cation and the composition of the treatment and control samples. Taking
�rst-di�erences in the outcome of interest and making the samples comparable by match-
ing may attenuate but not totally eliminate these problems (Heckman et al., 1998; Smith
and Todd, 2005). Furthermore, treatment e�ects are bound to be quite heterogenous: in
fact, we would not expect large e�ects for lists that did not generally attract voter attention
anyway�regardless of candidate identity.
Thus, in Table 4 we extend the analysis to the whole (unmatched) sample of male-holdout
lists in non-quota towns. We start by repeating the previous di�-in-di�s exercise. Remember
that initial vote shares were quite di�erent among quota and non-quota groups. Therefore,
this time we weight each observation by each party's vote share in the previous election
(column 1), and we include party �xed e�ects (column 2). The results are very similar to
those of the propensity-score matched sample.
17Because the law mandates a gender quota in the top �ve positions, the closest that it can come to parityis a 40% minimum.
18Because changes in electoral shares are zero-sum, a party that captures 60 votes from its competitors inan environment with an average of 2,542 voters is gaining a 120-vote relative advantage over its competitors,which comes to about 4 percentage points.
14
In column 3, rather than weighting, we explicitly allow for heterogenous treatment e�ects.
The vote share level in 2007 for each list is the main dependent variable. We then control
for vote share in 2003 and its interaction with the quota dummy. Column 3 shows that, as
suspected, the introduction of women candidates had a larger impact on more popular lists.
We then include party �xed e�ects and characteristics of the municipalities: a polynomial in
the town's population, number of lists in the election, Her�ndahl index, and a quadratic in
lagged vote shares. Using these speci�cations we cannot reject a positive impact of women
on larger lists at the 10% level, and can reject the one-sided null of a negative impact of
gender parity on electoral results at 5% con�dence.
Remember that there was a large number of non-complying observations in the non-quota
group that actually ful�lled the quota. Therefore, in column 6 we also o�er instrumental-
variables results. In these speci�cations, the quota dummy and its interaction with the initial
vote share instrument for actual changes to 40% female representation in the top positions
and their corresponding interaction. Again, we can reject the hypothesis that male-holdout
lists that were forced to enact gender parity fared worse. In fact, the evidence is more
consistent with the view that they tended to do slightly better.
4.3 Relative Growth of Female Candidates and Vote Share
We now generalize our results to all candidates and electoral lists a�ected by the quota. It is
well known that �friends and neighbors� of candidates have a strong impact on the outcomes
of local elections (Key, 1949; Smith, 2010). New female candidates may have been e�ective
in canvassing voters from their social networks in the relatively small towns that we study,
irrespective of whether they were likely to be elected themselves. Furthermore, in many
towns several or even all parties were a�ected by the quota, but to di�erent degrees: those
with fewer women were forced to make larger increases. We can therefore use the larger
variance in the e�ects of the quota on the total share of women on the lists to estimate the
broader impact of female candidates on relative electoral outcomes.
In order to motivate this broader empirical approach, we start by showing in Table 5,
column 1 that the more a list was forced by the quota to increase its number of female
candidates, the better it fared in the 2003 elections. The unit of observation in the OLS
regression is each of the municipal party lists concurring in the 2003 and 2007 elections.
The dependent variable�on the left-hand side�is the change in the vote share of the list.
The main independent variable takes the expression Dki × (0.4− FemShki,03), where Dki
is a dummy that takes value 1 if municipality i's population in 2007 was above 5,000 and
party k's female share in 2003 (denoted byFemShki,03) was below 40%. The further away
15
a list was from the quota in the towns where it was binding, the more women it was forced
to incorporate. Of course, voter preferences could be changing over time, a�ecting parties
with di�erent initial numbers of women in di�erent ways. Therefore, we also control for a
quadratic in the initial list's share of women in 2003 on the right-hand side in all speci�cations
in Table 4.19 Furthermore, we always include municipal �xed e�ects. If all lists in a town
were similarly a�ected by the Equality Law, we would not expect the quota to have much
e�ect on vote shares. By controlling for town �xed e�ects, we are e�ectively looking at
deviations of the change in the number of women and vote shares relative to their town's
averages. Finally, we include main party �xed e�ects (e.g. PSOE, PP) to account for broader
changes in political sentiment, and weight all observations�party lists�by their vote share
in 2003 to obtain voter-representative results.
The regression considers 11,556 repeat lists in 4,364 municipalities. The results (Table 5,
column 1) indicate that lists in quota towns that were forced to increase their female repre-
sentation more dramatically fared relatively better, gaining voting share. Note that we are
�rst-di�erencing the dependent variable, controlling for the initial female shares (including
a quadratic term), and saturating the model with town and party �xed e�ects. It is thus
extremely di�cult to account for the additional importance of a particular function of the
initial relative distance from a 40% female share in lists and towns where the quota was
binding using alternative explanations.
While intuitive, the results in column 1 cannot be interpreted quantitatively. Hence, in
column 2 we use Dki × (0.4− FemShki,03) as an instrument for the endogenous regressor
of interest: 4FemShki, the change in the number of women in party k of municipality
i between 2003 and 2007. The inclusion of municipal �xed e�ects signi�es that we are
looking at relative changes in vote and female shares within municipalities. Overall, the
identi�cation strategy is conceptually based on triple-di�erencing the data and considering
simultaneously: di�erences in vote shares by party between 2003 and 2007;20 di�erences in
propensities to introducing more females on the lists between quota and non-quota towns in
2007; and relative di�erences in how far from the quota each party was in 2003 within its
municipality. The results suggest that a party that was forced to increase its female share
by 10 percentage points more than its opponents experienced a 4.2 percentage point gain,
which would on average imply 53 votes shifting party allegiance, out of about 2,500 cast.
19Note therefore that the empirical strategy is not based on comparing lists with many initial femalecandidates to lists with few. Rather, we are conditioning on the initial number of women and comparingparties a�ected by the quota to non-a�ected parties.
20Note that some lists dropped from contention in 2007, and some new lists appeared; however, theprobability of attrition or new list formation was orthogonal to the application of the quota (Casas and Saiz,2011).
16
While the e�ect is relatively modest, we can reject the hypotheses that parties that were
�elding fewer women did so because of their unpopularity or lower ability as politicians.
A potential concern with these results is that they may be driven by candidate turnover.
Indeed, one of the e�ects of the quota was to increase the number of new candidates. New
candidates may be preferred by voters generally, or be chosen to compete better. In column
3 we thus control for the share of candidates who were new to the list in 2007, but the results
do not change. In column 4 we exclude male-holdout towns in order to make sure that we
are not solely exploiting the same source of variance as in Tables 3 and 4. Results are similar
in towns where more than one party was a�ected by a binding quota: parties that had to
increase their female share by relatively more fared relatively better.
Note that our research design is not based on a regression discontinuity, because the out-
come (vote shares) cannot possibly change in the aggregate across both sides of the boundary
that de�nes the quota (population 5,000), and because of the heterogenity and interdepen-
dence of the �treatment dosage� across observations. Nevertheless, it is still interesting to
see if the results are sensitive to focusing on municipalities that are very close in terms of
population. Concretely, in column 5 of Table 5, we limit our attention to municipalities with
populations between 4,000 and 6,000. The 2SLS results are broadly similar to previous ones,
but standard errors are three times as large as the ones in the baseline estimation (column
2) and the instruments are consequently weaker. These features are solely driven by the
smaller sample size (less than one in ten of the original municipalities): parameter estimates
do not change much, but standard errors steadily decrease as we go on increasing sample
sizes on both sides of the population distribution.
Finally, we separate municipal elections based on their degree of competitiveness (columns
6 and 7). Remember that, under the �party discrimination� theory, parties whose internal
dynamics resulted in gender biases were less likely to survive in very competitive electoral
environments. We operationalize a de�nition of non-competitive municipalities as those
where the largest party obtained 7 or more seats (out of a maximum total of 13) in 2003, an
absolute majority. Consistent with this theory, gender-discriminating parties seem to have
deviated more from the optimal candidate mix in non-competitive environments (column 6),
and gained more voter share when forced to �eld more women.21
21The one sided- test with the hypothesis that the coe�cient on competitive municipalities is larger yieldsa t-statistic of 1.511 and �given the large sample- a p statistic of 0.065. Alternative de�nitions of non-competitive environments�such as a high Her�ndahl index in inital vote shares, or the di�erence betweenthe party with the most votes and its closest competitor�always yield the same picture: parties with�exogenously forced� women improved more strongly in less competitive towns.
17

4.4 Availability of Willing Women, Voter Turnout, and Other Mar-
gins of Adjustment
Our results so far point to the presence of internal party dynamics that limit women's political
careers. We now conduct further tests for other explanations.
One concern with our earlier results is that the quota forced some parties (especially
those with few women) to drop out of the 2007 elections due to a lack of female candidates.
In our earlier working paper (Casas-Arce and Saiz, 2011), we show that there was no list
attrition or increased di�culty in forming new lists: even lists in quota municipalities with
no female candidates at the start were no more likely to drop out of the elections after the
quota.
If quali�ed women had been scarce, another margin of adjustment for parties could have
been to increase the retention rate of incumbent female candidates. Since we have the full
names of candidates, we can trace their participation across years and lists. Interestingly, in
non-quota municipalities, the probability that a woman had already been on a party's list
in the previous election�32 percent�was much lower than the equivalent percentage for
men�43.55 percent. Women candidates experienced more turnover between elections than
men, a fact that is not explained by their position on the list (similar results are obtained
conditioning on rank in the list). Therefore, if quali�ed women candidates were truly scarce,
one would expect more e�orts geared toward increasing their retention rate. In Panel A of
Table 6, we estimate linear probabilistic models where the observations are all candidates
the 2003 and 2007 elections (pre- and post-quota). The left-hand-side (dependent) variable
is a dummy or indicator variable describing an attribute of each candidate within a party.
The main independent variable is an interaction of a dummy for municipalities where the
quota was binding with a 2007 indicator. We control for year and municipal �xed e�ects.
In column 1 the dummy variable takes value 1 if the candidate is a woman. In column 2
the dependent variable is a dummy that takes value 1 if the candidate is a woman appearing
on the list for the �rst time in 2007. The coe�cient estimates are very similar to those in
column 1, suggesting that parties did not �ll the new female positions required by the quota
by increasing retention but rather by bringing in new women candidates. In columns 3 and
4 we repeat these regressions, focusing on the top �ve positions. While the quota required
more female candidates overall, parties could have easily shifted incumbent lower-ranked
candidates to the top positions. What we �nd, however, is that 81 percent of these top-�ve
positions were actually �lled with new women candidates. When parties were forced to place
women in top positions they did not have major problems �lling their lists, and new women
18
stepped in to take on the challenge.22 This evidence from Spain is highly consistent with the
evidence from French municipalities after the parity law establishing a 50% female quota.
Bird (2003) �nds that according to a survey of 600 mayoral candidates in France �78 per cent
considered that it was `easy' to apply the parity law in selecting candidates for their lists.�
In Panel B of Table 6 we consider voter turnout by municipality. If voters disliked female
candidates, general animus against lists with more women could be expressed via lower voter
turnout. In fact, turnout seemed to be higher in municipalities with more women on the lists
before the quota (column 1) after controlling for observables (number of parties, Her�ndahl
index of vote shares, and a polynomial in population). Social capital�as measured by voter
turnout�and female representation were strongly associated, a �nding that we �ag for future
research. Moreover, when looking at the change in voter partcipation vis-à-vis the change
in the share of female candidates (instrumented by the interaction between a quota dummy
and 40 percent minus the town's share of female candidates in 2003), we �nd a positive�but
statistically insigni�cant�e�ect of female candidates on turnout (column 2). We conclude
that the presence of female candidates on the lists did not reduce voter turnout.
The bulk of the evidence is therefore not consistent either with the existence of major
supply constraints on quali�ed female candidates prior to the quota, or with the existence
of voter preferences for male candidates.23
5 Conclusion
Potential explanations for women's under-representation in democratic governments include
the possibility that voters prefer male candidates. Alternatively, parties may not be able
to �nd enough highly-quali�ed women to run for election. Based on correlational evidence,
the existing literature has claimed that female candidates perform as well as males in the
electoral contests in which they both run. However, such evidence is also consistent with
generalized male-biased voter preferences or low female campaigning ability, which could
explain why only a few extraordinary female candidates can a�ord to credibly compete at
the margin.
22Casas and Saiz (2011) also show that the new women candidates on the lists were not more likely tohave surnames or names associated with a higher socio-economic status, suggesting that the quality of femalecandidates did not increase.
23Of course, the latter could be a re�ection of male voters becoming more disengaged together with acompensatory increase in female voter participation. Note that the origin of the voters should not matterto conclude that parties were not following vote-maximizing strategies. Furthermore, we did not �nd prima-facie empirical support for a hypothesis based on di�erences in gender turnout post-quota. While the voteis secret and we will never be able to know the identity of voters, we tried to �nd signi�cant di�erencesin outcomes across towns with relatively larger shares of female registered voters in Casas-Arce and Saiz(2011): we did not �nd any.
19
According to voter-taste or candidate-ability theories, parties that were �elding fewer
women must have done so in order to gain an electoral advantage. However, using a natural
experiment provided by the introduction of quotas in Spain, we strongly rejected that view.
On the contrary, such parties modestly gained voting share when more women were mandated
onto their lists. The results demonstrate that forcing parties to accept more women through
quotas can increase female participation without necessarily decreasing their electability.
They also suggest that internal party dynamics are important in accounting for female under-
representation.
We have also found that women had been much less likely to run at the top of lists that
were highly likely to win seats in the local councils. Therefore�as in Sabonmatsu (2002),
Murray (2008), Bagues and Esteve-Volart (2010), and Verge and de la Fuente (2014)�the
evidence suggests that internal party dynamics seem to be especially at play against women
when power is at stake. The results are consistent with local party leaders implicitly discrim-
inating against women by not engaging them often enough (Bird, 2003, Fox and Lawless,
2005). They could also be explained by the endogenous emergence of rent-seeking male coali-
tions within the parties. Alternatively, the result could indicate that women are e�ective
at generating political ideas and enticing voters, but are less adept at elbowing out internal
competitors.
Hence, alternative e�cient policy responses could include leveling the playing �eld within
political organizations: more reliance on party primaries at all levels, open lists, and more
competitive electoral environments with fewer �safe� seats at the disposition of party ma-
chines. We hypothesize that such measures could induce more women to participate in the
political process without having to impose strict quotas, a testable hypothesis for future
research on this topic. In fact, women's representation is much larger in proportional elec-
toral systems (Norris, 2006; Norris and Krook, 2011) where each vote counts, as opposed to
majoritarian systems where many seats are de-facto owned and non-competitively allocated
by the leadership of the locally-dominant party, especially after redistricting. A�ecting the
behavior of political machines vis-à-vis gender issues and understanding how competition
changes internal party dynamics could thus be key to improving women's chances at equal
participation.
References
[1] Anzia, Sarah F. and Berry, Christopher R. "The Jackie (and Jill) Robinson
E�ect: Why Do Congresswomen Outperform Congressmen?" American Journal
of Political Science 55.3 (2011): 478-493.
20
[2] Arrow, Kenneth J. 1973. �The theory of discrimination,� O. Ashenfelter and
A. Rees (eds.), Discrimination in Labor Markets, Princeton, NJ: Princeton
University Press.
[3] Arzheimer, and Evans �Geolocation and voting: Candidate�voter distance ef-
fects on party choice in the 2010 UK general election in England
[4] Ayres, Ian, and Peter Siegelman. 1995. �Race and gender discrimination in
bargaining for a new car,� The American Economic Review, 85(3): 304�321.
[5] Bagues, Manuel F., and Berta Esteve-Volart. 2010. �Can gender parity break the
glass ceiling? Evidence from a repeated randomized experiment,� The Review
of Economic Studies, 77(4): 1301�1328.
[6] Bagues, Manuel F., and Berta Esteve-Volart. 2009. �Are women pawns in the
political game? Evidence from elections to the Spanish Senate,� mimeo.
[7] Beaman, Lori, Raghabendra Chattopadhyay, Esther Du�o, Rohini Pande, and
Petia Topalova. 2009. �Powerful women: Does exposure reduce bias?� The
Quarterly Journal of Economics, 124(4): 1497�1540.
[8] Becker, Gary. 1957. The Economics of Discrimination. Chicago: University of
Chicago Press.
[9] Bertrand, Marianne, Claudia Goldin, and Lawrence F. Katz. 2010. �Dynamics
of the gender gap for young professionals in the �nancial and corporate sectors,�
American Economic Journal: Applied Economics, 2: 228�255.
[10] Binzer Hobolt, Sara, and Jill Wittrock. 2011. �The second-order election model
revisited: An experimental test of vote choices in European Parliament elec-
tions,� Electoral Studies, 30: 29�40.
[11] Bird, Karen. 2003. �Who are the Women? Where are the Women? And What
Di�erence Can They Make? E�ects of Gender Parity in French Municipal
Elections.� French Politics, Volume 1, Number 1, March 2003 , pp. 5-38.
[12] Bratton, Kathleen, and Kerry L. Haynie. 1999. �Agenda Setting and Legislative
Success in State Legislatures: The E�ects of Gender and Race.� Journal of
Politics 61(3): 658-679.
21
[13] Campa, Pamela. 2011. �Gender Quotas, Female Politicians and Public Expen-
ditures: Quasi-Experimental Evidence.�ECONPUBBLICA Working Paper No.
157
[14] Cavalcanti, Tiago V., and Jose Tavares. 2011. �Women prefer larger govern-
ments: Growth, structural transformation, and government size,� Economic
Inquiry, 49: 155�171.
[15] Chattopadhyay, Raghabendra, and Esther Du�o. 2004. �Women as policy mak-
ers: Evidence from a randomized policy experiment in India,� Econometrica,
72(5): 1409�1443.
[16] Clots-Figueras, Irma. 2009. �Are female leaders good for education? Evidence
from India,� mimeo, Universidad Carlos III.
[17] Collado, M. Dolores, Ignacio Ortuño Ortín, and Andres Romeu. 2008. �Sur-
names and social status in Spain,� Investigaciones Economicas, 32(3): 259�287.
[18] Crosson, Rachel, and Uri Gneezy. 2008. �Gender di�erences in preferences,�
Journal of Economic Literature, 47(2): 1�27
[19] De Paola, Maria, Vincenzo Scoppa, and Rosetta Lombardo. 2010. �Can gender
quotas break down negative stereotypes? Evidence from changes in electoral
rules,� Journal of Public Economics, 94: 344�353.
[20] Dolan, Kathleen A. 2004. Voting for Women: How the Public Evaluates Women
Candidates. Boulder, Colorado: Westview Press.
[21] Dolan, Kathleen. 2005. �How the Public Views Women Candidates,� Sue
Thomas and Clyde Wilcox (eds.), Women and Elective O�ce : Past, Present,
and Future, Cary, NC: Oxford University Press.
[22] Dolan, Kathleen A. 2005. �Women candidates in American politics: What we
know, what we want to know,� presented at the 2005 meeting of the Midwest
Political Science Association, April 20-�23, 2005.
[23] Du�o, Esther, and Petia Topalova. 2004. �Unappreciated service: Performance,
perceptions, and women leaders in India,� working paper, MIT.
[24] Einav, Liran, and Leeat Yariv. 2006. �What's in a surname? The e�ects of
surname initials on academic success,� Journal of Economic Perspectives, 20:
175�188.
22
[25] Ferreira, Fernando, and Joseph Gyourko. 2010. �Does gender matter for political
leadership? The case of U.S. mayors,� mimeo, University of Pennsylvania.
[26] Fox, Richard L., and Jennifer L. Lawless. 2004. �Entering the arena? Gender
and the decision to run for o�ce,� American Journal of Political Science, 48(2):
264�280.
[27] Fréchette, Guillaume R., Francois Maniquet, and Massimo Morelli. 2008. �In-
cumbents' interests and gender quotas,� American Journal of Political Science,
52: 891�909.
[28] Fryer, Roland G., Jr., and Steven D. Levitt. 2004. �The causes and consequences
of distinctively black names,� Quarterly Journal of Economics, 119(3): 767�805.
[29] Funk, Patricia, and Christina Gathman. 2010. �Gender gaps in policy making:
Evidence from direct democracy in Switzerland,� mimeo, Universitat Pompeu
Fabra.
[30] Gallarduci, Stefano, and Daniele Passerman. 2012. �Gender interactions within
hierarchies: Evidence from the political arena,� Review of Economic Studies,
vol.79, No.3, pp.1021-1052
[31] Gneezy, Uri, Muriel Niederle, and Aldo Rustichini. 2003. �Performance in
competitive environments: gender di�erences,� The Quarterly Journal of Eco-
nomics, 118(3): 1049�1074.
[32] Gneezy, Uri, and Aldo Rustichini. 2004. �Gender and competition at a young
age,� The American Economic Review: Papers and Proceedings, 94(2): 377�381.
[33] Goldin, Claudia, and Lawrence F. Katz. 2008. �Transitions: Career and family
lifecycles of the educational elite,� The American Economic Review: Papers
and Proceedings, 98(2): 363�369.
[34] Goldin, Claudia, and Cecilia Rouse. 2000. �Orchestrating impartiality: The im-
pact of `blind' auditions on female musicians,� The American Economic Review,
90(4): 715�741.
[35] Hogan, Robert E. 2010. �Candidate gender and voter support in state legislative
elections,� Journal of Women, Politics & Policy, 31(1): 44�66.
[36] Kahn, Lawrence M. 2000. �The sports business as a labor market laboratory,�
The Journal of Economic Perspectives, 14(3): 75�94.
23
[37] Key, Valdimer Orlando (1949). �Southern politics in state and nation.� New
York: Knopf
[38] Knowles, John, Nicola Persico, and Petra Todd. 2001. �Racial bias in motor
vehicle searches: Theory and evidence,� The Journal of Political Economy,
109(1): 203�229.
[39] Koch, Je�rey W. 2000. �Do citizens apply gender stereotypes to infer candidates'
ideological orientations?� The Journal of Politics, 62(2): 414�429.
[40] Robert J. LaLonde (1986). �Evaluating the Econometric Evaluations of Training
Programs with Experimental Data.� The American Economic Review Vol. 76,
No. 4 (Sep., 1986), pp. 604-620
[41] Lawless, Jennifer L. 2004. �Women, war, and winning elections: Gender stereo-
typing in the post-September 11th era,� Political Research Quarterly, 57:
479�490.
[42] Lawless, Jennifer, and Richard Fox. 2005. It Takes A Candidate: Why Women
Don't Run for Political O�ce. New York: Cambridge University Press.
[43] Lawless, Jennifer L., and Richard L. Fox. 2010. It Still Takes A Candidate.
Cambridge (UK): Cambridge University Press.
[44] Leuven, Edwin, and Barbara Sianesi. 2012. �PSMATCH2: Stata module to per-
form full Mahalanobis and propensity score matching, common support graph-
ing, and covariate imbalance testing,� Statistical Software Components.
[45] Montalvo, Jose G. 2009. �Voting after bombings: a natural experiment on the
e�ect of terrorist attacks on democratic elections,� forthcoming in Review of
Economics and Statistics.
[46] McDermott, Monika L. 1997. �Voting cues in low-information elections: Can-
didate gender as a social information variable in contemporary United States
elections,� American Journal of Political Science, 41(1): 270�283.
[47] McDermott, Monika L. 1998. �Race and gender cues in low-information elec-
tions,� Political Research Quarterly, 51(4): 895�918.
[48] Murray, Rainbow. 2008. �The Power of Sex and Incumbency: A Longitudinal
Study of Electoral Performance in France.� Party Politics, 2008, Vol. 14, No. 5,
pp.539-554.
24
[49] Niederle, Muriel, and Lise Vesterlund. 2007. �Do women shy away from compe-
tition? Do men compete too much?� Quarterly Journal of Economics, 122(3):
1067�1101.
[50] Norris, Pippa. 2006. �The impact of electoral reform on women's representa-
tion,� Acta Politica, 41(2): 197�213.
[51] Norris, Pippa, and Mona Lena Krook. 2011. �Gender equality in elected o�ce:
A six step action plan,� OSCE Draft Report.
[52] Plutzer, Eric, and John F. Zipp. 1996. �Identity politics, partisanship, and
voting for women candidates,� Public Opinion Quarterly, 60: 30�57.
[53] Price, Joseph, and Justin Wolfers. 2010. �Racial discrimination among NBA
referees,� The Quarterly Journal of Economics, 125(4): 1859�1887.
[54] Rehavi, M. Marit. 2007. �Sex and politics: Do female legislators a�ect state
spending?� mimeo, University of California, Berkeley.
[55] Reuben, Ernesto, Pedro Rey-Biel, Paola Sapienza, and Luigi Zingales. 2010.
�The emergence of male leadership in competitive environments,� IZA Discusion
Paper No. 5300.
[56] Sanbonmatsu, Kira. 2002. �Political parties and the recruitment of women to
state legislatures,� Journal of Politics, 64: 791�809.
[57] Sanbonmatsu, Kira. 2006.Where Women Run: Gender and Party in the Amer-
ican States. Ann Arbor: The University of Michigan Press.
[58] Saiz, Albert, and Susan Wachter. 2011. �Immigration and the neighborhood,�
American Economic Journals: Policy, 3(2): 169�88.
[59] Smith, Amy Erica (2010). �Local Connections: Social Networks, Local Politi-
cians, and Neighborhood Leaders in a Developing Democracy� Working Paper
SSRN-1671145.
[60] Smith, Eric R. A. N., and Richard L. Fox. 2001. �The electoral fortunes of
women candidates for Congress,� Political Research Quarterly, 54: 205�221.
[61] Solé-Ollé, Albert, and Elisabet Viladecans-Marsal. 2012. �Lobbying, political
competition, and local land supply: Recent evidence from Spain,� Journal of
Public Economics, 96(1): 10�19.
25
[62] Szymanski, Stefan. 2000. �A market test for discrimination in the English pro-
fessional soccer leagues,� The Journal of Political Economy, 108(3): 590�603.
[63] Swers, Michele L. 1998. �Are women more likely to vote for women's issue bills
than their male colleagues?� Legislative Studies Quarterly, 23: 435�448.
[64] Verge, Tània. 2006. �Mujer y Partidos politicos en Espana: las estrategias de
los partidos y su impacto institucional, 1978-2004,� Revista Espanola de Inves-
tigaciones Sociologicas, 115: 165�196.
[65] Verge, Tània and Maria de la Fuente. 2014. �Playing with di�erent cards: Party
politics, gender quotas and women's empowerment.� International Political Sci-
ence Review, Vol. 35, No.1, pp. 67-79.
[66] Welch, Susan. 1985. �Are women more liberal than men in the U.S. Congress?�
Legislative Studies Quarterly, 10: 125�134.
26
Appendix: Formal results.
The �rst proposition describes the e�ects of a quota in the absence of party discrimination.
Proposition 2 (Voter preferences or self-selection). Suppose that dp = 0, dv (p) ≥ 0, and
fpm �rst-order stochastically dominates fpw for all p. Suppose also that W1 < Wp for all
p > 1 when no female quotas are imposed. Then, introducing a quota W > W1 and W < Wp
for p > 1 decreases the number of votes for party 1, and increases the number of votes for
all other parties. Furthermore, if turnout is increasing in Vp for all p, then the quota also
decreases turnout.
Proof. Notice that because dp = 0, all parties choose apw−apm = dv (p). De�ne the function
Ψ(a
′w
)=´ awa′w
afpw (a) da −´ a′mam
afpm (a) da − dv (p)´ awa′w
fpw (a) da, where 1 − Fpw (aw) −Fpm (am) = 1 − Fpw
(a
′w
)− Fpm
(a
′m
)= 0 and aw − am = dv (p). It is easy to see that
Ψ (aqw) = ∆V1 when p = 1 and 1 − F (aqw) = W . This means that Ψ (aqw) measures the
change of party p's votes after the introduction of quotas. If we di�erentiate with respect to
a′w we obtain:
∂Ψ
∂a′w
= −a′
wfpw
(a
′
w
)− a′
mfpm
(a
′
m
) ∂a′m
∂a′w
− dv (p) fpw
(a
′
w
)= −fpw
(a
′
w
) [dv (p)−
(a
′
w − a′
m
)]The equality in the second line follows from the fact that fpm
(a
′m
) ∂a′m∂a′w
= −fpw(a
′w
).24
Finally, notice that ∂Ψ∂a′w
< 0 whenever a′w − a
′m < dv (p). Because party 1's policy was
maximizing its share of the votes, it must be the case that a′w − a
′m < dv (p), and hence
∂Ψ∂a′w
< 0, for all a′w ∈ (aqw, aw). As a result, Ψ (aqw) < 0 and V1 falls when the quota is
introduced.
Because the optimal policies of the other parties are una�ected by party 1's list, and are
therefore the same before and after the quota, Vp does not change for p > 1. As a result,
both party 1's share of the votes and turnout fall, while the vote share for the other parties
increases.
The next proposition describes the e�ect of quotas under party discrimination. We
restrict attention to vote share functions φp that are either separable in Vp and V−p, or take
the form φp (Vp, V−p) = ψp (Vp) /∑N
n=1 ψn (Vn). These are very natural forms that arise in
several contexts. For instance, consider a linear voting model in which two parties are located
24The last equality follows from di�erentiating the equation 1 − Fpw
(a
′
w
)− Fpm
(a
′
m
)= 0 with respect
to a′
w.
27
at the extremes of the [0, 1] interval and voters are distributed uniformly along the line. We
represent the preferences of a voter located in x ∈ [0, 1] as: u (x, p) = vp − t2|p− x| + Ap −
dv (x)Wp, where u (x, p) represents the utility from voting for the party located in p ∈ {0, 1}.The term − t
2|p− x| captures the disutility from voting for a party whose policy p di�ers
from the preferred policy x. The parameter t measures the degree of competition between
the two parties (how substitutable they are for voters). Suppose also that the utility from
not voting is su�ciently low to induce all voters to turn out to vote. Then, the marginal
voter is implicitly de�ned by the equation: x = 12
+ 1t
[(A0 − A1)− dv (x) (W0 −W1)].25 This
equation also de�nes the vote shares of the two parties, assuming that φp are separable in
Vp and V−p is a generalization of such a model. Alternatively, another common approach
to modeling political elections is to assume a Tullock contest success function, which takes
the form φp (Vp, V−p) = ψp (Vp) /∑N
n=1 ψn (Vn). In this case, we can interpret ψp (Vp) as the
votes received by party p and∑N
n=1 ψn (Vn) would be the total voter turnout.
Proposition 3 (Party discrimination). Let φp be either separable in Vp and V−p, or take
the form φp (Vp, V−p) = ψp (Vp) /∑N
n=1 ψn (Vn). Suppose that dp > 0, while fpw = fpm, and
dv = 0 for all p. Suppose also that W1 < Wp for all p > 1 when no female quotas are
imposed. Then, introducing a quota W > W1, W < Wp for p > 1, and W ≤ 12increases the
share of votes for party 1 and decreases votes for all other parties. Furthermore, if turnout
is increasing in Vp for all p, then the quota increases turnout.
Proof. Prior to the introduction of the quota, parties select candidates by setting apw−apm =
dp
(∂φp∂Vp
)−1
. Notice that apw − apm > 0, while voters would prefer parties to set apw = apm.
Furthermore, because fpw = fpm and W ≤ 12, party 1 still sets aq1w− a
q1m > 0 after the quota
is introduced. Hence, ∂Ψ/∂a′w ≥ 0 for all a
′w ∈ [aqw, aw]. As a result, it must be the case that
V1 increases after the quota. Furthermore, it must be the case that party 1's share of the
votes φ1 increases as well. We show this for each of the two cases.
Suppose that φp is separable in Vp and V−p. Then, ∂φp/∂Vp depends only on Vp and not
on V−p. As a result, apw−apm does not change after the quota for all parties p > 1. Because
V1 increases, it must be the case that φp decreases for all p > 1, while φ1 increases.
Suppose now that φp (Vp, V−p) = ψp (Vp) /∑N
n=1 ψn (Vn), and suppose by contradiction
that party 1's vote share decreases. Because V1 increases,∑N
n=1 ψn (Vn) must also be higher
after the quota. Furthermore, there exists another party p > 1 that gains vote share, so that∑n 6=p ψn (Vn) /
∑Nn=1 ψn (Vn) = 1 − ψp (Vp) /
∑Nn=1 ψn (Vn) decreases after the quota. Then,
it must be the case that(∑N
n=1 ψn (Vn))2
/∑
n6=p ψn (Vn) increases. Notice that(∂φp∂Vp
)−1
=
25See our companion working paper for more details.
28
(∑Nn=1 ψn (Vn)
)2
/∑
n6=p ψn (Vn). Hence, apw− apm increases and party p would be selecting
fewer women than before. Because that reduces the average ability of its candidates, Vp (and
hence ψp (Vp)) must decrease. But this contradicts the fact that party p increases its share
of votes.
Next, we show that turnout cannot fall when all voters vote before the quota. To see
this, assume instead that∑N
n=1 ψn (Vn) falls after the quota. Because party 1 gains vote share,
there must be another party p > 1 that loses vote share. As a result,∑
n 6=p ψn (Vn) /∑N
n=1 ψn (Vn) =
1−ψp (Vp) /∑N
n=1 ψn (Vn) increases, and hence(∑N
n=1 ψn (Vn))2
/∑
n6=p ψn (Vn) decreases af-
ter the quota. This means that apw − apm decreases and party p would be selecting more
women than before. Because this increases Vp, and turnout is lower, party p must gain vote
share, in contradiction to what we assumed. It follows that turnout must increase after the
quota.
Finally, suppose that party p > 1 gains vote share after the quota, so that∑
n 6=p ψn (Vn) /∑N
n=1 ψn (Vn)
decreases, and hence because∑N
n=1 ψn (Vn) increases,(∑N
n=1 ψn (Vn))2
/∑
n6=p ψn (Vn) also
increases after the quota. This means that apw−apm increases and party p would be selecting
fewer women than before. Because this decreases Vp, and turnout is higher, party p must
lose vote share, in contradiction to what we assumed. It therefore follows that no party
p > 1 can gain vote share after the quota.
29
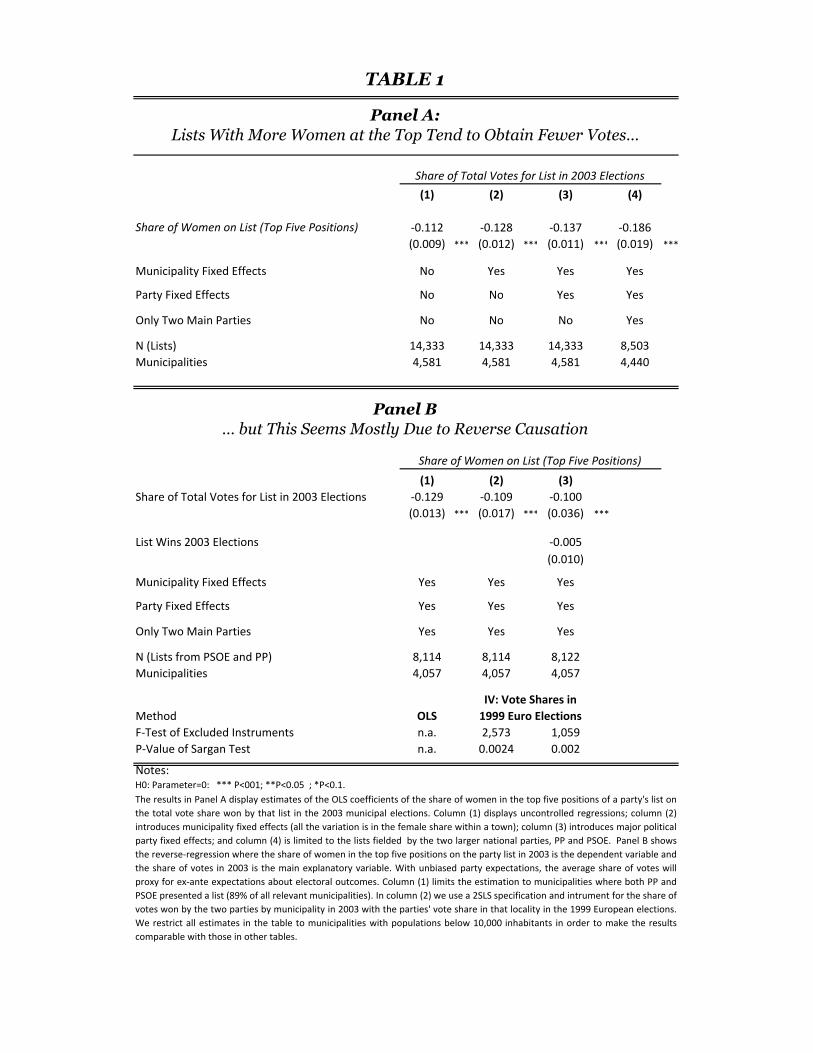
(1) (2) (3) (4)
Share of Women on List (Top Five Positions) -0.112 -0.128 -0.137 -0.186
(0.009) *** (0.012) *** (0.011) *** (0.019) ***
Municipality Fixed Effects No Yes Yes Yes
Party Fixed Effects No No Yes Yes
Only Two Main Parties No No No Yes
N (Lists) 14,333 14,333 14,333 8,503
Municipalities 4,581 4,581 4,581 4,440
(1) (2) (3)
Share of Total Votes for List in 2003 Elections -0.129 -0.109 -0.100
(0.013) *** (0.017) *** (0.036) ***
List Wins 2003 Elections -0.005
(0.010)
Municipality Fixed Effects Yes Yes Yes
Party Fixed Effects Yes Yes Yes
Only Two Main Parties Yes Yes Yes
N (Lists from PSOE and PP) 8,114 8,114 8,122
Municipalities 4,057 4,057 4,057
Method OLS
F-Test of Excluded Instruments n.a. 2,573 1,059
P-Value of Sargan Test n.a. 0.0024 0.002
Notes:
The results in Panel A display estimates of the OLS coefficients of the share of women in the top five positions of a party's list on
the total vote share won by that list in the 2003 municipal elections. Column (1) displays uncontrolled regressions; column (2)
introduces municipality fixed effects (all the variation is in the female share within a town); column (3) introduces major political
party fixed effects; and column (4) is limited to the lists fielded by the two larger national parties, PP and PSOE. Panel B shows
the reverse-regression where the share of women in the top five positions on the party list in 2003 is the dependent variable and
the share of votes in 2003 is the main explanatory variable. With unbiased party expectations, the average share of votes will
proxy for ex-ante expectations about electoral outcomes. Column (1) limits the estimation to municipalities where both PP and
PSOE presented a list (89% of all relevant municipalities). In column (2) we use a 2SLS specification and intrument for the share of
votes won by the two parties by municipality in 2003 with the parties' vote share in that locality in the 1999 European elections.
We restrict all estimates in the table to municipalities with populations below 10,000 inhabitants in order to make the results
comparable with those in other tables.
Share of Women on List (Top Five Positions)
IV: Vote Shares in
1999 Euro Elections
TABLE 1
H0: Parameter=0: *** P<001; **P<0.05 ; *P<0.1.
Lists With More Women at the Top Tend to Obtain Fewer Votes…
Panel A:
Panel B
… but This Seems Mostly Due to Reverse Causation
Share of Total Votes for List in 2003 Elections
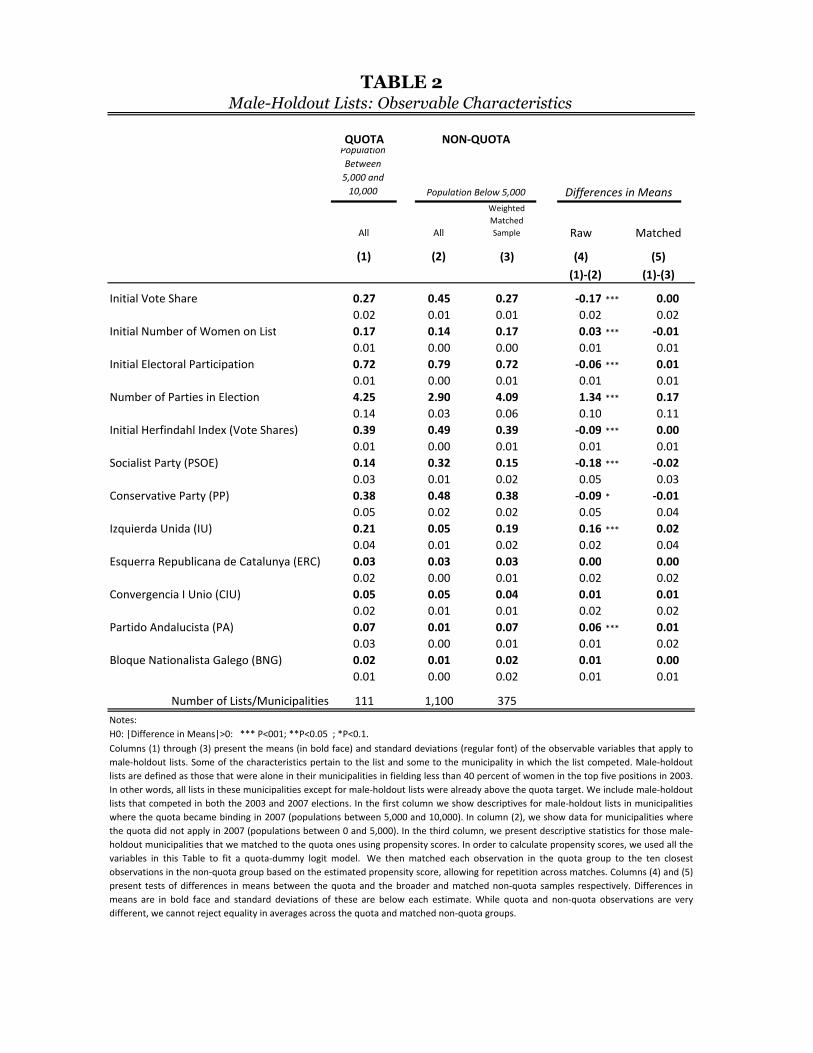
QUOTAPopulation
Between
5,000 and
10,000
All All
Weighted
Matched
Sample Raw Matched
(1) (2) (3) (4) (5)
(1)-(2) (1)-(3)
Initial Vote Share 0.27 0.45 0.27 -0.17 *** 0.00
0.02 0.01 0.01 0.02 0.02
Initial Number of Women on List 0.17 0.14 0.17 0.03 *** -0.01
0.01 0.00 0.00 0.01 0.01
Initial Electoral Participation 0.72 0.79 0.72 -0.06 *** 0.01
0.01 0.00 0.01 0.01 0.01
Number of Parties in Election 4.25 2.90 4.09 1.34 *** 0.17
0.14 0.03 0.06 0.10 0.11
Initial Herfindahl Index (Vote Shares) 0.39 0.49 0.39 -0.09 *** 0.00
0.01 0.00 0.01 0.01 0.01
Socialist Party (PSOE) 0.14 0.32 0.15 -0.18 *** -0.02
0.03 0.01 0.02 0.05 0.03
Conservative Party (PP) 0.38 0.48 0.38 -0.09 * -0.01
0.05 0.02 0.02 0.05 0.04
Izquierda Unida (IU) 0.21 0.05 0.19 0.16 *** 0.02
0.04 0.01 0.02 0.02 0.04
Esquerra Republicana de Catalunya (ERC) 0.03 0.03 0.03 0.00 0.00
0.02 0.00 0.01 0.02 0.02
Convergencia I Unio (CIU) 0.05 0.05 0.04 0.01 0.01
0.02 0.01 0.01 0.02 0.02
Partido Andalucista (PA) 0.07 0.01 0.07 0.06 *** 0.01
0.03 0.00 0.01 0.01 0.02
Bloque Nationalista Galego (BNG) 0.02 0.01 0.02 0.01 0.00
0.01 0.00 0.02 0.01 0.01
Number of Lists/Municipalities 111 1,100 375
Notes:
Columns (1) through (3) present the means (in bold face) and standard deviations (regular font) of the observable variables that apply to
male-holdout lists. Some of the characteristics pertain to the list and some to the municipality in which the list competed. Male-holdout
lists are defined as those that were alone in their municipalities in fielding less than 40 percent of women in the top five positions in 2003.
In other words, all lists in these municipalities except for male-holdout lists were already above the quota target. We include male-holdout
lists that competed in both the 2003 and 2007 elections. In the first column we show descriptives for male-holdout lists in municipalities
where the quota became binding in 2007 (populations between 5,000 and 10,000). In column (2), we show data for municipalities where
the quota did not apply in 2007 (populations between 0 and 5,000). In the third column, we present descriptive statistics for those male-
holdout municipalities that we matched to the quota ones using propensity scores. In order to calculate propensity scores, we used all the
variables in this Table to fit a quota-dummy logit model. We then matched each observation in the quota group to the ten closest
observations in the non-quota group based on the estimated propensity score, allowing for repetition across matches. Columns (4) and (5)
present tests of differences in means between the quota and the broader and matched non-quota samples respectively. Differences in
means are in bold face and standard deviations of these are below each estimate. While quota and non-quota observations are very
different, we cannot reject equality in averages across the quota and matched non-quota groups.
Population Below 5,000
TABLE 2
Male-Holdout Lists: Observable Characteristics
Differences in Means
H0: |Difference in Means|>0: *** P<001; **P<0.05 ; *P<0.1.
NON-QUOTA
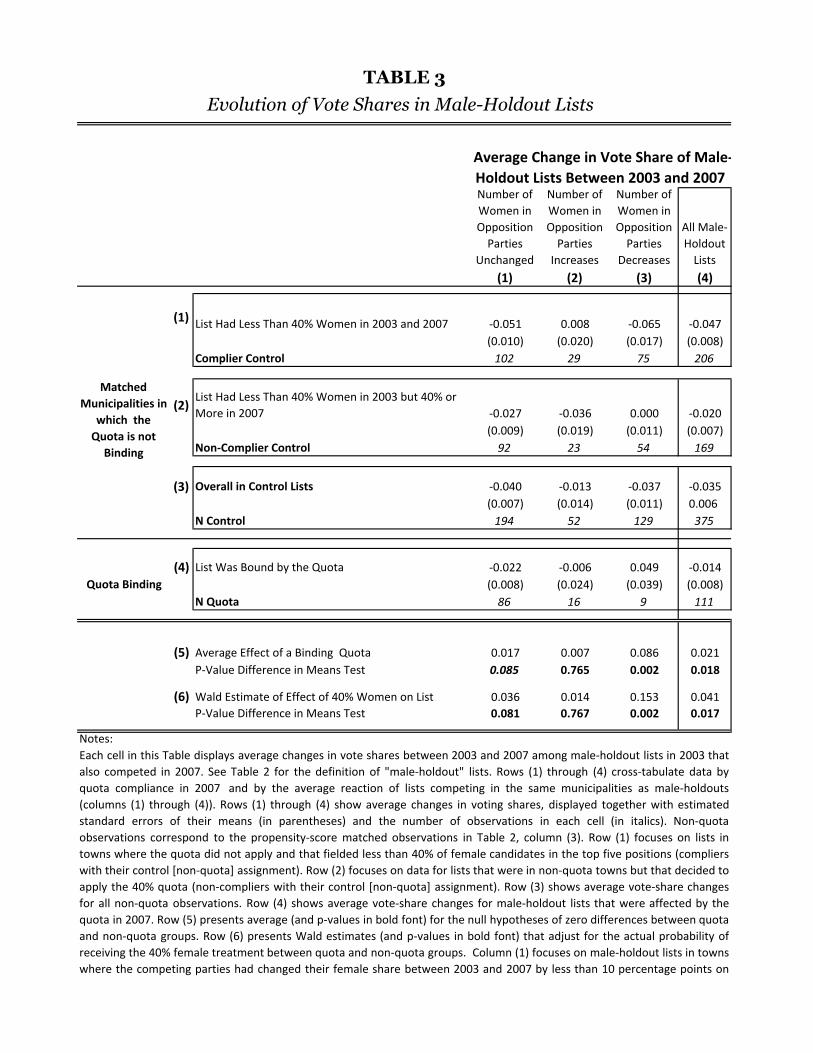
Number of
Women in
Opposition
Parties
Unchanged
Number of
Women in
Opposition
Parties
Increases
Number of
Women in
Opposition
Parties
Decreases
All Male-
Holdout
Lists
(1) (2) (3) (4)
(1)List Had Less Than 40% Women in 2003 and 2007 -0.051 0.008 -0.065 -0.047
(0.010) (0.020) (0.017) (0.008)
Complier Control 102 29 75 206
(2)List Had Less Than 40% Women in 2003 but 40% or
More in 2007 -0.027 -0.036 0.000 -0.020
(0.009) (0.019) (0.011) (0.007)
Non-Complier Control 92 23 54 169
(3) Overall in Control Lists -0.040 -0.013 -0.037 -0.035
(0.007) (0.014) (0.011) 0.006
N Control 194 52 129 375
(4) List Was Bound by the Quota -0.022 -0.006 0.049 -0.014
(0.008) (0.024) (0.039) (0.008)
N Quota 86 16 9 111
(5) Average Effect of a Binding Quota 0.017 0.007 0.086 0.021
P-Value Difference in Means Test 0.085 0.765 0.002 0.018
(6) Wald Estimate of Effect of 40% Women on List 0.036 0.014 0.153 0.041
P-Value Difference in Means Test 0.081 0.767 0.002 0.017
Notes:
Each cell in this Table displays average changes in vote shares between 2003 and 2007 among male-holdout lists in 2003 that
also competed in 2007. See Table 2 for the definition of "male-holdout" lists. Rows (1) through (4) cross-tabulate data by
quota compliance in 2007 and by the average reaction of lists competing in the same municipalities as male-holdouts
(columns (1) through (4)). Rows (1) through (4) show average changes in voting shares, displayed together with estimated
standard errors of their means (in parentheses) and the number of observations in each cell (in italics). Non-quota
observations correspond to the propensity-score matched observations in Table 2, column (3). Row (1) focuses on lists in
towns where the quota did not apply and that fielded less than 40% of female candidates in the top five positions (compliers
with their control [non-quota] assignment). Row (2) focuses on data for lists that were in non-quota towns but that decided to
apply the 40% quota (non-compliers with their control [non-quota] assignment). Row (3) shows average vote-share changes
for all non-quota observations. Row (4) shows average vote-share changes for male-holdout lists that were affected by the
quota in 2007. Row (5) presents average (and p-values in bold font) for the null hypotheses of zero differences between quota
and non-quota groups. Row (6) presents Wald estimates (and p-values in bold font) that adjust for the actual probability of
receiving the 40% female treatment between quota and non-quota groups. Column (1) focuses on male-holdout lists in towns
where the competing parties had changed their female share between 2003 and 2007 by less than 10 percentage points on
average (vote-weighted). Column (2) displays results for male-holdout lists in municipalities where all other lists increased
TABLE 3
Evolution of Vote Shares in Male-Holdout Lists
Quota Binding
Matched
Municipalities in
which the
Quota is not
Binding
Average Change in Vote Share of Male-
Holdout Lists Between 2003 and 2007
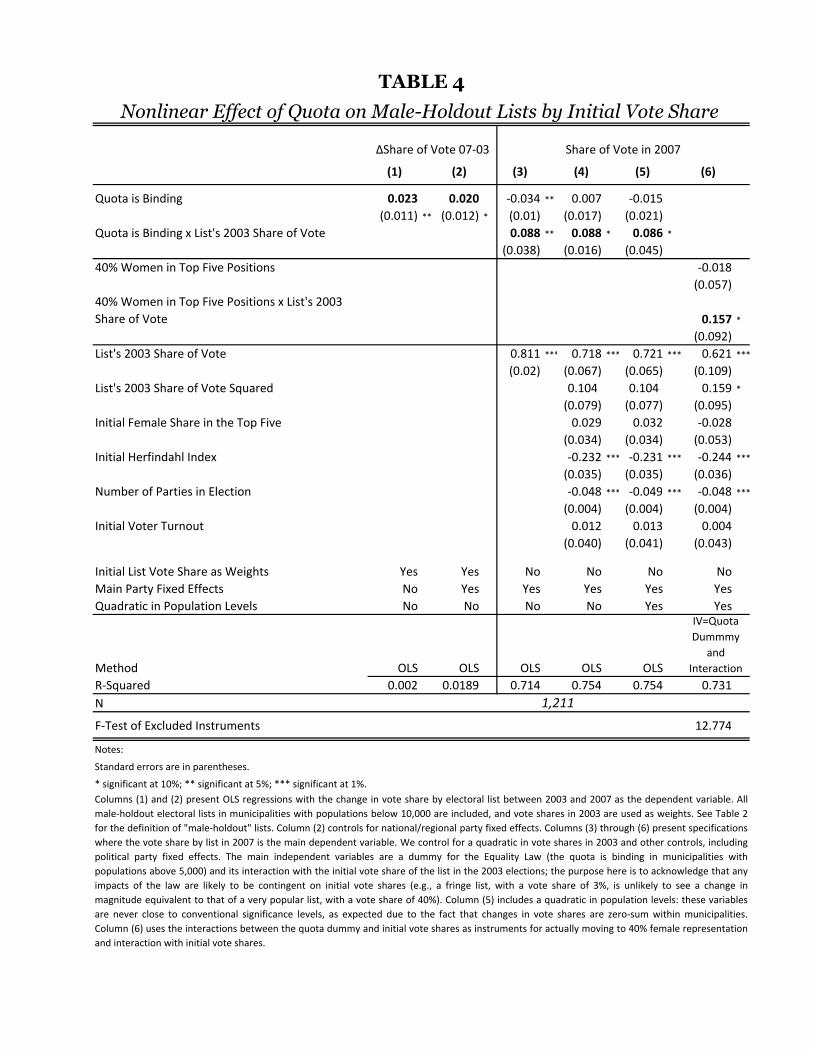
(1) (2) (3) (4) (5) (6)
Quota is Binding 0.023 0.020 -0.034 ** 0.007 -0.015
(0.011) ** (0.012) * (0.01) (0.017) (0.021)
Quota is Binding x List's 2003 Share of Vote 0.088 ** 0.088 * 0.086 *
(0.038) (0.016) (0.045)
40% Women in Top Five Positions -0.018
(0.057)
40% Women in Top Five Positions x List's 2003
Share of Vote 0.157 *
(0.092)
List's 2003 Share of Vote 0.811 *** 0.718 *** 0.721 *** 0.621 ***
(0.02) (0.067) (0.065) (0.109)
List's 2003 Share of Vote Squared 0.104 0.104 0.159 *
(0.079) (0.077) (0.095)
Initial Female Share in the Top Five 0.029 0.032 -0.028
(0.034) (0.034) (0.053)
Initial Herfindahl Index -0.232 *** -0.231 *** -0.244 ***
(0.035) (0.035) (0.036)
Number of Parties in Election -0.048 *** -0.049 *** -0.048 ***
(0.004) (0.004) (0.004)
Initial Voter Turnout 0.012 0.013 0.004
(0.040) (0.041) (0.043)
Initial List Vote Share as Weights Yes Yes No No No No
Main Party Fixed Effects No Yes Yes Yes Yes Yes
Quadratic in Population Levels No No No No Yes Yes
Method OLS OLS OLS OLS OLS
R-Squared 0.002 0.0189 0.714 0.754 0.754 0.731
N
F-Test of Excluded Instruments 12.774
Notes:
Columns (1) and (2) present OLS regressions with the change in vote share by electoral list between 2003 and 2007 as the dependent variable. All
male-holdout electoral lists in municipalities with populations below 10,000 are included, and vote shares in 2003 are used as weights. See Table 2
for the definition of "male-holdout" lists. Column (2) controls for national/regional party fixed effects. Columns (3) through (6) present specifications
where the vote share by list in 2007 is the main dependent variable. We control for a quadratic in vote shares in 2003 and other controls, including
political party fixed effects. The main independent variables are a dummy for the Equality Law (the quota is binding in municipalities with
populations above 5,000) and its interaction with the initial vote share of the list in the 2003 elections; the purpose here is to acknowledge that any
impacts of the law are likely to be contingent on initial vote shares (e.g., a fringe list, with a vote share of 3%, is unlikely to see a change in
magnitude equivalent to that of a very popular list, with a vote share of 40%). Column (5) includes a quadratic in population levels: these variables
are never close to conventional significance levels, as expected due to the fact that changes in vote shares are zero-sum within municipalities.
Column (6) uses the interactions between the quota dummy and initial vote shares as instruments for actually moving to 40% female representation
and interaction with initial vote shares.
* significant at 10%; ** significant at 5%; *** significant at 1%.
Standard errors are in parentheses.
Nonlinear Effect of Quota on Male-Holdout Lists by Initial Vote Share
TABLE 4
Share of Vote in 2007
1,211
ΔShare of Vote 07-03
IV=Quota
Dummmy
and
Interaction
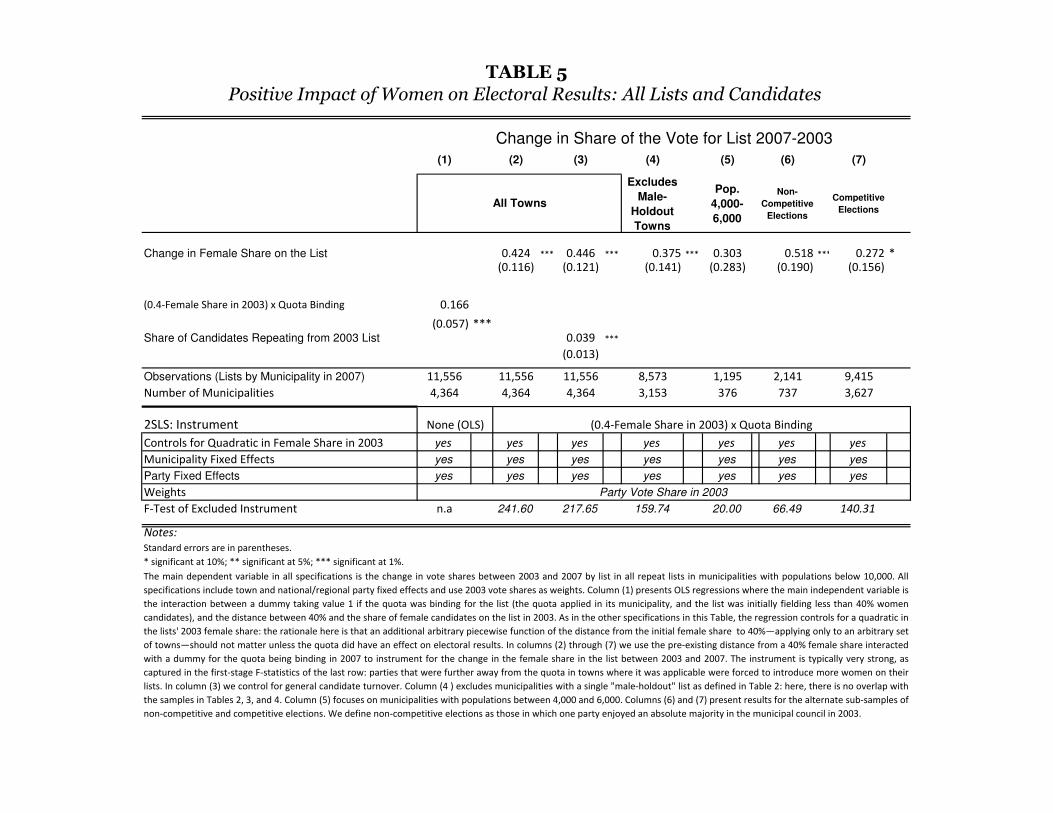
(1) (2) (3) (4) (5) (6) (7)
Excludes
Male-
Holdout
Towns
Pop.
4,000-
6,000
Non-
Competitive
Elections
Competitive
Elections
Change in Female Share on the List 0.424 *** 0.446 *** 0.375 *** 0.303 0.518 *** 0.272 *(0.116) (0.121) (0.141) (0.283) (0.190) (0.156)
(0.4-Female Share in 2003) x Quota Binding 0.166
(0.057) ***Share of Candidates Repeating from 2003 List 0.039 ***
(0.013)
Observations (Lists by Municipality in 2007) 11,556 11,556 11,556 8,573 1,195 2,141 9,415
Number of Municipalities 4,364 4,364 4,364 3,153 376 737 3,627
2SLS: Instrument
Controls for Quadratic in Female Share in 2003 yes yes yes yes yes yes yes
Municipality Fixed Effects yes yes yes yes yes yes yes
Party Fixed Effects yes yes yes yes yes yes yes
Weights
F-Test of Excluded Instrument n.a 241.60 217.65 159.74 20.00 66.49 140.31
Notes:
Standard errors are in parentheses.
* significant at 10%; ** significant at 5%; *** significant at 1%.
The main dependent variable in all specifications is the change in vote shares between 2003 and 2007 by list in all repeat lists in municipalities with populations below 10,000. All
specifications include town and national/regional party fixed effects and use 2003 vote shares as weights. Column (1) presents OLS regressions where the main independent variable is
the interaction between a dummy taking value 1 if the quota was binding for the list (the quota applied in its municipality, and the list was initially fielding less than 40% women
candidates), and the distance between 40% and the share of female candidates on the list in 2003. As in the other specifications in this Table, the regression controls for a quadratic in
the lists' 2003 female share: the rationale here is that an additional arbitrary piecewise function of the distance from the initial female share to 40%—applying only to an arbitrary set
of towns—should not matter unless the quota did have an effect on electoral results. In columns (2) through (7) we use the pre-existing distance from a 40% female share interacted
with a dummy for the quota being binding in 2007 to instrument for the change in the female share in the list between 2003 and 2007. The instrument is typically very strong, as
captured in the first-stage F-statistics of the last row: parties that were further away from the quota in towns where it was applicable were forced to introduce more women on their
lists. In column (3) we control for general candidate turnover. Column (4 ) excludes municipalities with a single "male-holdout" list as defined in Table 2: here, there is no overlap with
the samples in Tables 2, 3, and 4. Column (5) focuses on municipalities with populations between 4,000 and 6,000. Columns (6) and (7) present results for the alternate sub-samples of
non-competitive and competitive elections. We define non-competitive elections as those in which one party enjoyed an absolute majority in the municipal council in 2003.
(0.4-Female Share in 2003) x Quota Binding
TABLE 5
Positive Impact of Women on Electoral Results: All Lists and Candidates
Change in Share of the Vote for List 2007-2003
All Towns
None (OLS)
Party Vote Share in 2003
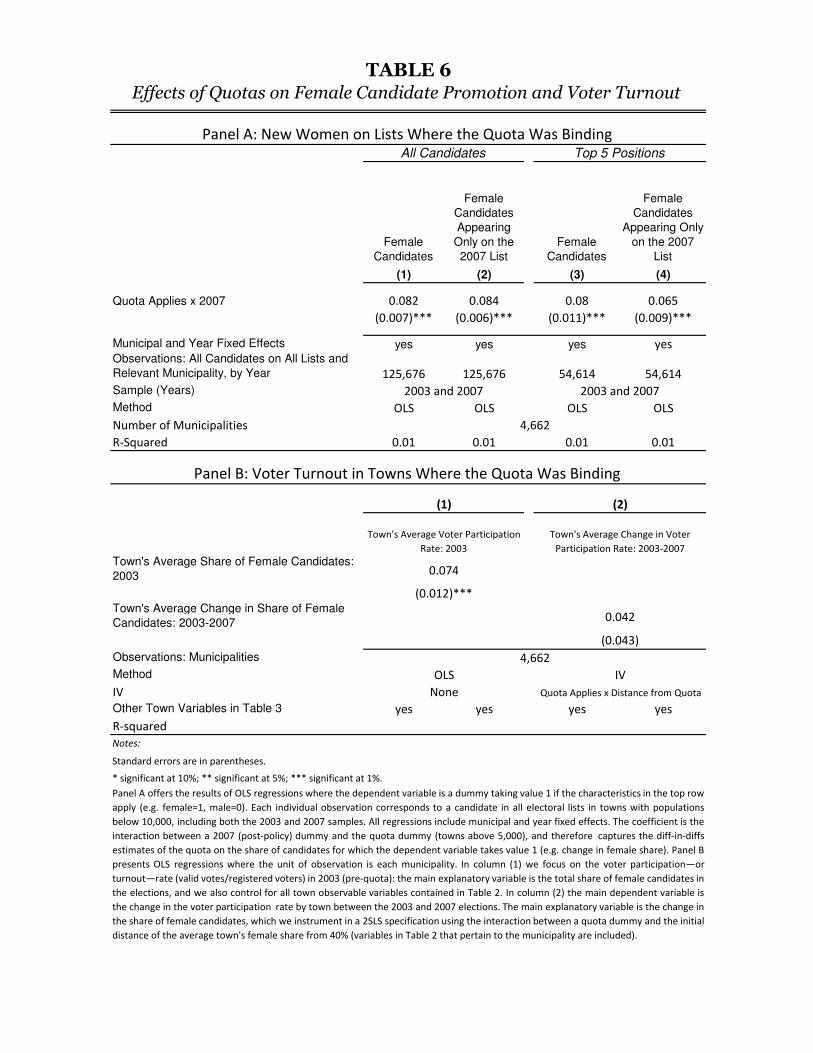
Female
Candidates
Female
Candidates
Appearing
Only on the
2007 List
Female
Candidates
Female
Candidates
Appearing Only
on the 2007
List
(1) (2) (3) (4)
Quota Applies x 2007 0.082 0.084 0.08 0.065
(0.007)*** (0.006)*** (0.011)*** (0.009)***
Municipal and Year Fixed Effects yes yes yes yesObservations: All Candidates on All Lists and
Relevant Municipality, by Year 125,676 125,676 54,614 54,614
Sample (Years)
Method OLS OLS OLS OLS
Number of Municipalities
R-Squared 0.01 0.01 0.01 0.01
Town's Average Share of Female Candidates:
2003
Town's Average Change in Share of Female
Candidates: 2003-2007
Observations: Municipalities
Method
IV
Other Town Variables in Table 3 yes yes yes yes
R-squared
Notes:
Standard errors are in parentheses.
* significant at 10%; ** significant at 5%; *** significant at 1%.
2003 and 2007 2003 and 2007
TABLE 6
Effects of Quotas on Female Candidate Promotion and Voter Turnout
All Candidates Top 5 Positions
Panel A: New Women on Lists Where the Quota Was Binding
Panel A offers the results of OLS regressions where the dependent variable is a dummy taking value 1 if the characteristics in the top row
apply (e.g. female=1, male=0). Each individual observation corresponds to a candidate in all electoral lists in towns with populations
below 10,000, including both the 2003 and 2007 samples. All regressions include municipal and year fixed effects. The coefficient is the
interaction between a 2007 (post-policy) dummy and the quota dummy (towns above 5,000), and therefore captures the diff-in-diffs
estimates of the quota on the share of candidates for which the dependent variable takes value 1 (e.g. change in female share). Panel B
presents OLS regressions where the unit of observation is each municipality. In column (1) we focus on the voter participation—or
turnout—rate (valid votes/registered voters) in 2003 (pre-quota): the main explanatory variable is the total share of female candidates in
the elections, and we also control for all town observable variables contained in Table 2. In column (2) the main dependent variable is
the change in the voter participation rate by town between the 2003 and 2007 elections. The main explanatory variable is the change in
the share of female candidates, which we instrument in a 2SLS specification using the interaction between a quota dummy and the initial
distance of the average town's female share from 40% (variables in Table 2 that pertain to the municipality are included).
Town's Average Voter Participation
Rate: 2003
Town's Average Change in Voter
Participation Rate: 2003-2007
0.074
4,662
Panel B: Voter Turnout in Towns Where the Quota Was Binding
OLS IV
None Quota Applies x Distance from Quota
(0.012)***
(0.043)
4,662
0.042
(1) (2)


![Unpopular Wonders of Tea That You Should Know [Infographic]](https://static.fdocuments.in/doc/165x107/5a648bf17f8b9a94568b4ae7/unpopular-wonders-of-tea-that-you-should-know-infographic.jpg)