Women and Men in Ireland - Home - CSO - Central … force participation rates for men and women over...
74
Women and Men in Ireland www.cso.ie Price €5 2011 Central Statistics Office IRELAND Price €5
Transcript of Women and Men in Ireland - Home - CSO - Central … force participation rates for men and women over...

Women and Men in Ireland
www.cso.ieDesigned and printed by the Central Statistics Office
ISBN 978-1-4064-2570-3
9 781406 425703 Price €5
2011
Central Statistics Office
IRELAND
Price €5

Published by the Stationery Office, Dublin, Ireland.
To be purchased from the:
Central Statistics Office, Information Section, Skehard Road, Cork,
Government Publications Sales Office, Sun Alliance House,
Molesworth Street, Dublin 2,
or through any bookseller.
Prn A12/0070 Price €5.00 January 2012

© Government of Ireland 2012
Material compiled and presented by the
Central Statistics Office.
Reproduction is authorised, except for commercial
purposes, provided the source is acknowledged.
ISSN 1649-6299
ISBN 978-1-4064-2571-0

Contents
Page
Chapter 1 Introduction and outline of report ...................................................................... 5 1.1 Introduction .................................................................................................. 6
1.2 Overview of selected indicators .................................................................... 6
1.3 Technical notes ............................................................................................ 6
Chapter 2 Indicators ............................................................................................................. 9 2.1 Highlights ................................................................................................... 10
2.2 Population .................................................................................................. 13
Employment ............................................................................................... 16
Social cohesion and lifestyles .................................................................... 27
Education ................................................................................................... 41
Health ......................................................................................................... 47
Crime .......................................................................................................... 54
Transport .................................................................................................... 56
Appendices .................................................................................................................................... 61
Appendix 1 Definitions and notes ........................................................................................ 62 Appendix 2 Eurostat and United Nations data sources ..................................................... 71


Chapter 1
Introduction and
outline of report

6
1.1 Introduction This chapter briefly reviews the background leading to the preparation by the CSO of gender indicators and the role of the social partners and the National Statistics Board (NSB) in requesting this work. The chapter also contains an overall summary of the selected indicators. The social partnership agreement1 2003-2005 requested the CSO to support a move towards more evidence-based policy-making. Responding to this request, the NSB asked the CSO to prepare social indicator reports covering all aspects of social statistics. The NSB placed considerable emphasis on the value of disaggregating the social indicators by key characteristics such as the nine equality grounds2 named in equality legislation. The CSO agreed with the Board a strategy of producing a series of key thematic social indicator reports that would be structured around the nine equality grounds. The CSO produced an initial gender report in December 2004. That report was very favourably received by national and international users. The CSO was requested by a number of users to produce the report on an annual basis. Further reports were produced in December 2005, 2006, 2007, April 2009, February 2010 and 2011. This report is the eighth in the series.
1.2 Overview of selected indicators The list of 76 selected indicators is presented in summary format in Table A. These indicators were chosen because they help to:
♦ Identify important gender differences in the activities of men and women. ♦ Assist users to identify the underlying reasons that explain these differences. ♦ Present the situation in Ireland in an international context.
Most indicators are presented in both a national and international context. The national context is generally in a time series format while the international context compares Ireland with other EU countries and, where available, with three EFTA countries (Iceland, Norway and Switzerland) and the three official candidate countries (Croatia, Macedonia and Turkey). In this report the indicator on EU average exit ages from the labour force has been dropped as the model used by Eurostat was not producing satisfactory results for many countries. A new graph has been added showing labour force participation rates for men and women over the last ten years. Chapter 2 presents the selected indicators. Where tables are not sorted by year, the heading of the sort column is highlighted with a darker background.
1.3 Technical notes Appendix 1 defines the indicators in greater detail and Appendix 2 gives the international data sources. While many of the national data are compiled by the CSO, we have also used survey and administrative data holdings held by Government departments and agencies wherever appropriate and possible. The data in the tables and graphs reflect the national and international data availability position as of late 2011. The following symbols are used: : data not available. * data not reliable.
1 Department of the Taoiseach (2003): Sustaining Progress, Social Partnership Agreement 2003-2005. 2 The nine grounds of unlawful discrimination named in equality legislation are: Gender, marital status, family status, age, disability, race, sexual orientation, religious belief and membership of the traveller community.

7
Table A Domains and indicators used
Domain Indicator
1. Population
Population profile 1.1 Ireland: Population by age group 1.2 EU: Men per 100 women Migration 1.3 Ireland: Migration by age group 1.4 Ireland: Migration
2. Employment
Employment rates 2.1 Ireland and EU: Employment rate 2.2 Ireland and EU: Female employment rate 2.3 EU: Employment rate 2.4 Ireland: Employment rate for persons aged 55-64 Labour force participation 2.5 Ireland: Labour force participation rate (ILO) by age group 2.6 Ireland: Labour force participation rate Occupation 2.7 Ireland: Persons in employment by occupation Employment by sector 2.8 Ireland and EU: Employment by economic sector Employment and usual hours worked
2.9
Ireland: Employment by usual hours worked
2.10 Ireland: Employment by marital status and usual hours worked Employment and family status
2.11 Ireland: Employment rates of couples and lone parents aged 20-44 by age of youngest child
Pensions 2.12 Ireland: Pension coverage of persons aged 20-69 in employment Unemployment rates 2.13 Ireland: Unemployment rates by age group 2.14 Ireland: Unemployment rates and long-term unemployment rates 2.15 Ireland and EU: Unemployment rates 2.16 EU: Unemployment rates 2.17 EU: Male unemployment rates map 2.18 EU: Female unemployment rates map
3. Social cohesion and lifestyles
Principal economic status 3.1 Ireland: Principal economic status Income and gender pay gap 3.2 Ireland: Income liable for social insurance 3.3 Ireland: Average income liable for social insurance by age 3.4 EU: Gender pay gap Risk of poverty 3.5 EU: At risk of poverty rates 3.6 Ireland: At risk of poverty rate by most frequent economic activity 3.7 Ireland: At risk of poverty rate by age Early school leavers 3.8 EU: Early school leavers Lone parents 3.9 Ireland: Lone parents 3.10 Ireland: Lone parents by age of youngest child 3.11 Ireland: Recipients of one-parent family payment by age Fertility rate 3.12 Ireland: Age of women at birth of first child 3.13 EU: Age of women at birth of first child and total fertility rate Decision-making 3.14 EU: Representation in national parliaments 3.15 Ireland: Women and men in decision-making 3.16 Ireland: Civil Service general service grades Religion 3.17 Ireland: Religion by age group 3.18 Ireland: Religion by nationality Sports participation 3.19 Ireland: Grants to high-performance athletes by age of athlete 3.20 Ireland: Grants to high-performance athletes by size of grant Grants to artists 3.21 Ireland: Arts Council grants to artists by artform 3.22 Ireland: Arts Council grants to artists by size of grant

8
Domain Indicator
4. Education
Second-level education 4.1 Ireland: Leaving Certificate candidates Third-level graduates 4.2 Ireland: Third-level graduates by field of study Participation in education 4.3 Ireland: Students as proportion of population aged 18-24 Educational attainment 4.4 Ireland: Persons aged 25-34 with third-level qualification 4.5 Ireland: Persons aged 35-64 by highest level of education attained Education personnel 4.6 Ireland: Classroom teachers 4.7 EU: Classroom teachers and academic staff 4.8 EU: School management personnel
5. Health
Life expectancy 5.1 Ireland: Life expectancy at birth and at 65 years 5.2 EU: Life expectancy at birth Death rates 5.3 Ireland: Age-sex specific death rates 5.4 Ireland: Death rates for persons aged 65-74 5.5 Ireland: Mortality by cause of death Medical cards 5.6 Ireland: Persons with a Medical Card Hospital activity 5.7 Ireland: Acute hospital discharges by principal diagnosis 5.8 Ireland: Acute hospital discharges by patient type Mental illness and disability 5.9 Ireland: Persons with an intellectual disability by level of disability 5.10 Ireland: Admissions to psychiatric hospitals and units Carers 5.11 Ireland: Recipients of Carer’s Allowance and Carer’s Benefit 5.12 Ireland: Recipients of Carer’s Allowance and Carer’s Benefit by age 5.13 Ireland: Labour force participation rate of carers by unpaid help provided Health personnel 5.14 Ireland: Health service personnel by grade category
6. Crime
Criminal convictions 6.1 Ireland: Prisoners by offence group 6.2 EU: Criminal convictions Victims of crime 6.3 EU: Victims of selected crimes 6.4 Ireland: Murder/manslaughter recorded by age of victim
7. Transport
Travel to work 7.1 Ireland: Means of travel to work 7.2 Ireland: Time taken to travel to work Road traffic accidents 7.3 Ireland: Road fatalities by road user type 7.4 Ireland: Road fatalities 7.5 Ireland: Road casualties by age of victim Driving licences 7.6 Ireland: Current driving licences by age of holder

Chapter 2
Indicators

10
2.1 Highlights Irish women work fewer hours, earn less and are under-represented in the Oireachtais and in local and regional authorities. Men leave school earlier and women are more highly qualified. Men have a higher rate of employ-ment, but also a far higher rate of unemployment. Men are more likely to be in the labour force and those look-ing after home/family are overwhelmingly female. Women in Ireland have a higher fertility rate than women from any other EU country. Most workers in the Health and Education sectors are women while most workers in Agri-culture, Construction and Transport are men. Women are more likely to be admitted to hospital with depression and men are more likely to be admitted with schizophrenia and alcoholic disorders. Men are more likely to die young, most murder victims are male and the vast majority of the prison population is male. Education: The early school leavers rate among women aged 18-24 in 2010 was 8.4%, which was much lower than the male rate of 12.6%. In 2011 more girls obtained an A or B on the honours paper in the Leaving Certifi-cate exams in English, Irish, French, Biology, Chemistry, Art and Music while more boys obtained an A or B on the honours paper in Maths, Physics, Construction studies and Engineering. Men accounted for nearly five-sixths of third-level graduates in Engineering, manufacturing and construction and 57% of graduates in Science, while women accounted for 82% of graduates in Health and welfare, 74% in Education and 63% in Arts and humanities. Women are more likely to have a third-level qualification, with over half (53%) of women aged 25-34 having a third-level qualification compared with nearly four out of ten men (39%) in this age group (Tables 3.8, 4.1, 4.2 and 4.4). Employment: The employment rate for men in Ireland stood at about 75% over recent years, but in 2009 it plummeted to 67.3%, decreased sharply in 2010 to 64.5% and dropped again to 63.3% in 2011. The EU target rate for women in employment is 60% by 2010, a target that was met by Ireland in 2007 and 2008, but not in 2009, 2010 or 2011, when the rate had fallen to 56%. In 2011 46.7% of those in employment were women. Men worked an average of 39.4 hours a week in 2011 compared with 30.6 for women and married men worked longer hours than married women, with nearly half (44.5%) of married men working for 40 hours or more a week compared with only 14.7% of married women (Tables 2.1, 2.7, 2.9 and 2.10). Unemployment: The unemployment rate for men in Ireland was about 5% in recent years but in 2009 it in-creased dramatically to 15.1% and has increased over the last two years to stand at 17.5% in 2011. The unem-ployment rate for women, which stood at about 4% over the last few years, also increased sharply in 2009 to 8.1% and has risen over the last two years to 10.4% in 2011. For the 20-24 age group, about a third of men and just over a fifth of women were unemployed in 2011 (Tables 2.13 and 2.14). Decision-making: The report shows that women are under-represented in decision-making structures at both national and regional levels. In 2011, only 15.1% of TDs in Dáil Éireann were women, while they accounted for just over a third of members of State Boards, less than a fifth of members of local authorities and just over a third of the membership of Vocational Education Committees. The average representation in national parlia-ments for EU countries was nearly a quarter in 2011 (Tables 3.14 and 3.15). Population: The highest fertility rate in the EU in 2010 was in Ireland at 2.07, well above the EU average of 1.59. The average age at which women gave birth to their first child rose from 25 years in 1980 to 29.4 years in 2010. Ireland had 98 men per 100 women in the population in 2011. This masks differences in the age groups: at younger ages, there are more boys than girls (as more boys are born than girls), there are fewer men than women in the 20-29 age group as more males than females have emigrated in recent years, and at older ages, there are more women than men (as women live longer than men). For the 85+ group, there are 47 men per 100 women in Ireland (Tables 1.1, 3.12 and 3.13). Migration: The years of high immigration to Ireland were 2005 to 2008. In 2006, immigration peaked at 60,300 for males. A year later, it peaked at 52,100 for females. Since then, immigration has fallen very sharply to about 20,100 for males and 22,300 for females in 2011. Emigration rose steeply between 2006 and 2011 to about 38,700 males and 37,800 females, resulting in a net outflow leaving the country in 2011 of 18,600 males and 15,500 females (Tables 1.3 and 1.4). Life and death: Life expectancy for women in Ireland was 81.6 years in 2006, nearly 5 years more than the value for men of 76.8 years. Life expectancy for men is 0.4 years greater than the 2008 EU average, while for women it is nearly a year less than the 2008 EU average. Men are more likely to die at a younger age than women, with the difference in risk particularly high in the 15-24 years age group. This reflects higher deaths rates for males due to suicide and motor vehicle accidents (Tables 5.1 to 5.5 and 7.3). Health: Women were more likely to be hospitalised in 2010, with 343 hospital discharges per 1,000 women compared with 305 discharges per 1,000 men. Men are more likely to be admitted to psychiatric hospitals for

11
schizophrenia and alcoholic disorders while women are more likely to be admitted for depression (Tables 5.7 and 5.10). Principal Economic Status: Men were more likely to be in the labour force than women in Ireland in 2011, with just under seven out of ten men aged over 15 at work or unemployed while a little over half of women were in the labour force. More than half a million women in 2011 were looking after home/family compared with only 9,600 men (Table 3.1). Occupations: There were 851,300 women and 970,000 men employed in Ireland in 2011. Nearly a quarter of women (23.7%) in employment were in professional occupations and just over a fifth (20.9%) in administrative and secretarial occupations. Nearly a quarter of men (24.7%) in employment in 2011 were in skilled trades oc-cupations while 15% were employed in professional occupations (Table 2.7). Economic sectors: The Education and Health sectors employed the highest proportions of women in 2010 with women accounting for more than 4 out of 5 people at work in the Health sector and nearly three quarters of those in Education. The sectors with the highest proportions of men in 2010 were Construction, Agriculture and Transport. In primary education, 85% of teachers are women. And in second-level education, 63% of teachers are women. Despite this, women are not well represented at senior level positions: only 36% of medical and dental consultants are women, 53% of primary school managers, and 41% of second-level school managers (Tables 2.8, 4.6, 4.8 and 5.14). Income: The report shows that women’s income in 2009 was around 73% of men’s income. After adjusting for the longer hours worked by men, women’s hourly earnings were around 94% of men’s (Table 3.3). Poverty: The proportion of men at risk of poverty in 2010, after pensions and social transfers, was 15%, just above the rate of 14% for women. At risk of poverty rates were considerably lower for those in employment, at 10% for men and 5% for women (Table 3.6). Crime: There were 12,487 persons committed to prison under sentence in 2010, of whom one in eight was fe-male. 47 men and 11 women were victims of murder/manslaughter in 2010 (Tables 6.1 and 6.4). Commentary on the individual indicators is included in Section 2.2.

12

13
2.2 Indicators Population 1.1 Ireland: Population by age group, 2011
Age Men Women Men per 100
women
0-19 641,094 610,761 10520-29 297,961 315,426 9430-64 1,046,043 1,048,904 10065-69 84,231 86,234 9870-74 60,985 66,061 9275-79 44,514 53,710 8380-84 27,333 40,455 6885 and over 19,511 41,100 47
Total 2,221,672 2,262,651 98Source: CSO Demography
Ireland: Age composition of population, 2011
0
5,000
10,000
15,000
20,000
25,000
30,000
35,000
40,000
45,000
0 10 20 30 40 50 60 70 80 90
personsMen Women
Source: CSO Demography
♦ There are significantly more males than females in the 0-19 age group, because more boys are born than girls.
♦ As more males than females have emigrated in recent years there are fewer men than women in the 20-29 age group.
♦ Because women live longer than men, the ratio of men to women in the population in Ireland decreased with age in 2011, from 100 men per 100 women in the 30-64 age group down to 47 men per 100 women in the 85 years and over age group.
Population profile

14
1.2 EU: Men per 100 women, 2010 number
Country 0-19 20-29 30-64 65 & over TotalMalta 106 110 102 75 99Sweden 106 105 103 80 99Luxembourg 106 102 103 74 99Ireland 105 95 100 82 98Denmark 105 102 101 79 98Cyprus 105 97 100 83 98Slovenia 106 111 105 65 98Greece 106 109 101 79 98Netherlands 105 102 101 78 98Spain 106 104 101 74 97United Kingdom 105 104 98 78 97Czech Republic 105 107 101 67 96Finland 104 105 101 70 96Germany 105 103 102 74 96Belgium 104 100 101 73 96EU 105 103 99 72 95Austria 105 101 99 71 95Romania 105 104 97 68 95Slovakia 105 104 98 60 95Italy 106 103 98 73 94France 105 100 96 70 94Portugal 105 103 96 72 94Bulgaria 106 105 97 69 94Poland 105 103 96 60 93Hungary 105 104 95 58 90Lithuania 105 104 89 51 87Latvia 104 104 90 48 86Estonia 106 103 88 49 85
Iceland 104 104 104 85 101Turkey 105 104 101 78 101Macedonia 106 105 101 81 100Norway 105 103 104 77 100Switzerland 106 101 101 75 97
Source: Eurostat, CSO Demography
♦ Malta, Sweden and Luxembourg had the most gender-balanced populations in the EU in 2010 with 99 men per 100 women.
EU: Men per 100 women, 2010
Men per 100 women < 91 91 < 95 95 < 98 98 < 100 ≥ 100
Population profile Population profile

15
1.3 Ireland: Migration by age group, 2001 and 2011
000s 2001 2011 Age group Men Women Men Women
Emigrants 12.6 13.6 38.7 37.80-14 0.0 0.0 0.9 0.715-24 9.9 11.3 15.0 18.125-44 2.4 2.0 18.3 16.145-64 0.0 0.0 1.3 0.965 & over 0.4 0.3 3.2 1.9 Immigrants 30.1 29.0 20.1 22.30-14 4.1 3.8 3.5 3.215-24 6.6 9.8 3.9 5.325-44 16.3 13.2 9.6 10.845-64 2.5 1.8 2.4 2.665 & over 0.5 0.3 0.6 0.4 Net migration3 17.5 15.4 -18.6 -15.50-14 4.1 3.8 2.6 2.515-24 -3.3 -1.5 -11.1 -12.825-44 13.9 11.2 -8.7 -5.345-64 2.5 1.8 1.1 1.765 & over 0.1 0.0 -2.6 -1.5
Source: CSO Migration estimates ♦ In 2001 there were far more immigrants than emigrants. Ten years later, by 2011,
the pattern had reversed: there are now more emigrants then immigrants, result-ing in a net outflow of 18,600 males and 15,500 females in 2011.
♦ The number of males emigrating from Ireland more than trebled between 2001
and 2011, rising from 12,600 to 38,700. The number of female emigrants nearly trebled over the same period, rising from 13,600 to 37,800.
♦ The number of male immigrants to Ireland fell from 30,100 in 2001 to 20,100 in 2011. The number of female immigrants fell from 29,000 to 22,300 over the same period.
3 Net migration is defined as the number of immigrants less the number of emigrants.
1.4 Ireland: Migration, 2001-2011
0
10
20
30
40
50
60
2001 2002 2003 2004 2005 2006 2007 2008 2009 2010 2011
Male emigrants Male immigrants
Female emigrants Female immigrants
000
Source: CSO Migration estimates ♦ The years of high immigration to Ireland were 2005 to 2008. In 2006, immigration
peaked at 60,300 for men, and a year later it peaked at 52,100 for women. Since then, immigration has fallen very sharply for both sexes. In 2011 there were 20,100 male immigrants and 22,300 female immigrants.
♦ The pattern of emigration was very similar for women and men in Ireland between 2000 and 2006, but between 2007 and 2010 the number of male emigrants ex-ceeded the number of female emigrants, with 15,500 more male than female emi-grants in 2010. However in 2011 the numbers of male and female emigrants were very similar, with 38,700 males and 37,800 females emigrating.
♦ The number of male emigrants increased each year between 2004 and 2010, ris-
ing from 12,500 in 2004 to 40,400 in 2010 before falling back slightly to 38,700 in 2011. The number of female emigrants has also increased since 2004, rising from 14,000 in 2004 to 37,800 in 2011.
Migration

16
Employment 2.1 Ireland and EU: Employment rate4, 2001-2011
% aged 15-64 Ireland EU Year Men Women Men Women
2001 76.7 54.6 70.8 54.32002 75.1 55.2 70.4 54.52003 74.9 55.5 70.3 55.02004 75.7 56.1 70.2 55.42005 76.6 58.2 70.8 56.32006 77.7 59.1 71.6 57.32007 77.6 60.7 72.5 58.32008 75.7 60.4 72.8 59.12009 67.3 57.8 70.7 58.62010 64.5 56.4 70.1 58.22011 63.3 56.0 Source: CSO QNHS, Eurostat LFS
♦ The employment rate for men in Ireland during the years 2001 to 2008 was in the range
74-78%; however, it fell sharply to 67.3% in 2009, decreased in 2010 to 64.5% and fell again in 2011 to 63.3%.
♦ The employment rate for women in Ireland rose from 54.6% in 2001 to 60.7% in 2007, before falling in recent years to stand at 56% in 2011.
4 The Stockholm Council set an EU employment target of 57% for women aged 15-64 by 2005. The Lis-bon Council, back in 2000, set an EU target of 60% by 2010.
2.2 Ireland and EU: Female employment rate4, 2001-2011
50
55
60
65
70
2001 2002 2003 2004 2005 2006 2007 2008 2009 2010 2011
2010 target 2005 target EU Ireland % of females aged 15-64
Source: CSO QNHS, Eurostat LFS
♦ In 2001 the employment rate for men in Ireland, at 76.7%, was above the
EU rate of 70.8% and it remained higher than the EU rate up to 2008. How-ever in 2009 the rate in Ireland, at 67.3%, fell below the EU rate of 70.7% and stayed below the EU rate in 2010.
♦ The female employment rate in Ireland was slightly above the EU rate be-tween 2001 and 2008. In 2009, however, the rate in Ireland, at 57.8%, fell below the EU rate of 58.6% and was below the EU rate again in 2010.
♦ In 2011 the female employment rate in Ireland, at 56%, was below the EU
2010 target of 60%.
Em
ployment rates

17
2.3 EU: Employment rate, 2010
% aged 15-64 % aged 55-64 Country Men Women Men Women
Sweden 75.1 70.3 74.2 66.7Finland 69.4 66.9 55.6 56.9Estonia 61.5 60.6 52.2 54.9Denmark 75.8 71.1 62.7 52.5Germany 76.0 66.1 65.0 50.5United Kingdom 74.5 64.6 65.0 49.5Latvia 59.2 59.4 47.6 48.7Lithuania 56.8 58.7 52.3 45.8Portugal 70.1 61.1 55.7 43.5Ireland 64.5 56.4 58.4 43.0Cyprus 76.6 63.0 71.2 43.0Netherlands 80.0 69.3 64.5 42.8EU 70.1 58.2 54.6 38.6Bulgaria 63.0 56.4 50.3 37.7France 68.3 59.9 42.1 37.5Czech Republic 73.5 56.3 58.4 35.5Austria 77.1 66.4 51.6 33.7Spain 64.7 52.3 54.7 33.2Romania 65.7 52.0 50.3 33.0Luxembourg 73.1 57.2 47.7 31.3Hungary 60.4 50.6 39.6 30.1Belgium 67.4 56.5 45.6 29.2Greece 70.9 48.1 56.5 28.9Slovakia 65.2 52.3 54.0 28.7Italy 67.7 46.1 47.6 26.2Slovenia 69.6 62.6 45.5 24.5Poland 65.6 53.0 45.3 24.2Malta 72.4 39.3 47.9 13.0
Iceland 80.1 76.2 83.2 76.4Norway 77.3 73.3 72.2 65.0Switzerland 84.6 72.5 77.6 58.5Croatia 59.4 48.8 49.2 27.3Macedonia 52.8 34.0 46.7 22.4Turkey 66.7 26.2 42.7 17.1
Source: Eurostat LFS, CSO QNHS
2.4 Ireland: Employment rate for persons aged 55-64, 2001-2011
0
10
20
30
40
50
60
70
80
2001 2002 2003 2004 2005 2006 2007 2008 2009 2010 2011
Men Women Stockholm Council 2010 target % aged 55-64
Source: CSO QNHS
♦ In 2001, the Stockholm Council set a target of a 50% employment rate in
the 55-64 age group by 2010. This target applies to both men and women.
♦ Between 2001 and 2011 the employment rate for women aged 55-64 in Ireland increased from 28.6% to 43.7%, significantly below the 2010 target. Over the same time period the employment rate for men in Ireland aged 55-64 has remained comfortably above the 2010 target, increasing from 64.9% in 2001 to 68.1% in 2007 before decreasing to 58% in 2011.
♦ In 2010, the employment rate in Ireland for the age group 55-64 was higher
than the EU average, with 58.4% of Irish men in this age group employed as against an EU average of 54.6%; for women, the rate was 43% in Ireland as against an EU average of 38.6%.
Em
ployment rates
18
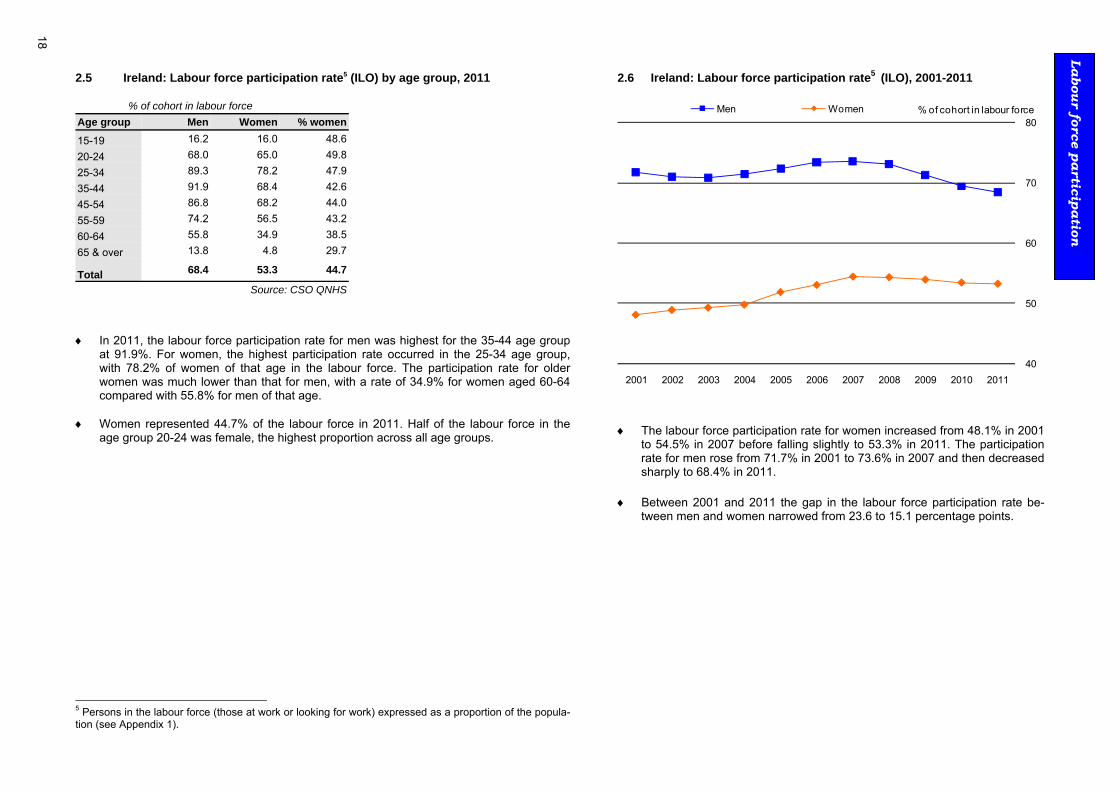
2.5 Ireland: Labour force participation rate5 (ILO) by age group, 2011
% of cohort in labour force Age group Men Women % women
15-19 16.2 16.0 48.6
20-24 68.0 65.0 49.8
25-34 89.3 78.2 47.9
35-44 91.9 68.4 42.6
45-54 86.8 68.2 44.0
55-59 74.2 56.5 43.2
60-64 55.8 34.9 38.5
65 & over 13.8 4.8 29.7
Total 68.4 53.3 44.7
Source: CSO QNHS
♦ In 2011, the labour force participation rate for men was highest for the 35-44 age group
at 91.9%. For women, the highest participation rate occurred in the 25-34 age group, with 78.2% of women of that age in the labour force. The participation rate for older women was much lower than that for men, with a rate of 34.9% for women aged 60-64 compared with 55.8% for men of that age.
♦ Women represented 44.7% of the labour force in 2011. Half of the labour force in the
age group 20-24 was female, the highest proportion across all age groups.
5 Persons in the labour force (those at work or looking for work) expressed as a proportion of the popula-tion (see Appendix 1).
2.6 Ireland: Labour force participation rate5 (ILO), 2001-2011
40
50
60
70
80
2001 2002 2003 2004 2005 2006 2007 2008 2009 2010 2011
Men Women % of cohort in labour force
♦ The labour force participation rate for women increased from 48.1% in 2001 to 54.5% in 2007 before falling slightly to 53.3% in 2011. The participation rate for men rose from 71.7% in 2001 to 73.6% in 2007 and then decreased sharply to 68.4% in 2011.
♦ Between 2001 and 2011 the gap in the labour force participation rate be-tween men and women narrowed from 23.6 to 15.1 percentage points.
Labour force participation

19
2.7 Ireland: Persons in employment by occupation, 2011 000s
2011 Broad occupational group Men Women
Managers, directors and senior officials 93.1 44.9 Professional 145.1 201.6 Associate professional and technical 131.0 77.9 Administrative and secretarial 44.0 178.0 Skilled trades 239.2 23.6 Caring, leisure and other service 22.6 117.0 Sales and customer service 52.9 98.4 Process, plant and machine operatives 127.7 23.2 Elementary 112.5 85.4 Other 2.1 1.3 Total 970.0 851.3
♦ In 2011, there were 851,300 women and 970,000 men in employment in Ireland. Close
to a quarter of women (23.7%) in employment were in professional occupations and just over a fifth (20.9%) were employed in administrative and secretarial occupations.
♦ Nearly a quarter of men (24.7%) in employment in 2011 were in skilled trades occupa-
tions, while 15% were employed in professional occupations. ♦ In 2011, 46.7% of those in employment were female. Elementary occupations (which
usually require only a minimum general level of education) were the most gender bal-anced occupations with women representing 43.2% of those employed. The least gen-der balanced occupations were skilled trades, where less than one in ten employees is female, and caring, leisure and other services, where just under one in six employees is male.
Persons in employment by occupation and sex, 2011
0% 25% 50% 75% 100%
Total
Caring, leisure and other service
Administrative and secretarial
Sales and customer service
Professional
Elementary
Associate professional and technical
Managers, directors and senior officials
Process, plant and machine operatives
Skilled trades
Men Women
Occupation

20
2.8 Ireland and EU: Employment by economic sector, 2010
% in employment aged 15 & over
Ireland EU
Sector Men Women %women Men Women %womenAgriculture, forestry and fishing
7.6 1.1 11.0 5.5 3.9 37.2
Industry 17.4 7.7 27.8 23.4 11.2 28.5Construction 11.7 1.2 7.9 13.0 1.5 8.9Wholesale and retail trade; repair of motor vehicles and motorcycles
13.5 15.6 49.9 13.2 15.3 49.2
Transportation and storage 7.5 1.9 18.2 7.3 2.5 22.4Accommodation and food service
5.4 7.7 55.0 3.7 5.3 54.8
Information and commun- ication
5.1 2.6 30.2 3.6 2.0 31.6
Financial, insurance and real estate
5.0 6.1 51.4 3.4 4.3 51.4
Professional, scientific and technical
6.0 4.7 40.7 4.8 5.1 47.2
Administrative and support service
3.1 3.6 50.0 3.7 4.2 48.6
Public administration and defence; compulsory social security
5.5 6.0 48.4 7.2 7.4 46.1
Education 3.9 12.6 73.3 3.8 11.7 71.8Human health and social work
4.3 22.4 81.9 4.1 17.8 78.4
Other 4.1 6.9 59.2 3.3 7.7 65.9Total 100.0 100.0 46.3 100.0 100.0 45.5Persons in employment (000s) 997 861 115,786 96,611
Source: Eurostat LFS, CSO QNHS
Ireland: Employment by economic sector and sex, 2010
0% 25% 50% 75% 100%
TotalHuman health and social work
EducationOther
Accommodation and food serviceFinancial, insurance and real estateAdministrative and support service
Wholesale and retail tradePublic administration and defence
Professional, scientific and technicalInformation and communication
IndustryTransportation and storage
Agriculture, forestry and fishingConstruction
% of employees in sectorMen Women
♦ In 2010, the education and health sectors employed 35% of women em-
ployees in Ireland and 29.5% of women in the EU. The construction sector employed the lowest proportion of women, with men representing 92.1% of employees in the Irish construction sector in 2010.
♦ The sectors with the most gender-balanced workforces in Ireland in 2010
were Administrative and support service, Wholesale and retail trade, and Financial, insurance and real estate activities.
♦ The percentage of women employed in each economic sector in Ireland is broadly similar to the pattern in the EU, with the exception of Agriculture, forestry and fishing where only 11% of the employees in Ireland are women compared with 37.2% in the EU.
Em
ployment by sector

21
2.9 Ireland: Employment by usual hours worked, 2006 and 2011
000s 2006 2011
Usual hours worked Men Women Men Women1-19 28.1 107.8 39.6 128.220-29 46.7 169.4 63.1 184.330-39 457.3 390.2 330.2 344.740 and over 467.7 141.7 399.1 144.1Varied and not stated 174.1 52.0 138.1 49.8
Total 1,173.8 861.1 970.0 851.3
Average hours per week 40.5 31.8 39.4 30.6Source: CSO QNHS
♦ Both men and women worked fewer hours per week in paid employment in 2011 than
they did in 2006. In 2006 women worked for an average of 31.8 hours a week and this fell to 30.6 hours in 2011. For men, the reduction was from 40.5 to 39.4 hours per week over the same time period.
♦ In 2011, 75.1% of men in employment worked for 30 or more hours a week, compared
with 57.4% of women. The comparable figures for 2006 were 78.8% for men and 61.8% for women.
♦ Just over three-quarters (76.7%) of all those who worked 40 hours or more a week were
men in 2006 and this fell slightly to 73.5% in 2011. ♦ Women represented 78.8% of persons who worked up to 29 hours per week in paid em-
ployment in 2006 and 75.3% in 2011.
2.10 Ireland: Employment by marital status and usual hours worked, 2011
% Single Married Separated/
divorced Widowed
Usual hours worked Men Women Men Women Men Women Men Women 1-19 6.4 13.0 2.7 15.4 4.4 20.3 8.0 29.7 20-29 8.1 16.8 5.5 25.1 9.1 23.5 8.0 20.3 30-39 37.1 43.5 32.6 39.2 28.2 37.4 35.2 26.7 40 and over 35.7 20.5 44.5 14.7 39.6 15.2 28.4 10.5 Varied or not stated 12.7 6.2 14.8 5.6 19.1 3.8 19.3 12.8 Total 100.0 100.0 100.0 100.0 100.0 100.0 100.0 100.0 Total persons (000s) 335.2 332.9 596.2 453.8 29.8 47.3 8.8 17.2
Source: CSO QNHS
Total persons in employment by sex and usual hours worked, 2011
0
10
20
30
40
1-19 20-29 30-39 40 and over Varied & not stated
Men Women %
♦ In 2011 married men worked longer hours in paid employment than married
women, with 44.5% of married men working for 40 or more hours per week compared with 14.7% of married women. In contrast, 25.1% of married women worked for 20-29 hours per week compared with just 5.5% of mar-ried men.
♦ Over a third of single men (35.7%) worked for 40 hours or more a week
compared with a fifth (20.5%) of single women.
Em
ployment and usual hours w
orked

22
2.11 Ireland: Employment rates of couples (with/without children) and lone parents
aged 20-44 by age of youngest child, 2011
employment rate
Family status Men Women
No children 84.8 85.7Youngest child aged 0-3 78.9 57.0Youngest child aged 4-5 73.8 51.5Youngest child aged 6 or over 76.8 58.1
Total 79.4 62.2Source: CSO QNHS
Ireland: Employment rates of couples (with/without children) and lone parents aged 20-44 by age of youngest child, 2011
0
20
40
60
80
100
No children Youngest child 0-3 Youngest child 4-5 Youngest child 6 or over
employment rate Men Women
♦ The Barcelona Council agreed a target of childcare provision for at least
90% of children between 3 years of age and the mandatory school-going age (six years of age in Ireland) by 2010. They also agreed a target of childcare for at least 33% of children under 3 years of age by 2010. Pro-gress towards these targets in Ireland cannot be measured at present due to a lack of Irish data. However, data from the QNHS give an indication of the effect that having young children in the family has on female employ-ment rates.
♦ In 2011, the employment rate for women who are lone parents or were part
of a couple with/without children and who were aged 20-44 was 62.2%. This rate varied from 85.7% for women with a husband/partner and no chil-dren to 51.5% for women whose youngest child was aged between 4 and 5 years of age, a difference of 34.2 percentage points.
♦ In contrast, the employment rate for men with a wife/partner and no children
was 84.8% while the rate for men whose youngest child was aged between 4 and 5 was 73.8%, a difference of 11 percentage points.
Em
ployment and fam
ily status

23
2.12 Ireland: Pension coverage of persons aged 20-69 in employment, 2005 and 2009
% 2005 2009
Pension coverage Men Women Men Women
Occupational pension 38 43 37 41Personal pension 17 6 13 5Both occupational and personal pension 3 2 3 2No pension 42 49 47 51
Total 100 100 100 100Source: CSO QNHS
♦ In 2005, 42% of men in employment had no pension provision other than the State pen-sion and this had risen to 47% of men by 2009. 49% of women in employment had no pension provision in 2005, and this increased slightly to 51% by 2009.
♦ In 2009, 37% of men and 41% of women in employment had occupational pensions. The
corresponding figures in 2005 were 38% of men and 43% of women. There was a large difference between men and women in the coverage of personal pensions in 2009: 13% of men had a personal pension compared with 5% of women.
Marital
Pensions

24
2.13 Ireland: Unemployment rates by age group, 2001 and 2011
% 2001 2011
Age group Men Women Men Women
15-19 11.9 12.6 46.1 33.720-24 5.8 5.7 33.7 21.825-34 3.7 3.2 21.5 11.035-44 2.7 2.6 14.8 9.145-54 3.4 2.7 13.3 7.055-59 3.1 2.5 11.8 5.760-64 * * 11.0 5.165 and over * * * *Total 3.9 3.8 17.5 10.4
Source: CSO QNHS 2.14 Ireland: Unemployment rates and long-term unemployment rates, 2001-2011
% Unemployment
rates Long-term unemploy-
ment rates Year Men Women Men Women
2001 3.9 3.8 1.4 0.72002 4.7 4.1 1.5 0.52003 4.9 4.1 1.8 0.82004 5.0 3.9 1.8 0.82005 5.0 4.3 1.9 0.82006 4.7 4.5 1.7 0.92007 4.8 4.4 1.6 0.82008 6.6 4.4 2.0 0.82009 15.1 8.1 3.6 1.32010 16.7 9.8 8.1 3.22011 17.5 10.4 10.4 4.5
Source: CSO QNHS
♦ The unemployment rate for men was relatively stable over the period 2001 to 2007 at around 5%, before rising in 2008 to 6.6% and increasing sharply to 15.1% in 2009. During 2010 and 2011 the rate continued to rise and stood at 17.5% in 2011.
♦ The unemployment rate for women has followed a similar pattern, averag-ing just above 4% between 2001 and 2008, before doubling to 8.1% in 2009, increasing to 9.8% in 2010 and rising again to 10.4% in 2011.
♦ This large increase in unemployment rates was reflected in all age groups,
with very large increases in the rate for those aged 15-19 and 20-24, par-ticularly for men. The rate for men aged 15-19 rose from 11.9% in 2001 to 46.1% in 2011, while for women in this age group the rate rose from 12.6% in 2001 to 33.7% in 2011. The rate for men aged 20-24 rose from 5.8% in 2001 to 33.7% in 2011 while for women in this age group the rate rose from 5.7% to 21.8%. The unemployment rate for both men and women tended to decrease with age in both 2001 and 2011.
♦ The long-term unemployment rate (unemployed for one year or more) for
Irish men was stable between 2001 and 2008, at about 2% or just below, but increased in 2009 to 3.6%, rose sharply in 2010 to 8.1% and increased again to 10.4% in 2011. The long-term unemployment rate for Irish women was less than 1% between 2001 and 2008 before rising over the last three years to stand at 4.5% in 2011.
Unem
ployment rates

25
2.15 Ireland and EU: Unemployment rates, 2001-2011
0
2
4
6
8
10
12
14
16
18
2001 2002 2003 2004 2005 2006 2007 2008 2009 2010 2011
Ireland (men) EU 27 (men)
Ireland (women) EU 27 (women)
% unemployed
Source: Eurostat LFS, CSO QNHS
♦ In 2010 the female unemployment rate in Ireland, at 9.8%, was nearly the same as the
EU average of 9.7%. Ireland’s male unemployment rate of 16.7% was the fifth highest in the EU, behind Latvia, Lithuania, Estonia and Spain and was well above the EU average of 9.7%.
♦ Ireland had the fifth highest reported rate of unemployment among men aged 55-64 in the EU in 2009 at 10.5%, compared with an EU average rate of 7.3%. The rate among women aged 55-64 in Ireland, at 5.2%, was lower than the EU average of 6.2%.
2.16 EU: Unemployment rates, 2010 % of labour force % of 55-64 age groupCountry Men Women Men Women
Austria 4.6 4.3 2.5 :Netherlands 4.5 4.5 4.2 3.7Luxembourg 3.8 5.1 : :Cyprus 6.2 6.5 5.1 4.1Denmark 8.4 6.6 6.8 4.6Germany 7.6 6.6 8.1 7.3Romania 8.2 6.9 4.5 1.7United Kingdom 8.8 7.0 5.9 3.2Malta 6.9 7.2 : :Slovenia 7.6 7.2 4.2 3.6Finland 9.3 7.7 7.4 5.7Sweden 8.7 8.4 6.2 4.4Czech Republic 6.5 8.5 6.5 6.5Belgium 8.2 8.6 4.2 5.2Bulgaria 11.0 9.5 9.6 8.8EU 9.7 9.7 7.3 6.2France 9.1 9.7 6.9 6.4Italy 7.7 9.7 3.9 3.0Ireland 16.7 9.8 10.5 5.2Poland 9.4 10.1 7.5 6.5Hungary 11.6 10.8 8.2 7.3Portugal 10.4 12.5 10.0 7.5Lithuania 21.5 14.6 16.9 12.3Slovakia 14.3 14.6 9.6 11.0Estonia 19.9 14.7 19.0 14.1Latvia 21.9 16.0 19.3 12.7Greece 10.1 16.4 6.2 6.5Spain 19.8 20.6 14.3 13.8
Norway 4.2 3.0 : :Switzerland 4.3 5.1 3.6 3.4Iceland 8.5 6.8 : :Turkey 10.6 11.7 6.5 1.2Croatia 11.7 12.6 7.7 5.9Macedonia 32.1 32.5 28.7 25.8
Source: Eurostat LFS, CSO QNHS
Unem
ployment rates

26
2.17 EU: Male unemployment rates, 2010
Male unemployment rate
< 6 6 < 9 9 < 10 10 < 15 ≥ 15
2.18 EU: Female unemployment rates, 2010
Female unemployment rate
< 6 6 < 9 9 < 10 10 < 15 ≥ 15
Unem
ployment rates

27
Social cohesion and lifestyles
3.1 Ireland: Principal economic status, 2001 and 2011
persons aged 15 years & over (000s) 2001 2011
Principal economic status Men Women Men Women
Total in labour force 1,063.4 699.5 1,198.4 926.3At work 996.6 667.0 947.8 826.4Unemployed 66.8 32.5 250.6 99.9% in labour force 71.3 45.6 69.7 51.9
Total not in labour force 427.3 834.7 520.2 857.8Student 169.2 192.0 186.7 183.8Looking after home/family 5.7 552.9 9.6 505.0Retired 195.5 60.8 238.0 113.8Other 56.9 29.0 85.9 55.2% not in labour force 28.7 54.4 30.3 48.1
Source: CSO QNHS Ireland: Principal economic status by sex, 2011
0% 25% 50% 75% 100%
Unemployed
Retired
At work
Student
Home duties
Men Women % of category
Principal economic status of women, 2011
At work46%
Unemployed6%
Student10%
Looking after home/family
28%
Retired7%
Other3%
♦ Just over half of women (51.9%) aged 15 years and over were in the labour
force (at work or unemployed) in 2011, compared to 45.6% in 2001. The proportion of men in the labour force over the same period dropped slightly from 71.3% to 69.7%.
♦ 98% of those who were looking after home or family in 2011 were women.
Just over two-thirds (67.7%) of persons describing themselves as retired in 2011 were men.
Principal economic status

28
3.2 Ireland: Income liable for social insurance6, 2009
persons aged 15-84 %Income band Men Women Men Women
Under €5,000 180,607 178,421 13.6 15.4€5,000 - €9,999 124,509 139,603 9.4 12.1€10,000 - €19,999 228,832 255,113 17.2 22.0€20,000 - €29,999 226,515 215,904 17.0 18.7€30,000 - €39,999 187,966 151,671 14.1 13.1€40,000 - €49,999 126,692 93,559 9.5 8.1€50,000 & over 254,259 122,929 19.1 10.6
Total 1,329,380 1,157,200 100.0 100.0
Average income € 34,317 25,103 Source: Department of Social Protection, Revenue Commissioners
.
Ireland: Income, 2009
0% 25% 50% 75% 100%
Under €5,000
€5,000 - €9,999
€10,000 - €19,999
€20,000 - €29,999
€30,000 - €39,999
€40,000 - €49,999
€50,000 & over
Total
Men Women % of category
6 Income excludes private pension contributions; for further information see Appendix 1. These tables are based on income data (for employees and the self-employed) that covers 77.3% of all men aged 15-84 and 66.3% of women of this age. However for older age groups, especially the 65 and over age group, the coverage is much lower due to the nature of the income considered.
3.3 Ireland: Average income6 liable for social insurance by age, 2009
average income (€)
Age group Men WomenWomen's income
as % of men's
15-24 11,889 11,286 94.9 25-34 28,862 26,633 92.3 35-44 43,474 31,095 71.5 45-54 48,202 30,327 62.9 55-64 42,900 26,329 61.4 65-84 22,091 15,527 70.3
Total aged 15-84 34,317 25,103 73.1 Source: Department of Social Protection, Revenue Commissioners
♦ The EU Council 2003 recommendations on the implementation of Member
States employment policies drew attention to the continuing high gender pay gap and the need for Member States to address the underlying factors causing this gap.
♦ In 2009, men had an average income of €34,317 while the average income for women was €25,103, or 73.1% of men’s income. When these figures are adjusted to take account of the average hours per week spent in paid em-ployment, women’s average hourly income was about 94% of men’s in 2009.
♦ The difference between male and female incomes for persons aged 15-64
increased with age. The average income of women aged 15-24 was 94.9% of that of men in the same age group in 2009, while for the 55-64 age group women’s average income was 61.4% of men’s.
♦ In interpreting Tables 3.2 and 3.3, it should be borne in mind that no ac-
count has been taken of the number of hours being worked or of the occu-pations being performed by men and women (see Tables 2.7 and 2.9). In addition, income used for private pension contributions is not included in the figures (see Table 2.12).
Income

29
3.4 EU: Gender pay gap7, 2009
0 5 10 15 20 25 30 35
Slovenia
Italy
Malta
Romania
Belgium
Poland
Portugal
Luxembourg
Latvia
Bulgaria
Lithuania
Ireland
France
Sweden
Spain
Denmark
EU
Hungary
Netherlands
Finland
United Kingdom
Cyprus
Slovakia
Greece
Germany
Austria
Czech Republic
Estonia
Norway
Switzerland
pay gap as % of male earnings
7 The population and methodology used to calculate the gender pay gap is not comparable to any pay comparisons made in Tables 3.2 and 3.3. 2008 data used for Belgium and Greece and 2007 for Estonia.
♦ The gender pay gap, an indicator calculated by Eurostat, is used to monitor
the inequality in pay between men and women in Europe. It is defined as the relative difference, in percentage terms, between the average gross hourly earnings of women and men.
♦ The average gender pay gap in Ireland was 15.7% in 2009, below the gap in the EU of 17.1%. Slovenia had the lowest gender pay gap in the EU at 3.2% while Estonia had the highest at 30.9%.
Gender pay gap

30
3.5 EU: At risk of poverty rates, 2009 % Men Women
Country
Before pensions and social trans-
fers
After pensions and social trans-
fers
Before pensions and social trans-
fers
After pensions and social trans-
fersCzech Republic 33 8 39 10Netherlands 33 11 38 11Slovakia 33 10 39 12Hungary 49 13 54 12Slovenia 35 10 41 13Austria 40 11 46 13Denmark 38 13 42 13France 41 12 46 14Sweden 38 12 43 15Finland 36 13 41 15Ireland 44 15 48 15Belgium 38 13 43 16Malta 33 15 38 16Luxembourg 42 14 46 16Germany 41 15 46 16EU 40 16 45 17Poland 40 17 45 17Cyprus 28 14 33 18United Kingdom 40 17 46 18Portugal 40 17 43 18Italy 39 17 46 20Greece 40 19 44 20Spain 37 18 41 21Estonia 34 18 40 22Lithuania 40 19 44 22Romania 47 21 50 23Bulgaria 37 20 41 24Latvia 36 24 40 27 Iceland 25 9 29 11Norway 33 10 39 13Switzerland 31 14 37 17Croatia 38 16 44 20
Source: Eurostat, CSO SILC
♦ In 2009, 44% of men and 48% of women in Ireland were considered to be at risk of pov-erty before income from social transfers was taken into account. The corresponding rates after social transfers and pensions was 15% for both men and women.
EU: Effect of pensions and social transfers on the female at risk of poverty rate
0 5 10 15 20 25 30 35 40 45
HungaryIrelandAustriaFrance
LuxembourgGermany
Czech RepublicDenmarkSweden
United KingdomSloveniaBelgium
EUPoland
SlovakiaNetherlands
RomaniaFinland
ItalyPortugalGreece
MaltaLithuania
SpainEstoniaBulgariaCyprus
Latvia
NorwayCroatia
SwitzerlandIceland
difference in % at risk of poverty rate before and after social transfers and pensions
Source: Eurostat, CSO SILC
♦ Social transfers and pensions reduced the risk of poverty rate for women in Ireland by 33 percentage points in 2009, the second highest reduction in the EU. The average reduction in the EU was 28 percentage points.
Risk of poverty

31
3.6 Ireland: At risk of poverty rate8 by most frequent economic activity, 2005 and 2010 %
2005 2010 Economic activity Men Women Men WomenEmployed 7 7 10 5Unemployed 44 30 26 21Retired 30 29 13 10Other inactive 38 33 22 23
Total population aged 18 & over 17 20 15 14Source: CSO SILC
♦ The at risk of poverty rate for both men and women aged 18 and over in Ireland fell be-
tween 2005 and 2010. The rate for men fell from 17% to 15% while the rate for women fell from 20% to 14%.
♦ Employed persons had a lower at risk of poverty rate, with a rate of 10% for men and 5% for women in 2010. The at risk of poverty rate for unemployed persons declined sharply between 2005 and 2010, falling from 44% to 26% for men and from 30% to 21% for women.
♦ In 2010, men and women aged 65 and over had an at risk of poverty rate of 11% com-
pared with the overall rate of 16%.
♦ There have been sharp falls in the at risk of poverty rates for persons aged 65 and over between 2005 and 2010, with the rate for men in this age group falling from 30% to 11% while the rate for women declined from 37% to 11%.
8 Table 3.6 refers only to persons aged 18 and over.
3.7 Ireland: At risk of poverty rate by age, 2005 and 2010
% 2005 2010
Age group Men Women Men Women0-17 23 22 18 2118-24 16 17 19 2025-49 12 16 13 1350-64 20 19 18 1665 & over 30 37 11 11
Total 19 21 16 16Source: CSO SILC
Ireland: At risk of poverty rate by age and sex, 2010
0
5
10
15
20
25
0-17 18-24 25-49 50-64 65 & over
Men Women at risk of poverty rate
Risk of poverty

32
3.8 EU: Early school leavers, 2005 and 20109
% of 18-24 age group 2005 2010
Country Men Women Men WomenSlovenia 6.5 3.2 6.4 3.3Poland 6.8 3.7 7.2 3.5Czech Republic 6.1 6.3 4.9 4.8Slovakia 6.7 5.9 4.6 4.9Luxembourg 17.0 9.6 8.0 6.0Lithuania 10.7 5.6 9.9 6.2Denmark 10.5 6.9 13.6 7.5Netherlands 15.9 11.1 12.2 7.9Austria 9.6 8.7 8.4 8.2Ireland 15.4 9.5 12.6 8.4Sweden 11.9 9.7 10.9 8.5Finland 12.4 8.2 11.6 9.0Latvia 18.2 10.4 17.2 9.4Hungary 13.7 11.3 11.5 9.5Cyprus 27.2 10.4 16.2 9.8Belgium 15.3 10.5 13.8 10.0France 14.1 10.3 15.4 10.3Greece 17.6 9.7 16.5 10.8Germany 13.3 13.7 12.7 11.0EU 17.8 13.7 16.0 12.2United Kingdom 12.6 10.6 15.8 14.0Bulgaria 20.6 20.3 13.2 14.5Italy 25.8 18.2 22.0 15.4Romania 20.1 19.1 18.6 18.2Spain 36.6 24.9 33.5 23.1Portugal 46.7 30.7 32.7 24.6Malta 42.1 35.5 41.0 32.4Estonia 17.1 : 15.2 :
Croatia 6.0 4.2 4.9 2.8Switzerland 10.0 9.3 6.1 7.0Norway 5.3 4.0 21.4 13.2Macedonia 19.9 25.9 13.7 17.5Iceland 29.7 19.8 26.0 19.0Turkey 41.3 55.6 37.8 47.9
Source: CSO QNHS, Eurostat LFS
9 2006 data used for 2005 for Turkey and Macedonia. Break in series in 2010 for the Netherlands.
EU: Early school leavers, 20109
0 10 20 30 40 50
SloveniaPoland
Czech RepublicSlovakia
LuxembourgLithuaniaDenmark
NetherlandsAustriaIreland
SwedenFinland
LatviaHungaryCyprus
BelgiumFranceGreece
GermanyEU
United KingdomBulgaria
ItalyRomania
SpainPortugal
MaltaEstonia
CroatiaSwitzerland
NorwayMacedonia
IcelandTurkey
MenWomen
% of 18-24 age group
♦ In its Communication on the Future of the European Employment Strategy,
the European Commission outlined the need to reduce school failure and drop-out rates. In the 2001 Employment Guidelines, Member States were called upon to halve the number of early school leavers in the 18-24 age group by 2010.
♦ In almost all countries higher proportions of boys left school early than girls. In Ireland in 2010 12.6% of men aged 18 to 24 and 8.4% of women had left school early. The EU average for early school leavers was 16% of men and 12.2% of women in the 18-24 age group.
Early school leavers

33
3.9 Ireland: Lone parents10, 2001-2011
000s Year Men Women % women
2001 10.7 103.2 90.6
2002 11.4 104.4 90.2
2003 9.8 105.1 91.5
2004 10.8 108.3 90.9
2005 9.8 110.4 91.8
2006 10.8 114.9 91.4
2007 9.9 121.2 92.4
2008 11.5 119.5 91.2
2009 12.4 129.0 91.2
2010 10.9 137.1 92.6
2011 14.1 133.3 90.4 Source: CSO QNHS
♦ Nine out of ten lone parents were women in 2011 and this proportion has remained
stable over the period 2001 to 2011. The number of women living as lone parents in-creased by 29.2% from 103,200 to 133,300 between 2001 and 2011. The number of men living as lone parents was relatively stable over the period 2001 to 2008 at about 11,000; it increased to 12,400 in 2009 before falling back to 10,900 in 2010 but rose sharply to 14,100 in 2011.
♦ The age of the youngest child was under five for over a third (36%) of women living as
lone parents while for more than a third of male lone parents (35.5%) the age of the youngest child was between 15 and 19 years of age.
♦ Almost 98% of the 92,326 persons in receipt of one-parent family payments in 2010
were women.
10 Refers to persons living as lone parents, whose youngest child was less than 20 years of age.
3.10 Ireland: Lone parents10 by age of youngest child, 2011
000sAge of youngest child Men Women % women
0-4 2.7 48.1 94.75-9 2.2 34.8 94.110-14 4.2 29.6 87.615-19 5.0 20.9 81.0
Total 14.1 133.3 90.4Source: CSO QNHS
3.11 Ireland: Recipients of one-parent family payment by age, 2010
numberAge group Men Women % women
24 & under 28 13,159 99.825-49 1,638 72,358 97.850 & over 490 4,653 90.5
Total 2,156 90,170 97.7Source: Department of Social and Family Affairs
Lone parents
34
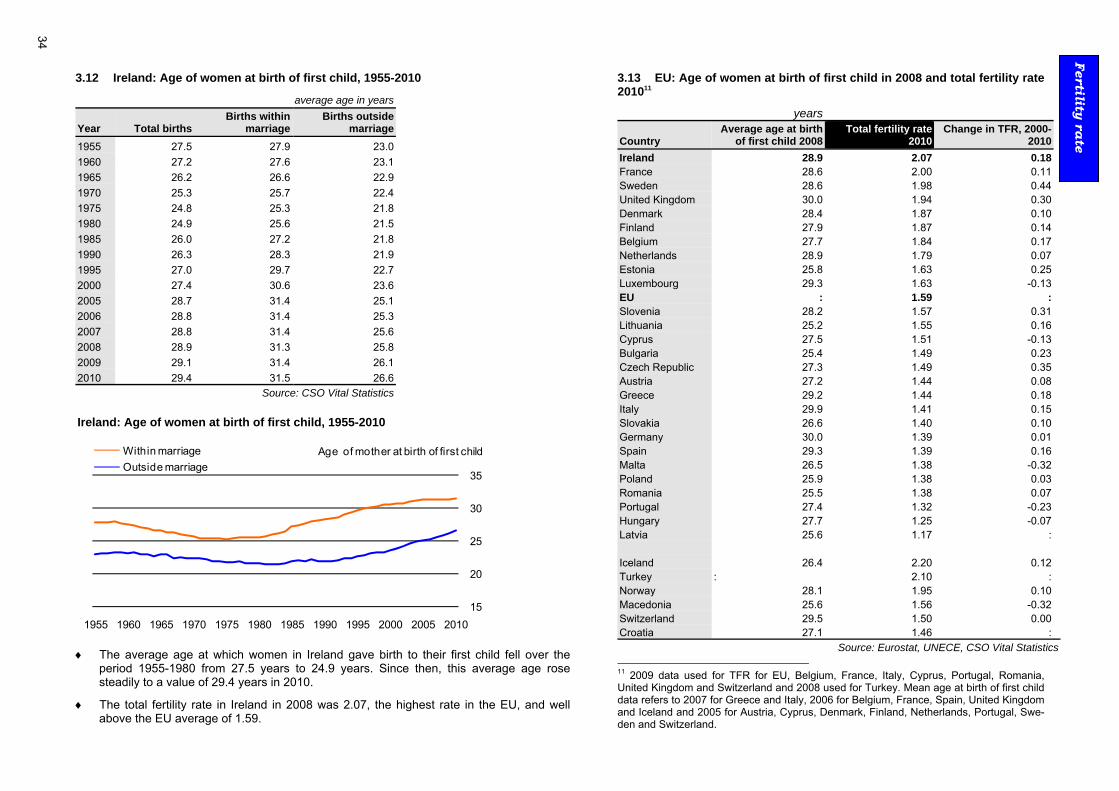
3.12 Ireland: Age of women at birth of first child, 1955-2010
average age in years
Year Total birthsBirths within
marriage Births outside
marriage1955 27.5 27.9 23.01960 27.2 27.6 23.11965 26.2 26.6 22.91970 25.3 25.7 22.41975 24.8 25.3 21.81980 24.9 25.6 21.51985 26.0 27.2 21.81990 26.3 28.3 21.91995 27.0 29.7 22.72000 27.4 30.6 23.62005 28.7 31.4 25.12006 28.8 31.4 25.32007 28.8 31.4 25.62008 28.9 31.3 25.82009 29.1 31.4 26.12010 29.4 31.5 26.6
Source: CSO Vital Statistics
Ireland: Age of women at birth of first child, 1955-2010
15
20
25
30
35
1955 1960 1965 1970 1975 1980 1985 1990 1995 2000 2005 2010
Within marriageOutside marriage
Age of mother at birth of first child
♦ The average age at which women in Ireland gave birth to their first child fell over the period 1955-1980 from 27.5 years to 24.9 years. Since then, this average age rose steadily to a value of 29.4 years in 2010.
♦ The total fertility rate in Ireland in 2008 was 2.07, the highest rate in the EU, and well above the EU average of 1.59.
3.13 EU: Age of women at birth of first child in 2008 and total fertility rate 201011
years
Country Average age at birth
of first child 2008Total fertility rate
2010Change in TFR, 2000-
2010 Ireland 28.9 2.07 0.18 France 28.6 2.00 0.11 Sweden 28.6 1.98 0.44 United Kingdom 30.0 1.94 0.30 Denmark 28.4 1.87 0.10 Finland 27.9 1.87 0.14 Belgium 27.7 1.84 0.17 Netherlands 28.9 1.79 0.07 Estonia 25.8 1.63 0.25 Luxembourg 29.3 1.63 -0.13 EU : 1.59 : Slovenia 28.2 1.57 0.31 Lithuania 25.2 1.55 0.16 Cyprus 27.5 1.51 -0.13 Bulgaria 25.4 1.49 0.23 Czech Republic 27.3 1.49 0.35 Austria 27.2 1.44 0.08 Greece 29.2 1.44 0.18 Italy 29.9 1.41 0.15 Slovakia 26.6 1.40 0.10 Germany 30.0 1.39 0.01 Spain 29.3 1.39 0.16 Malta 26.5 1.38 -0.32 Poland 25.9 1.38 0.03 Romania 25.5 1.38 0.07 Portugal 27.4 1.32 -0.23 Hungary 27.7 1.25 -0.07 Latvia 25.6 1.17 : Iceland 26.4 2.20 0.12 Turkey : 2.10 : Norway 28.1 1.95 0.10 Macedonia 25.6 1.56 -0.32 Switzerland 29.5 1.50 0.00 Croatia 27.1 1.46 :
Source: Eurostat, UNECE, CSO Vital Statistics 11 2009 data used for TFR for EU, Belgium, France, Italy, Cyprus, Portugal, Romania, United Kingdom and Switzerland and 2008 used for Turkey. Mean age at birth of first child data refers to 2007 for Greece and Italy, 2006 for Belgium, France, Spain, United Kingdom and Iceland and 2005 for Austria, Cyprus, Denmark, Finland, Netherlands, Portugal, Swe-den and Switzerland.
Fertility rate

35
3.14 EU: Representation in national parliaments, 2007-201112 % female representatives
Country 2007 2008 2009 2010 2011Sweden 47.0 47.0 46.4 45.0 45.0Finland 41.5 41.5 40.0 40.0 42.5Belgium 35.3 35.3 38.0 39.3 39.3Netherlands 39.3 41.3 42.0 40.7 39.3Denmark 38.0 38.0 38.0 38.0 38.0Spain 36.6 36.3 36.6 36.6 36.6Germany 31.6 32.2 32.8 32.8 32.8Austria 32.8 27.3 27.9 27.9 27.9Portugal 28.3 28.3 27.4 27.4 26.5EU 23.5 23.8 24.0 24.2 24.2Czech Republic 15.5 15.5 15.5 22.0 22.0United Kingdom 19.5 19.5 19.5 22.0 22.0Italy 17.3 21.3 21.3 21.3 21.3Bulgaria 21.7 21.7 20.8 20.8 20.8Latvia 20.0 20.0 22.0 20.0 20.0Luxembourg 23.3 23.3 20.0 20.0 20.0Poland 20.4 20.2 20.0 20.0 20.0Estonia 20.8 20.8 22.8 22.8 19.8Lithuania 22.7 17.7 19.1 19.1 19.1France 18.2 18.2 18.9 18.9 18.9Greece 14.7 14.7 17.3 17.3 17.3Slovakia 19.3 19.3 18.0 15.3 16.0Ireland 13.3 13.3 13.9 13.9 15.1Slovenia 12.2 13.3 14.4 14.4 14.4Romania 9.4 11.4 11.4 11.4 11.4Cyprus 14.3 14.3 12.5 12.5 10.7Hungary 11.1 11.1 11.1 9.1 9.1Malta 9.2 8.7 8.7 8.7 8.7
Source: Inter-parliamentary union database
♦ Equal participation and representation of women and men in decision-making is one of the five objectives of an EU Council Decision adopted in 2000 for a Community Frame-work Strategy on Gender Equality.
♦ 15.1% of TDs in the Dáil were women in 2011, the sixth lowest proportion in the EU and well below the EU average of 24.2%. The highest participation of women in parliament was in Sweden where 45% of the parliamentarians are female, followed by Finland with a rate of 42.5%. .
12 Lower house female representation as of December 31 for 2007-2010 and August 31 for 2011.
EU: Representation in national parliaments, 201112
% female representatives
< 14 14 < 20 20 < 26 26 < 36 ≥ 36
Decision-m
aking

36
3.15 Ireland: Women and men in decision-making, 2011
National
0% 25% 50% 75% 100%
State Boards
Seanad Éireann
Ministers of State
Dáil Éireann
Government Ministers
Men Women
Regional
0% 25% 50% 75% 100%
Vocational Education Committees
County Development Boards
County Enterprise Boards
Local Authorities
Regional Authorities
Men Women
• Men out-numbered women in all national decision-making structures in Ire-land in 2011. Women accounted for just over one in three members of State Boards (34.7%) and only 13.3% of Government Ministers.
• Men also out-numbered women in all regional decision-making structures in Ireland in 2011, with men accounting for just under two-thirds of Voca-tional Education Committee members and over four-fifths of representa-tives in local authorities.
Decision-m
aking

37
3.16 Ireland: Civil Service general service grades, 2010
% of gradeGrade Men WomenSecretary General 82.4 17.6Deputy & Assistant Secretary 83.9 16.1Principal Officer 69.4 30.6Assistant Principal 61.4 38.6Administrative Officer 40.8 59.2Higher Executive Officer 48.2 51.8Executive Officer 33.3 66.7Staff Officer 20.8 79.2Clerical Officer 22.6 77.4Services Officer 87.1 12.9Services Attendant 92.7 7.3
Total 34.8 65.2
Total persons 8,833 16,574Source: Department of Finance
♦ In 2010, 65.2% of Irish civil servants in general service were women. 77.4% of clerical officers were female and nearly four-fifths (79.2%) of staff officers were female. In con-trast, approximately a sixth of those at Secretary General level and Deputy and Assistant Secretary level were female.
♦ The middle management grade of Higher Executive Officer was the most gender-balanced of all grades.
Ireland: Civil Service general service grades by sex, 2010
0% 25% 50% 75% 100%
Total
Secretary General
Deputy & Assistant Secretary
Principal Officer
Assistant Principal
Administrative Officer
Higher Executive Officer
Executive Officer
Staff Officer
Clerical Officer
Services Officer
Services Attendant
Men Women % of grade
Decision-m
aking

38
3.17 Ireland: Religion by age group, 2006
% 0-19 20-64 65 & over
Religion Men Women Men Women Men WomenRoman Catholic 88.1 88.3 83.9 86.9 90.7 92.3Other 6.6 6.7 7.6 7.5 6.1 5.7No religion 2.9 2.7 6.8 4.5 1.9 0.8Not stated 2.4 2.3 1.7 1.1 1.3 1.2
Total 100.0 100.0 100.0 100.0 100.0 100.0Source: CSO Census of Population
3.18 Ireland: Religion by nationality, 2006
% Irish Other EU13 Non-EU Total14 Religion Men Women Men Women Men Women Men WomenRoman Catholic 91.2 92.8 60.7 60.4 29.8 34.8 86.7 88.8Church of Ireland 2.3 2.4 8.5 10.4 3.2 4.2 2.8 2.9Other Christian religion 0.4 0.5 1.0 1.3 5.0 6.5 0.6 0.7Presbyterian 0.4 0.4 1.6 1.7 2.0 2.4 0.5 0.5Muslim (Islamic) 0.3 0.2 0.5 0.5 17.0 11.0 0.9 0.6Orthodox 0.1 0.1 1.3 1.5 9.1 9.0 0.5 0.5Methodist 0.1 0.1 0.8 0.9 2.2 2.4 0.3 0.3Other stated religions 0.6 0.6 3.6 4.8 13.4 14.0 1.3 1.3No religion 3.5 2.2 19.1 16.4 14.0 12.4 5.0 3.4Not stated 1.0 0.9 2.7 2.0 4.3 3.4 1.3 1.0
Total 100.0 100.0 100.0 100.0 100.0 100.0 100.0 100.0Source: CSO Census of Population
13 Bulgaria and Romania are included with Non-EU countries. 14 Excludes 'no nationality' and 'nationality not stated'.
♦ In 2006, 90.7% of men aged 65 and over and 92.3% of women aged 65 and over described themselves as Roman Catholic. These were around six percentage points higher than the rates for the 20-64 age group.
♦ In the population usually resident in Ireland, 86.7% of men and 88.8% of
women were recorded as Roman Catholic in Census 2006. Just over 60% of ‘Other EU’ nationals were recorded as Roman Catholic.
♦ The proportion of 'Other EU' nationals resident in the state professing ‘No
religion’ in Census 2006 was 19.1% for men and 16.4% for women.
Religion

39
3.19 Ireland: Grants to high-performance athletes by age of athlete, 2001 and 2010
number 2001 2010 Age of athlete Men Women Men Women
19 and under 67 24 107 5120-24 64 23 63 3025-29 29 11 33 1030-34 19 6 10 535-44 6 4 13 245-64 1 1 3 1Unknown 2 0 7 1
Total15 188 69 236 100Source: Irish Sports Council
3.20 Ireland: Grants to high-performance athletes by size of grant, 2010
recipients average allocation (€)
Size of grant Men Women Men Women
Less than €5,000 107 51 2,651 2,500€5,000 - €9,999 50 21 5,858 5,063€10,000 - €14,999 40 15 11,902 12,000€15,000 - €19,999 10 3 15,182 17,000€20,000 & over 29 10 27,701 29,500
Total15 236 100 8,506 7,590Source: Irish Sports Council
15 The total amount of grants allocated in 2001 includes grants to 72 Junior athletes (57 males and 15 females) while the figures for 2010 include grants to 213 Junior athletes (142 males and 71 females). These grants are usually in the form of squad grants and the recipients generally receive an equal amount. Grants to teams have been excluded from the figures above as a breakdown of the grant by team members cannot be provided.
♦ In 2010, the Irish Sports Council awarded grants under the International Carding Scheme to 236 male athletes and 100 female athletes. Nearly half of grants to men (45%) and just over half of grants to women were awarded to athletes aged 19 and under.
♦ In 2010, the average grant amount allocated by the Irish Sports Council under the
International Carding Scheme was €8,506 for men and €7,590 for women. ♦ Grants of €15,000 or more were allocated to 16.5% of male athletes and 13% of
female athletes.
Grants to athletes

40
3.21 Ireland: Arts Council grants16 to artists by artform, 2010
recipients average allocation(€)Artform Men Women Men Women
Arts participation 4 10 10,330 5,178Dance 9 42 12,678 9,582Film 22 15 12,446 10,872Literature 72 51 12,451 9,414Music 70 41 9,821 6,335Opera 9 4 7,644 8,500Theatre 31 39 5,515 9,042Traditional Arts 29 9 5,955 7,350Visual arts 90 100 10,058 8,897Young people and children 5 10 2,418 4,588Other 7 11 3,864 7,848
Total 348 332 9,684 8,530Source: Arts Council
Ireland: Arts Council grants16 to artists by artform, 2010
0% 25% 50% 75% 100%
Total
Dance
Theatre
Visual arts
Literature
Film
Music
Traditional arts
Men Women
16 The data in these tables are a representation of Arts Council financial support to the individual artist where the primary administrative relationship is with the Arts Council (Cnuas; Artists’ Bur-saries; Artists’ Awards). Supports to the individual artist where the relationship is administered in partnership with other agencies (Artists’ Schemes) have not been included in this instance as a detailed gender breakdown is not available (see Appendix 1 for further details).
3.22 Ireland: Arts Council grants16 to artists by size of grant, 2010
recipients average allocation (€)Size of grant Men Women Men WomenLess than €5,000 120 153 1,801 1,723€5,000 - €9,999 69 63 6,762 6,653€10,000 - €14,999 40 38 11,529 11,226€15,000 & over 119 78 18,707 22,084
Total 348 332 9,684 8,530Source: Arts Council
♦ The Arts Council awarded 680 grants to artists in 2010. Women represented nearly half (48.8%) of recipients. The average grant awarded to men was €9,684 and to women was €8,530. About 46% of the grants to women and just over a third (34.5%) of grants to men were less than €5,000 in value.
♦ Just over a quarter (25.9%) of the grants to men and three out of ten grants to
women were in the field of visual arts. About one in five grants to men were for literature and a further one in five were for music. Around 15% of grants to women were for literature with just under 13% for dance.
♦ Men received over three quarters of grants awarded in the field of traditional arts
while women received 82% of grants relating to dance. Grants awarded in the fields of visual arts and theatre were the most evenly divided between women and men.
Grants to artists

41
Education
4.1 Ireland: Leaving Certificate candidates, 2011
number
higher level candi-dates as a % of total candidates
% higher level can-didates attaining A
or B gradesSubject (higher level) Boys Girls Boys Girls Boys Girls
English 14,580 18,203 54.0 66.5 34.5 39.6French 5,277 8,622 19.6 31.5 37.9 43.6Irish 5,089 9,270 18.9 33.9 45.1 51.7 Biology 8,410 14,267 31.2 52.2 41.7 43.9Chemistry 2,743 3,529 10.2 12.9 51.0 53.6Mathematics 4,479 3,758 16.6 13.7 46.9 47.6Physics 3,462 1,320 12.8 4.8 45.5 47.5 Construction studies 6,519 368 24.2 1.3 39.7 43.5Design and communication graphics 3,552 442 13.2 1.6 48.3 55.4Engineering 3,812 148 14.1 0.5 43.2 37.2 Art 2,764 5,451 10.2 19.9 30.6 44.5Home Economics 719 8,005 2.7 29.3 22.1 44.4Music 1,807 3,620 6.7 13.2 62.4 69.8 Total Leaving Certificate candidates17 26,985 27,356
Source: State Examinations Commission
17 The above data exclude candidates in the Leaving Certificate Applied programme. School can-didates, repeat candidates, external candidates, VTOS and PLC candidates are included in the table. The data reflect the situation in September 2011 before the appeals process was finalised.
Candidates in selected higher level subjects, 2011
0% 25% 50% 75% 100%
Biology
Chemistry
Mathematics
Physics
Design and communication graphics
Construction studies
Engineering
% of candidates taking subject at higher levelBoys Girls
♦ 50.3% of students sitting the Leaving Certificate in 2011 were female. Just under
two-thirds (66.5%) of girls sitting the Leaving Certificate took English at higher level compared with 54% of boys. There were also higher proportions of girls tak-ing Irish and French at higher level.
♦ Less than 1% of girls took Engineering as a higher level Leaving Certificate exam
subject compared with 14.1% of boys. At higher level, boys accounted for 88.9% of candidates in Design and communication graphics, 94.7% of candidates in Construction studies and 96.3% of candidates in Engineering.
Second-level education

42
4.2 Ireland: Third-level graduates18 by field of study, 2009
number %
Field of education Men Women Men Women
Agriculture 332 286 1.3 0.9Arts and humanities 3,481 5,977 14.1 18.5Education 1,573 4,529 6.4 14.0Engineering, manufacturing and construction 5,112 1,113 20.7 3.4Health and welfare 1,377 6,440 5.6 19.9Science 3,550 2,731 14.4 8.4Services 1,404 1,210 5.7 3.7Social sciences, business and law 7,841 10,092 31.8 31.2
Total 24,670 32,378 100.0 100.0Source: Department of Education and Science
Ireland: Third-level graduates20 by field of study and sex, 2009
0% 25% 50% 75% 100%
Engineering, manufacturing and construction
Science
Services
Agriculture
Social sciences, business and law
Arts and humanities
Education
Health and welfare
Total
% of graduates in fieldmen women
18 At ISCED levels 5 and 6 (see Appendix 1). Total excludes graduates where field of education was not specified.
♦ Women represented 56.8% of all third-level graduates in Ireland in 2009. 31.2%
of female graduates were in Social sciences, business and law while one fifth (19.9%) were in Health and welfare. 31.8% of male graduates were in Social sci-ences, business and law with one in five in Engineering, manufacturing and con-struction (20.7%).
♦ Women represented nearly five-sixths of graduates in the Health and welfare field and nearly three-quarters of graduates in Education. Men represented nearly five-sixths of graduates in the Engineering, manufacturing and construction field.
Third-level graduates

43
4.3 Ireland: Students as proportion of population aged 18-24, 2006 and 2011
% 2006 2011
Age Men Women Men Women18 years 63.5 80.4 81.5 83.519 years 47.3 59.5 64.7 70.920 years 35.1 51.3 54.1 60.021 years 26.4 41.7 45.7 48.322 years 21.6 30.7 26.7 27.023 years 15.8 14.4 22.8 19.824 years 8.6 10.1 14.7 14.3Total 18-24 year olds 29.7 39.8 44.9 45.9
Source: CSO QNHS Ireland: Students as proportion of population aged 18-24, 2011
0
10
20
30
40
50
60
70
80
90
18 years 19 years 20 years 21 years 22 years 23 years 24 years
Men Women % of sex at given year of age
♦ The proportion of students among males in the 18-24 age group rose by over 15 percentage points between 2006 and 2011, from 29.7% to 44.9%. Over the same period, the proportion of students among females in the same age group also in-creased, from 39.8% to 45.9%.
♦ In 2011, 83.5% of 18-year-old women were students compared with 81.5% of 18
year-old-men. This pattern, of a higher proportion of women, continued for women and men up to and including 22 years. For women and men aged 23 and 24 years the pattern reverses and a higher proportion of men are students.
Participation in education

44
4.4 Ireland: Persons aged 25-34 with third-level qualification, 2002-2011
%Year Men Women
2002 31.2 37.52003 34.2 38.82004 35.6 42.42005 35.2 44.62006 33.3 46.72007 34.4 47.62008 35.1 50.12009 38.7 51.02010 38.9 52.32011 39.1 53.1
Source: CSO QNHS Ireland: Persons aged 25-34 with third-level qualification, 2002-2011
0
10
20
30
40
50
60
2002 2003 2004 2005 2006 2007 2008 2009 2010 2011
Men Women %
4.5 Ireland: Persons aged 35-64 by highest level of education attained, 2011
000s %
Level of education attained Men Women Men Women Primary or no formal education 121.2 99.4 14.2 11.7 Lower secondary 157.4 127.2 18.4 14.9 Higher secondary 188.4 207.6 22.1 24.3 Post leaving certificate 101.1 106.5 11.8 12.5 Third-level 266.2 293.5 31.2 34.4 Not stated 20.0 18.6 2.3 2.2
Total 854.3 852.8 100.0 100.0 Source: CSO QNHS
♦ The percentage of both men and women aged 25-34 with a third-level qualification
increased over the period 2002-2011. The percentage of men with a third-level qualification increased from 31.2% in 2002 to 35.6% in 2004 but fell back a little to 33.3% in 2006. Since then the percentage has increased steadily to stand at 39.1% in 2011, a rise of 7.9 percentage points since 2002. There was a consid-erably larger increase for women from 37.5% in 2002 to 53.1% in 2011, an in-crease of 15.6 percentage points.
♦ 26.6% of women aged 35-64 had at most lower secondary education in 2011
while the percentage of men in this age group having at most lower secondary education was 32.6%. Just over a third of women (34.4%) aged 35-64 had third-level education compared with 31.2% of men.
Educational attainm
ent

45
4.6 Ireland: Classroom teachers19, 1999-2009
%
Year
ISCED 1 Primary
ISCED 2-3 Second-level
Men Women Men Women
1999/2000 14.9 85.1 42.2 57.82000/2001 14.6 85.4 41.3 58.72001/2002 14.0 86.0 40.9 59.12002/2003 13.5 86.5 40.2 59.82003/2004 16.4 83.6 40.0 60.02004/2005 15.9 84.1 39.4 60.62005/2006 17.1 82.9 37.9 62.12006/2007 17.8 82.2 37.9 62.12007/2008 17.2 82.8 36.3 63.72008/2009 15.3 84.7 36.6 63.4
Source: Eurostat
♦ Women accounted for 84.7% of teachers at primary level and 63.4% of teachers
at second-level in Ireland in the school year 2008/2009. The proportion of female teachers at primary level has decreased between the 1999/2000 and the 2008/2009 academic years by 0.4 percentage points while the proportion at sec-ond-level has increased by 5.6 percentage points.
♦ In 2008/2009, 15.3% of primary school teachers in Ireland were men. The highest reported levels of male participation in primary teaching among other EU countries were in Greece and Denmark20 where about one-third of all primary teachers were male, compared to only 2.3% of all primary school teachers in Lithuania.
♦ At second-level there were more female than male teachers in all reporting coun-tries with the exceptions of Luxembourg, Netherlands, Turkey, Switzerland and Iceland.
♦ At third-level 62.5% of academic staff were male in Ireland and men outnumbered women in all EU countries for which information was available except in Finland, Latvia and Lithuania.
19 Refers to full-time equivalents. 20 See country notes in Appendix 1 of report.
4.7 EU: Classroom teachers and academic staff19, 21, 2009
ISCED 1 Primary
ISCED 2-3 Second-level
ISCED 5-6 Third-level
Country Men Women Men Women Men Women Greece 34.6 65.4 43.4 56.6 66.0 34.0 Denmark 31.4 68.6 : : : : Luxembourg 26.9 73.1 51.1 48.9 : : Spain 25.4 74.6 46.3 53.7 60.9 39.1 Finland 21.5 78.5 35.8 64.2 49.5 50.5 Portugal 20.4 79.6 30.6 69.4 56.6 43.4 Belgium 20.0 80.0 39.9 60.1 54.8 45.2 United Kingdom 19.9 80.1 37.8 62.2 60.5 39.5 Netherlands 18.9 81.1 57.4 42.6 63.5 36.5 Sweden 18.6 81.4 41.8 58.2 56.6 43.4 France 18.3 81.7 39.4 60.6 62.7 37.3 Cyprus 17.1 82.9 36.3 63.7 60.6 39.4 Ireland 15.3 84.7 36.6 63.4 62.5 37.5 Germany 14.8 85.2 41.8 58.2 65.3 34.7 Poland 13.5 86.5 29.1 70.9 57.3 42.7 Romania 13.3 86.7 31.8 68.2 55.5 44.5 Malta 11.3 88.7 38.0 62.0 68.9 31.1 Austria 10.0 90.0 38.3 61.7 68.1 31.9 Latvia 7.0 93.0 17.7 82.3 42.8 57.2 Bulgaria 6.2 93.8 21.2 78.8 52.2 47.8 Italy 5.9 94.1 34.0 66.0 64.4 35.6 Slovakia 5.8 94.2 23.2 76.8 55.4 44.6 Estonia 4.4 95.6 21.7 78.3 51.6 48.4 Hungary 3.8 96.2 27.9 72.1 61.7 38.3 Slovenia 2.6 97.4 27.0 73.0 65.4 34.6 Czech Republic 2.4 97.6 34.5 65.5 60.4 39.6 Lithuania 2.3 97.7 17.0 83.0 45.8 54.2 Iceland 20.5 79.5 50.2 49.8 54.3 45.7 Norway 27.0 73.0 40.8 59.2 57.0 43.0 Switzerland 23.2 76.8 55.5 44.5 72.0 28.0 Croatia 6.8 93.2 30.1 69.9 56.5 43.5 Macedonia : : 42.4 57.6 55.0 45.0 Turkey 49.6 50.4 58.5 41.5 59.3 40.7
Source: Eurostat
21 2007 data used for Greece for ISCED 1-6 and 2004 data used for ISCED 5-6 for Estonia.
Education personnel

46
4.8 EU: School management personnel, 200922
% ISCED 1
Primary ISCED 2-3
Second-level Country Men Women Men Women
Bulgaria 19.5 80.5 31.4 68.6Poland 22.1 77.9 37.4 62.6Slovenia 29.9 70.1 38.0 62.0Romania 13.8 86.2 42.8 57.2Cyprus 26.0 74.0 45.8 54.2Slovakia 13.4 86.6 46.5 53.5Sweden 26.3 73.7 47.6 52.4Italy : : 51.0 49.0France 17.7 82.3 55.5 44.5Ireland 46.6 53.4 59.4 40.6Finland 58.7 41.3 59.7 40.3Greece 68.7 31.3 66.2 33.8Belgium 50.0 50.0 66.6 33.4Austria 23.0 77.0 71.3 28.7Netherlands 60.6 39.4 : :United Kingdom 24.8 75.2 : : Norway 44.6 55.4 50.8 49.2Iceland 14.5 85.5 57.5 42.5Macedonia : : 69.7 30.3
Source: Eurostat
♦ At primary level in Ireland in 2009, school management personnel were fairly evenly divided between women and men with women representing 53.4% of man-agement at this level. The gender breakdown of primary school managers in re-porting countries in 2009 varied from 31.3% female in Greece to 86.6% female in Slovakia.
♦ In Ireland in 2009, 59.4% of second-level school management personnel were
male. For those EU countries for which data were available, Sweden and Italy had the most gender-balanced number of head teachers at second-level.
222007 data used for Greece and ISCED 3 data used for ISCED 2-3 for Ireland and Macedonia. See country notes in Appendix 1 of report.
Education personnel

47
Health 5.1 Ireland: Life expectancy at birth and at 65 years, 1925-2007
years At birth At 65 years
Period Men Women Difference Men Women Difference1925-1927 57.4 57.9 0.5 12.8 13.4 0.61935-1937 58.2 59.6 1.4 12.5 13.1 0.61940-1942 59.0 61.0 2.0 12.3 13.2 0.91945-1947 60.5 62.4 1.9 12.0 13.1 1.11950-1952 64.5 67.1 2.6 12.1 13.3 1.21960-1962 68.1 71.9 3.8 12.6 14.4 1.81965-1967 68.6 72.9 4.3 12.4 14.7 2.31970-1972 68.8 73.5 4.7 12.4 15.0 2.61978-1980 69.5 75.0 5.5 12.4 15.4 3.01980-1982 70.1 75.6 5.5 12.6 15.7 3.11985-1987 71.0 76.7 5.7 12.6 16.2 3.61990-1992 72.3 77.9 5.6 13.4 17.1 3.71995-1997 73.0 78.5 5.5 13.8 17.4 3.62001-2003 75.1 80.3 5.2 15.4 18.7 3.32005-2007 76.8 81.6 4.8 16.6 19.8 3.2
Source: CSO Irish Life Tables No 15, 2005-2007 ♦ In Ireland, women’s life expectancy at birth increased from 57.9 years in the pe-
riod 1925-1927 to 81.6 years in 2005-2007. Over the same period, the life expec-tancy at birth of men increased from 57.4 years to 76.8 years. The difference be-tween male and female life expectancy at birth increased from 0.5 years in 1925-1927 to 5.7 years in 1985-1987 before decreasing to 4.8 years in 2005-2007.
♦ The difference between male and female life expectancy at 65 years of age in-
creased from 0.6 years in 1925-1927 to 3.7 years in 1990-1992. However, this dif-ference had decreased to 3.2 years by 2005-2007.
♦ Life expectancy at birth in 2006 for Irish women at 81.6 years was below the 2008
EU average of 82.4 years. Life expectancy at birth for Irish men was 76.8 years, slightly higher than the EU average of 76.4.
♦ Sweden had the highest life expectancy at birth in the EU in 2010 for men at 79.5
years while France had the highest for women at 84.8 years.
♦ The lowest life expectancy at birth in the EU in 2010 for men was in Lithuania at 68 years and the lowest for women was in Bulgaria at 77.2 years.
5.2 EU: Life expectancy at birth, 201023 years Country Men Women DifferenceNetherlands 78.8 82.7 3.9United Kingdom 78.5 82.4 3.9Sweden 79.5 83.5 4.0Denmark 77.1 81.2 4.1Malta 78.9 83.1 4.2Cyprus 77.9 82.4 4.5Ireland 76.8 81.6 4.8Germany 77.5 82.6 5.1Greece 77.9 83.0 5.1Luxembourg 77.6 82.7 5.1Belgium 77.4 82.6 5.2Italy 79.2 84.4 5.2Austria 77.7 83.2 5.5EU 76.4 82.4 6.0Spain 78.7 84.7 6.0Portugal 76.1 82.1 6.0Czech Republic 74.4 80.6 6.2Slovenia 76.3 82.7 6.4Finland 76.7 83.2 6.5France 78.1 84.8 6.7Bulgaria 70.0 77.2 7.2Slovakia 71.6 78.8 7.2Romania 69.8 77.3 7.5Hungary 70.5 78.1 7.6Poland 72.1 80.6 8.5Latvia 68.8 78.4 9.6Estonia 70.6 80.5 9.9Lithuania 68.0 78.8 10.8
Iceland 79.5 83.5 4.0Macedonia 72.5 76.7 4.2Norway 78.9 83.2 4.3Switzerland 80.1 84.5 4.4Turkey 71.8 76.8 5.0Croatia 73.6 79.6 6.0
Source: Eurostat
23 EU data is for year 2008. 2006 data used for Ireland, 2007 for Luxembourg and 2009 for Cy-prus.
Life expectancy

48
5.3 Ireland: Age-sex specific death rates, 2010
per 100,000 population Age group Males Females Male:Female ratio
0-4 101 81 1.2:15-14 10 8 1.3:115-24 75 20 3.8:125-64 270 164 1.6:165-74 2,016 1,285 1.6:175 and over 8,199 6,904 1.2:1
Source: CSO Vital Statistics 5.4 Ireland: Death rates for persons aged 65-74, 2000-2010
0
500
1,000
1,500
2,000
2,500
3,000
3,500
4,000
2000 2001 2002 2003 2004 2005 2006 2007 2008 2009 2010
Male Femaleper 100,000 population
Source: CSO Vital Statistics
5.5 Ireland: Mortality by cause of death, 2010
number per 100,000 populationCause of death Men Women Men WomenCirculatory diseases 4,636 4,553 209 202Malignant neoplasms 4,186 3,785 189 168Accidents 589 319 27 14Suicide 386 100 17 4
Source: CSO Vital Statistics ♦ In 2010, the death rate in Ireland was higher for males than for females in all age
groups. The most pronounced difference was in the 15-24 age group where the male rate was nearly four times that of the female rate.
♦ The death rate for the 65-74 age group decreased by over a third for both men
and women over the period 2000-2010. ♦ The mortality rate due to accidents for men (27 per 100,000) was nearly twice that
of women in 2010 while the male mortality rate due to suicide (17 per 100,000) was over four times the female rate.
Death rates

49
5.6 Ireland: Persons24 with a Medical Card, 2011 % Age group Men Women
0-15 35.8 35.516-24 30.3 34.225-34 22.2 26.635-44 25.9 29.245-54 25.4 26.655-64 31.0 34.065-69 42.8 53.870+ 97.0 98.4
Total 34.1 37.9
Persons registered 757,471 858,338Source: HSE, CSO Demography
Ireland: Persons26 registered with a Medical Card, 2011
0
10
20
30
40
50
60
70
80
90
100
0-15 16-24 25-34 35-44 45-54 55-64 65-69 70+
Male Female %
24 Between 2001 and 2008 all persons aged 70 and over were entitled to a medical card. How-ever, from January 2009 only persons with income under certain limits are entitled to a card. See Appendix 1 for further details.
♦ In 2011, around 36% of boys and girls aged up to 15 were registered for a medical
card. However, for all other age groups there was a higher proportion of women than men registered, particularly in the 65-69 age group, where more than half of women were registered (53.8%) compared with 42.8% of men.
Medical cards

50
5.7 Ireland: Acute hospital discharges25 by principal diagnosis, 2010
% Diagnosis Men Women
Neoplasms 8.3 7.6Diseases of the nervous system and sense organs 4.5 4.6Circulatory diseases 6.5 4.0Respiratory diseases 4.9 4.0Digestive diseases 9.6 8.5Genitourinary diseases 3.4 5.4Pregnancy, childbirth and the puerperium 0.0 16.6Symptoms, signs and ill-defined conditions 7.0 6.9Injury and poisoning 5.1 3.3Other diagnoses 17.5 13.9Supplementary classifications 33.1 25.2 Of which Dialysis 15.4 8.3
Total 100.0 100.0
Total discharges per 1,000 population 304.6 342.5Source: Hospital Inpatient Enquiry (HIPE), Information Unit, Department of Health
Ireland: Acute hospital discharges29 by principal diagnosis and sex, 2010
0% 25% 50% 75% 100%
Total discharges
Genitourinary diseases
Diseases of the nervous system & sense organs
Symptoms, signs and ill-defined conditions
Neoplasms
Digestive diseases
Respiratory diseases
Injury and poisoning
Circulatory diseases
Dialysis
Men Women % of category
25 HIPE data covers discharges from all publicly funded acute hospitals.
5.8 Ireland: Acute hospital discharges25 by patient type, 2000-2010
per 1,000 population Day Patients In-Patients
Period Men Women Men Women
2000 67.2 77.0 121.3 155.7 2001 76.9 86.8 122.0 159.7 2002 85.2 95.2 118.9 156.2 2003 93.0 102.8 117.1 158.1 2004 100.9 109.6 117.1 160.4 2005 102.9 111.7 114.9 158.2 2006 161.2 151.6 115.6 159.8 2007 169.4 161.9 114.0 162.1 2008 176.1 172.7 109.9 160.2 2009 185.7 182.2 108.1 156.3 2010 197.4 186.8 107.2 155.7
Source: Hospital Inpatient Enquiry (HIPE), Information Unit, Department of Health, CSO Demography
♦ In 2010, the rate of discharges from acute hospitals was 304.6 per 1,000 popula-
tion for men and 342.5 per 1,000 for women. Nearly 17% of conditions diagnosed for women related to pregnancy and childbirth. For men, the most common single condition diagnosed was dialysis at 15.4% of discharges.
♦ The rate of discharge for day patients in 2010 was 197.4 per 1,000 for men and
186.8 per 1,000 for women. Data for years from 2006 onwards include patients admitted for dialysis on a day care basis which was previously excluded and thus there is a discontinuity in the data between years 2005 and 2006 in the series on day patients.
♦ Discharges of in-patients decreased for men over the period 2000-2010 from
121.3 per 1,000 in 2000 to 107.2 in 2010, while the rate for women increased from 155.7 to 162.1 in 2007 before falling to 155.7 in 2010.
Hospital activity

51
5.9 Ireland: Persons with an intellectual disability by level of disability, 2010
number %Level Men Women Men WomenMild 5,080 3,761 33.7 32.9Moderate 5,889 4,675 39.1 40.9Severe 2,328 1,737 15.5 15.2Profound 541 457 3.6 4.0Not verified 1,223 793 8.1 6.9
Total 15,061 11,423 100.0 100.0Source: National Intellectual Disability Database
Ireland: Persons with an intellectual disability by level of disability and sex, 2010
0% 25% 50% 75% 100%
Mild
Moderate
Severe
Profound
Total
% of categoryMen Women
5.10 Ireland: Admissions to psychiatric hospitals and units, 2009 of which
per 100,000 population first admissions (%)
Condition Men Women Men Women Organic mental disorder 12.3 13.4 42.3 44.2 Schizophrenia 112.9 70.2 18.5 18.9 Depressive disorders 115.3 156.3 35.8 28.4 Mania 42.6 57.3 19.8 17.5 Neuroses 33.4 35.8 49.8 44.1 Personality and behavioural disorders 13.1 32.7 25.1 12.1 Alcoholic disorders 56.5 33.0 36.2 30.4 Other drug disorders 28.0 9.1 37.8 38.4 Intellectual disability 3.2 2.0 19.4 13.3 Eating disorders 0.3 7.4 28.6 29.5 Other psychoses, and unspecified 36.1 32.3 44.4 42.5 Total 456.0 449.8 31.7 27.4
Source: Health Research Board, Activities of Irish Psychiatric Services ♦ There were a total of 26,484 persons registered on the National Intellectual Dis-
ability database in 2010, of whom 56.9% were men. The gender breakdown at each level of disability showed a similar pattern with men representing over half of persons in each category. Over 70% of both men and women with a disability were classified as having a mild or moderate disability.
♦ In 2009 the rate of admission to psychiatric units for men was 456 per 100,000
which was higher than the rate for women at 449.8 per 100,000 population. For both men and women the highest cause of admission was depressive disorders.
♦ The rate of admission of men to psychiatric units for alcohol disorders was over
70% higher than the rate for women in 2009. The male rate of admission for schizophrenia was over 60% higher than the female rate while the female rate of admission for depressive disorders was over one-third higher than the male rate.
Mental illness and disability

52
5.11 Ireland: Recipients of Carer’s Allowance and Carer’s Benefit26, 2000-2010
number Year Men Women % women
2000 3,475 13,053 79.02001 3,817 15,393 80.12002 4,199 16,811 80.02003 4,378 17,577 80.12004 4,674 19,035 80.32005 4,879 20,958 81.12006 5,561 23,560 80.92007 6,869 28,278 80.52008 9,175 36,643 80.02009 10,213 39,926 79.62010 10,524 40,053 79.2
Source: Department of Social Protection
5.12 Ireland: Recipients of Carer’s Allowance and Carer’s Benefit by age, 2010
number Age group Men Women % womenUnder 25 147 540 78.625-49 3,873 19,749 83.650-64 4,011 12,631 75.965 & over 2,493 7,133 74.1
Total 10,524 40,053 79.2Source: Department of Social Protection
26 Carer's benefit was first introduced in October 2000.
5.13 Ireland: Labour force participation rate of carers27 by unpaid help pro-vided, 2006
labour force participation rate
Hours per week Men Women1-14 79.8 62.415-28 75.9 56.329-42 76.1 53.743 or more 54.2 30.7
Total carers 73.2 52.8
All persons aged 15 & over 72.3 52.8Source: CSO Census of Population
♦ There were 50,577 persons in receipt of caring-related social welfare payments in
2010. The number of recipients has more than trebled since 2000. Four-fifths of recipients were women in 2010.
♦ Nearly half of all women in receipt of caring-related social welfare payments in
2010 were in the 25-49 age group. There were broadly equal numbers of men in the 25-49 and 50-64 age groups.
♦ In 2006, the labour force participation rates for carers aged 15 years and over
were 73.2% for men and 52.8% for women compared to rates of 72.3% of men and 52.8% of women aged 15 and over in the population as a whole.
27 Aged 15 years and over.
Carers

53
5.14 Ireland: Health service personnel by grade category, 201128
number Grade category Men Women % women
Medical/Dental ─ Consultant 1,823 1,014 35.7Medical/Dental ─ Non-consultant 2,875 3,194 52.6Nursing 3,471 39,529 91.9Health and social care professionals 2,981 15,275 83.7General support staff 5,079 7,687 60.2Other patient and client care 5,060 15,391 75.3Management & administration 2,702 15,649 85.3
Total 23,991 97,739 80.3Source: Health Service Executive, Service Personnel Census
Ireland: Health services personnel by grade and sex, 201130
0% 25% 50% 75% 100%
Total
Nursing
Management & administration
Health and social care professionals
Other patient and client care
General support staff
Medical/Dental ─ Non-consultant
Medical/Dental ─ Consultant
Men Women % of category
28 Excludes Home Help. Caution should be exercised in making grade category classification comparisons over time due to the reclassification of certain grades. See Appendix 1.
♦ In 2011, four out of five employees in the Irish health service were women. Women were in the majority in most grades within the health service, accounting for 91.9% of nurses, 85.3% of managers and administrators, and 83.7% of health and social care professionals. However in the Medical/Dental-Consultant category women were in the minority, accounting for over one in three consultants.
Health personnel

54
Crime
6.1 Ireland: Prisoners by offence group, 2010
Offence group Men Women % women
Homicide offences 51 2 3.8 Sexual offences 123 0 0.0 Attempts/threats to murder, assaults, harassment and related offences
687 57 7.7
Dangerous or negligent acts 1,127 98 8.0 Kidnapping and related offences 15 0 0.0 Robbery, extortion and hijacking offences 63 2 3.1 Burglary and related offences 463 17 3.5 Theft and related offences 1,193 257 17.7 Fraud, deception and related offences 343 22 6.0 Controlled drug offences 904 56 5.8 Weapons and explosives offences 284 6 2.1 Damage to property and to the environment 423 48 10.2 Public order and other social code offences 1,493 117 7.3 Road and traffic offences 2,749 523 16.0 Offences against government, justice procedures and organisation of crime
768 149 16.2
Offences not elsewhere classified 304 143 32.0
Total 10,990 1,497 12.0 Source: Irish Prison Service
♦ There were 12,487 persons committed to prison under sentence in 2010, of whom
one in eight were women. All prisoners committed for sexual offences and kidnap-ping and related offences were male. 17.7% of those committed to prison for theft and related offences were female.
♦ A quarter of men and just over a third of women were committed to prison for road and traffic offences.
♦ 13% of people convicted of a crime in Ireland in 2008 were female. Bulgaria at 5.9% had the lowest proportion of females convicted of crimes among those EU countries for which data were available, while Denmark had the highest at 19.3%.
6.2 EU: Criminal convictions29, 2008
%
Country Men Women Bulgaria 94.1 5.9 Romania 93.5 6.5 Portugal 91.5 8.5 Poland 91.5 8.5 Cyprus 91.1 8.9 Spain 90.8 9.2 Estonia 90.7 9.3 France 90.5 9.5 Latvia 90.5 9.5 Lithuania 89.1 10.9 Slovenia 88.2 11.8 Greece 88.2 11.8 Netherlands 87.2 12.8 Ireland 87.0 13.0 Slovakia 85.9 14.1 Austria 85.9 14.1 Hungary 85.7 14.3 Italy 84.2 15.8 Sweden 82.5 17.5 Germany 81.9 18.1 Finland 81.6 18.4 Denmark 80.7 19.3
Macedonia 93.3 6.7 Turkey 92.3 7.7 Croatia 89.7 10.3 Iceland 88.1 11.9 Switzerland 84.8 15.2 Source: UNECE Gender statistics database
29 Reference year is 2007 for Cyprus and Greece and 2006 for Estonia and Iceland and 2005 for Portugal.
Criminal convictions

55
6.3 EU: Victims of selected crimes, 200830
% Homicide Serious assault Sexual assault
Country Men Women Men Women Men Women
Austria 66.7 33.3 84.1 15.9 11.9 88.1Bulgaria 74.7 25.3 76.5 23.5 14.0 86.0Cyprus 68.2 31.8 87.4 12.6 12.5 87.5Czech Republic 66.8 33.2 74.9 25.1 8.8 91.2Denmark : : 76.1 23.9 8.4 91.6Finland 66.4 33.6 : : : :Germany 66.6 33.4 75.3 24.7 5.7 94.3Hungary 60.5 39.5 78.2 21.8 16.5 83.5Ireland 81.8 18.2 79.9 20.1 11.9 88.1Italy 74.9 25.1 59.6 40.4 9.5 90.5Lithuania 73.5 26.5 79.5 20.5 10.1 89.9Luxembourg 66.7 33.3 44.2 55.8 7.9 92.1Malta 83.3 16.7 83.8 16.2 15.0 85.0Netherlands 65.0 35.0 84.7 15.3 4.6 95.4Portugal 65.8 34.2 72.1 27.9 15.7 84.3Romania 60.6 39.4 86.3 13.7 9.1 90.9Serbia 71.2 28.8 85.8 14.2 7.3 92.7Slovakia 72.1 27.9 : : : :Slovenia 70.0 30.0 87.5 12.5 13.2 86.8Spain 69.3 30.7 68.2 31.8 12.5 87.5Sweden : : 79.9 20.1 : :United Kingdom 66.8 33.2 : : : :
Source: UNECE Gender statistics database
30 Reference year is 2007 for Cyprus, 2006 for Luxembourg and 2005 for Portugal. For The Neth-erlands data for homicide and sexual assault is from 2006 and for serious assault is from 2003. Data for homicide for the United Kingdom is from 2005.
6.4 Ireland: Murder/manslaughter recorded by age of victim, 2010
numberAge Men Women0-20 7 521-30 22 231-40 9 241-50 4 051 & over 5 2
Total 47 11Source: CSO Crime Statistics
♦ Men were more likely to be victims of homicide or serious assault than women in nearly all of the reporting countries in 2008. Women were far more likely than men to be victims of sexual assault. When examining these data it should be taken into account that levels of reporting of particular crimes may vary across countries.
♦ There were 58 victims of murder/manslaughter in Ireland in 2010 of which 47 were
men. Nearly half (46.8%) of male victims of murder/manslaughter were aged be-tween 21 and 30 years of age.
Victims of crim
e

56
Transport
7.1 Ireland: Means of travel to work, 1996 and 2006
% of usual residents aged 15 & over at work 1996 2006
Means of travel Men Women Men Women
On foot 8.6 16.1 8.7 13.7Bicycle 4.3 2.5 2.6 1.0Bus, minibus or coach 5.1 11.6 5.0 7.5Train, DART or LUAS 1.4 2.2 2.6 3.3Motor cycle or scooter 1.4 0.3 1.0 0.2Motor car: driver 47.6 44.3 53.5 61.9Motor car: passenger 5.7 13.4 5.1 6.2Other means (incl. lorry or van) 6.5 0.7 13.2 0.4Work mainly at or from home 16.1 6.2 6.4 4.5Not stated 3.4 2.8 1.9 1.2
Total 100.0 100.0 100.0 100.0Source: CSO Census of Population
7.2 Ireland: Time taken to travel to work, 2006
% of usual residents aged 15 & over at work 31
Time taken Men WomenLess than ¼ of an hour 24.1 29.2¼ of an hour to less than ½ an hour 26.3 30.9½ an hour to less than ¾ of an hour 17.8 17.7¾ of an hour to less than 1 hour 6.9 7.01 hour to less than 1½ hours 8.0 6.41½ hours and more 3.8 2.3Not stated 13.0 6.5Total 100.0 100.0
Source: CSO Census of Population ♦ In 1996, 47.6% of men and 44.3% of women in employment drove a car to work.
By 2006, this proportion had risen to 53.5% of men and 61.9% of women. The proportion of women travelling to work as a passenger in a car decreased from 13.4% in 1996 to 6.2% in 2006.
♦ 50.4% of men and 60.1% of women had a travel to work time of less than 30 min-
utes in 2006.
31 Excludes persons working mainly at or from home.
Travel to work

57
7.3 Ireland: Road fatalities32 by road user type, 2009
number Road user Men Women % women
Car driver 76 31 29.0Car passenger 30 9 23.1Pedestrian 26 14 35.0Pedal cyclist 7 0 0.0Motor cyclist 25 0 0.0Other road user 18 2 10.0
Total 182 56 23.5Source: Road Safety Authority
Ireland: Road fatalities34 by road user type, 2009
0% 25% 50% 75% 100%
Total
Pedestrian
Car driver
Car passenger
Other road user
Motor cyclist
Pedal cyclist
Men Women % of road user category
32 Collisions omitted where sex of casualty was not specified.
7.4 Ireland: Road fatalities32, 1999-2009
numberYear Men Women % women
1999 288 118 29.12000 302 104 25.62001 304 103 25.32002 260 101 28.02003 246 79 24.32004 259 102 28.32005 286 102 26.32006 262 97 27.02007 250 85 25.42008 199 75 27.42009 182 56 23.5
Source: National Roads Authority/Road Safety Authority 7.5 Ireland: Road casualties32 by age of victim, 2009
% Men Women Age group Fatalities Injuries Fatalities Injuries
0-17 9.3 13.0 7.1 13.718-24 29.1 23.7 19.6 20.925-44 39.0 38.5 26.8 37.045-64 14.8 15.8 25.0 18.365 & over 7.7 5.8 21.4 7.9Unknown 0.0 3.1 0.0 2.1Total 100.0 100.0 100.0 100.0
Number of casualties 182 5,242 56 3,962Source: Road Safety Authority
♦ Just over three-quarters (76.5%) of the 238 people who died on Irish roads in
2009 were men. All motor cyclists and pedal cyclists who died in road traffic acci-dents in 2009 were men.
♦ The overall level of road fatalities decreased in the period 1999-2009 by over a
third (36.8%) for men and by over a half (52.5%) for women. ♦ In 2009, nearly four out of ten (39%) male fatalities occurred in the 25-44 age
group while nearly 3 out of 10 (29.1%) were in the 18-24 age group. Just over a quarter (26.8%) of female fatalities were in the 25-44 age group while a quarter were in the 45-64 age group. Over one in five female fatalities and nearly one in twelve male fatalities were in the 65 and over age group.
Road traffic accidents

58
7.6 Ireland: Current driving licences by age of holder, 2010
% % Full licence Provisional licence Age group Men Women Men Women
20 & under 2.0 1.5 28.8 26.021-29 14.9 16.2 37.6 40.630-39 23.0 25.4 20.9 19.440-49 20.7 21.8 8.2 7.350-59 17.5 17.0 3.2 4.060-69 13.4 11.5 0.9 2.070-79 6.6 5.2 0.2 0.580 & over 1.9 1.4 0.1 0.1
Total 100.0 100.0 100.0 100.0
Number of current licences 1,292,275 1,082,896 226,220 213,143Source: Department of the Environment, Heritage and Local Government
Ireland: Full driving licences by age of holder, 2010
0% 25% 50% 75% 100%
Total
20 & under
21-29
30-39
40-49
50-59
60-69
70-79
80 & over
Men Women % of age group
♦ In 2010 54.4% of full driving licences were held by men. There were more men
than women with a full driving licence in all age groups while the most gender bal-anced age groups were those aged between 21 and 39 years of age.
♦ In 2010 51.5% of provisional driving licences were held by men and two-thirds of men and women with provisional licences were aged under 29 years of age.
Driving licences

59

60

61
Appendices

62
Appendix 1 Definitions and notes
1. Population
Migration Table 1.3; Graph 1.4
Emigrants are persons resident in Ireland leaving to live abroad for one year or more.
Immigrants are persons coming to Ireland from another country for the purpose of taking up residence for one year or more.
Net migration is the numbers of immigrants less emigrants in a given time period.
2. Employment
Employment rate Tables 2.1, 2.3, 2.11; Graphs 2.2, 2.4
The employment rate is defined as the number of persons in employment aged 15-64 as a percentage of the population aged 15-64: this is the International Labour Office (ILO) defini-tion and is based on data collected in the Labour Force Survey, which is called the Quarterly National Household Survey (QNHS) in Ireland. This survey covers persons aged 15 years and over living in private households. Persons living in collective households (halls of residence, medical care establishments, religious institutions, collective workers' accommodation, hostels, etc) and persons carrying out obligatory military service are not included.
The ILO classification distinguishes the following main sub-groups of the population aged 15 or over:
Persons in employment are all persons who, in the week before the survey: ♦ worked for one hour or more for payment or profit, including work on the family farm or
business; or ♦ had a job but were not at work because of illness, holidays, etc.
Persons classified as unemployed are persons who, in the week before the survey: ♦ were without work; ♦ were available for work within the next two weeks; and ♦ had taken specific steps, in the preceding four weeks, to find work.
The ILO labour force consists of persons in employment and unemployed persons
All data relating to the (ILO) labour force refer to the second quarter (April to June) of the refer-ence year unless otherwise stated.
EU Data for the current 27 EU Member States have been provided for all years. The EU increased its membership from 15 to 25 countries on 1 May 2004 and to 27 countries on 1 January 2007.
EU Council Meeting The EU Council meetings held in Spring of each year normally consider a statistical annexe measuring progress among the individual Member States and at an overall EU level. The an-nexe to the Spring Report comprises data from the EU structural indicators.
Labour force participation rate Table 2.5; Graph 2.6
Persons in the (ILO) labour force expressed as a percentage of the population aged 15 or over.
Occupation Table 2.7
As a result of changes to the European regulations governing the Quarterly Labour Force Sur-vey, (called the QNHS in Ireland), the CSO is obliged to report occupational coding data to Eurostat based on the new Europe wide classification ISCO-08 from Q1 2011 onwards. To allow this requirement to be met the CSO has changed to using UK SOC201033 as the primary classification, from which ISCO-08 can be derived. This change is also being implemented for 2011 Census results.
The previously used classification for publication purposes in Ireland was UK SOC1990 and this cannot be directly compared to the new UK SOC2010 classification. QNHS results for oc-cupations coded to the new SOC2010 classification from Q3 2010 to Q3 2011 were published in December 2011. Work is continuing to recode additional historical quarters to provide a longer and consistent time series for users and this will be published as soon as possible.
33 Further information regarding SOC 2010 is available at the link: http://www.ons.gov.uk/ons/guide-method/classifications/current-standard-classifications/soc2010/index.html

63
Economic sector Table 2.8
The classification used for economic sectors is NACE Rev. 2 which is the Statistical Classifica-tion of Economic Activities in the European Community. NACE is an acronym, (Nomenclature general des Activites economiques dans les Communautes Europeenes), used to designate the various statistical classifications of economic activities developed since 1970 in the Euro-pean Union.
Usual hours worked Table 2.9, 2.10
The number of hours usually worked covers all hours including extra hours, either paid or un-paid, which the person normally works, but excludes the travel time between the home and the place of work as well as the main meal breaks (normally taken at midday). Persons who usu-ally also work at home are asked to include the number of hours they usually work at home. Apprentices, trainees and other persons in vocational training are asked to exclude the time spent in school or other special training centres. When a respondent is unable to provide a figure for usual hours (because their hours vary considerably over time), the average of the hours actually worked per week over the past four weeks is used as a measure of usual hours.
Pension coverage Table 2.12
Questions on pensions were included in the Quarterly National Household Survey (QNHS) in the fourth quarter (October to December) of 2009. This was an update of a module on pen-sions asked in the three months from September to November 2005. The pensions module was asked of all persons aged 20 to 69 years who were in employment and who participated directly in the survey. The results are based on two questions ‘Are you a member of your em-ployer’s pension scheme?’ and ‘Do you contribute to a personal pension plan?’
The results cover pension coverage provided through occupational pension schemes and per-sonal pension arrangements and do not cover pensions paid through the State Social Welfare system.
Unemployment rate Tables 2.13, 2.14, 2.16; Graph 2.15
The number of persons unemployed expressed as a percentage of the (ILO) labour force.
Long-term unemployment rate Table 2.14
The number of persons unemployed for one year or more expressed as a percentage of the (ILO) labour force.
3. Social cohesion and lifestyles
Principal Economic Status Table 3.1
This classification is based on a single question in which respondents are asked what is their usual situation with regard to employment and given the following response categories:
♦ At work ♦ Unemployed ♦ Student ♦ Looking after home/family ♦ Retired ♦ Other.
Income liable for social insurance Tables 3.2, 3.3
These tables are based on data supplied to the CSO from the Department of Social Protection and Revenue and refer to all income (from both employees and the self-employed) which is liable for social insurance. In general, the earnings or income details for all persons, except the self-employed, relate to income from employment and do not include any social welfare pay-ments, investment incomes or rental income. They could, however, include private pension incomes. The income details for self-employed persons contain all returns including earnings, rental and investment incomes.
Private pension contributions are not liable for social insurance contributions and hence are not included in the income figures. In some cases this may be a very significant exclusion.

64
Persons with no income or for whom date of birth or sex was not available were excluded from these tables.
The age groups for these tables are based on the ages of persons at 31 December 2009. The tables only include persons aged between 15 and 84 years. The proportion of persons in each age group in the population covered by these tables is given below. It should be noted that the proportions are low for persons aged 65-84, with only 58.6% of men and 30.1% of women in that age group represented in these tables.
% of age group
Age group Men Women
15‐24 57.8 61.4
25‐34 92.3 87.4
35‐44 88.3 74.5
45‐54 80.2 70.8
55‐64 73.5 55.5
65‐84 58.6 30.1
Total aged 15‐84 77.3 66.3
Gender pay gap Graph 3.4
Eurostat has introduced new methodology on the unadjusted gender pay gap, which repre-sents the difference between average gross hourly earnings of male paid employees and of female paid employees as a percentage of average gross hourly earnings of male paid em-ployees. From reference year 2006 onwards the gender pay gap is based on the methodology of the EU Structure of Earnings Survey (SES) which is carried out with four-yearly periodicity. In Ireland the SES is known as the National Employment Survey (NES).
The target population for the gender pay gap consists of all paid employees in enterprises with 10 employees or more in NACE rev.2 aggregate B to S (excluding O). This covers all economic sectors with the exception of Agriculture, forestry and fishing, Public administration and de-fence, Activities of households as employers and Activities of extraterritorial organisations and bodies.

65
At risk of poverty rate Tables 3.5, 3.6, 3.7
The at risk of poverty rate before/after social transfers and pensions (ie, old-age and survivors’ benefits) shows the percentage of persons in the total population having an equivalised dis-posable income before/after social transfers and pensions that is below the national ‘at risk of poverty threshold’ which is set at 60% of the national median equivalised disposable income.
Data for Tables 3.5, 3.6 and 3.7 are obtained from the SILC survey (Community Statistics on Income and Living Conditions) and the EU definition of income is used. The national definition of income is used in the CSO publication ‘Survey on Income and Living Conditions in Ireland’. The key differences between the national and EU definitions of income are:
♦ The EU definition of gross income does not include income from private pensions. These are defined as private schemes fully organised by the individual, where contributions are at the discretion of the contributor independently of their employer or the State. Thus, pri-vate pensions do not include occupational or State pensions.
♦ The EU definition of income does not include the value of goods produced for own con-sumption, while the national definition does.
♦ All contributions to pension plans, except for those to private pension plans, are deducted from gross income when calculating disposable income under the EU definition. No pen-sion contributions of any kind are deducted from gross income in the calculation of dispos-able income for national purposes from the national definition of income.
♦ Employer’s social insurance contributions are included in the national definition of income. They are deducted from gross income in the calculation of net income. They are not in-cluded in any EU calculations of income. Employer’s social insurance contributions include contributions to private health insurance and life assurance schemes.
For EU at risk of poverty rates, the equivalised disposable income for each person is calculated as the household total net income divided by the equivalised household size according to the modified OECD scale (which gives a weight of 1.0 to the first adult, 0.5 to other persons aged 14 or over who are living in the household and 0.3 to each child aged less than 14). The na-tional equivalence scale used to obtain the equivalised household size attributes a weight of 1 to the first adult in a household, 0.66 to each subsequent adult (aged 14+ living in the house-hold) and 0.33 to each child aged less than 14. The purpose of an equivalence scale is to ac-count for the size and composition of different income units (households) and thus allows for a more accurate comparison between households. However, numerous scales have been devel-oped, and there is no real consensus as regards the most appropriate scale to use. For EU purposes, the modified OECD scale has been accepted to allow comparison across countries.
Early school leavers Table 3.8
Early school leavers are persons aged 18 to 24 meeting the following two conditions (numera-tor): ♦ the highest level of education or training attained is ISCED 0, 1 or 2 (see notes in section 4
– Education); and ♦ respondents declared as not having received any education or training in the four weeks
preceding the survey. The denominator consists of the total population of the same age group, excluding persons who did not respond to the questions 'highest level of education or training attained’ and ‘par-ticipation to education and training’. Both the numerators and the denominators come from the European Union Labour Force Survey – the Quarterly National Household Survey (QNHS) in Ireland.
Lone parents Tables 3.9, 3.10
A lone parent family unit consists of one parent and one or more of his or her never-married children. The number of lone parent family units may be understated as there are problems identifying lone parent families particularly where the lone parent lives with his/her parents. The QNHS does not specifically ask a person if he or she is a lone parent.
One-parent family pay-ments Table 3.11
One-Parent Family Payment is a means-tested payment which is made to men or women who are caring for a child or children without the support of a partner. The scheme was introduced on 2 January 1997, and replaced the Lone Parents Allowance and Deserted Wife’s Benefit schemes.

66
Age of women at birth of first child Tables 3.12, 3.13
The UNECE definition used in Table 3.13, of the mean age of women when their first child is born, differs from the national method of calculation used in Table 3.12. Using the UNECE definition, for a given calendar year, the mean age of women at first birth is calculated using the fertility rates for first births by age (in general, the reproductive period is between 15 and 49 years of age). Calculated in this way from the fertility rates by age, the mean age is not weighted, i.e. the different numbers of mothers at each age are not taken into account.
Country specific notes: Data refer to children born in marriages in Belgium, Finland and Germany. Data are based on events and not on fertility rates in Cyprus, Germany, Ireland and Luxem-bourg. Data for Ireland refer to year of registration and could include data from previous years. Data are based on still births and children born alive in Malta. Data calculated on actual age at first births in Norway. The national definition of the average age at maternity of first birth is 0.5 plus the sum of the products of the ages at maternity of first live births and the number of first live births for each age divided by the number of first live births. Childbearing years are regarded as between the ages of 15 and 49. Live births to mothers aged less than 15 are included in the age 15 cate-gory and are divided by the age 15 population. Similarly live births to mothers aged greater than 49 are included in the age 49 category and are divided by the age 49 population.
Total fertility rate Table 3.13
The mean number of children that would be born alive to a woman during her lifetime if she were to pass through her childbearing years conforming to the fertility rates by age of a given year. The total fertility rate is also used to indicate the replacement level fertility; in more devel-oped countries, a rate of 2.1 is considered to be replacement level.
Members of Parliament Table 3.14 Women and men in deci-sion-making Table 3.15
The data in this table have been compiled by the Inter-Parliamentary Union (www.ipu.org) on the basis of information provided by national parliaments in the reference year. The data for State Boards are as of 31 December 2010. The other national and regional figures describe the position as of October/November 2011.
Civil service general ser-vice grades Table 3.16
The number of persons at each grade should be taken as broadly correct as the distinction between general service and technical grade staff is not fully precise. Data in this table refer to the situation at December 2010 and exclude the Irish Prison Service, Foreign Affairs Local Recruits Serving Abroad, the National Gallery and the Commission for Public Service Ap-pointments.
Grants to high-performance athletes Tables 3.19, 3.20
The International Carding Scheme was introduced in 1998 to provide a range of supports to assist elite athletes realise their potential to perform successfully at the highest international level. The Carding Scheme is administered by the Irish Sports Council.
Arts Council grants pro-gramme Tables 3.21, 3.22
Arts Council supports for artists in 2010 were administered through 4 programmes: 1. Cnuas – an annual means tested stipend for Aosdána members 2. Artists’ Bursaries – made on a competitive basis to assist an individual artist in the devel-
opment of their art practice 3. Artists’ Awards – made on a competitive basis to assist artists and organisations in the
creation of new work 4. Artists’ Schemes – made on a competitive basis to assist artists and organisations in the
production and dissemination of new work. The data in these tables are a representation of Arts Council financial support to the individual artist where the primary administrative relationship is with the Arts Council (Cnuas; Artists’ Bur-saries; Artists’ Awards). Supports to the individual artist where the relationship is administered in partnership with other agencies (Artists’ Schemes) have not been included in this instance as a detailed gender breakdown is not available.
4. Education
ISCED Tables 4.2, 4.6, 4.7, 4.8
The International Standard Classification of Education (ISCED) is the basis for international education statistics.
ISCED 0 Pre-primary level of education Initial stage of organised instruction, designed primarily to introduce very young children to a school-type environment.

67
ISCED 1 Primary level of education Programmes normally designed to give students a sound basic education in reading, writing and mathematics.
ISCED 2 Lower secondary level of education The lower secondary level of education generally continues the basic programmes of the pri-mary level, although teaching is typically more subject-focused, often employing more special-ised teachers who conduct classes in their field of specialisation.
ISCED 3 Upper secondary level of education The final stage of secondary education in most countries. Instruction is often more organised along subject-matter lines than at ISCED level 2 and teachers typically need to have a higher level, or more subject-specific, qualification than at ISCED 2. There are substantial differences in the typical duration of ISCED 3 programmes both across and between countries, typically ranging from 2 to 5 years of schooling.
ISCED 4 Post secondary non-tertiary education These programmes straddle the boundary between upper secondary and post-secondary edu-cation from an international point of view, even though they may be considered as upper sec-ondary or post-secondary in a national context. They are often not significantly more advanced than programmes at level 3 but they serve to broaden the knowledge of participants who have already completed a level 3 programme. The students tend to be older than those in ISCED 3 programmes and have usually completed ISCED 3.
ISCED 5 First stage of tertiary education ISCED 5 programmes have an educational content more advanced than those offered at levels 3 and 4. Entry to these programmes normally requires the successful completion of ISCED level 3 or a similar qualification at ISCED level 4. ISCED 5A: These programmes are largely theoretically based and are intended to provide suf-ficient qualifications for gaining entry into advanced research programmes and professions with high skills requirements. The minimum cumulative theoretical duration of these programmes is three years (full-time equivalent). The faculty must have advanced research credentials. Com-pletion of a research project or thesis may be required. ISCED 5B: These programmes are generally more practical/technical and occupational specific than ISCED 5A programmes. They do not prepare students for direct access to advanced re-search programmes. The programme content is typically designed to prepare students to enter a particular occupation. ISCED 6 Second stage of tertiary education This level is reserved for tertiary programmes leading to the award of an advanced research qualification. The programmes are developed to advanced study and original research. This level requires the submission of a thesis or dissertation of publishable quality that is the prod-uct of original research and represents a significant contribution to knowledge. It is not solely based on course work and it prepares recipients for faculty posts in institutions offering ISCED 5A programmes, as well as research posts in government and industry.
Classroom teachers Tables 4.6, 4.7
Classroom teachers are defined as professional personnel involved in direct student instruc-tion, including the planning, organising and conducting of group activities whereby students’ knowledge, skills and attitudes develop as stipulated by educational programmes.
The classification includes: ♦ Classroom teachers ♦ Special education teachers in whichever setting they teach ♦ Other teachers who work with students as a whole class in a classroom, in small groups in
a resource room, or one-on-one inside or outside a regular classroom but excludes: ♦ Educational staff who have some teaching duties but whose primary function is not teach-
ing (e.g. it is managerial or administrative) ♦ Student teachers, teachers’ aides, or paraprofessionals ♦ School management personnel with teaching responsibilities. Country specific notes: Belgium ISCED 4 is included in ISCED 3 Czech Republic ISCED 4 and ISCED 5B are included in ISCED 3 Denmark ISCED 2 is included in ISCED 1 and ISCED 3 not available Estonia ISCED 4 is included in ISCED 3 Finland ISCED 4 is included in ISCED 3 Ireland ISCED 2 and 4 are included in ISCED 3

68
Lithuania ISCED 3 is included in ISCED 2 Netherlands ISCED 2 and ISCED 4 are included in ISCED 3 and ISCED 0 is included in ISCED 1 Portugal ISCED 4 is included in ISCED 3 Sweden Post graduate students doing teaching included in academic staff for ISCED 5-6 United Kingdom ISCED 4 is included in ISCED 3 Iceland ISCED 2 is included in ISCED 1 and ISCED 4 is partly included in ISCED 3 Macedonia ISCED 4 is included in ISCED 3 Norway ISCED 4 is included in ISCED 3 Switzerland ISCED 1-3 and 5-6 data refer to public institutions only and excludes special education programmes
School management per-sonnel Table 4.8
Head-teachers are defined as school-level management personnel such as principals, assis-tant principals, headmasters, assistant headmasters and other management staff with similar responsibilities. It excludes receptionists, secretaries, clerks and other staff who support the administrative activities of the school. Head-teachers may have teaching-responsibilities. If so, the amount of teaching is included in the number of full-time equivalent teachers, while when undertaking head-counts, the personnel is pro-rated between functions to get a correct count of individuals in total employed in education.
5. Health
Life expectancy Tables 5.1, 5.2
The mean number of years still to be lived by a person who has reached a certain exact age, if subjected throughout the rest of his or her life to current mortality conditions (age-specific probabilities of dying).
Age-sex specific death rates Table 5.3; Graph 5.4
The number of male/female deaths in a particular age group as a proportion of the number (in units of 100,000) of men/women of that age group in the population.
Cause of death categories Table 5.5
Deaths are coded according to the ninth revision of the International Standard Classification of Diseases, Injuries and Causes of death.
Medical cards Table 5.6
Persons who are unable without undue hardship to arrange General Practitioner medical and surgical services plus dental and optometric services for themselves and their dependants are provided with such services free of charge by being provided with a medical card issued by the HSE. Between 2001 and 2008 everyone aged 70 and over was entitled to a medical card; however, from January 2009 only persons with income under certain limits are entitled to a card. All existing medical cards for people aged over 70 were valid until 2 March 2009 and after that date the cards remain valid only if the person’s income is below the relevant income threshold. Data in Table 5.6 on medical cards refer to the situation on 1 January 2011. An eligible person is entitled to select a doctor of his/her choice, from among those doctors who have entered into agreements with Health Boards.
Acute hospital discharges Table 5.7, 5.8
Data on hospital discharges are obtained from the Hospital In-patient Enquiry (HIPE) system. HIPE is a health information system designed to collect clinical and administrative data on ac-tivity from all publicly funded acute hospitals. Since the mid-1990s close to 95 per cent of all discharges have been included in the system, with complete information on maternity hospitals included since 1999. The Economic and Social Research Institute manages the HIPE system.

69
National Intellectual Dis-ability Database Table 5.9
The National Intellectual Disability Database was established in 1995 to ensure that informa-tion is available to enable the Department of Health, the HSE and voluntary agencies in the Republic of Ireland to provide appropriate services designed to meet the changing needs of people with intellectual disability (mental handicap) and their families. The database was established on the principle that minimum information with maximum accu-racy was preferred, hence it incorporates only three basic elements of information: ♦ demographic details ♦ current service provision ♦ future service requirements. The objective is to obtain this information for every individual known to have an intellectual disability and assessed as being in receipt of, or in need of, an intellectual disability service. Information pertaining to diagnosis is specifically excluded, as the database is not designed as a medical epidemiological tool. The data held in any individual record represent the information available for that person at a specified point in time only. The record is updated whenever there are changes in the person’s circumstances or during the annual review process in the spring of each year.
Admissions to psychiatric hospitals Table 5.10
This covers admissions to all psychiatric in-patient facilities in Ireland. Data on admissions are obtained from two main sources, the National Psychiatric In-Patient Reporting System (NPIRS) and the Department of Health’s annual end-of-year returns.
Carer’s Allowance and Benefit Tables 5.11, 5.12
Carer's Allowance is a payment for carers on low incomes who live with and look after certain people in need of full-time care and attention.
Carer's Benefit is a payment made to insured persons who leave the workforce to care for a person(s) in need of full-time care and attention.
Carers Table 5.13
Data on carers were derived from answers to question 21 of the 2006 Census of Population questionnaire which asked persons aged 15 years and over whether an individual provided regular unpaid personal help for a friend or family member with a long-term illness, health prob-lem or disability (including problems due to old age). Personal help includes help with basic tasks such as feeding or dressing. Receipt of “Carer’s Allowance” was not considered payment for the purposes of this question. "Meals on Wheels” staff were not considered carers for the purpose of this question. The following response categories were given: ♦ Yes, 1-14 hours a week ♦ Yes, 15-28 hours a week ♦ Yes, 29-42 hours a week ♦ Yes, 43 or more hours a week ♦ No.
Health Service personnel Table 5.14
Data are from the Personnel Census of the Department of Health and reflects the position as of 30 June 2011. Management/Administrative includes staff who are of direct service to the public and include Consultant’s Secretaries, Out-Patient Departmental Personnel, Medical Records Personnel, Telephonists and other staff who are engaged in front-line duties together with staff in the fol-lowing categories: Payroll, Human Resource Management (including training), Service Manag-ers, IT Staff, General Management Support and Legislative and Information requirements.
6. Crime
Offence categories Table 6.1
In 2010 the Irish Prison Service recategorised the offence groups under which prisoners’ con-victions are recorded. The Irish Prison Service statistics are now compiled using the Irish Crime Classsification System (ICCS), which is also used by An Garda Siochána, the Courts Service, the Probation Service and the CSO. Full details of the ICCS are available via the CSO website34.
34 See http://www.cso.ie/en/releasesandpublications/crimeandjustice/.

70
Criminal convictions Tables 6.2
The UNECE gender statistics database defines “Persons convicted” as “persons found guilty by any legal body duly authorised to do so under national law, whether the conviction was later upheld or not”. In the case of Ireland the figure given includes persons convicted or against whom the charge was held proved or order made without conviction for headline offences.
The methodology for crime statistics has generally not been harmonised across countries and hence caution should be exercised in interpreting levels of crime across countries and even within the same country over time. The level of reporting and detection of crime may also vary widely across countries. Figures include juvenile convictions and the age cut-off for juvenile definition varies across countries.
Serious assault Table 6.3
The UNECE gender statistics database defines serious assault as “Serious assaults as re-ported by the police, i.e. crimes that are reported to, detected by, or otherwise drawn to the attention of the police”. In the case of Ireland the figure refers to victims of assault causing harm, poisoning and other serious assault offences. Minor assaults are not included.
Sexual assault Table 6.3
The UNECE gender statistics database defines sexual assault as “Sexual assault as reported by the police. Sexual assault comprise rapes, attempted rapes and indecent and sexual as-saults ("offensive behaviour" excluded)”.
Murder/Manslaughter Table 6.4
The Garda classification "Group 01 Homicide offences" includes murder, attempted murder, abortion, procuring or assisting in abortion, murder threats, infanticide and manslaughter. For the purposes of the table presented in this report, only the offences of murder and manslaugh-ter are included.
7. Transport
Means of travel to work Table 7.1
Data are compiled based on responses to the following question from the 1996 and 2006 Cen-suses of Population:
“How do you usually travel to work, school or college?”
There were 11 response categories including a category for persons working mainly at or from home. Only one response was allowed per person.
Data in this table refer to persons aged 15 and over who are at work.
Time taken to travel to work Table 7.2
Data are compiled based on responses to the following question from the 2006 Census of Population:
“What distance is your journey from home to work, school or college and how long does it usu-ally take?”
Time taken to travel to work, school or college was recorded in minutes.
Data in this table refer to persons aged 15 and over who are at work, excluding those who work mainly at or from home.
Driving licences Table 7.6
Data on driving licences are held in the National Vehicle and Driver File of the Department of the Environment, Heritage and Local Government. The data shown reflect the position at 31
December 2010. A small minority of licences are listed on the Departmental dataset as being held by an ‘unknown’ gender. These have been assigned to the male and female totals in pro-portion to the known distribution within each age group.

71
Appendix 2 Eurostat and United Nations data sources
Domain and Indicator Data source
1. Population
1.2
EU: Men per 100 women Eurostat data explorer35 - Population and social conditions theme - Table: Population\Demography\Demography - Na-tional data\Population\Population by sex and age on 1 January of each year
2. Employment
2.1 Ireland and EU: Employment rate Eurostat data explorer – Europe 2020 indicators\Structural indicators\Employment
2.2 Ireland and EU: Female employment rate Eurostat data explorer – Europe 2020 indicators\Structural indicators\Employment
2.3 EU: Employment rate Eurostat data explorer – Europe 2020 indicators\Structural indicators\Employment
2.8 Ireland and EU: Employment by economic sector Eurostat data explorer - Population and social conditions theme - Table: Labour market (including Labour Force Sur-vey)\Employment and unemployment\LFS series detailed annual survey results\Employment - LFS series\ Employ-ment by sex, age groups and economic activity from 2008, NACE rev.2
2.15 Ireland and EU: Unemployment rates Eurostat data explorer - Population and social conditions theme - Table: Labour market (including Labour Force Sur-vey)\Employment and unemployment\LFS series – detailed annual survey results\Total unemployment - LFS se-ries\Unemployment rates by sex, age group and nationality CSO, Quarterly National Household Survey
2.16 EU: Unemployment rates Eurostat data explorer - Population and social conditions theme - Table: Labour market (including Labour Force Sur-vey)\Employment and unemployment\LFS series – detailed annual survey results\Total unemployment - LFS se-ries\Unemployment rates by sex, age group and nationality
2.17 EU: Male unemployment rates map Eurostat data explorer - Population and social conditions theme - Table: Labour market (including Labour Force Sur-vey)\Employment and unemployment\LFS series – detailed annual survey results\Total unemployment - LFS se-ries\Unemployment rates by sex, age group and nationality
2.18 EU: Female unemployment rates map Eurostat data explorer - Population and social conditions theme - Table: Labour market (including Labour Force Sur-vey)\Employment and unemployment\LFS series – detailed annual survey results\Total unemployment - LFS se-ries\Unemployment rates by sex, age group and nationality
3. Social cohesion and lifestyles
3.4 EU: Gender pay gap Eurostat data explorer- Europe 2020 indicators\Structural indicators\Employment
35 http://epp.eurostat.ec.europa.eu/portal/page/portal/statistics/themes

72
Domain and Indicator Data source
3.5 EU: At risk of poverty rates Eurostat data explorer - Population and social conditions theme – Table: Income, social inclusion and living condi-tions\Income distribution and monetary poverty\Monetary poverty\At risk of poverty rates before social transfers (pen-sions included in social transfers) (cut off point: 60% of median equivalised income after social transfers) Eurostat data explorer - Population and social conditions theme – Table: Income, social inclusion and living condi-tions\Income distribution and monetary poverty\Monetary poverty\At risk of poverty rates by age and gender (cut off point: 60% of median equivalised income after social transfers)
3.8 EU: Early school leavers Eurostat data explorer – Europe 2020 indicators\Structural indicators\Social Cohesion
3.13 EU: Age of women at birth of first child and total fertility rate Eurostat data explorer - Population and social conditions theme - Table: Population\Demography\Demography - Na-tional data\Fertility\Fertility indicators (for total fertility rate) UNECE Gender Statistics Database http//w3.unece.org \Gender Statistics\Fertility, Families and Households (for age of women at birth of first child)
3.14 EU: Representation in national parliaments Inter-Parliamentary Union http://www.ipu.org
4. Education
4.6 Ireland: Classroom teachers Eurostat data explorer - Population and social conditions theme - Table: Education and training\Education\ Enrol-ments, graduates, entrants, personnel and language learning – absolute numbers\Teachers (ISCED 0-4)
4.7 EU: Classroom teachers and academic staff Eurostat data explorer - Population and social conditions theme - Table: Education and training\Education\ Enrol-ments, graduates, entrants, personnel and language learning – absolute numbers\Teachers (ISCED 0-4) and aca-demic staff (ISCED 5-6)
4.8 EU: School management personnel Eurostat data explorer - Population and social conditions theme - Table: Education and training\Education\ Education indicators – non-finance\Teaching staff
5. Health
5.2 EU: Life expectancy at birth Eurostat data explorer - Population and social conditions theme - Table: Population\Demography\Demography - Na-tional data\Main demographic indicators
6. Crime
6.2 EU: Criminal convictions UNECE Gender Statistics Database http://w3.unece.org \Gender Statistics\Crime and Violence
6.3 EU: Victims of selected crimes UNECE Gender Statistics Database http://w3.unece.org \Gender Statistics\Crime and Violence