Wolters Kluwer 2017 Full-Year Results · Wolters Kluwer 2017 Full-Year Results ... forward-looking...
43
2017 Full-Year Results 1 Wolters Kluwer 2017 Full-Year Results Nancy McKinstry – CEO Kevin Entricken – CFO February 21, 2018
Transcript of Wolters Kluwer 2017 Full-Year Results · Wolters Kluwer 2017 Full-Year Results ... forward-looking...

2017 Full-Year Results 1
Wolters Kluwer2017 Full-Year ResultsNancy McKinstry – CEOKevin Entricken – CFO
February 21, 2018

2017 Full-Year Results 2
This presentation contains forward-looking statements. These statements may be identified by words such as "expect", "should", "could", "shall", and similar expressions. Wolters Kluwer cautions that such forward-looking statements are qualified by certain risks and uncertainties that could cause actual results and events to differ materially from what is contemplated by the forward-looking statements. Factors which could cause actual results to differ from these forward-looking statements may include, without limitation, general economic conditions, conditions in the markets in which Wolters Kluwer is engaged, behavior of customers, suppliers and competitors, technological developments, the implementation and execution of new ICT systems or outsourcing, legal, tax, and regulatory rules affecting Wolters Kluwer's businesses, as well as risks related to mergers, acquisitions and divestments. In addition, financial risks, such as currency movements, interest rate fluctuations, liquidity and credit risks could influence future results. The foregoing list of factors should not be construed as exhaustive. Wolters Kluwer disclaims any intention or obligation to publicly update or revise any forward-looking statements, whether as a result of new information, future events or otherwise.
Growth rates are cited in constant currencies unless otherwise noted.
Forward-looking Statements

2017 Full-Year Results 3
Introduction
Financial Review
Strategic and Operating Review
Outlook 2018
Appendix: IFRS 15 and 2017 Supplement
Agenda

2017 Full-Year Results 4
IntroductionSolid 3% organic growth; improved profitability and cash flow
Organic growth of +3%
– Digital & services revenues up +5% organically
– Recurring revenues up +4% organically
Further improvement in profitability and cash flow
– Adjusted operating profit up +8% organically
– Adjusted free cash flow up +7% in constant currencies
– Diluted adjusted EPS up +13% in constant currencies
Increased returns to shareholders
– Proposing dividend increase of +8%
Outlook 2018
– Expect 10%-15% growth in adjusted EPS in constant currencies
– Continued focus on our strategic priorities

2017 Full-Year Results 5
Strategic progressOptimizing portfolio, delivering innovation, and driving efficiencies
DeliverExpert Solutions
DriveEfficiencies & Engagement
▪ Invested in key global products
▪ Acquired Tagetik, extending into attractive, global adjacency
▪ Completed four disposals; announced sale of ProVation
▪ Rolled out new and enhanced products, including several leveraging artificial intelligence and other advanced technologies
▪ Continued investment in next generation platforms (e.g. SaaS)
▪ Maintained product development spend at 8-10% of revenues
▪ Drove efficiencies in front and back office functions
▪ Realized further scale economies from standardizing technologies
▪ Made progress on integrating recent acquisitions
ExpandMarket Coverage

2017 Full-Year Results 6
Introduction
Financial Review
Strategic and Operating Review
Outlook 2018
Appendix: IFRS 15 and 2017 Supplement
Agenda

2017 Full-Year Results 7
Full-year 2017 resultsRevenues up +3% organically; increased margins and free cash flow
∆: % Change; ∆ CC: % Change constant currencies (€/$ 1.11); ∆ OG: % Organic growth. *2016 restated to treat customer credits for ‘bank product’ services as a deduction to revenues and not as a cost of sales.
(€ million, unless otherwise stated) FY 2017 FY 2016* ∆ ∆ CC ∆ OG
Revenues 4,422 4,286 +3% +5% +3%
Adjusted operating profit 1,009 950 +6% +8% +8%
Adjusted operating profit margin 22.8% 22.2%
Diluted adjusted EPS €2.32 €2.10 +11% +13%
Adjusted free cash flow 746 708 +5% +7%
Net-debt-to-EBITDA ratio 1.7x 1.7x
Return on Invested Capital 10.2% 9.8%
2017 Full-Year Results 8
(€ million) FY 2017 FY 2016* ∆ ∆ CC ∆ OG
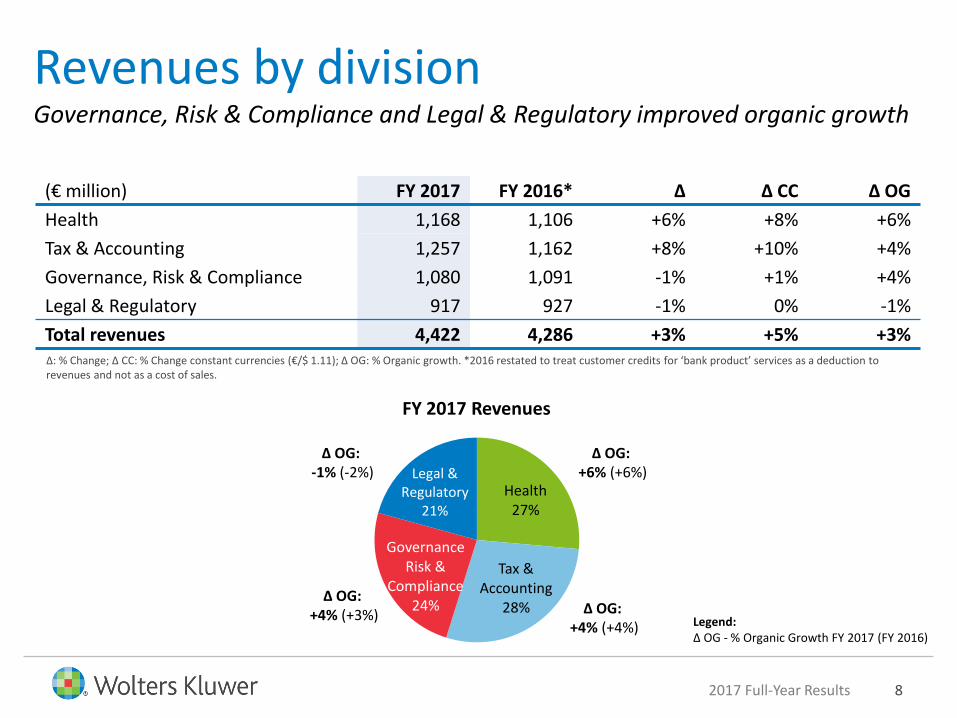
Health 1,168 1,106 +6% +8% +6%
Tax & Accounting 1,257 1,162 +8% +10% +4%
Governance, Risk & Compliance 1,080 1,091 -1% +1% +4%
Legal & Regulatory 917 927 -1% 0% -1%
Total revenues 4,422 4,286 +3% +5% +3%∆: % Change; ∆ CC: % Change constant currencies (€/$ 1.11); ∆ OG: % Organic growth. *2016 restated to treat customer credits for ‘bank product’ services as a deduction to revenues and not as a cost of sales.
Revenues by divisionGovernance, Risk & Compliance and Legal & Regulatory improved organic growth
Legend:∆ OG - % Organic Growth FY 2017 (FY 2016)
FY 2017 Revenues
Health27%
Tax & Accounting
28%
GovernanceRisk &
Compliance24%
Legal & Regulatory
21%
∆ OG: +6% (+6%)
∆ OG: +4% (+3%)
∆ OG: -1% (-2%)
∆ OG: +4% (+4%)

2017 Full-Year Results 9
Revenues by regionAll three geographic regions delivered positive organic growth
(€ million) FY 2017 FY 2016* ∆ ∆ CC ∆ OG
North America 2,710 2,635 +3% +5% +4%
Europe 1,368 1,320 +4% +4% +2%
AsiaPac & ROW 344 331 +4% +6% +6%
Total revenues 4,422 4,286 +3% +5% +3%∆: % Change; ∆ CC: % Change constant currencies (€/$ 1.11); ∆ OG: % Organic growth. *2016 restated to treat customer credits for ‘bank product’ services as a deduction to revenues and not as a cost of sales.
FY 2017 Revenues by geographic market
North America
61%
Europe31%
AsiaPac& ROW
8%
FY 2017 Revenues
∆ OG: +4% (+4%)
∆ OG: +2% (+1%)
∆ OG: +6% (+3%)
Legend:∆ OG - % Organic Growth FY 2017 (FY 2016)

2017 Full-Year Results 10
(€ million) FY 2017 FY 2016* ∆ ∆ CC ∆ OGDigital and services subscriptions 2,814 2,687 +5% +6% +5%Print subscriptions 234 269 -13% -12% -10%Other recurring 310 333 -7% -5% +8%Recurring revenues 3,358 3,289 +2% +3% +4%Print books 254 270 -6% -3% -3% LS transactional 239 224 +6% +8% +8%FS transactional 107 124 -14% -13% 0%Other non-recurring 464 379 +23% +25% +2%Total revenues 4,422 4,286 +3% +5% +3%
FY 2017 Revenues
∆: % Change; ∆ CC: % Change constant currencies (€/$ 1.11); ∆ OG: % Organic growth. *2016 restated to treat customer credits for ‘bank product’ services as a deduction to revenues and not as a cost of sales. ProVation software license fees reclassified from other recurring to other non-recurring in 2017. Other non-recurring revenues includes license & implementation fees.
Revenues by typeRecurring revenues sustained +4% organic growth; 76% of total revenues
Print books
LS transactional
FS transactional
Other non-recurring
∆ OG: -3% (-9%)
∆ OG: +8% (+3%)
∆ OG: 0% (+12%)
∆ OG: +2% (-4%)
Legend:∆ OG - % Organic Growth FY 2017 (FY 2016)
Recurring76%
∆ OG: +4% (+4%)
LS: Legal ServicesFS: Financial Services
2017 Full-Year Results 11
(€ million) FY 2017 FY 2016* ∆ ∆ CC ∆ OGMargin
FY 2017Margin
FY 2016*
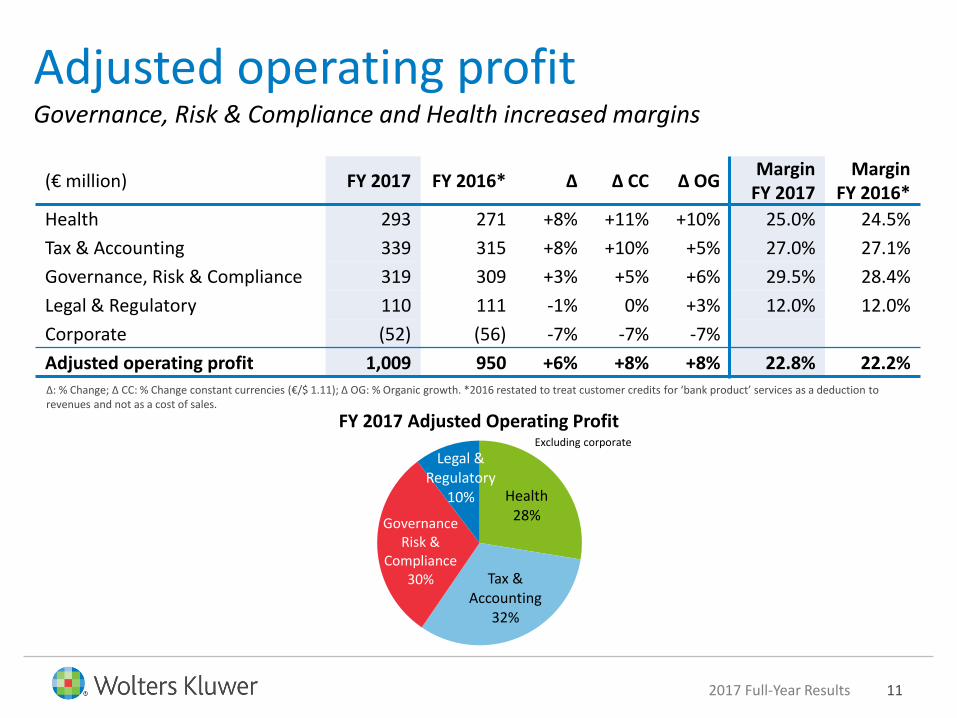
Health 293 271 +8% +11% +10% 25.0% 24.5%
Tax & Accounting 339 315 +8% +10% +5% 27.0% 27.1%
Governance, Risk & Compliance 319 309 +3% +5% +6% 29.5% 28.4%
Legal & Regulatory 110 111 -1% 0% +3% 12.0% 12.0%
Corporate (52) (56) -7% -7% -7%
Adjusted operating profit 1,009 950 +6% +8% +8% 22.8% 22.2%
FY 2017 Adjusted Operating Profit
Adjusted operating profitGovernance, Risk & Compliance and Health increased margins
∆: % Change; ∆ CC: % Change constant currencies (€/$ 1.11); ∆ OG: % Organic growth. *2016 restated to treat customer credits for ‘bank product’ services as a deduction to revenues and not as a cost of sales.
Legal & Regulatory
10%
Tax & Accounting
32%
Health28%
GovernanceRisk &
Compliance30%
Excluding corporate
2017 Full-Year Results 12
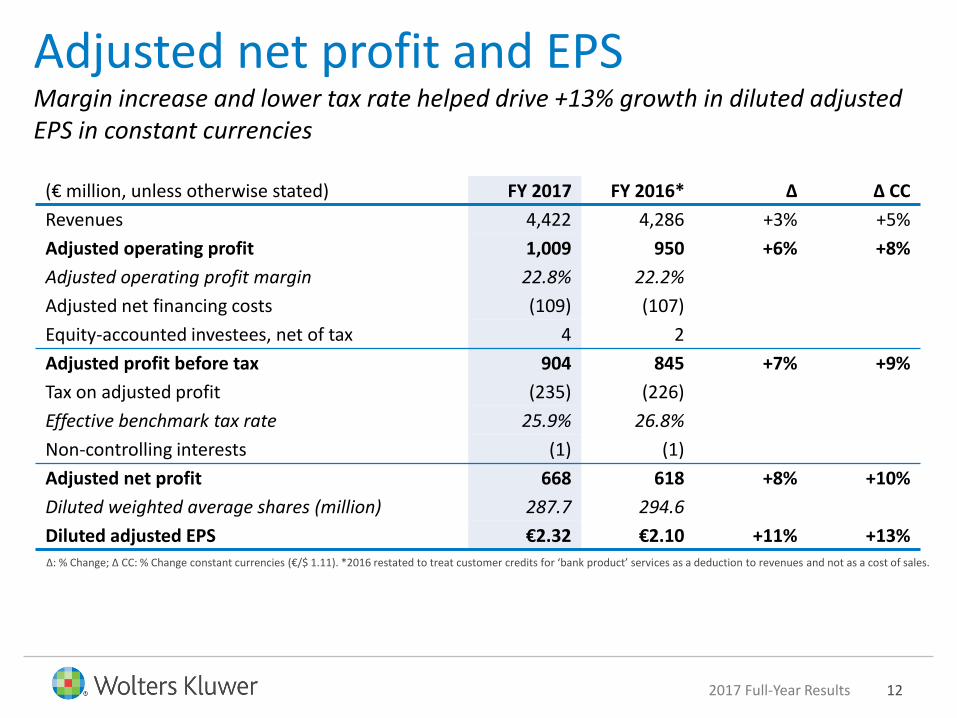
(€ million, unless otherwise stated) FY 2017 FY 2016* ∆ ∆ CC
Revenues 4,422 4,286 +3% +5%
Adjusted operating profit 1,009 950 +6% +8%
Adjusted operating profit margin 22.8% 22.2%
Adjusted net financing costs (109) (107)
Equity-accounted investees, net of tax 4 2
Adjusted profit before tax 904 845 +7% +9%
Tax on adjusted profit (235) (226)
Effective benchmark tax rate 25.9% 26.8%
Non-controlling interests (1) (1)
Adjusted net profit 668 618 +8% +10%
Diluted weighted average shares (million) 287.7 294.6
Diluted adjusted EPS €2.32 €2.10 +11% +13%∆: % Change; ∆ CC: % Change constant currencies (€/$ 1.11). *2016 restated to treat customer credits for ‘bank product’ services as a deduction to revenues and not as a cost of sales.
Adjusted net profit and EPSMargin increase and lower tax rate helped drive +13% growth in diluted adjusted EPS in constant currencies

2017 Full-Year Results 13
IFRS profit and diluted EPSReported diluted EPS includes disposal gain and one-time, non-cash revaluation of deferred tax position
(€ million, unless otherwise stated) FY 2017 FY 2016 ∆
Adjusted operating profit 1,009 950 +6%
Amortization of acquired intangibles (187) (181)
Results on divestments of operations 60 4
Acquisition-related costs and other non-benchmark items1) (13) (7)
Operating profit 869 766 +13%
Financing results2) (108) (113)
Share of profit of equity-accounted investees, net of tax 4 2
Profit before tax 765 655 +17%
Income tax expense (94) (165)
Effective tax rate 12.3% 25.2%
Profit for the period 671 490 +37%
Non-controlling interests (1) (1)
Profit for the period to the owners of the Company 670 489 +37%
Diluted EPS €2.33 €1.66 +40%∆: % Change. 1) Non-benchmark items include results on disposals, acquisition-related costs including integration provisions, changes in fair value of contingent considerations and material changes in tax laws and rates. 2) Reported financing results include the financing component of employee benefits (2017: €5 million; 2016: €6 million) and a €6 million capital gain on the sale of our 50% interest in Ipsoa Francis Lefebvre.

2017 Full-Year Results 14
Adjusted free cash flowIncreased FCF despite lower cash conversion and higher tax payments
(€ million, unless otherwise stated) FY 2017 FY 2016 ∆ ∆ CC
Adjusted operating profit 1,009 950 +6% +8%
Depreciation and amortization of other intangibles 209 179
Adjusted EBITDA 1,218 1,129 +8% +10%
Capital expenditure (210) (224)
Autonomous movements in working capital (34) 43
Adjusted operating cash flow 974 948 +3% +5%
Cash conversion ratio 97% 100%
Paid financing costs (87) (100)
Paid corporate income tax (156) (108)
Net change in restructuring provision1) (6) (10)
Additional pension payments2) (6) (25)
Other3) 27 3
Adjusted free cash flow 746 708 +5% +7%∆: % Change; ∆ CC: % Change constant currencies (€/$ 1.11). 1) Adjusted free cash flow excludes additions to provisions for acquisition integration and restructuring of stranded cost following divestment. 2) Additional pension payments are voluntary; mainly €22 million cash injection into North American pension fund in 2016. 3) ‘Other’ includes share-based payments (2017: €23 million; 2016: €18 million), dividends received (2017: €1 million; 2016: €2 million), and adjustments for the net tax benefit on previously divested assets and consolidation of platform technology (2017: €(4) million; 2016: €(11) million), income tax on internal restructuring (2017: €5 million; 2016: nil) and other smaller items.

2017 Full-Year Results 15
Movement in net debtReturned over 70% of adjusted free cash flow to shareholders
(€ million, unless otherwise stated) FY 2017 FY 2016
Net debt at January 1 (1,927) (1,788)
Adjusted free cash flow 746 708
Dividends paid (232) (223)
Acquisition spending, net of cash acquired, including costs1) (316) (461)
Divestiture cash proceeds, net of cash disposed, including costs2) 83 11
Share repurchases (302) (198)
Other3) (121) 24
Movement in net debt (142) (139)
Net debt at December 31 (2,069) (1,927)
Net-debt-to-EBITDA ratio 1.7x 1.7x1) Includes acquisition spending, net of cash acquired (2017: €(313) million) and acquisition related costs (2017: €(3) million).2) Includes receipts from divestments, net of cash disposed (2017: €94 million) and paid divestment expenses (2017: €(11) million).3) ‘Other’ includes FX differences in cash and cash equivalents (2017: €(109) million), changes in the fair value of derivatives, and other smaller items.

2017 Full-Year Results 16
DividendProposing full-year total dividend of €0.85 per share, up +8%
1) Dividend declared for the year indicated.
Dividend per Share (€)1)
0.550.58
0.64 0.65 0.66 0.67 0.68 0.69 0.70 0.71
0.18 0.19 0.20
0.750.79
0.85
2005 2006 2007 2008 2009 2010 2011 2012 2013 2014 2015 2016 2017
Interim dividend
Proposed final
dividend€0.65
2018 interim dividend to be set at 40% of prior year total dividend (previously 25%)

2017 Full-Year Results 17
Share Buybacks (€ million)as of February 19, 2018
20 25
140200
300
50
350
2013 2014 2015 2016 2017 2018
Intended
Completed
Share Buyback Program 2016-2018
In 2017, we repurchased 7.8 million ordinary shares for a total consideration of €300 million
For 2018, we currently intend to repurchase up to €400 million in shares, including proceeds from Corsearch and Swedish disposals— Of this, €50 million already completed
Pending completion, proceeds from ProVation disposal (€150 million) to be used for additional repurchases in 2018-2019
Share buybacksIntend to repurchase up to €400 million in shares in 2018

2017 Full-Year Results 18
Organic growth +3%
Adjusted operating margin up +60 basis points to 22.8%
Diluted adjusted EPS up +13% in constant currencies
Adjusted free cash flow of €746 million, up +7% in constant currencies
Net-debt-to-EBITDA ratio at 1.7x
Proposing full-year total dividend of €0.85 per share, up +8%
Share buyback: intend to buy back up to €400 million in shares in 2018
Summary

2017 Full-Year Results 19
Introduction
Financial Review
Strategic and Operating Review
Outlook 2018
Appendix: IFRS 15 and 2017 Supplement
Agenda

2017 Full-Year Results 20
North America
74%
Europe10%
AsiaPac& ROW
16%
HealthOrganic growth +6%; margin improved due to efficiency savings and mix shift
€ million FY 2017 FY 2016 Δ Δ CC Δ OG
Revenues 1,168 1,106 +6% +8% +6%
Adjusted operating profit
293 271 +8% +11% +10%
Margin 25.0% 24.5%∆: % Change; ∆ CC: % Change constant currencies (€/$ 1.11); ∆ OG: % Organic growth.
Clinical Solutions Organic growth +10% UpToDate delivered double-digit organic
growth Drug information and Emmi (pro forma)
delivered high single-digit growth Clinical software group improved
performance
Health Learning, Research & Practice Organic growth +1%, including digital +5% Nursing solutions delivered strong growth Print journals, books and advertising
declined Learner’s Digest saw positive growth
Revenues by Geographic MarketRevenues by Segment
Clinical Solutions
51%
HealthLearning,
Research & Practice
49%
2017 Full-Year Results 21
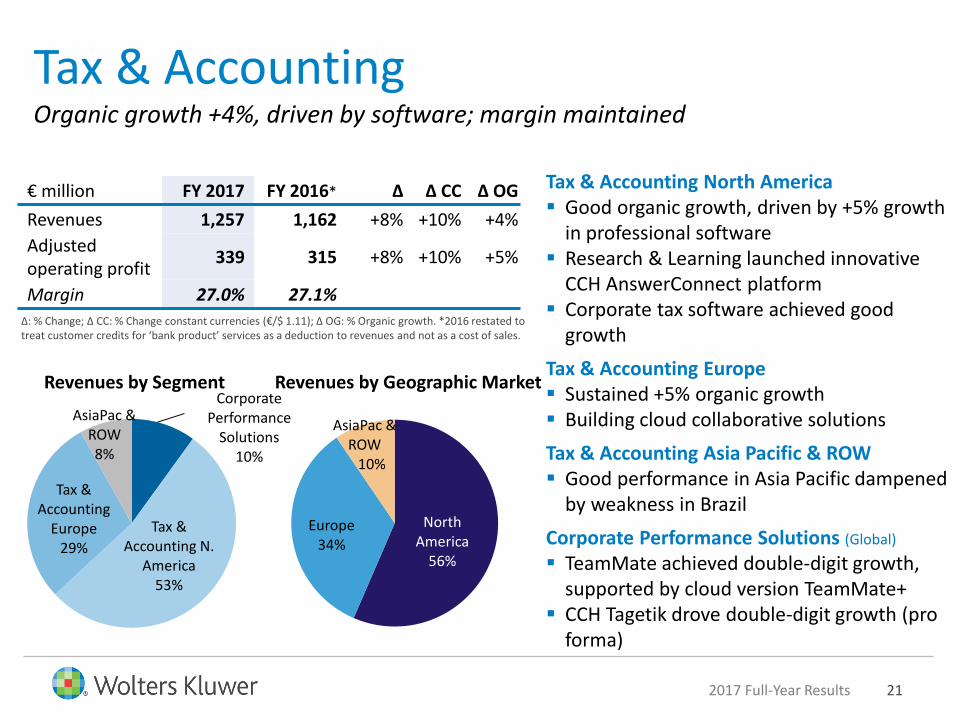
€ million FY 2017 FY 2016* Δ Δ CC Δ OG
Revenues 1,257 1,162 +8% +10% +4%
Adjusted operating profit
339 315 +8% +10% +5%
Margin 27.0% 27.1%∆: % Change; ∆ CC: % Change constant currencies (€/$ 1.11); ∆ OG: % Organic growth. *2016 restated to treat customer credits for ‘bank product’ services as a deduction to revenues and not as a cost of sales.
Revenues by Segment Revenues by Geographic Market
Tax & Accounting North America Good organic growth, driven by +5% growth
in professional software Research & Learning launched innovative
CCH AnswerConnect platform Corporate tax software achieved good
growth
Tax & Accounting Europe Sustained +5% organic growth Building cloud collaborative solutions
Tax & Accounting Asia Pacific & ROW Good performance in Asia Pacific dampened
by weakness in Brazil
Corporate Performance Solutions (Global)
TeamMate achieved double-digit growth, supported by cloud version TeamMate+
CCH Tagetik drove double-digit growth (pro forma)
Tax & AccountingOrganic growth +4%, driven by software; margin maintained
Corporate Performance
Solutions10%
Tax & Accounting N.
America53%
Tax & Accounting
Europe29%
AsiaPac & ROW8%
North America
56%
Europe34%
AsiaPac & ROW
10%

2017 Full-Year Results 22
North America
85%
Europe12%
AsiaPac & ROW3%
Governance, Risk & ComplianceOrganic growth improved to +4%; margin up 110 basis points driven by efficiency initiatives
€ million FY 2017 FY 2016 Δ Δ CC Δ OG
Revenues 1,080 1,091 -1% +1% +4%
Adjusted operating profit
319 309 +3% +5% +6%
Margin 29.5% 28.4%
∆: % Change; ∆ CC: % Change constant currencies (€/$ 1.11); ∆ OG: % Organic growth.
Revenues by Segment Revenues by Geographic Market
Legal Services Organic growth up +4% (2016: +3%) CT drove 4% organic growth, supported by
sustained momentum in transactions ELM delivered good organic growth, driven
by transaction volumes and improved license sales
Financial Services Organic growth +3% (2016: +2%) Finance, Risk & Reporting grew +10%
organically, driven by software license sales Lien Solutions sustained robust single-digit
growth, despite slowdown in lending markets
Compliance Solutions impacted by market-wide decline in mortgage volumes, but drove growth in recurring revenues
Legal Services
56%
Financial Services
42%
Transport Services
2%
2017 Full-Year Results 23
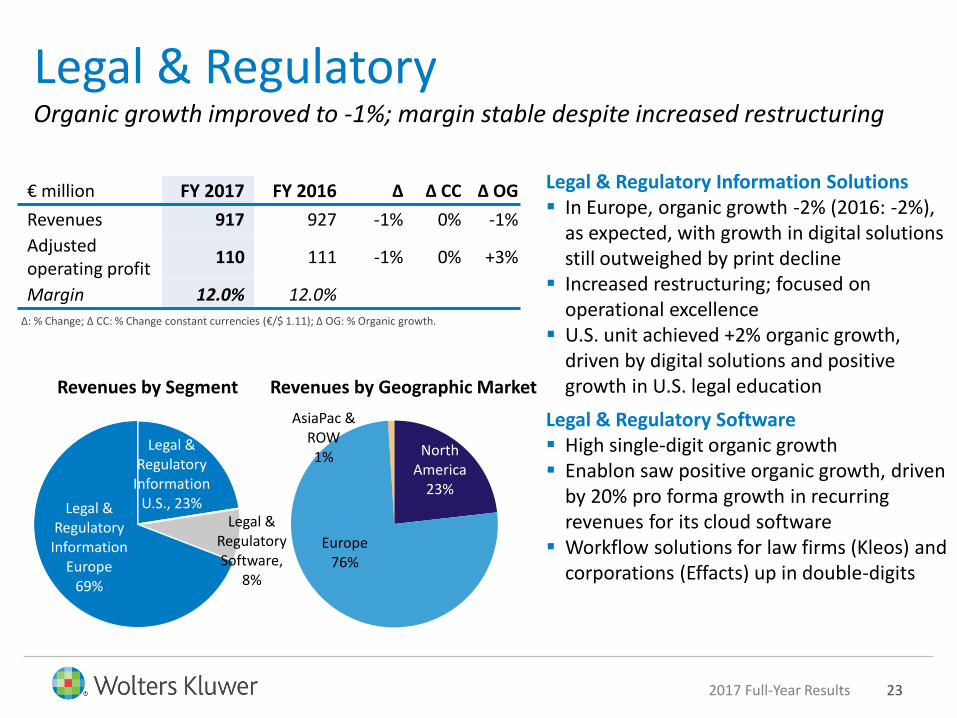
€ million FY 2017 FY 2016 Δ Δ CC Δ OG
Revenues 917 927 -1% 0% -1%
Adjusted operating profit
110 111 -1% 0% +3%
Margin 12.0% 12.0%
Legal & RegulatoryOrganic growth improved to -1%; margin stable despite increased restructuring
Revenues by Segment
∆: % Change; ∆ CC: % Change constant currencies (€/$ 1.11); ∆ OG: % Organic growth.
Revenues by Geographic Market
Legal & Regulatory Information Solutions In Europe, organic growth -2% (2016: -2%),
as expected, with growth in digital solutions still outweighed by print decline
Increased restructuring; focused on operational excellence
U.S. unit achieved +2% organic growth, driven by digital solutions and positive growth in U.S. legal education
Legal & Regulatory Software High single-digit organic growth Enablon saw positive organic growth, driven
by 20% pro forma growth in recurring revenues for its cloud software
Workflow solutions for law firms (Kleos) and corporations (Effacts) up in double-digits
Legal & Regulatory
Information U.S., 23%
Legal & Regulatory Software,
8%
Legal & Regulatory
Information Europe
69%
North America
23%
Europe76%
AsiaPac & ROW1%

2017 Full-Year Results 24
Expand market coverageExpanding our global products and reshaping our portfolio
Invested in global products
— Health: invested to grow UpToDate and drug information outside the U.S.
— Tax & Accounting: launched TeamMate+; extended CCH iKnow and CCH iFirm into new geographies
— GRC: invested to enhance core features of OneSumX
— Legal & Regulatory: extended Kleos into Germany; added mobility features to Enablon
Entered attractive global adjacency with acquisition of Tagetik
— Combined Tagetik with TeamMate to form Corporate Performance Solutions, serving the Office of the CFO
Completed or agreed non-core disposals
— 2017: Sold Transport Services and certain U.K. assets
— 2018: Sold Corsearch and certain Swedish assets
— 2018: Announced sale of ProVation

2017 Full-Year Results 25
Deliver expert solutionsTwo leading expert solutions that drove double-digit organic growth in 2017
Governance, Risk & Compliance
OneSumXFinance, Risk & Reporting
Tax & Accounting
CCH Axcess
First integrated cloud solution for professional tax and accounting firms in U.S., launched in 2013
Flexible, modular architecture based on common database
Regularly updated with changes in tax code and enhanced with additional features and technology
In 2017, added CCH My1040Data leveraging AI for data transfer and expanded the open integration platform
Recurring revenue model; existing and new customers helped drive double-digit organic growth in 2017
Leading global solution for integrated risk- and finance-enabled regulatory reporting
Helps financial institutions comply with complex and data-driven regulatory regimes
Supporting 92% of the world’s top 50 banks
Continuously updated for changing regulations
Ongoing investment in content and technology
License/maintenance revenue model; new and expanded software license contracts drove 10% organic growth in 2017

2017 Full-Year Results 26
Drive efficienciesDriving front and back office savings; increasing technology standardization
$ Driving operational excellence in front and back office
— Launched collaborative sales programs, digital marketing tools and teams— Drove further savings from data center consolidation/migration to the cloud
and real estate consolidation— Achieved economies of scale by consolidating large vendor contracts
Standardizing technology planning and processes— Standardized digital product development process using agile technology and
deep customer focus— Advanced our use of standard technologies, saving on development and
maintenance— Drove the adoption of advanced technologies, including artificial intelligence
technologies across the divisions
Extracting integration benefits from acquisitions— Set stage to drive revenue and cost synergies from integrating recent
acquisitions

2017 Full-Year Results 27
Introduction
Financial Review
Strategic and Operating Review
Outlook 2018
Appendix: IFRS 15 and 2017 Supplement
Agenda

2017 Full-Year Results 28
Legal & Regulatory
Expect good organic growth Expect improved margins for the full year
Tax & Accounting Expect improved organic growth and a stable margin for the full year First half margin is expected to decline, due to timing of investments
Health Expect good organic growth, similar to prior year levels, and a stable
margin for the full year First half margin is expected to decline due to timing of investments
Governance, Risk & Compliance
Expect underlying revenue to be broadly flat in 2018 Expect full-year margin to be in line with 2017
Divisional Outlook 2018Reflects IFRS 15

2017 Full-Year Results 29
Performance indicators 2018 Guidance 2017 (Under IFRS 15)
Adjusted operating profit margin 22.5% - 23.0% 22.2%
Adjusted free cash flow €725 - €750 million €746 million
Return on invested capital 10.0% - 10.5% 9.8%
Diluted adjusted EPS 10% - 15% growth €2.22
Guidance for adjusted free cash flow and diluted adjusted EPS is in constant currencies (€/$ 1.13). Guidance for EPS growth assumes share repurchases for up to €400 million in 2018. Adjusted operating profit margin and ROIC are in reported currencies and assume an average EUR/USD rate around €/$ 1.20.
Additional guidance:
Expect adjusted net financing costs of approximately €70 million, excluding the impact of exchange rate movements.
Expect the benchmark effective tax rate to be approximately 26%.
Expect cash conversion of approximately 100% and capital expenditure in the range of 5%-6% of total revenue.
Guidance 2018Reflects IFRS 15

2017 Full-Year Results 30
Q&A

2017 Full-Year Results 31
Appendix: IFRS 15

2017 Full-Year Results 32
IFRS 15New accounting standard effective January 1, 2018
IFRS 15: Revenue from Contracts with Customers
– IFRS 15 became effective January 1, 2018, replacing standards IAS 18 and IAS 11
– IFRS 15 defines transactions based on performance obligations satisfied over time or at a point in time and requires revenue (and cost to obtain the contract) to be recognized when control of a good or service is transferred to a customer
For Wolters Kluwer, the main types of contracted revenues and costs that will be recognized differently are:
– Certain license/maintenance software business models
– Allocation of discounts to performance obligations
– Bundling of performance obligations
– Cost to obtain contracts transitioning to IFRS 15 will be capitalized (sales commissions)
Wolters Kluwer will adopt IFRS 15 using the retrospective method with the use of certain practical expedients
– Only contracts open on January 1, 2017 and later will be transitioned to IFRS 15
– As a result, organic growth rates under IFRS 15 in 2018 and beyond will not be comparable to organic growth rates reported in the past

2017 Full-Year Results 33
IFRS 15IFRS 15 has minimal impact on the group’s revenue and profits and has no impact on cash flow
When IFRS 15 is applied to 2017:
– Revenue is 1% lower
– Adjusted profits and diluted adjusted EPS are 4% lower
– Adjusted operating margin is reduced to 22.2%
IFRS 15 does not change adjusted free cash flow
– Cash conversion ratio increases to 100%
IFRS 15 impacts balance sheet:
– Contract assets and liabilities
– Deferred tax positions
– Minimal impact on net debt/EBITDA
IFRS 15 mainly affects GRC and Tax & Accounting revenues, operating profits and margin
– GRC: software license fees (Enterprise Legal Management and Finance Risk & Reporting)
– Tax & Accounting: bundled transactional fees (U.S. software) and multi-year contracts in Europe

2017 Full-Year Results 34
(€ million, unless otherwise stated)FY 2017
ReportedIFRS 15
RestatementFY 2017
Restated
Revenues 4,422 (52) 4,370
Adjusted operating expenses (3,413) 13 (3,400)
Adjusted operating profit 1,009 (39) 970
Adjusted operating profit margin 22.8% 22.2%
Adjusted net financing costs (109) - (109)
Equity-accounted investees, net of tax 4 - 4
Adjusted profit before tax 904 (39) 865
Tax on adjusted profit (235) 10 (225)
Effective benchmark tax rate 25.9% 25.9%
Non-controlling interests (1) - (1)
Adjusted net profit 668 (29) 639
Diluted weighted average shares (million) 287.7 287.7
Diluted adjusted EPS €2.32 (€0.10) €2.22
Adjusted income statement IFRS 15 would reduce 2017 revenue by 1% and adjusted operating profit and EPS by 4%

2017 Full-Year Results 35
Adjusted free cash flow IFRS 15 would increase the cash conversion ratio to 100%, but would not change adjusted free cash flow
(€ million, unless otherwise stated)FY 2017
ReportedIFRS 15
RestatementFY 2017
Restated
Adjusted operating profit 1,009 (39) 970
Depreciation and amortization of other intangibles 209 - 209
Adjusted EBITDA 1,218 (39) 1,179
Capital expenditure (210) - (210)
Autonomous movements in working capital (34) 39 5
Adjusted operating cash flow 974 - 974
Cash conversion ratio 97% 100%
Paid financing costs (87) - (87)
Paid corporate income tax (156) - (156)
Net change in restructuring provision (6) - (6)
Additional pension contributions (2) - (2)
Other 23 - 23
Adjusted free cash flow 746 - 746

2017 Full-Year Results 36
(€ million, unless otherwise stated)FY 2017
ReportedSoftwareLicenses
Other Revenues
Total Revenue Restatement
Total Cost Restatement
FY 2017 Restated
Health 1,168 - (2) (2) - 1,166
Tax & Accounting 1,257 (10) (13) (23) - 1,234
Governance, Risk & Compliance 1,080 (26) - (26) - 1,054
Legal & Regulatory 917 - (1) (1) - 916
Total revenues 4,422 (36) (16) (52) - 4,370
Health 293 (2) 6 297
Tax & Accounting 339 (23) 4 320
Governance, Risk & Compliance 319 (26) 2 295
Legal & Regulatory 110 (1) 1 110
Corporate (52) - - (52)
Adjusted operating profit 1,009 (52) 13 970
Health 25.0% 25.5%
Tax & Accounting 27.0% 25.9%
Governance, Risk & Compliance 29.5% 28.0%
Legal & Regulatory 12.0% 12.0%
Adjusted operating profit margin 22.8% 22.2%
Details by divisionIFRS 15 would mainly affect Governance, Risk & Compliance and Tax & Accounting revenues, adjusted operating profit and margin

2017 Full-Year Results 37
Appendix: 2017 Supplement
2017 Full-Year Results 38
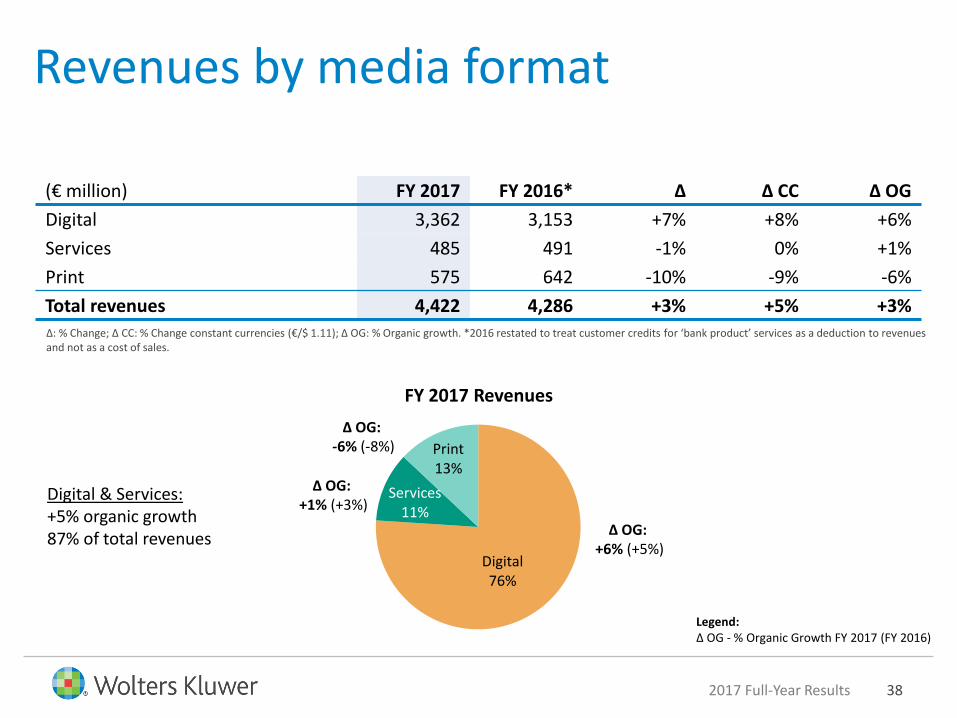
Digital76%
Services 11%
Print 13%
(€ million) FY 2017 FY 2016* ∆ ∆ CC ∆ OG
Digital 3,362 3,153 +7% +8% +6%
Services 485 491 -1% 0% +1%
Print 575 642 -10% -9% -6%
Total revenues 4,422 4,286 +3% +5% +3%
FY 2017 Revenues
∆: % Change; ∆ CC: % Change constant currencies (€/$ 1.11); ∆ OG: % Organic growth. *2016 restated to treat customer credits for ‘bank product’ services as a deduction to revenues and not as a cost of sales.
∆ OG: +6% (+5%)
∆ OG: -6% (-8%)
∆ OG: +1% (+3%)
Legend:∆ OG - % Organic Growth FY 2017 (FY 2016)
Digital & Services: +5% organic growth87% of total revenues
Revenues by media format

2017 Full-Year Results 39
Recurring82%
Print books9%
Other non-recurring
9%
Digital83%
Services1%
Print16%
Revenues by media format and type
Digital:Tax &
Accounting software
74%
Digitalcontent
17%
Services4%
Print5%
Tax & Accounting
Recurring87%
Print books3%
Other non-recurring
10%
HealthGovernance, Risk &
ComplianceLegal & Regulatory
Digital65%
Services34%
Print1%
Recurring57%LS
transactional22%
FS transactional
10%
Other non-recurring
11%
Digital60%Services
7%
Print33%
Recurring75%
Print books13%
Other non-recurring
12%
FY 2017 Revenues

2017 Full-Year Results 40
Reconciliation: Adjusted net financingcosts to financing results
(€ million) FY 2017 FY 2016
Adjusted net financing costs (109) (107)
Employee benefits financing component (5) (6)
Divestment related results on equity-accounted investees 6 0
Financing results (108) (113)

2017 Full-Year Results 41
(€ million, unless otherwise stated) Dec. 31, 2017 Dec. 31, 2016*
Goodwill and intangible assets 5,581 6,113
Equity-accounted investees and financial assets 27 40
Other non-current assets 194 235
Non-current assets 5,802 6,388
Cash and cash equivalents 1,020 940
Other current assets 1,664 1,511
Deferred income (1,412) (1,555)
Short-term borrowings and bank overdrafts (1,038) (556)
Other current liabilities (1,068) (1,091)
Working capital (834) (751)
Capital employed 4,968 5,637
Total equity 2,325 2,626
Long-term debt 2,040 2,314
Other non-current liabilities 603 697
Total financing 4,968 5,637
Closing rate €/$ 1.20 1.05
Balance sheet

2017 Full-Year Results 42
Debt maturity profile
Debt Maturity Profile (€ million)
1021 1050
7
249
6
697
397497
36
151
2017 2018 2019 2020 2021 2022 2023 2024 2025 2026 2027 2028 >2028Year-End
Cash & cash equivalents plus
derivatives1)
1) Cash and cash equivalents of €1,020 million plus €1 million in derivatives.As of December 31, 2017, gross debt included €288 million of bank overdrafts used for cash management purposes. Cash and cash equivalents, net of bank overdrafts used for cash management purposes, were €732 million.

2017 Full-Year Results 43
Currency
Impact in € million on
Average rates Revenue
Adjusted operating
profit1 Euro FY 2017 FY 2016 FY 2017 FY 2017U.S. dollar 1.13 1.11 (59) (19)British pound 0.88 0.82 (9) (1)Canadian dollar 1.46 1.47 0 0Australian dollar 1.47 1.49 1 0Brazilian real 3.60 3.86 1 0Polish zloty, Chinese yuan and other (1) 1Total impact (67) (19)
U.S. dollar65%
Euro24%
British pound
3%Other
8%
FY 2017 Revenues