WLTP-DHC14-05 WLTP- Validation Phase 2 Results and Recommendations by India 11 th DTP and 14 th DHC...
46
WLTP-DHC14-05 WLTP- Validation Phase 2 Results and Recommendations by India 11 th DTP and 14 th DHC Meeting 24 th – 26 th Sept 2012, JRC, Ispra
-
Upload
lorena-turner -
Category
Documents
-
view
225 -
download
1
Transcript of WLTP-DHC14-05 WLTP- Validation Phase 2 Results and Recommendations by India 11 th DTP and 14 th DHC...

WLTP-DHC14-05
WLTP- Validation Phase 2
Results and Recommendations by India
11th DTP and 14th DHC Meeting 24th – 26th Sept 2012, JRC, Ispra

WLTP-DHC14-05
Contents:
Validation-2 Results: Summary and Concerns
Need of Cycle Moderation
Need of Cycle Separation by revised threshold speed
WLTP- Validation Phase 2
WLTP-DHC14-05
WLTP Validation-2 Results
India Presentation on Class 3 Vehicles24th – 26th Sep, DHC /DTP Meeting
JRC. ISPRA, Italy
Summary & Concerns

WLTP-DHC14-05Validation-2 Overview
4
Legend : Vehicle: P = Petrol, C = CNG, D = Diesel O / O : OK for Drive Cycle Traceability and WOT (Engine Protection Mode) not activatedO / EP: OK for Drive Cycle Traceability and WOT (Engine Protection Mode) activatedX / EP: Not OK for Drive Cycle Traceability and WOT (Engine Protection Mode) Activated
Make
M1 / N1
Vehicle
Engine CC
PMR kW/Ton
TMR Nm /Ton
V Max km/h
L M H ExH
Class as per Steven
MSIL M1 P1 796 49.0 93.2 135 O / O O / O O / EP X / EP Class3
MSIL M1 P2 998 55.6 101.8 145 O / O O / O O / EP O / EP Class3
TATA M1 P3 1405 47.3 99.5 150 O / O O / O O / O O / EP Class3
Honda M1 P4 1198 49.4 82.8 169 O / O O / O O / O O / O Class3
HMIL M1 P5 814 53.1 97.1 137 O / O O / O O / O O / EP Class3
MSIL M1 C1 796 36.4 82.6 135 O / O O / O O / EP X / EP Class3
MSIL M1 C2 1586 60.4 113.9 160 O / O O / O O / EP O/ EP Class3
HMIL M1 L1 1086 45.2 95.8 152 O / O O / O O / O O / EP Class3
M&M M1 D1 2179 44.7 142.1 140 O / O O / O O / O O / O Class3
M&M N1 D2 2179 46.0 146.2 140 O / O O / O O / O O / O Class3
TATA N1 D3 1405 44.0 112.0 125 O / O O / O O NA Class3

WLTP-DHC14-05
CO2 EmissionsPetrol / CNG Vehicles (All M1 Category)
CO2 emissions of LMHL and MIDC are within comparable range.
On some vehicles EXH cause increase in CO2 emissions by 4 % to 7% due to prolonged running in Engine protection region (Ex P1 , P2, P3).
Diesel Vehicles - M1CO2 emissions of LMHL are comparable to MIDC . CO2 emissions including ExH are higher than MIDC.
Diesel Vehicles - N1 CO2 emissions for both LMHL and LMHExH higher than MIDC.
M1 N1

WLTP-DHC14-05
CO EmissionsPetrol / CNG Vehicles (All M1 Category)The effect of engine protection is clearly indicated by High CO emissions.
CO emissions are higher by 14 to 50% to when driven on LMHL in some vehicles. (P1 /P3)
CO emissions are further aggravated when these vehicles are driven on Ex High phase. (150 to 280% for Petrol Vehicles)
Diesel Vehicles - M1
Values are have reduced by 50% over MIDC, for LMHL and LMH ExH
Diesel Vehicles - N1
Values are comparable to MIDC for LMHL
Values are lower by 25% with inclusion of Ex H
M1 N1

WLTP-DHC14-05
THC EmissionsPetrol / CNG Vehicles (All M1 Category)THC shows a mixed trend.
It seems that the trend is more due to vehicle application (Calibration).
Diesel Vehicles - M1
Values are lesser than MIDC by 25% and 10% respectively for LMHL & LMHExH
Diesel Vehicles - N1 Values are lesser than MIDC
M1 N1

WLTP-DHC14-05
NOx EmissionsPetrol / CNG Vehicles (All M1 Category) Nox Emissions are Higher than MIDC for both LMHL & LMHExH
The severity of Nox emissions can be easily correlated with the stringency of the cycle, as shown by vehicles P1 (PMR 49.0 kW/ton & C1 (PMR 36.4 kW/ton)
Diesel Vehicles - M1 NOx Emissions are Higher than MIDC by 80 to 160 % for LMHL & LMHExH respectivly
Diesel Vehicles - N1 Trend is even worse for N1 Category.
M1 N1
vikramk
Add Exhaust Temp.

WLTP-DHC14-05
Particulate Matter
Diesel Vehicles - M1 PM Emissions are higher 70 to 120% with LMHL & LMHExH respectively
Diesel Vehicles - N1
Similar trend observed for N1 Category

WLTP-DHC14-05
Ex-High Phase Cycle Traceability
Vehicles P1 (Class3, PMR: 49 kW/ton,) and C1, (Class 3, PMR 36.4 kW/ton) are unable to trace Ex-High Test Cycle.
Hence, to address the above concerns, either
Test Cycle Moderation is Required
Threshold speed need re-examine to define class 3 vehicles having lower PMR and vehicle max speed

WLTP-DHC14-05
Validation2 : Summary• For Class 3 Vehicles, the following remain key
concerns:
– Engine Protection Entry (As seen by High CO emissions)– WOT Operation– Traceability of Test Cycle esp. Ex-High– Stringency of the Test Cycle (as shown by High NOx emissions)
• Possible Solutions
– Current Cycle Separation needs a re-examine including methodology of Current Classification
– Moderation of the Test Cycle at Critical Areas

WLTP-DHC14-05
WLTP : Analysis of Cycle SeparationProposal from India
India Presentation on Class 3 Vehicles24th – 26th Sep, DHC /DTP Meeting
JRC. ISPRA, Italy

WLTP-DHC14-05
Cycle Separation: Speed Thresholds
With the current definitions of speed threshold, vehicle which have speeds just above Ex-High Peak Speed have an inherent disadvantage of driving WLTP cycle due to no reserve power available.
There is a need to address these concerns for such vehicles.
Based on current definitions:
Case 1 (when LMH phases are applicable)
• Vehicle Max Speed 135 km/h• Cycle Max Speed 97.4 km/h
Case 2 (when LMH ExH phases become applicable)
• Vehicle Max Speed 136 km/h• Cycle Max Speed 131.3 km/h
Margin Available
No Margin

WLTP-DHC14-05
Max Speed: Coast Down RequirementsAs per ECE R83, Annex 4a, Appendix 7, Clause 5.1.1.2
Hence Threshold Speed for Class 3 vehicles should be revised to 145 km/h from the current 135 km/h.
MIDC NEDC WLTC
Max Speed on Test Cycle , km/h
90 120 131.2
Chosen Test Speed in Coast Down Test, V (km/h)
90 120 135
Time Measurement Interval for Coast Down Test , (km/h)
95 - 85 125 - 115 140 - 130
Test Start Speed as per Procedure, (V + 10) km/h
100 130 145
Due to requirements of Coast Down and Road Load Simulation, threshold speed for Cycle Separation needs to be revised from 135 km/h to 145 km/h for Class 3 Vehicles.

WLTP-DHC14-05
Need for Margin for Compact Vehicles
• Vehicles which have Max Speed of (~ 145km/h), have lower reserve power for acceleration in this speed range. These vehicles will have to cover longer distances for achieving max speed.• For Such Vehicles, it will be extremely difficult to do Coast Down Test, due to track length limitations, and no. of readings to be taken for Statistical Accuracy.Cycle Separation at 145km/h will address this concern.
Launch Acceleration Test (0-145km/h) for typical Indian Cars
Speed (km/h) Vs Distance (m)
Vehicle shows in circle achieve the max speed after running for longer distances (approx 2kms )
PMR of these Vehicles > 34kw/ ton
vikramk
Need this info gear wise to understand times and distances covered in each gear.This must be provided in an Excel File. Simulation TeamLegened to be changed to have vehicles as 1,2,3.Vehicle having Max Speed < 120 km/h to be removed.To take worst case vehicle for emphasis of very high track length.

WLTP-DHC14-05
Need for Margin for Compact Vehicles
The same data plotted against time, confirms the problem of lower reserve power available for acceleration.
This also explains the deviations of these vehicles in meeting Ex-High Phase, as such vehicles are unable to follow the trace within the specified time, though they will achieve their max speeds after driving for long duration.
Launch Acceleration Test (0-145km/h) for typical Indian Cars
Speed (km/h) Vs Time (s)
Vehicle shown in circle are unable to meet the Max Speed even after 60 sec.
vikramk
Same as previous comment V1The relation of time taken in a particular gear to be checked in relation to Ex High / or High Accelerations and to see if actual accelerations are less than WLTC acclerations for justification.

WLTP-DHC14-05
Validation-2 Results (Vehicle P1)
Validation-2 Results (WLTC Ver5.0 with Stevens3)
The vehicle is unable to trace the Ex-High Trace within specified time.
vikramk
To compare WLTC acclererations with launch acclererations.

WLTP-DHC14-05Summary• Margin between Cycle Separation Speed and Ex-High Max Speed
• Coast Down Requires vehicle Max Speed of at least 145km/h to cover coast down speed point of 135 kmph.
• Vehicles having max speed between 135 to 145 kmph need larger distance > 1 km and more time to reach 145 kmph while conducting coast down to cover 135 kmph speed point.
• Non traceability of Vehicles on EXH based on Validation-2 Results.India Proposal:Cycle Separation for EXH Phase Applicability at 145 km/h
V=0 kmph
V=145 kmph
V=140 kmph
V=130 kmph
Coast down time measurement for 135 kmph
Time & distance required to achieve 145 kmph

WLTP-DHC14-05
0
10
20
30
40
50
60
70
80
90
100
0 20 40 60 80 100 120 140 160 180 200
PMR,
kw
/ ton
Vehicle Speed, km/h
CLASS1< 70 km/h: L1 + L1+ L1
CLASS1 >= 70km/h:L1 + M1 + L1
CLASS2< 90 km/h: L2 + M2 + L2
CLASS2>90 km/h: L2 + M2 + H2
CLASS3 < 135km/h: L3 + M3 + H3 (WLTC Ver 5.0)
CLASS3 > 135km/h: L3 + M3 + H3 +ExH3 (WLTC Ver 5.0)
Cycle Separation – India Proposal
India Proposal ( L, M, H)
Steven Proposal (L, M, H) Steven Proposal (L, M, H, EXH)
India Proposal (L, M, H, EXH)
Current: 135km/h India
Proposal: 145 km/h

WLTP-DHC14-05
For Class 3 vehicles
WLTP : The Need for Cycle Moderation
India Presentation on Class 3 Vehicles24th – 26th Sep, DHC /DTP Meeting
JRC. ISPRA, Italy

WLTP-DHC14-05
Gear Shift Evolution
Current shift pattern and aggressiveness of driving
21
WLTP-DHC14-05
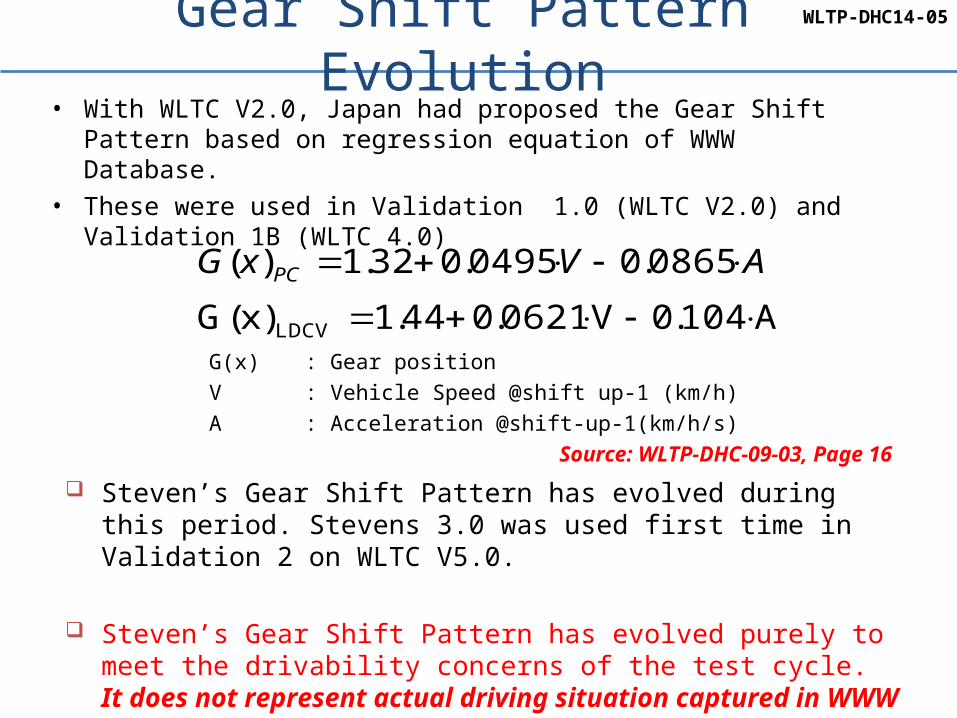
Gear Shift Pattern Evolution
G(x) : Gear position
V : Vehicle Speed @shift up-1 (km/h)
A : Acceleration @shift-up-1(km/h/s)
Source: WLTP-DHC-09-03, Page 16
AVxG PC 0865.00495.032.1)(
A104.0V0621.044.1)x(G LDCV
• With WLTC V2.0, Japan had proposed the Gear Shift Pattern based on regression equation of WWW Database.
• These were used in Validation 1.0 (WLTC V2.0) and Validation 1B (WLTC 4.0)
Steven’s Gear Shift Pattern has evolved during this period. Stevens 3.0 was used first time in Validation 2 on WLTC V5.0.
Steven’s Gear Shift Pattern has evolved purely to meet the drivability concerns of the test cycle. It does not represent actual driving situation captured in WWW database.

WLTP-DHC14-05
WLTC V5.0 ExH: Gear Shift Comparison on CycleVehicle P1PMR=49kW/ton
For vehicles with lower PMR, wherever, the Test Cycle has steep accelerations, Stevens Gear Shift has improved traceability of the cycle by aggressive driving: Driving in lower gears at higher Speeds.
This is not representative of actual drive pattern of this vehicle, as seen by actual road data collected for this vehicle.
For a vehicle with Higher PMR, the Stevens Gear Shift and Japanese Gear Pattern Converge.
Vehicle PaPMR = 64.2kW/ton
Vehicle P1: Actual Drive Pattern (Source: Road Data Collection)
Frequent Down Shifting to meet acceleration demand. Similar Shift Pattern in this case.

WLTP-DHC14-05
WLTC V5.0 ExH: Gear Shift Distribution ComparisonIn terms of Time Distribution of Gears Used:
Vehicle P1 is driven in 5th gear only 57.89% of the time as per Stevens when compared to 78% as per Japan
Usage of 4th Gear is higher in Steven’s compared to Japan gear Shift pattern to get higher acceleration to meet cycle demand.It shows Stevens Shift Pattern is more aggressive for such vehiclesFor Vehicle Pa, the Gear Shift
Pattern for Stevens and Japan is similar.
For such cases Steven Gear Shift Pattern is realistic as it is comparable to the Gear Shift Pattern derived from WWW Data base.

WLTP-DHC14-05
WLTC V5.0 High: Gear Shift Comparison on Cycle
© 2012 Maruti Suzuki India Limited
Vehicle C1PMR=36.4 kW/ton
Vehicle PaPMR=64.2 kW/ton
A similar example of High Phase, showing the same trend.
Leaving aside portions of the cycle having steep accelerations, Stevens Gear Shift, is generally similar to Japanese Gear Shift. Only in case of steep increase in cycle acceleration, Steven’s Gear Shift becomes aggressive.
Aggressiveness of the Steven’s pattern (effect ) is a function of stringency of the cycle for Vehicles Having Lower PMR. (Cause)

WLTP-DHC14-05
Load Scatter: Real World Driving comparison with WLTC
The above shows a comparison of load scatter of WLTC H and EXH phase and its comparison with City driving and Highway driving profile of P1 Vehicle. On road for city driving data pattern show engine operation near to 50% whereas, for highway road data show operation near to 70% throttle, but on WLTC operation show near to full throttle leading to very aggressive as compared with on road data. (Same data that is available in world wide data)
0 1000 2000 3000 4000 5000 60000
0.1
0.2
0.3
0.4
0.5
0.6
0.7
0.8
0.9
1
Engine speed(rpm)
RLD
WLTC - Low phase
WLTC ver5 Steven shift
WLTC ver5.1 Steven shift
0 1000 2000 3000 4000 5000 60000
0.1
0.2
0.3
0.4
0.5
0.6
0.7
0.8
0.9
1
Engine speed(rpm)
RLD
WLTC - Med phase
0 1000 2000 3000 4000 5000 60000
0.1
0.2
0.3
0.4
0.5
0.6
0.7
0.8
0.9
1
Engine speed(rpm)
RLD
WLTC - High phase
0 1000 2000 3000 4000 5000 60000
0.1
0.2
0.3
0.4
0.5
0.6
0.7
0.8
0.9
1
Engine speed(rpm)
RLD
WLTC - Ex high phase
0 1000 2000 3000 4000 5000 60000
0.1
0.2
0.3
0.4
0.5
0.6
0.7
0.8
0.9
1
Engine speed(rpm)
RLD
WLTC - Low phase
WLTC ver5 Steven shift
WLTC ver5.1 Steven shift
0 1000 2000 3000 4000 5000 60000
0.1
0.2
0.3
0.4
0.5
0.6
0.7
0.8
0.9
1
Engine speed(rpm)
RLD
WLTC - Med phase
0 1000 2000 3000 4000 5000 60000
0.1
0.2
0.3
0.4
0.5
0.6
0.7
0.8
0.9
1
Engine speed(rpm)
RLD
WLTC - High phase
0 1000 2000 3000 4000 5000 60000
0.1
0.2
0.3
0.4
0.5
0.6
0.7
0.8
0.9
1
Engine speed(rpm)
RLD
WLTC - Ex high phase
Vehicle P1PMR=49 kW/ton

WLTP-DHC14-05
No. of Gear Shifts (Stevens) vs PMR
© 2012 Maruti Suzuki India Limited
No. of Gear Shifts has an inverse Relation to PMR.
It is evident the LOW PMR Vehicles have to perform repeated down shifting and later Up shifting so as to trace the Cycle.
No. of Gear Shifts as per Japan = 95

WLTP-DHC14-05
Steven’s Gear Shift is based on the assumption of 90% Safety Margin of Power Available.
The above schematic shows the actual power available at Wheel is 80%. Hence for actual safety margin, the criteria should be modified to 80%. (10% margin)
For new vehicles tested for COP will have lesser Power Availability due to Higher Engine Friction Losses. The proposed criteria of 80% barely meets requirements of new vehicles
Safety Margin on Full Load Power Curve
Current Margin of 90%
Power at Wheel available for a New Vehicle.(at 0 km)
Proposed Margin of 80%

WLTP-DHC14-05
No. of Gear Shifts (Stevens) vs PMR
© 2012 Maruti Suzuki India Limited
With reduction of Safety Margin 80 % the cycle is expected to become stringent
Effect of Reduction of Safety Margin to 80%

WLTP-DHC14-05
Gear Shift Pattern : Summary Stevens• Improves Drivability on Cycle
• Considers Vehicle Parameters
• Results in aggressive driving pattern esp. for compact cars, which does not represent actual driving of such cars.
• Uses foresight time of 6sec. This anticipatory approach, may not reflect actual driver behavior
Japan Is based real world driving patterns
(WWW Database)
No. of Gear Shifts on Cycle are less.
Drivability issues observed, mainly due to aggressive accelerations on test cycle
Steven’s gear shift pattern has evolved with the main consideration of achieving traceability of the test cycle.
This has resulted in aggressive driving, esp. during acceleration phases which does not represent actual driving pattern of such cars.
Hence, moderation of the cycle is necessary to have a more realistic Gear Shift Pattern as per Steven’s methodology.
WLTP-DHC14-05
India Proposal
31

WLTP-DHC14-05
India Proposal for Moderation: WLTC V5.1
Japan had proposed WLTC V 5.1 in 64th GRPE Meeting
The proposals consist of 9 point modifications in M and H phases in order to address typical Gasoline PC / LDCV.
WLTP-DHC14-05
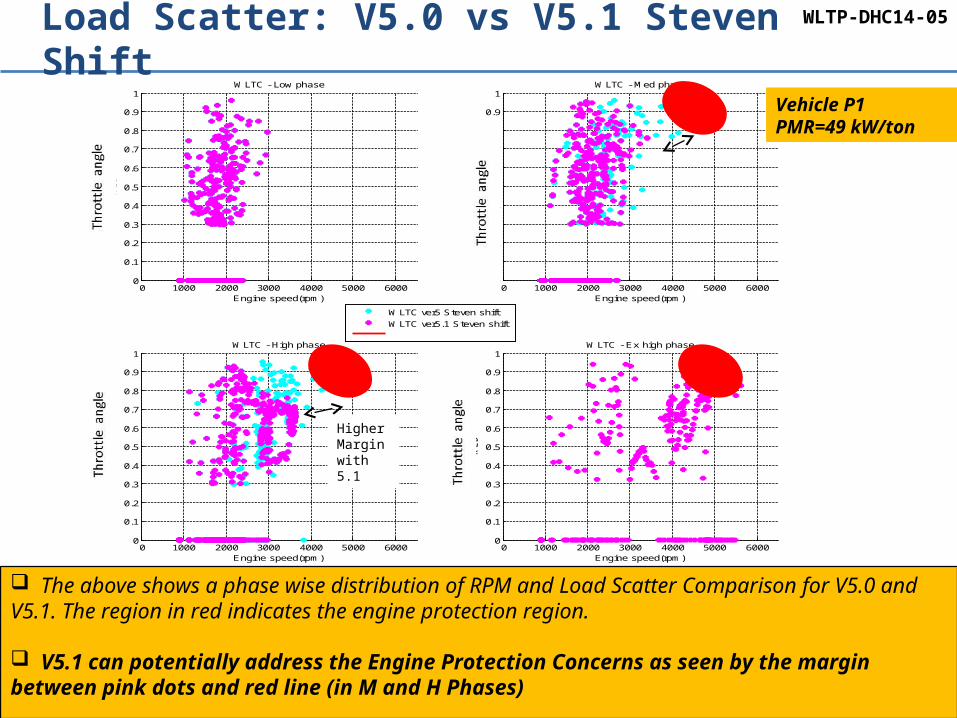
Load Scatter: V5.0 vs V5.1 Steven Shift
The above shows a phase wise distribution of RPM and Load Scatter Comparison for V5.0 and V5.1. The region in red indicates the engine protection region.
V5.1 can potentially address the Engine Protection Concerns as seen by the margin between pink dots and red line (in M and H Phases)
Higher Margin with 5.1
0 1000 2000 3000 4000 5000 60000
0.1
0.2
0.3
0.4
0.5
0.6
0.7
0.8
0.9
1
Engine speed(rpm)
RLD
WLTC - Low phase
WLTC ver5 Steven shift
WLTC ver5.1 Steven shift
0 1000 2000 3000 4000 5000 60000
0.1
0.2
0.3
0.4
0.5
0.6
0.7
0.8
0.9
1
Engine speed(rpm)
RLD
WLTC - Med phase
0 1000 2000 3000 4000 5000 60000
0.1
0.2
0.3
0.4
0.5
0.6
0.7
0.8
0.9
1
Engine speed(rpm)
RLD
WLTC - High phase
0 1000 2000 3000 4000 5000 60000
0.1
0.2
0.3
0.4
0.5
0.6
0.7
0.8
0.9
1
Engine speed(rpm)
RLD
WLTC - Ex high phase
Higher Margin with 5.1
Vehicle P1PMR=49 kW/ton

WLTP-DHC14-05V5.1 Stevens vs V5.0 Stevens
© 2012 Maruti Suzuki India Limited
With V5.1 Stevens Gear Shift results clearly indicate earlier up shifts and Vehicle Running in Higher Gears.
V5.1 will result in a Stevens Gear Shift Pattern which is more realistic, esp. for Class 3 vehicles at the lower side of PMR Range
Vehicle C1PMR=36.4 kW/ton

WLTP-DHC14-05SummaryModeration of the Cycle is needed to address:
• Vehicles which are unable to trace the Test Cycle
• Vehicles which are able to trace but driven with aggressive gear shifts, unlike actual driving behavior
• Vehicles which seemingly have adequate PMR, but low TMR (equivalent to Class-II Vehicles) leading to drivability issues on the Test Cycle will be overcome with the proposed proposals

WLTP-DHC14-05
0
10
20
30
40
50
60
70
80
90
100
0 20 40 60 80 100 120 140 160 180 200
PMR,
kw
/ ton
Vehicle Speed, km/h
CLASS1< 70 km/h: L1 + L1+ L1
CLASS1 >= 70km/h:L1 + M1 + L1
CLASS2< 90 km/h: L2 + M2 + L2
CLASS2>90 km/h: L2 + M2 + H2
CLASS3 < 135km/h: L3 + M3 + H3 (WLTC Ver 5.0)
CLASS3 > 135km/h: L3 + M3 + H3 +ExH3 (WLTC Ver 5.0)
India Proposal for Cycle Threshold Speed
India Proposal V5.1 (L, M, H)
Current Proposal V5.0 : (L, M, H)Current Proposal V5.0 (L, M, H,
EXH)
India Proposal V5.0 (L, M, H, EXH)
Current: 135km/h India
Proposal: 145 km/h

WLTP-DHC14-05
Thank You

WLTP-DHC14-05
38

WLTP-DHC14-05
Validation 2 Vehicles- Comparison of Indian and
European vehicles- PMR, TMR & Driveability of
vehicles
39
WLTP-DHC14-05
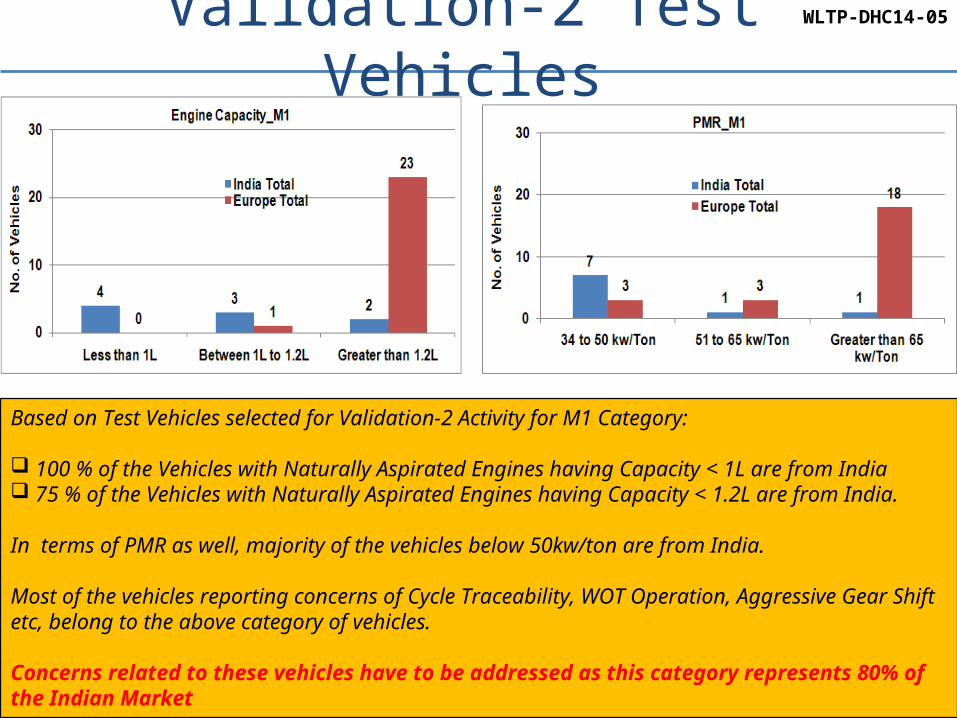
Validation-2 Test Vehicles
Based on Test Vehicles selected for Validation-2 Activity for M1 Category:
100 % of the Vehicles with Naturally Aspirated Engines having Capacity < 1L are from India 75 % of the Vehicles with Naturally Aspirated Engines having Capacity < 1.2L are from India.
In terms of PMR as well, majority of the vehicles below 50kw/ton are from India.
Most of the vehicles reporting concerns of Cycle Traceability, WOT Operation, Aggressive Gear Shift etc, belong to the above category of vehicles.
Concerns related to these vehicles have to be addressed as this category represents 80% of the Indian Market

WLTP-DHC14-05
PMR of Vehicles in the Indian Market
The chart shows the distribution of Indian Vehicles based on current definition of Cycle Separation.
The classification shows Vehicles of all fuel types : Petrol / LPG /CNG / Diesel
0.0
10.0
20.0
30.0
40.0
50.0
60.0
70.0
80.0
90.0
100.0
110.0
120.0
130.0
140.0
150.0
160.0
170.0
180.0
190.0
200.0
0.0 20.0 40.0 60.0 80.0 100.0 120.0 140.0 160.0 180.0 200.0 220.0 240.0 260.0 280.0 300.0
PMR
[kW
/ton
]
Max. Speed [kmph]
PMR Vs Max Speed
PMR_Gasoline
PMR_CNG
PMR_Diesel
PMR_LPG
CLASS1< 70 km/h: L1 + L1+ L1
CLASS1 >= 70km/h:L1 + M1 + L1
CLASS2< 90 km/h: L2 + M2 + L2
CLASS2>90 km/h: L2 + M2 + H2
CLASS3 < 145km/h: L3 + M3 + H3 (WLTC Ver 5.1)
CLASS3 > 145km/h: L3 + M3 + H3 +ExH3 (WLTC Ver 5.0)

WLTP-DHC14-05
-10.0
10.0
30.0
50.0
70.0
90.0
110.0
130.0
150.0
170.0
190.0
210.0
230.0
250.0
270.0
290.0
310.0
330.0
0.0 20.0 40.0 60.0 80.0 100.0 120.0 140.0 160.0 180.0 200.0 220.0 240.0 260.0 280.0 300.0
TMR
[N-m
/ton
]
Max. Speed [kmph]
TMR Vs Max Speed
TMR_Gasoline
TMR_CNG
TMR_Diesel
TMR_LPG
CLASS1< 80 km/h: L1 + L1+ L1
CLASS1 >= 80km/h:L1 + M1 + L1
CLASS2a< 110 km/h: L2 + M2 + L2
CLASS2b>110 km/h: L3m + M3m + H3m (WLTC Ver 5.x)
CLASS3 < 145 km/h: L3m + M3m + H3m (WLTC Ver 5.1)
CLASS3 > 145km/h: L3 + M3 + H3 +ExH3 (WLTC Ver 5.0)
Another View in Terms of TMR
Assuming the that current Class I and Class II vehicles remain, in their respective classes, the same distribution plotted in terms of TMR.
The trend clearly demarcates vehicles in Class III for Gasoline / CNG / LPG / Diesel Vehicles which have concerns shown in the red circle with LOW TMR which are similar to certain Class II Vehicles

WLTP-DHC14-05
Stevens Safety Margin (PWOT)
43

WLTP-DHC14-05V5.0 High Stevens: Safety Margin 90 vs 80%Vehicle C1PMR=36.4 kW/ton
Vehicle PaPMR = 64.2kW/ton
------- Stevenshift 90 pct------- Stevenshift 80 pct
Steven’s Gear Shift becomes more aggressive with reduction of Safety Margin to 80%.
The impact is more on Low PMR vehicles, while high PMR Vehicles show slight changes.
WLTP-DHC14-05
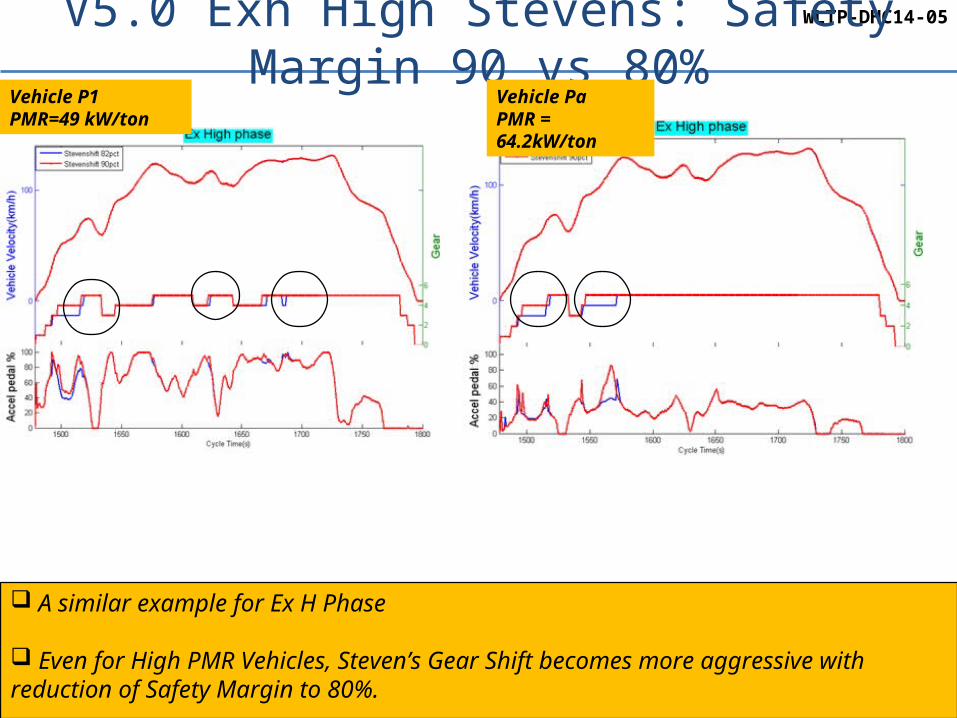
V5.0 Exh High Stevens: Safety Margin 90 vs 80%
A similar example for Ex H Phase
Even for High PMR Vehicles, Steven’s Gear Shift becomes more aggressive with reduction of Safety Margin to 80%.
Vehicle P1PMR=49 kW/ton
Vehicle PaPMR = 64.2kW/ton

WLTP-DHC14-05No. of Gear Shifts (Stevens) vs PMR
© 2012 Maruti Suzuki India Limited
With reduction of Safety Margin 80 % the cycle is expected to become stringent on the lower PMR Range
Use of Moderated Cycle 5.1 will compensate for this effect as shown in the above chart.
Effect of Reduction of Safety Margin to 80%
Effect Moderated Cycle 5.1