
WLAN Jari Heiskanen - DiVA portal
36
BLEKINGE INSTITUTE OF TECHNOLOGY The Department of Software Engineering and Computer Science Examiner: Guohua Bai, [email protected] Tutor: Anders Carlsson, [email protected] Authors email: [email protected] Program: Bachelor Thesis in Computer science C, 15 hp Date: 2008-06-23 Bachelor Thesis in Computer science C, 15 hp WLAN performance in IEEE 802.11n Jari Heiskanen
Transcript of WLAN Jari Heiskanen - DiVA portal

BLEKINGE INSTITUTE OF TECHNOLOGY The Department of Software Engineering and Computer Science
Examiner: Guohua Bai, [email protected] Tutor: Anders Carlsson, [email protected]
Authors email: [email protected] Program: Bachelor Thesis in Computer science C, 15 hp
Date: 2008-06-23
Bachelor Thesis in Computer science C, 15 hp
WLAN performance in IEEE 802.11n
Jari Heiskanen

WLAN ‐ performance in IEEE 802.11n Jari Heiskanen
Abstract 2008‐06‐23
Based on the Mid Sweden University template for technical reports, written by Magnus Eriksson, Kenneth Berg and Mårten Sjöström.
ii
Abstract WLAN/n is an attractive technology since it increases data throughput and link range by giving more bits per second. Developments in 802.11n have increased data rate and performance to higher levels. One technique is to use multiple antennas for transmitter and receiver to transmit multiple data streams through MIMO systems for the n standard. Mobile units in a cell perhaps don’t have fixed position in the cell so use of more advanced algorithms such as OFDM had as well been developed and presented in this report.
Interference for the signal is one main task in WLAN because the calculated amount of data manufacturers have in their specifications is fairly true in transmissions when measuring data throughput. Results from experiments shows that interference in some cases is considered as a problem.
Goal with this thesis is to answer the questions around different techniques within WLAN technology and what kind of interference and developments there are against this problem to gain more stabile and higher data throughput. Experiments include WLAN net in natural environment with an access point and a laptop with network card.
Keyword: OFDM, WLAN, Interference, MIMO, 802.11n.

WLAN ‐ performance in IEEE 802.11n Jari Heiskanen
Introduction 2008‐06‐23
Based on the Mid Sweden University template for technical reports, written by Magnus Eriksson, Kenneth Berg and Mårten Sjöström.
3
Table of Contents Abstract ............................................................................................................. ii
1 Introduction ............................................................................................ 4 1.1 Background and problem motivation .............................................. 4 1.2 Aim with project.................................................................................. 5 1.3 Scope ..................................................................................................... 5 1.4 Outline .................................................................................................. 5
2 IEEE 802.11 WLAN/n ............................................................................. 6 2.1 Introduction ......................................................................................... 6 2.2 WLAN Protocol Layer Architecture ................................................. 6 2.2.1 MAC .................................................................................................... 7 2.2.2 PHY ..................................................................................................... 8 2.3 Multiantenna Systems ........................................................................ 9 2.3.1 Antenna Diversity ............................................................................ 9 2.4 Space Time codes .............................................................................. 10 2.5 Transmission Techniques ................................................................ 10 2.5.1 OFDM ............................................................................................... 10
3 Interference ........................................................................................... 12 3.1 Introduction ....................................................................................... 12 3.1.1 Thermal Noise ................................................................................... 12 3.1.2 Fading ................................................................................................. 13 3.1.3 Co‐Channel Interference .................................................................. 14 3.1.4 Radio wave propagation .................................................................. 15 3.1.5 Free space path loss .......................................................................... 15
4 Methodology ......................................................................................... 16
5 Results .................................................................................................... 18
6 Analysis .................................................................................................. 22
7 Conclusion and discussion ................................................................ 23 7.1 Future work ....................................................................................... 25
References ........................................................................................................ 26
Appendix A: Abbreviations ......................................................................... 28
Appendix B: Figures from results ............................................................... 30

WLAN ‐ performance in IEEE 802.11n Jari Heiskanen
Introduction 2008‐06‐23
Based on the Mid Sweden University template for technical reports, written by Magnus Eriksson, Kenneth Berg and Mårten Sjöström.
4
1 Introduction 1.1 Background and problem motivation The use of Internet and wireless technology has grown since the begin‐ning of 1990: s. It is very usual to have some kind of wireless device at home such as a Wireless Local Area Network (WLAN) where a router and couple of computers can work together. Analogous techniques have been replaced by digital technique and with this digitalization there has been more effective usage. Multiple Input Multiple Output (MIMO) [1] is a promising solution for link robustness and higher data throughput [1] but unfortunately there are more issues to solve.
Using space instead of wires for transmitted data needs efficient equip‐ment since bandwidth is limited [1]. Security issues are a big problem since radio waves is available for anyone to listen at but there is no focus at that in this thesis. Interference is another aspect of WLAN perfor‐mance that can decrease data throughput [10]. The standard for wire‐less networks at home is called Home‐RF [10] and focus in this thesis is on Institute of Electrical and Electronics Engineers (IEEE) [21] 802.11n standard and the interference problem in that particular area. There are four questions in this problem area this thesis try to solve.
‐In usual mobile systems base stations do not have information about the position of mobile units inside a cell so the signal is sending in all directions within the cell to get covered, the result is power, transmis‐sion loss and interference against other cells using the same frequencies and it is same with antennas receiving signals with noise as result. What technique is used to decrease these interferences?
‐Multipath propagation is a problem in wireless communication but is there a solution in IEEE 802.11 n?
‐What is the impact on WLAN environment if two or more Access Points (AP) is standing close to each other?
‐Hidden terminal is a big problem for wireless but how is that problem avoided?

WLAN ‐ performance in IEEE 802.11n Jari Heiskanen
Introduction 2008‐06‐23
Based on the Mid Sweden University template for technical reports, written by Magnus Eriksson, Kenneth Berg and Mårten Sjöström.
5
1.2 Aim with project Research through literature studies in the area of WLAN with its positive and negative aspects is aim with project. Further studying about interference in WLAN and what kind of interference and other negative impacts have for consequences in WLAN environment.
Improvements, knowledge and understanding the background interfe‐rence problems in WLAN net are the goal with this thesis and how interference could be limited.
1.3 Scope Focus is on interference problems in home environment and with WLAN n technology. No security aspects will be included. The WLAN standard this thesis will look further in is 802.11n so a, b and g stan‐dards will not be investigated deeper in this report but compared to 802.11n and mostly what developments there are against previous standards in the n standard. Equipment for the experiment is an Acer 1315 laptop with an Xtreme notebook express card Dlink 643, AP Dlink DIR‐635 and software airmagnet 7.5, laptop analyzer.
1.4 Outline This thesis includes the following chapters:
Chapter 1 has an overview over this thesis introduction, background, aim with project and scope.
Chapter 2 provides the reader with theory and introduction. I will go through facts about protocol architecture, multi antenna systems, and space time coding and transmission technique in IEEE 802.11n.
Chapter 3 has interference issues and the different kinds of known interfering problems that exist.
Chapter 4 describes methodology.
Chapter 5 shows results from graphs from a WLAN analyzer where I made some measurements.
Chapter 6 shows analysis.
Chapter 7 finally gives conclusions and discussion.

WLAN ‐ performance in IEEE 802.11n Jari Heiskanen
IEEE 802.11 WLAN/n 2008‐06‐23
Based on the Mid Sweden University template for technical reports, written by Magnus Eriksson, Kenneth Berg and Mårten Sjöström.
6
2 IEEE 802.11 WLAN/n 2.1 Introduction IEEE 802.11n is a specification that operates in 2.4 or 5 GHz band [1]. To take advantages of higher data rates there has been developed technique named MIMO [1]. There is broad spectrum of techniques for MIMO such as smart antennas (SA), spatial multiplexing(SM) and space time block coding (STBC) [1] that requires multiple antennas for transmitting and receiving. The unlicensed band of 2.4‐2.485 GHz is mixed with lot of interferences from microwaves, Bluetooth, cordless phones and other wireless gadgets using the same frequency [10]. Task Group N (TGn) [5] established in 2003 in order to achieve higher throughput by revising the Medium Access Control (MAC) and physical layer (PHY). The a, b and g WLAN’s has about 25 Mbps maximum throughput and n standard achieve 4 times faster WLAN[9] so this is one of the most important benefits for n standard against previous standards. According to manu‐facturers of n routers the data rate speed can be as high as 300 mbps [9]. Interference is more a reality than fiction though.
In following chapters I will go through the protocol architecture, mul‐tiantenna systems, space time block coding and transmission techniques for further understanding in WLAN techniques.
2.2 WLAN Protocol Layer Architecture Computers connected over a wireless network should work just like wired computers [2] on Local Area Networks (LAN). Wireless networks operate at lower speeds where higher latency and lost connections as result. Lower data rates is a big problem for wireless so developing modulation schemes were necessary to combat fading channels and lower data rates [1].
WLAN protocols are a layered architecture that mostly refers to the two layers in OSI architecture data link layer (DLL) and PHY se figure below.

WLAN ‐ performance in IEEE 802.11n Jari Heiskanen
IEEE 802.11 WLAN/n 2008‐06‐23
Based on the Mid Sweden University template for technical reports, written by Magnus Eriksson, Kenneth Berg and Mårten Sjöström.
7
Figure2.1:OSIlayeroverview.(Source: www.pulsewan.com/data101/images/503072a.gif.)
DLL has a sub layer MAC that will be covered next and after that chapter PHY.
2.2.1 MAC MAC is software that controls communications between network cards and AP [3]. The MAC protocol regulates the medium by a channel access mechanism [2] which divides main resources between nodes and radio channel. A MAC layer provides following improved features [11]:
• Higher Throughput (HT)
• Reducing protocol overhead
• Increasing efficiency of voice service
• Increasing efficiency of video traffic

WLAN ‐ performance in IEEE 802.11n Jari Heiskanen
IEEE 802.11 WLAN/n 2008‐06‐23
Based on the Mid Sweden University template for technical reports, written by Magnus Eriksson, Kenneth Berg and Mårten Sjöström.
8
• Increasing of transport efficiency through frame aggregation
• Increasing maximum transported frame size
• Carrier Sense Multiple Access/Collision Avoidance (CSMA/CA)
In 802.11n there is improvement in efficiency by reducing protocol overhead due to frame headers and frame gaps [11]. If frames are shorter like in voice traffic between 132‐250 bytes depending on codec the transport efficiency increase [11]. Being transported using maximum frames through frame aggregation protocol benefits MAC layer trans‐port in 802.11n [11].
There are two kinds of MAC protocol Distributed Coordination Function (DCF) and Point Coordination Function (PCF) [3]. The most common today is DCF. DCF is based on CSMA/CA and when stations detects that there is no transmissions going on, base station (STA) acknowledge‐ments (ACK) a frame after a transmission are successful and protected against other STA’s [12]. This procedure continues and reduces the collision of frames, (CSMA/CA) [12], in case of multiple STAs trying to access the channel.
These MAC parameters in this chapter depend on the underlying PHY layer that will be covered in the next chapter. Co‐Channel Interference is described more in detail in chapter 3.1.3.
2.2.2 PHY IEEE 802.11 Physical Layer (PHY) provides connection between MAC and wireless media [3]. There are two sub layers in PHY, the top layer Physical Layer Convergence Protocol (PLCP) and the bottom sub layer Physical Media Dependent (PMD) [3].
Figure 2.2 PHY, overview. (Source: [1].)

WLAN ‐ performance in IEEE 802.11n Jari Heiskanen
IEEE 802.11 WLAN/n 2008‐06‐23
Based on the Mid Sweden University template for technical reports, written by Magnus Eriksson, Kenneth Berg and Mårten Sjöström.
9
The bottom sub layer PMD is responsible for forming and transmitting the actual bit stream and it performs the modulation and demodulation of the actual air media [3].
2.3 Multiantenna Systems MIMO in contrast to Single Input Single Output (SISO), Single Input Multiple Outputs (SIMO) and Multiple Input Single Output (MISO) has antenna elements at both edges [1]. Higher data rates are achived by simultaneously transmit multiple data rates using spatial multiplexing technique. Orthogonal space time block codes and space time trellis code [1] are examples of diversity techniques that reduce the probability that the channel is in deep fade [1]. MIMO under performing increase power consumption, hardware and signal processing, transmitter and receiver component size [1]. The increase of this complexity made the adoption of MIMO in 802.11n WLAN possible which has data rates from 100 Mbps over the 20 MHz bandwidth [1]. Figure below shows the different antenna configurations.
Figure 2.3 MIMO, overview. (Source: [1].)
2.3.1 Antenna Diversity Spatial Diversity (SD) [1] is a technique used in MIMO to increase data throughput and link performance to defeat channel fading. Replicas of the same signal at receiver are named diversity [1] and diversity is used in Base Stations (BS). Downlink use two or more antennas and uplink multiple antennas. Diversity is important for systems with small number of transmitting antennas operating at low SNR values [1]. The case of Line of sight (LOS) where channels in practice have no fading is known as Spatial Multiplexing(SM) [1].

WLAN ‐ performance in IEEE 802.11n Jari Heiskanen
IEEE 802.11 WLAN/n 2008‐06‐23
Based on the Mid Sweden University template for technical reports, written by Magnus Eriksson, Kenneth Berg and Mårten Sjöström.
10
2.4 Space Time Codes Space Time Block Codes (STBC) [2] is a simple type of code to transmit multiple copies of data stream through a number of antennas and exploit data received to improve the reliability of transfers. Alamouti [8] developed a transmission technique for two transmitting antenna systems. This technique has full diversity with simple linear operations but the need for a better code for multiple antennas was developed like orthogonal design for multiple antennas such as Orthogonal Space Time Block Code (OSTBC) [2].
2.5 Transmission techniques Orthogonal Frequency Division Multiplexing (OFDM) is a multicarrier transmission technique that uses large numbers of orthogonal sub carriers to carry data information [2]. Purpose with OFDM is to mini‐mize interference among channels nearby others in frequency and cope with conditions like fading due multipath [2]. Some conditions for OFDM will follow.
2.5.1 OFDM OFDM transmission scheme has some key advantages such as [7]:
• OFDM has a less complexity implementation compared to single carrier systems.
• Capacity enhances by adapting the data rate per sub carrier ac‐cording to the SNR ratio of that sub carrier.
• OFDM is robust against nearby channels because interference affects only a small percentage of the sub carrier.
And some drawbacks:
• OFDM is more sensitive to phase noise and frequency offset.
• There is a peak to average power ratio which reduces the power efficiency of the radio frequency amplifier.
For WLAN such as 802.11n there are solutions to combat hostile fre‐quency selective fading and combined with Code Division Multiple Access (CDMA) there is enhanced robustness against fading in data transmis‐sion rates [7].
WLAN ‐ performance in IEEE 802.11n Jari Heiskanen
IEEE 802.11 WLAN/n 2008‐06‐23
Based on the Mid Sweden University template for technical reports, written by Magnus Eriksson, Kenneth Berg and Mårten Sjöström.
11
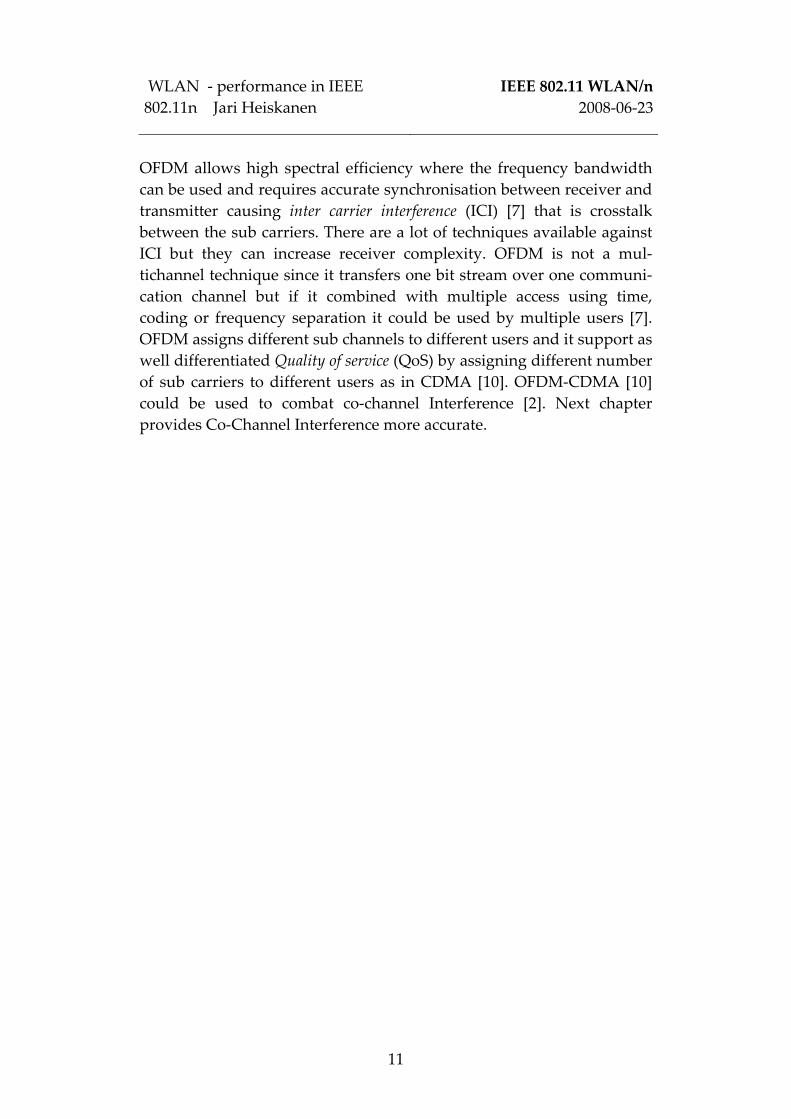
OFDM allows high spectral efficiency where the frequency bandwidth can be used and requires accurate synchronisation between receiver and transmitter causing inter carrier interference (ICI) [7] that is crosstalk between the sub carriers. There are a lot of techniques available against ICI but they can increase receiver complexity. OFDM is not a mul‐tichannel technique since it transfers one bit stream over one communi‐cation channel but if it combined with multiple access using time, coding or frequency separation it could be used by multiple users [7]. OFDM assigns different sub channels to different users and it support as well differentiated Quality of service (QoS) by assigning different number of sub carriers to different users as in CDMA [10]. OFDM‐CDMA [10] could be used to combat co‐channel Interference [2]. Next chapter provides Co‐Channel Interference more accurate.

WLAN ‐ performance in IEEE 802.11n Jari Heiskanen
INTERFERENCE 2008‐06‐23
Based on the Mid Sweden University template for technical reports, written by Magnus Eriksson, Kenneth Berg and Mårten Sjöström.
12
3 INTERFERENCE 3.1 Introduction Interference is a big problem in WLAN’s since two signals can in close range to each other at same time and near the same frequency interfere each other. One signal can be louder and overwhelm the other signal and eventually conflict occurs. This is a problem when decreasing of a signal and throughput will take down quality of the WLAN. This problem is common in natural home environment were lot of AP’s work in the surroundings and this could be seen in results in next chapter. Loss of signal strength due to signal attenuation caused by walls and obstacles is common even human body in the way for transmitters can decrease signal strength. AP standing low close the floor or having obstacle in close range decreases as well signal strength. Bit Error Rate (BER) rises as signal loose strength [10]. Most users in home environ‐ment have microwaves, cordless phones, and Bluetooth and access points in the surroundings operating within the WLAN. Graphs in results chapter show this interference problem. To deal with interfering problems there are some techniques for that such as developments in protocols and algorithms to combat interference.
In this chapter I will go through Thermal noise, Fading, Co‐channel Interference, Radio Wave Propagation and Free Space Path Loss.
3.1.1 Thermal Noise
Thermal noise occurs when undesired signal in a communication circuit tends to modify its information content. This noise is in all transmission media [10]. In wireless this can be subdivided into multiplicative such as fading, described in the next chapter, and additive effects. The additive noise is generated from circuit itself like thermal noise [10]. It is from electrons in random motion over the frequency spectrum [10]. There occurs noise if the temperature over transmission medium and equip‐ments are over absolute zero so it is inescapable to get rid of noise.

WLAN ‐ performance in IEEE 802.11n Jari Heiskanen
INTERFERENCE 2008‐06‐23
Based on the Mid Sweden University template for technical reports, written by Magnus Eriksson, Kenneth Berg and Mårten Sjöström.
13
Figure 3.1: Two types of noise in wlan. (Source: [1].) Figure 3.1: Two types of noise in wlan. (Source:
Additive White Gaussian Noise (AWGN) [10] is a channel that adds white Gaussian noise to signals passing through. This is standard for digital communication. White noise in the frequency spectrum continues and performs over specified frequency band. Issue here is that most wireless links cannot be modelled as AWGN channels [10] so more realistic is to use a fading channel described in next chapter.
Additive White Gaussian Noise (AWGN) [10] is a channel that adds white Gaussian noise to signals passing through. This is standard for digital communication. White noise in the frequency spectrum continues and performs over specified frequency band. Issue here is that most wireless links cannot be modelled as AWGN channels [10] so more realistic is to use a fading channel described in next chapter.
3.1.2 Fading 3.1.2 Fading
Fading is signals in combination with reflected, scattered, diffracted and delayed signals [10]. Fast fading is responsible for short term signal variation in transmission medium. There are different kinds of models to describe multipath fading channel such as Rayleigh [10] model. This model has not directly any Line Of Sight (LOS) so indoor environment for WLAN could be described by Rayleigh. Rayleigh is a statistical model of a radio signal scattered by environment. There is another fading model named Rician [10] fading but that model suits more LOS environment. To measure fading performance analyzing is made by bit error rate (BER) [10] and that is a function of Signal to Noise Ratio (SNR). Decreasing of BER is connected to high SNR [10].
Fading is signals in combination with reflected, scattered, diffracted and delayed signals [10]. Fast fading is responsible for short term signal variation in transmission medium. There are different kinds of models to describe multipath fading channel such as Rayleigh [10] model. This model has not directly any Line Of Sight (LOS) so indoor environment for WLAN could be described by Rayleigh. Rayleigh is a statistical model of a radio signal scattered by environment. There is another fading model named Rician [10] fading but that model suits more LOS environment. To measure fading performance analyzing is made by bit error rate (BER) [10] and that is a function of Signal to Noise Ratio (SNR). Decreasing of BER is connected to high SNR [10].
[1].)
Input Output
Multiplicative noise
Additive noise

WLAN ‐ performance in IEEE 802.11n Jari Heiskanen
INTERFERENCE 2008‐06‐23
Based on the Mid Sweden University template for technical reports, written by Magnus Eriksson, Kenneth Berg and Mårten Sjöström.
14
3.1.3 Co-Channel Interference
Co‐Channel interference is a type of interference when many users transmitting within the same channel. To reduce the interference a technique called reused pattern [10] where adjacent transmitters trans‐mit on different channels. More system manufacturers are taking part of the unlicensed frequency bands for transmitting information and there is no restriction of users so increase of co‐channel interference is grow‐ing. Further in WLAN environment there is a problem called hidden terminal [16] problem. When two STAs transceive and receive from a common AP and they cannot see each other they are hidden to each other. Network performance can decrease dramatically since DCF operates through carrier sensing (se chapter 2.2.1). Request to send/Clear to send (RTS/CTS) [15] is a technique that STA’s can use before transmit data frames.
Figure 3.2: hidden terminal problem. (Source: [16].)
If the size of a data packet is larger than RTS/CTS then RTS frames is transmitted first followed by CTS frame and these frames include data of how long it takes to transmit the data frame and ACK response, so STA’s hearing transmitting STA’s nearby not start any transmission since their Network Allocation Vector (NAV) is set to zero. NAV is a timer used in this process [15]. See figure below.
Figure 3.3: RTS/CTS scheme. (Source: [15].)

WLAN ‐ performance in IEEE 802.11n Jari Heiskanen
INTERFERENCE 2008‐06‐23
Based on the Mid Sweden University template for technical reports, written by Magnus Eriksson, Kenneth Berg and Mårten Sjöström.
15
3.1.4 Radio Wave Propagation
Radio Wave Propagation is a term explaining how radio waves are behaving when propagating between two points on the earth. Inverse square law [3] is the term for power density of an electromagnetic wave and increasing distance decreases power of the radio wave. Scattering [10] is a term when objects interferes the signal in outdoor environment like rain, planes and light. Diffraction [10] is the term when radio waves are bent around objects with sharp edges. Reflection [10] is another term meaning absorption or reflected from surfaces. Perfect reflection is when all the signal reflexes but some materials only reflect a part of the signal. In indoor and outdoor environment there are a term called multipath propagation [10] when radio signal try to reach a receiving antenna from two or more ways. The effect of this phenomenon is interference and phase shifting key causing Raleyigh fading, described in a previous chapter, and cause errors like Intersymbol Interference (ISI) [10]. OFDM (chapter 2.5.1) and Rake receivers [10] are used to defeat these errors.
3.1.5 Free Space Path Loss
Free Space Path Loss [10] is the loss of signal over distance. When signal moves through space power decreases proportional to the wavelength. 6 dB increases doubles the performance and 6 dB decreases reduce power with ½ [3]. There is a decrease of signal through obstacles as well but in indoor environment it is not easy to calculate path loss because of the variety of objects blocking signals.

WLAN ‐ performance in IEEE 802.11n Jari Heiskanen
Methodology 2008‐06‐23
Based on the Mid Sweden University template for technical reports, written by Magnus Eriksson, Kenneth Berg and Mårten Sjöström.
16
4 Methodology This report includes WLAN analyzer in testing to measure impacts from interference. Mentioned in chapter 1.1 there could occur problems in 2.4 GHz band with lot of signals in multipath environment and other signals interfering. Started to scan environment with air magnet for interfering signals in reference test to check for interfering signals but could not see any unusual decrease of signal or detection of AP’s nor STA’s.
Experiments will include a reference test where no impacts on the signal affecting WLAN and an experiment test in normal home environment where signal will be affected with different kinds of interference to see what impacts there are. Interference in normal home environment is considered as microwaves, Bluetooth, access points in the surrounding environment and noise. Mentioned interference is so to speak active interference and there is passive interference such as walls, floor and roof made by concrete, steel and bricks. Tools for testing are as men‐tioned in chapter 1.3, so choice for the Xtreme notebook express card Dlink 643 as equipment is based on air magnet 7.5 since there are few network cards compatible for this software. Laptop is not considered as crucial in this test. AP is Dlink DIR‐635. Bluetooth equipment is Ericsson phones P990 and P800. There are eventually some drawbacks in this method since interference in detail can’t be seen in an obvious way meaning that there could be more specific analysis of interference with other software.
Questions in chapter 1.1 with interference against other cells, multipath propagation, access points close to each other and hidden terminal problem will be measured with signal distribution test, performance test and interference tests. See chapter 5 results.
First of all there are three reference tests where no interference or obstacles are in way for the signal, so called Line Of Sight and the measurement area is a room with 3x5 square metres and this is not in the apartment. The AP is at close range for optimal signal quality approximately 0.5 metres. I made three measurements interference score, signal distribution and performance. This is considering as input variable were nothing should affect the signal. The second measurement

WLAN ‐ performance in IEEE 802.11n Jari Heiskanen
Methodology 2008‐06‐23
Based on the Mid Sweden University template for technical reports, written by Magnus Eriksson, Kenneth Berg and Mårten Sjöström.
17
test was in a standard home environment and the measurement area is an apartment of 11m by 7m with included a hallway, living room, dining room, bathroom and two bedrooms. In all rooms there is stan‐dard furniture like bookshelf’s, chairs, and tables and so on. Walls, roof and floor is made of concrete, steel and bricks. This is considered as output variable were other signals eventually affect the input variable. See figure below.
Figure 4.1: Home environment area. (Source: [1].)
The access point will be placed in the hallway at high level with no obstacle close to the transmitters and my two measurement points will be in living room (Dagrum) and kitchen (kök) and there is no line of sight environment.

WLAN ‐ performance in IEEE 802.11n Jari Heiskanen
Results 2008‐06‐23
Based on the Mid Sweden University template for technical reports, written by Magnus Eriksson, Kenneth Berg and Mårten Sjöström.
18
5 Results In this chapter I will present results from my measurements in my WLAN. All text to measurements refers to appendix B where figures for results are.
First of all there are three measurements from the reference test begin‐ning with interference score and then signal distribution and at last performance. Since there are now interference on this channel the interference score shows no amount of signal interference. The upper graph to the right shows direct impact on network’s performance so if there are 30 as score it represents 30% bandwidth consumption or disruption by network interference [21]. Score is calculated as 0 at the bottom and 10 at the top. Score <=5 is considered as low and in this case it is at 0 (Appendix B, figure 5.1).
All interfering devices such as Bluetooth, microwave and AP’s are turned off during reference test. Tests 5.1‐5.12 is made with auto channel adjustment meaning Dlink AP make this adjustment automatically by checking channels nearby and then select the channel with lowest users [22]. The last test, test 5.13, shows manually configured AP, auto chan‐nel adjustment was turned off so there were in that test 4 AP’s within same channel.
Appendix B, Figure 5.1: Air magnet measurement, Test‐Reference 1. (Source: [18].) All AP’s, WLAN devices, STA’s etc, displays total amount of standard interference [21]. Non‐802.11 interference is dis‐played as noise at lower right graph. Signal/Noise score is calculated as ‐100 dBm at bottom meaning there is no noise in this graph and ‐10 dBm at the top [21]. Signal strength shows it is approximately ‐15 dBm to ‐10 dBm where 0 dBm is 100% strength. Every line in this graph shows 10 dBm in difference [21]. Hidden terminal problem (3.1.3) is displayed at left lower screen and if it is <=1 device there is no or low problem for hidden terminal.

WLAN ‐ performance in IEEE 802.11n Jari Heiskanen
Results 2008‐06‐23
Based on the Mid Sweden University template for technical reports, written by Magnus Eriksson, Kenneth Berg and Mårten Sjöström.
19
Appendix B, Figure 5.2: Air magnet measurement, Test‐Reference 2. (Source: [18].)This tool detects RF signal problems such multipath [21] (3.1.4). The yellow cluster of dots shown in the figure above represents RF signal per packet [21]. If the signal is good the dots should be all close together at narrow range meaning RF signals are consistent in strength with little variation and if the opposite occurs with yellow dots scattered all over the screen then the signal strength is varying with some kind of signal problem [21]. Further there are signal strength in green and noise in red colour. The score is calculated as ‐100 dBm at bottom and ‐10 dBm at the top. Signal strength shows it is approxi‐mately ‐15 dBm to ‐10 dBm where 0 dBm is 100% strength. Every line in this graph shows 10 dBm in difference.
Appendix B, Figure 5.3: Air magnet measurement, Test‐Reference 3. (Source: [18].)This tool measures maximum WLAN bandwidth and tests the AP from a given location, transmission speed, RTS/CTS (3.1.3) activation, retransmission and fragmentation configuration [21]. This test sends data frames to the AP and waits for acknowledgment [21]. Throughput is presented by kb/s with 0 kb at bottom and in this screen 750 kb at top and there is lost frames, frame fragmentation (2.2.1) and frame retries to view so kb/s is 560 and packets per/s is 47.
Appendix B, Figure 5.4: Air magnet measurement in living room 1. (Source: [18].)Testing in home environment with lot of AP’s STA’s in the surroundings and testing at a distance of approximately 20 metres from the AP in this test. There are a slight interfering score but not to inten‐sive and Signal/Noise shows signal strength at about 60 dBm and with noise rising at some times and that is causing by non‐802.11 signals [21].
Appendix B, Figure 5.5: Air magnet measurement in living room 2. (Source: [18].)The signal is varying with signal drops down to ‐100 dBm and the signal strength has fallen to between ‐40—50 dBm. There is some data packets lying off this variation meaning signal problem occur. This is multipath [21], (3.1.4) environment with OFDM (chapter 2.5.1) as a transmission technique to combat multipath.
Appendix B, Figure 5.6: Air magnet measurement in living room 3. (Source: [18].)Here the signal shows that kb/s is 585 and packets per/s is 49 so there is a rise in this test according to reference test more data is

WLAN ‐ performance in IEEE 802.11n Jari Heiskanen
Results 2008‐06‐23
Based on the Mid Sweden University template for technical reports, written by Magnus Eriksson, Kenneth Berg and Mårten Sjöström.
20
transferring. This screen shows 0 bytes at the bottom and 1000 bytes at the top.
Appendix B, Figure 5.7: Air magnet measurement in kitchen 1. (Source: [18].)This test included a microwave turned on and the meas‐urements showed some interfering at upper right screen. The lower right screen should not show any noise from non‐802.11 devices so the noise level is at ‐100 dBm. There is signal drop meaning the signal lost all power here. Interference is considered as low since it is <=5 the top score were approximately 2, 2 at highest level.
Appendix B, Figure 5.8: Air magnet measurement in kitchen 2. (Source: [18].)There is problems with the signal with many drops and data packets on some areas not to narrow but not considered as fatal [21].
Appendix B, Figure 5.9: Air magnet measurement in kitchen 3. (Source: [18].)There was no major difference in this test in comparison to the test in living room. Packets/second was 49 and Kbytes/second 585 so it showed no changes between these two tests.
Appendix B, Figure 5.10: Air magnet measurement with Bluetooth 1. (Source: [18].)There is not too much interference when Bluetooth was turned on since it is considered to be low <=5. Score went up to at maximum at 1 meaning there was 1% network interference. There was signal loss under the test decreasing to ‐100 dBm under a while.
Appendix B, Figure 5.11: Air magnet measurement with Bluetooth 2. (Source: [18].)This screen shows disturbances in signal strength ‐60—70 dBm. Noise level were ‐85 dBm first but decreased after that. RF signal shows some multipath problems since data packets are spread and not at narrow range as at the reference test.
Appendix B, Figure 5.12: Air magnet measurement with Bluetooth 3. (Source: [18].)Only difference between this measurement with Bluetooth activated and the other measurements is the data rate Kbytes/second here it is lower at 581 Kbytes/second.

WLAN ‐ performance in IEEE 802.11n Jari Heiskanen
Results 2008‐06‐23
Based on the Mid Sweden University template for technical reports, written by Magnus Eriksson, Kenneth Berg and Mårten Sjöström.
21
Appendix B, Figure 5.13: Air magnet measurement with co‐channel 13. (Source: [18].)This measurement shows co‐channel interference (3.1.3). At normal circumstances an auto channel adjustment [22] is done so a channel with the lowest users within that channel is selected but in this case manually configuration was made to select channel 11 since there were most users. All visual AP’s on channel 11 resulted in increasing interference with tops off 50 % network interfering on this channel. Further there were increased noise and signal drops seen at lower right screen. No hidden devices were detected.

WLAN ‐ performance in IEEE 802.11n Jari Heiskanen
Results 2008‐06‐23
Based on the Mid Sweden University template for technical reports, written by Magnus Eriksson, Kenneth Berg and Mårten Sjöström.
22
6 Analysis Differences between a, b, g and n standard are mostly in the algorithms concerning MAC and PHY layer (chapter 2.2.1). In n standard there been developments in MAC layer by reducing protocol overhead and DCF based on CSMA/CA reduces the collision of frames (chapter 2.2.1). PHY has sub layers PLCP and PMD to help MAC layer to map into the PLCP and performs modulation and demodulation of air media. To combat deep fade, development of space time codes has been implemented in MIMO (chapter 2.3) technology. OFDM (chapter2.5.1) is a transmission technique minimizing interference among channels nearby and in combination with CDMA it allocates other channels in surroundings but in extreme environments with more than 20 AP’s in surroundings there should be some more effectively algorithms. Interference in WLAN is the major problem for homeRF with problems such as thermal noise in all transmission media. Fading in multipath environment is responsible for signal variation seen in figures in result area. Co‐channel interference rises since more usage of AP’s today and results showed problem with signal drops, noise and so on. Hidden node did not give any problem in apartment test but that could perhaps be more accurate if measured with a goal to just check for hidden node. Space path loss is signal loss over distance and so when wavelength decrease with 6dB power reduces with ½. In indoor environment there are lot of obstacles so the exact result of decrease in power is not easy to analyze but shows it could be lot of decrease in signal strength.

WLAN ‐ performance in IEEE 802.11n Jari Heiskanen
7 Conclusion and discussion 2008‐06‐23
Based on the Mid Sweden University template for technical reports, written by Magnus Eriksson, Kenneth Berg and Mårten Sjöström.
23
7 Conclusion and discussion My conclusion of this work has to be it was interesting test and informative. There were lot of information to study and to pick up the essentials were not easy. My idea was to focus on 802.11 n standard and present interesting parts of technology that had been developed since a, b, g standards. In this thesis I present coding/transmission techniques and antenna development where MIMO had led data rates and performance to higher levels were using multiple antennas. The main aim of this report was to present work done at this moment in previous mentioned areas and to look ahead what way interference affect the 802.11 n standards. Co‐channel interference was in my measurements the biggest problem and this area should have more done for future work. Interference in WLAN I consider is the major problem for homeRF with problems such as thermal noise in all transmission media but I don’t see that as fatal according to my measurements. Results concerning interference in 2.4 GHz were not fulfilled since there were no detailed results including spectrum analyzer so this work should also be done in the future. Answer to the questions I looked at is answered below and it is conclusions from the text in this thesis from previous chapters. Questions I look further into were: ‐In usual mobile systems base stations do not have information about the position of mobile units inside a cell so the signal is sending in all directions within the cell to get covered, the result is power, transmis‐sion loss and interference against other cells using the same frequen‐cies and it is same with antennas receiving signals with noise as result. What technique is used to decrease these interferences?
MIMO (chapter 2.3) increase power consumption, hardware and signal processing, transmitter and receiver component size. Spatial Diversity (chapter 2.3.1) is a technique used in MIMO to manipulate characteris‐tics of a wireless link and increase data throughput and link perform‐ance to defeat channel fading. OFDM (chapter 2.5) is robust against nearby channels because interference affects only a small percentage of the sub carrier.

WLAN ‐ performance in IEEE 802.11n Jari Heiskanen
7 Conclusion and discussion 2008‐06‐23
Based on the Mid Sweden University template for technical reports, written by Magnus Eriksson, Kenneth Berg and Mårten Sjöström.
24
‐Multipath propagation is a problem in wireless communication but is there a solution in IEEE 802.11 n?
When signal tries to reach a receiving antenna from two or more ways multipath propagation (figure 4.10), (3.1.4) can occur. The effect of this phenomenon is interference and cause errors like Intersymbol Interfer‐ence. OFDM (chapter 2.5.1) and Rake receivers are used to defeat these errors. Purpose with OFDM is to minimize interference among channels nearby others in frequency and cope with conditions like fading (3.1.2) due multipath.
‐What is the impact on WLAN environment if two or more Access Points (AP) is standing close to each other?
Reused pattern is a technique for transmitters transmitting on different channels. Base stations acknowledgements a frame after a transmission are successful with SIFS and protected against other STA’s (2.2.1). In case of multiple STA’s trying to access the channel CSMA/CA reduces the collision of frames (2.2.1). In my measurements there was increase of interference from 802.11 devices and noise levels arise and some signal drops so the signal actually disappeared during measured time (figure 5.13).
‐Hidden terminal is a big problem for wireless but how is that prob‐lem avoided?
Hidden terminal problem in the n standard has a solution in the data link layer or more specific MAC. MAC is software in data link layer (2.2.1) and with the 4 way handshake protocol including RTS/CTS (3.1.3). When an STA hear another STA transmit nearby this technology defeat hidden terminal problem. STA’s use this technique to combat this problem. In my own measurements there were no hidden terminals seen in air magnet software I was using (figure 5.2).

WLAN ‐ performance in IEEE 802.11n Jari Heiskanen
7 Conclusion and discussion 2008‐06‐23
Based on the Mid Sweden University template for technical reports, written by Magnus Eriksson, Kenneth Berg and Mårten Sjöström.
25
7.1 Future work
At the end of this thesis work I thought there is lot of techniques and issues concerning interfering problems. My work just shows a broad shallow part of this problem area. After I finished my experiments for the result chapter my concern were the software I used since it don’t analyze in detail like BER and so on. With unlimited resources there could be deeper analyzes from MAC layer or even some kind of algo‐rithm development or comparison with different algorithms. Perhaps I could compare different hardware equipment as well since I only used one brand in this test according to the scope chapter. If I had a computer scientific laboratory I would do experiments with totally controlled surroundings were I should aim at one specific interfering problem. My spontaneously thoughts is that WLAN area has more developing going on and perhaps manufacturers have too much of wishful thinking when their measurements of data rates shows incredible results and their reports often don’t include natural environment with lot of interfering problems. Deeper analysis with spectrum analyzer in laboratory envi‐ronment could be done for future work.

WLAN ‐ performance in IEEE 802.11n Jari Heiskanen
References 2008‐06‐23
Based on the Mid Sweden University template for technical reports, written by Magnus Eriksson, Kenneth Berg and Mårten Sjöström.
26
References [1] G. Tsoulos, MIMO System Technology for Wireless Communications.
London: Taylor & Francis, 2006.
[2] M. Jankiraman, Space‐time codes and MIMO systems. Boston: Artech House, 2005.
[3] Oreilly, 802.11 Wireless Networks: The complete guide, http://safari.oreilly.com/0596100523/
[4] IEEE Trans. on Communications, vol. 54, no. 5, pp. 943‐954, ʹʹBenefit of Pattern Diversity Via 2‐element Array of Circular Patch Antennas in Indoor Clustered MIMO Channels,ʹʹ”. See http://users.ece.utexas.edu/~rheath/research/mimo/antenna/. Published May 2006.Received 2008‐02‐16.
[5] IEEE P802.11 ‐ TASK GROUP N ‐ MEETING UPDATE: received 2008‐02‐25, http://www.ieee802.org/11/
[6] Department of Communications Engineering, http://www.ant.uni‐bremen.de/research/sdma/stc/sttc.html
[7] P. Ramjee, OFDM for wireless communications. Boston: Artech house, 2004.
[8] The alamouti code, http://www.eng.newcastle.edu.au/~c2104305/mimo.html Re‐cieved 2008‐03‐03
[9] D‐LINK LANSERAR NYTT TRÅDLÖST HEMMANÄTVERK ”Sex gånger snabbare än dagens standard”, http://www.dlink.se, Recieved, 2008‐02‐10
[10] P.Stavroulakis, Interference analysis and reduction for wireless systems. Boston: Artech House, 2003.
[11] Wi‐Fi CERTIFIED™ 802.11n draft 2.0: Longer‐Range, Faster‐Throughput, Multimedia‐Grade Wi‐Fi® Networks, Received 2008‐03‐10

WLAN ‐ performance in IEEE 802.11n Jari Heiskanen
References 2008‐06‐23
Based on the Mid Sweden University template for technical reports, written by Magnus Eriksson, Kenneth Berg and Mårten Sjöström.
27
[12] CSMA/CA Protocol, www.zytrax.com/tech/ wire less/802_mac.htm, Received 2008‐03‐12
[13] PLCP overview, www.cs.wustl.edu/.../ ftp/wireless_lans/fig07.gif, Received 2008‐03‐14
[14] Medium access overview, www.acm.org/.../xrds9‐4/ wirelessevo‐lution.html, Received 2008‐03‐15
[15] RTS/CTS, http://softwarecommunity.intel.com/articles/eng/3275.htm Re‐ceived 2008‐03‐17
[16] Hidden node problem, 202.29.21.8/~s4728451008/pic/13.gif, Received 2008‐03‐17
[17] Apartment schedule, http://www.mkbfastighet.se/kundentre/templates/myBlueprint.aspx?id=523, Received 2008‐04‐06
[18] Airmagnet measurement, Received 2008‐04‐26—2008‐04‐30
[19] Airmagnet, www.airmagnet.com, Received 2008‐02‐01
[20] http://www.dlink.se, Received 2008‐05‐27
[21] http://www.ieee.org/portal/site, Received 2008‐05‐28

WLAN ‐ performance in IEEE 802.11n
Appendices 2008‐06‐23
Jari Heiskanen
Based on the Mid Sweden University template for technical reports, written by Magnus Eriksson, Kenneth Berg and Mårten Sjöström.
28
Appendix A
Abbreviations
AP Access Point
AWGN Additive White Gaussian Noise
BER Bit Error Rate
BLAST Bell Labs Layered Space‐Time Architecture
BS Base Station
CDMA Code Division Multiple Access
CSMA/CA Carrier Sense Multiple Access/Collision Avoidance
CW Contention Window
DCA Dynamic Channel Allocation
DCF Distributed coordination Function
DIFS DCF Inter Frame Space
DLL Data Link Layer
FCA Fixed Channel Allocation
HT Higher Throughput
IEEE Institute of Electrical and Electronics Engineers
LOS Line of Sight
MAC Medium Access Control
MIMO Multiple Input Multiple Output
OFDM Orthogonal Frequency Division Multiplexing
WLAN ‐ performance in IEEE 802.11n
Appendices 2008‐06‐23
Jari Heiskanen
Based on the Mid Sweden University template for technical reports, written by Magnus Eriksson, Kenneth Berg and Mårten Sjöström.
29
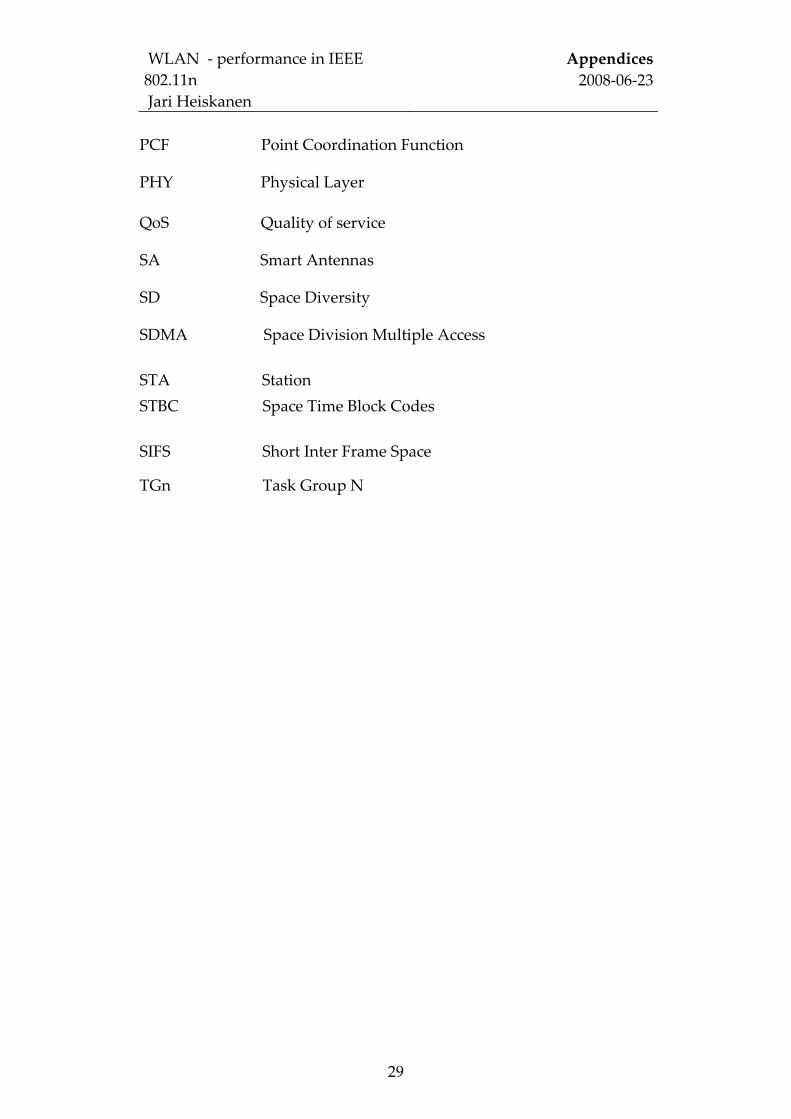
PCF Point Coordination Function
PHY Physical Layer
QoS Quality of service
SA Smart Antennas
SD Space Diversity
SDMA Space Division Multiple Access
STA Station STBC Space Time Block Codes
SIFS Short Inter Frame Space
TGn Task Group N

WLAN ‐ performance in IEEE 802.11n
Appendices 2008‐06‐23
Jari Heiskanen
Based on the Mid Sweden University template for technical reports, written by Magnus Eriksson, Kenneth Berg and Mårten Sjöström.
30
Appendix B Figures from results
Figure 5.1: Air magnet measurement, Test‐Reference 1. (Source: [18].)
Figure 5.2: Air magnet measurement, Test‐Reference 2. (Source: [18].)

WLAN ‐ performance in IEEE 802.11n
Appendices 2008‐06‐23
Jari Heiskanen
Based on the Mid Sweden University template for technical reports, written by Magnus Eriksson, Kenneth Berg and Mårten Sjöström.
31
Figure 5.3: Air magnet measurement, Test‐Reference 3. (Source: [18].)
Below follows three tests in home environment with microwave and Bluetooth turned off. These tests have AP’s in surroundings affecting the WLAN.
Figure 5.4: Air magnet measurement in living room 1. (Source: [18].)

WLAN ‐ performance in IEEE 802.11n
Appendices 2008‐06‐23
Jari Heiskanen
Based on the Mid Sweden University template for technical reports, written by Magnus Eriksson, Kenneth Berg and Mårten Sjöström.
32
Figure 5.5: Air magnet measurement in living room 2. (Source: [18].)
Figure 5.6: Air magnet measurement in living room 3. (Source: [18].)

WLAN ‐ performance in IEEE 802.11n
Appendices 2008‐06‐23
Jari Heiskanen
Based on the Mid Sweden University template for technical reports, written by Magnus Eriksson, Kenneth Berg and Mårten Sjöström.
33
Below follows three tests with AP’s in surroundings and microwave turned on.
Figure 5.7: Air magnet measurement in kitchen 1. (Source: [18].)
Figure 5.8: Air magnet measurement in kitchen 2. (Source: [18].)

WLAN ‐ performance in IEEE 802.11n
Appendices 2008‐06‐23
Jari Heiskanen
Based on the Mid Sweden University template for technical reports, written by Magnus Eriksson, Kenneth Berg and Mårten Sjöström.
34
Figure 5.9: Air magnet measurement in kitchen 3. (Source: [18].)
Here follows three tests with AP’s turned on, Bluetooth turned on with traffic between Ericsson phone P990 and P800 in close range and be‐tween AP and laptop. Microwave is turned off. Measurement is made in living room.
Figure 5.10: Air magnet measurement with Bluetooth 1. (Source: [18].)

WLAN ‐ performance in IEEE 802.11n
Appendices 2008‐06‐23
Jari Heiskanen
Based on the Mid Sweden University template for technical reports, written by Magnus Eriksson, Kenneth Berg and Mårten Sjöström.
35
Figure 5.11: Air magnet measurement with Bluetooth 2. (Source: [18].)
Figure 5.12: Air magnet measurement with Bluetooth 3. (Source: [18].)

WLAN ‐ performance in IEEE 802.11n Jari Heiskanen
Appendices 2008‐06‐23
Based on the Mid Sweden University template for technical reports, written by Magnus Eriksson, Kenneth Berg and Mårten Sjöström.
36
This last test shows co‐channel interference like tests in figure 5.1, 5.4, 5.7, and 5.10 but with the difference that multiple AP’s transmitting within the same channel. Bluetooth and microwave are turned off.
Figure 5.13: Air magnet measurement with co‐channel 13. (Source: [18].)


![[Heiskanen Weikko a.] Geodesia Fisica](https://static.fdocuments.in/doc/165x107/577cd09f1a28ab9e7892b3bd/heiskanen-weikko-a-geodesia-fisica.jpg)


