W.L. LASSITER, JR. EARLY COLLEGE HIGH SCHOOL · W.L. LASSITER, JR. ... •Score summaries for SAT...
36
W.L. LASSITER, JR. EARLY COLLEGE HIGH SCHOOL School Number 90 August 7, 2018
-
Upload
truongdang -
Category
Documents
-
view
219 -
download
0
Transcript of W.L. LASSITER, JR. EARLY COLLEGE HIGH SCHOOL · W.L. LASSITER, JR. ... •Score summaries for SAT...
W.L. LASSITER, JR. EARLY COLLEGE HIGH SCHOOL
School Number 90 August 7, 2018
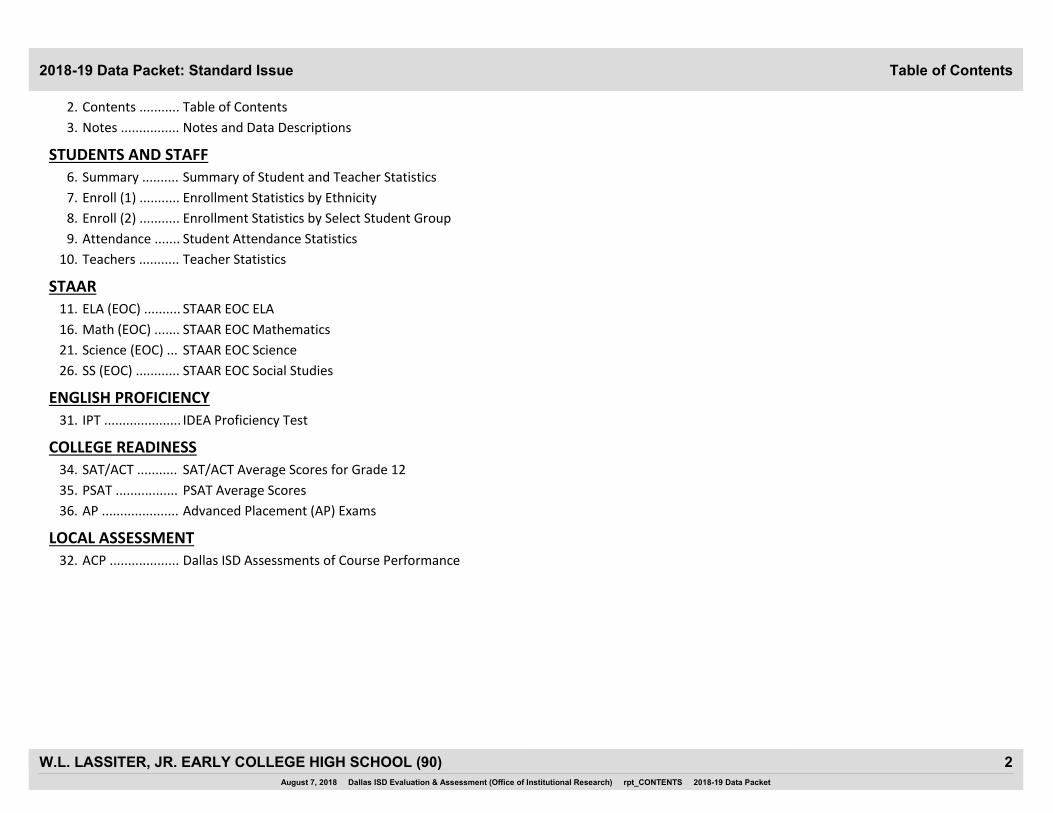
1 Table of Contents2018-19 Data Packet: Standard Issue
2. Contents ........... Table of Contents
3. Notes ................ Notes and Data Descriptions
STUDENTS AND STAFF
6. Summary .......... Summary of Student and Teacher Statistics
7. Enroll (1) ........... Enrollment Statistics by Ethnicity
8. Enroll (2) ........... Enrollment Statistics by Select Student Group
9. Attendance ....... Student Attendance Statistics
10. Teachers ........... Teacher Statistics
STAAR
11. ELA (EOC) .......... STAAR EOC ELA
16. Math (EOC) ....... STAAR EOC Mathematics
21. Science (EOC) ... STAAR EOC Science
26. SS (EOC) ............ STAAR EOC Social Studies
ENGLISH PROFICIENCY
31. IPT ..................... IDEA Proficiency Test
COLLEGE READINESS
34. SAT/ACT ........... SAT/ACT Average Scores for Grade 12
35. PSAT ................. PSAT Average Scores
36. AP ..................... Advanced Placement (AP) Exams
LOCAL ASSESSMENT
32. ACP ................... Dallas ISD Assessments of Course Performance
August 7, 2018 Dallas ISD Evaluation & Assessment (Office of Institutional Research) rpt_CONTENTS 2018-19 Data Packet
2W.L. LASSITER, JR. EARLY COLLEGE HIGH SCHOOL (90)
3
Notes, Definitions, and Data DescriptionsNotes
TELPAS: Performance standards for the new 2018 TELPAS were not available at publication. New data packets will be generated when all TELPAS composite
ratings and yearly progress indicators can be reported.
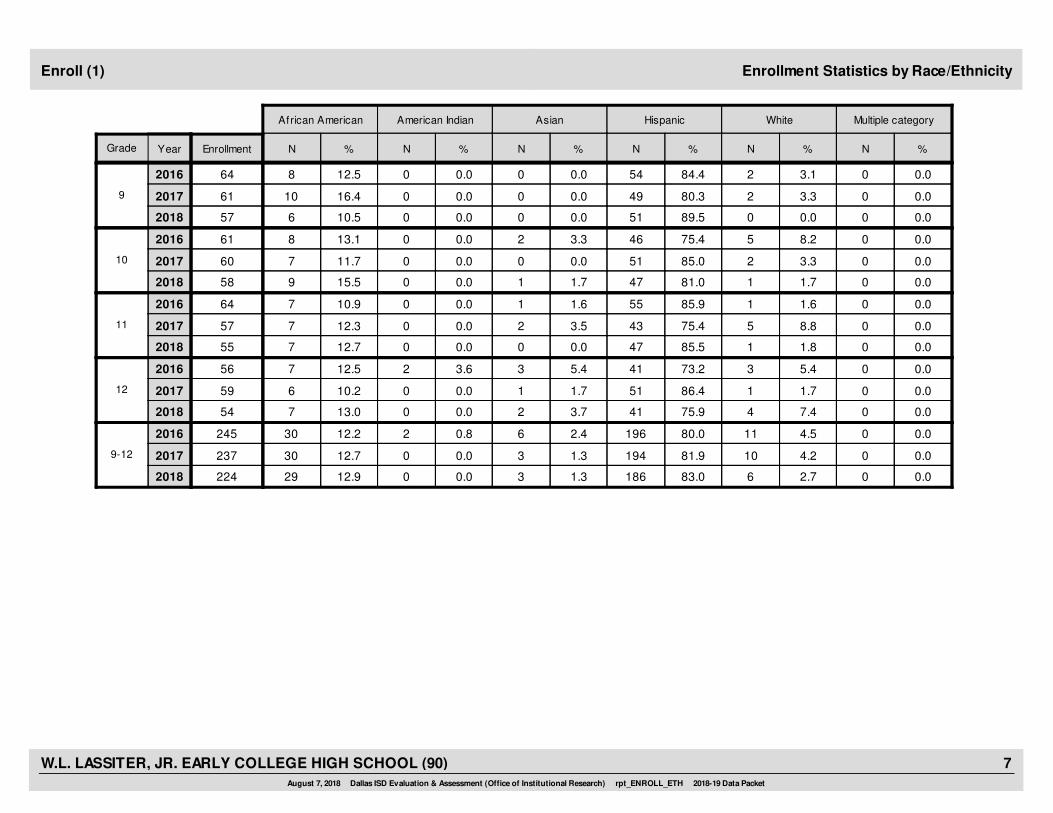
Student percentages are computed as the percentage of total student enrollment.•
Additional statistics are available in ENROLLMENT and TEACHER reports.•
Teacher demographics and location assignments are from the district's Public Education Information Management System (PEIMS) submission to the TEA.•
2018-19 DATA PACKET INFORMATION
2017-18 SCHOOL SUMMARY
Race/ethnic categories are based on the latest federal standards for ethnicity and race reporting, though some categories have been combined due to small
group sizes. Students reporting their ethnicity as “Hispanic” are not counted in any race category.
•
Statistics are based on the school's enrollment at the end of the fifth six-weeks grading period.•
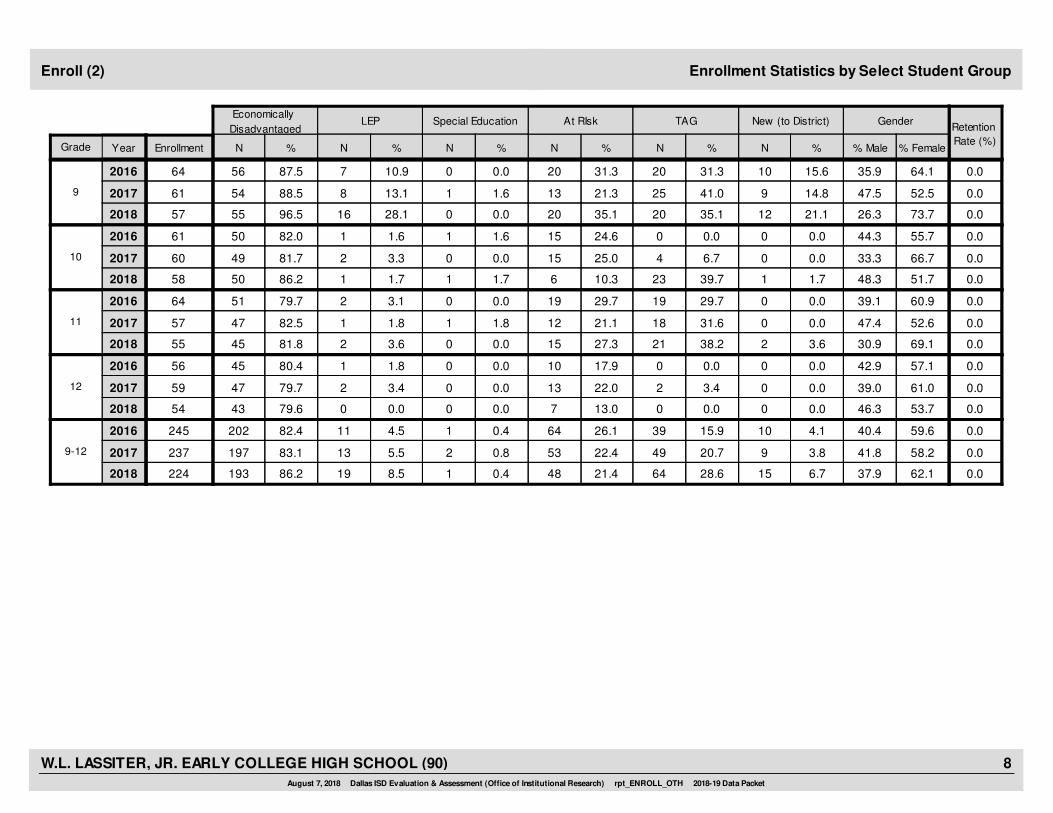
The “retention rate” is the percentage of students in the same grade at the end of the fifth six-weeks grading period for both 2016-17 and 2017-18.•
“New” students were new to the district in 2017-18. They are counted as new if not enrolled in a district campus before the last day of the 2016-17 school year.•
ENROLLMENT
• Statistics are based on student attendance through the end of the sixth six-weeks grading period (the end of the school year).
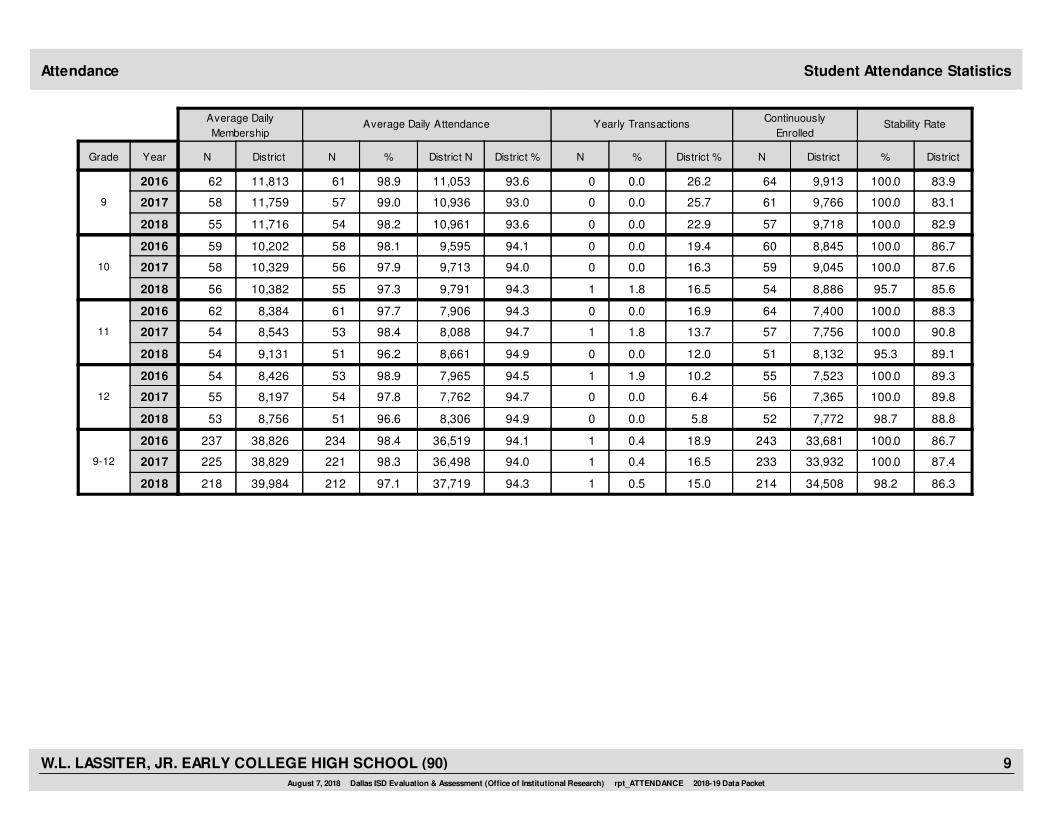
• “Average daily membership” is the total number of school days students were SCHEDULED or ENROLLED divided by the number of school days in the year.• The “average daily attendance” number (N) is the total number of school days students were IN ATTENDANCE divided by the number of school days in the
year. The “average daily attendance” percentage (%) is the average attendance rate. For each student, the number of days attended is divided by the number
of days enrolled. This rate is then averaged across students.
• The number (N) of “yearly transactions” is the total number of transfer and withdrawal transactions in the school year. The percentage (%) is the number of
transactions divided by “average daily membership,” which gives (on average) the percentage of the membership associated with a transaction.
• “Continuously enrolled” students are enrolled and in attendance for a minimum number of instructional days in at least one course at the school between the
beginning of the school year and the first day of the main STAAR testing period. The minimum number varies depending on the school year's calendar.
• The “stability rate” is the number of continuously enrolled students divided by “average daily membership.”
ATTENDANCE
August 7, 2018 Dallas ISD Evaluation & Assessment (Office of Institutional Research) rpt_NOTES 2018-19 Data Packet
3W.L. LASSITER, JR. EARLY COLLEGE HIGH SCHOOL (90)
3
Notes, Definitions, and Data DescriptionsNotes
• Teacher demographics and location assignments are from the district's Public Education Information Management System (PEIMS) submission to the TEA.
TEACHERS
• Teacher absences counted towards the average do not include vacation days.
• Retention rate is the percentage of the prior year's teachers who continued at the school. The rate for a school year is computed with numerator “# of teachers
assigned to the school both that year and the prior year” and denominator “# of teachers assigned to the school for the prior year.” Teachers from the prior
year are not included in the statistic if they changed to non-teaching positions within the district.
Cells marked with an asterisk (*) indicate five or fewer students were tested. Blank cells indicate no students were tested.•
•
•
•
Student group assignments are from the district's Public Education Information Management System (PEIMS) submission to the TEA.
Statistics by reporting category are averages for all students (across student groups and genders).
“Average percentage correct” is computed as follows: For each student, divide number of items correctly answered by total number of items in test section,
then average resulting percentages across all students. For short answers on EOC English tests, an “average rating” is presented; STAAR EOC short answers are
rated on a scale of 0 to 3. For written compositions on writing tests, “average score points” is presented. Additional details provided in report footnotes.
• EOC statistics are based on scores from students testing for the first time during fall or spring administrations.
• STAAR statistics for years prior to 2016-17 include results from all STAAR tests (STAAR, STAAR A, and STAAR L) for comparability to statistics beginning 2016-17,
when STAAR A and STAAR L were discontinued.
STATE OF TEXAS ASSESSMENT OF ACADEMIC READINESS (STAAR)
• Performance standard labels have changed. “Approached Grade Level” is comparable to Level 2: Satisfactory (2015-16 standard). “Met Grade Level” is
equivalent to Level 2: Satisfactory (final standard). “Mastered Grade Level” is equivalent to Level 3: Advanced. Statistics for a performance level (such as
“Percentage Approached Grade Level” ) include all scores at or above that level.
•
• Raw scores on the ACPs (percentage of items correct) are scaled each year to maintain similar annual passing rates for the district.
ACPs are semester exams administered in grades K-12. Not all courses have ACPs. In secondary grades, ACP scores account for a portion of students' semester
grades (10% at middle and 15% at high). “Average course mark (no ACP)” is computed from semester grades before factoring in ACP scores. In elementary
grades, ACP results account for 5% of students' semester grades for core courses; course-grade statistics are not reported in packets for elementary grades.
• A scale score of at least 70% is required to pass an ACP. For grade levels with numeric grading, a course mark of at least 70% is required to pass a course.
Cells marked with an asterisk (*) indicate five or fewer students were tested. Blank cells indicate no students were tested.•
DALLAS ISD ASSESSMENTS OF COURSE PERFORMANCE (ACP)
• Statistics are computed separately for Semester 1 and Semester 2 tests; time of administration during the school year is not relevant. Results from tests
written for different school years are not combined.
August 7, 2018 Dallas ISD Evaluation & Assessment (Office of Institutional Research) rpt_NOTES 2018-19 Data Packet
4W.L. LASSITER, JR. EARLY COLLEGE HIGH SCHOOL (90)
3
Notes, Definitions, and Data DescriptionsNotes
•
•
A redesigned SAT was introduced in March 2016. Students' scores from old administrations were converted to equivalent section scores on the new SAT to
compute statistics for 2016 Grade 12 students. A redesigned PSAT was introduced in Fall 2015. Prior-year SAT and PSAT statistics are not comparable to
current-year statistics and are not reported. For information on the new tests, see https://www.collegeboard.org.
For SAT and ACT, “Percent Tested” is computed with “Number Tested” as numerator and, as demoninator, Grade 12 “Enrollment” as reported in Enrollment
(1) and Enrollment (2) reports. For PSAT, the denominator for “Percent Tested” is grade-level enrollment as reported in Enrollment reports.
• SAT scores range from 200 to 800; ACT scores range from 0 to 36. SAT college and career readiness benchmarks“represent a 75 percent likelihood of achieving
at least a C grade in a first-semester, credit-bearing college course in a related subject” (The College Board). The benchmarks are 480 for the Evidence-Based
Reading and Writing section score and 530 for the Mathematics section score. (These benchmark scores are applicable only to scores earned on the new SAT,
first administered in March 2016.) ACT's college readiness benchmarks are the minimum scores indicating a 50 percent chance of earning a B or better (and 75
percent chance of earning a C or better) in the corresponding college course. ACT benchmarks are available for four tests: English, 18; reading, 21;
mathematics, 22; science, 24.
• New PSAT scores range from 200 to 800. PSAT is administered once each year in the fall. District students taking PSAT are tested at their schools. Statistics for a
grade level are based on all students in that grade level in the fall with a PSAT score for that year.
• AP scores range from 1 to 5. A 3 is a “qualifying score”.
Cells marked with an asterisk (*) indicate five or fewer students were tested. Blank cells indicate no students were tested.•
• Score summaries for SAT and ACT contain all scores available for the schoool year at the time of publication.
COLLEGE READINESS
• The SAT and ACT are administered throughout the year by The College Board and ACT, Inc. at national testing sites and students sit for these voluntarily as
often as they choose. The district provides a school-day administration of each test (SAT to Grade 11 students in spring and ACT to Grade 12 students in fall). If
a student has results from multiple administrations, only the latest scores are used.
• PSAT/NMSQT college and career readiness benchmarks“represent a 75 percent likelihood of achieving at least a C grade in a first-semester, credit-bearing
college course in a related subject” (TCB). The College Board has determined PSAT benchmark scores separately for each grade and section, Evidence-Based
Reading and Writing and Mathematics. Grade 9: 410 and 450. Grade 10: 430 and 480. Grade 11: 460 and 510. (These benchmarks are applicable only to scores
earned on the new PSAT, first administered in the fall of 2015.)
August 7, 2018 Dallas ISD Evaluation & Assessment (Office of Institutional Research) rpt_NOTES 2018-19 Data Packet
5W.L. LASSITER, JR. EARLY COLLEGE HIGH SCHOOL (90)
Summary 2017-18 Group Summary Statistics
Grade
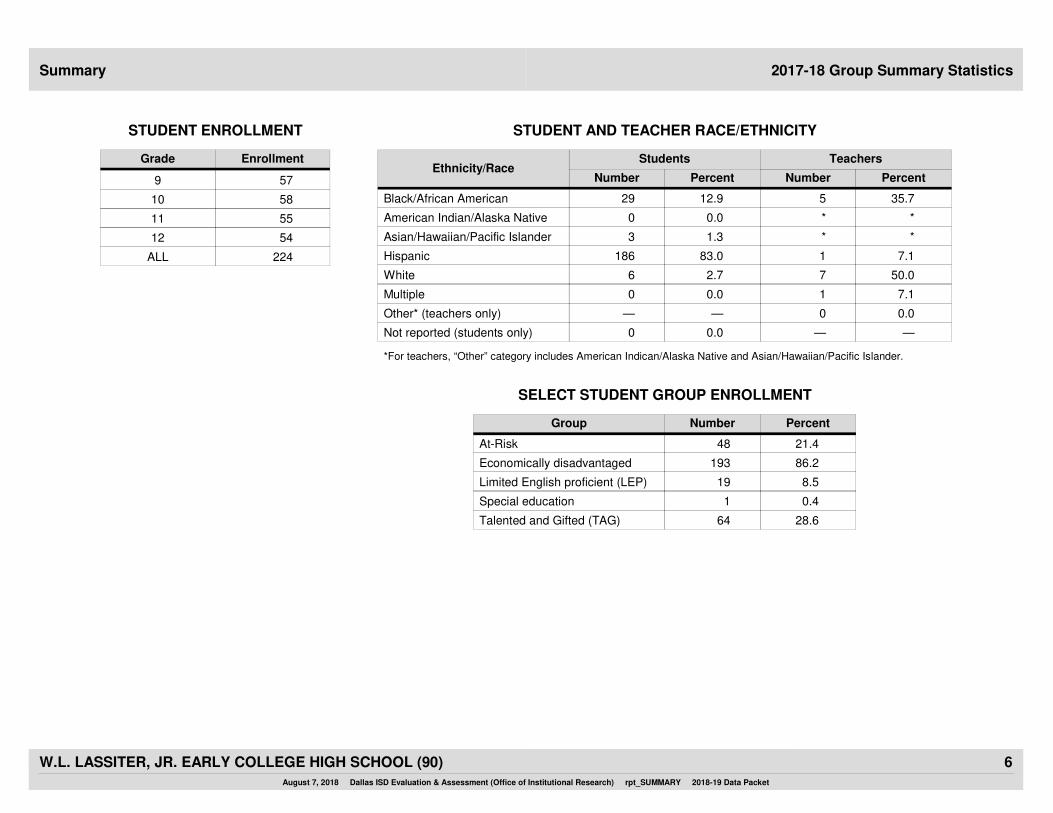
STUDENT ENROLLMENT
Enrollment
9 57
10 58
11 55
12 54
ALL 224
STUDENT AND TEACHER RACE/ETHNICITY
Students
Number Percent Number PercentEthnicity/Race
Black/African American
American Indian/Alaska Native
Asian/Hawaiian/Pacific Islander
Hispanic
White
Multiple
29 12.9
0 0.0
3 1.3
186 83.0
6 2.7
5 35.7
1 7.1
7 50.0
1 7.1
* *
* *
0 0.0
SELECT STUDENT GROUP ENROLLMENT
Number PercentGroup
Economically disadvantaged
Limited English proficient (LEP)
Special education
193 86.2
19 8.5
1 0.4
*For teachers, “Other” category includes American Indican/Alaska Native and Asian/Hawaiian/Pacific Islander.
Not reported (students only) — —0 0.0
Other* (teachers only) 0 0.0— —
Talented and Gifted (TAG) 64 28.6
At-Risk 48 21.4
Teachers
August 7, 2018 Dallas ISD Evaluation & Assessment (Office of Institutional Research) rpt_SUMMARY 2018-19 Data Packet
6W.L. LASSITER, JR. EARLY COLLEGE HIGH SCHOOL (90)
N %
Asian
%NN %%
Hispanic
N N %Grade Year
African American American Indian
Enrollment
White
Enrollment Statistics by Race/EthnicityEnroll (1)
N %
Multiple category
2018
2016
2017
0.0
0.0
0.0
0
0
0
0.0
0.0
0.0
0
0
0
84.4
80.3
89.5
54
49
51
12.5
16.4
10.5
8
10
6
3.1
3.3
0.0
2
2
0
9
57
61
64 0.0
0.0
0.0
0
0
0
2018
2016
2017
3.3
0.0
1.7
2
0
1
0.0
0.0
0.0
0
0
0
75.4
85.0
81.0
46
51
47
13.1
11.7
15.5
8
7
9
8.2
3.3
1.7
5
2
1
10
58
60
61 0.0
0.0
0.0
0
0
0
2018
2016
2017
1.6
3.5
0.0
1
2
0
0.0
0.0
0.0
0
0
0
85.9
75.4
85.5
55
43
47
10.9
12.3
12.7
7
7
7
1.6
8.8
1.8
1
5
1
11
55
57
64 0.0
0.0
0.0
0
0
0
2018
2016
2017
5.4
1.7
3.7
3
1
2
3.6
0.0
0.0
2
0
0
73.2
86.4
75.9
41
51
41
12.5
10.2
13.0
7
6
7
5.4
1.7
7.4
3
1
4
12
54
59
56 0.0
0.0
0.0
0
0
0
2018
2016
2017
2.4
1.3
1.3
6
3
3
0.8
0.0
0.0
2
0
0
80.0
81.9
83.0
196
194
186
12.2
12.7
12.9
30
30
29
4.5
4.2
2.7
11
10
6
9-12
224
237
245 0.0
0.0
0.0
0
0
0
August 7, 2018 Dallas ISD Evaluation & Assessment (Office of Institutional Research) rpt_ENROLL_ETH 2018-19 Data Packet
7W.L. LASSITER, JR. EARLY COLLEGE HIGH SCHOOL (90)
N %
At RIsk New (to District)
N %
TAG
N %
Economically
Disadvantaged
Grade Year
LEP Special Education
N % N % N %
Retention
Rate (%)Enrollment
Enrollment Statistics by Select Student GroupEnroll (2)
Gender
% Male % Female
31.3
21.3
35.1
20
13
20
15.6
14.8
21.1
9
2018 57
61
64 87.5
88.5
96.5
56
54
55
10.9
13.1
28.1
7
8
16
0.0
1.6
0.0
0
1
0
31.3
41.0
35.1
20
25
20
0.0
0.0
0.0
2016
2017
10
9
12
35.9
47.5
26.3
64.1
52.5
73.7
24.6
25.0
10.3
15
15
6
0.0
0.0
1.7
10
2018 58
60
61 82.0
81.7
86.2
50
49
50
1.6
3.3
1.7
1
2
1
1.6
0.0
1.7
1
0
1
0.0
6.7
39.7
0
4
23
0.0
0.0
0.0
2016
2017
0
0
1
44.3
33.3
48.3
55.7
66.7
51.7
29.7
21.1
27.3
19
12
15
0.0
0.0
3.6
11
2018 55
57
64 79.7
82.5
81.8
51
47
45
3.1
1.8
3.6
2
1
2
0.0
1.8
0.0
0
1
0
29.7
31.6
38.2
19
18
21
0.0
0.0
0.0
2016
2017
0
0
2
39.1
47.4
30.9
60.9
52.6
69.1
17.9
22.0
13.0
10
13
7
0.0
0.0
0.0
12
2018 54
59
56 80.4
79.7
79.6
45
47
43
1.8
3.4
0.0
1
2
0
0.0
0.0
0.0
0
0
0
0.0
3.4
0.0
0
2
0
0.0
0.0
0.0
2016
2017
0
0
0
42.9
39.0
46.3
57.1
61.0
53.7
26.1
22.4
21.4
64
53
48
4.1
3.8
6.7
9-12
2018 224
237
245 82.4
83.1
86.2
202
197
193
4.5
5.5
8.5
11
13
19
0.4
0.8
0.4
1
2
1
15.9
20.7
28.6
39
49
64
0.0
0.0
0.0
2016
2017
10
9
15
40.4
41.8
37.9
59.6
58.2
62.1
August 7, 2018 Dallas ISD Evaluation & Assessment (Office of Institutional Research) rpt_ENROLL_OTH 2018-19 Data Packet
8W.L. LASSITER, JR. EARLY COLLEGE HIGH SCHOOL (90)
Stability Rate
%
Continuously
Enrolled
N DistrictNN
Average Daily
MembershipAverage Daily Attendance Yearly Transactions
Grade Year N %District District N District % % District % District
Student Attendance StatisticsAttendance
100.0
100.0
100.0
64
57
61
9,913
9,718
9,766
0
0
09
2016 98.961 0.0 26.2
2017
2018 98.254 0.0 22.9
99.057 0.0 25.7
11,813
11,716
11,759
93.6
93.6
93.0
11,053
10,961
10,936
83.9
82.9
83.1
62
55
58
100.0
95.7
100.0
60
54
59
8,845
8,886
9,045
0
1
010
2016 98.158 0.0 19.4
2017
2018 97.355 1.8 16.5
97.956 0.0 16.3
10,202
10,382
10,329
94.1
94.3
94.0
9,595
9,791
9,713
86.7
85.6
87.6
59
56
58
100.0
95.3
100.0
64
51
57
7,400
8,132
7,756
0
0
111
2016 97.761 0.0 16.9
2017
2018 96.251 0.0 12.0
98.453 1.8 13.7
8,384
9,131
8,543
94.3
94.9
94.7
7,906
8,661
8,088
88.3
89.1
90.8
62
54
54
100.0
98.7
100.0
55
52
56
7,523
7,772
7,365
1
0
012
2016 98.953 1.9 10.2
2017
2018 96.651 0.0 5.8
97.854 0.0 6.4
8,426
8,756
8,197
94.5
94.9
94.7
7,965
8,306
7,762
89.3
88.8
89.8
54
53
55
100.0
98.2
100.0
243
214
233
33,681
34,508
33,932
1
1
19-12
2016 98.4234 0.4 18.9
2017
2018 97.1212 0.5 15.0
98.3221 0.4 16.5
38,826
39,984
38,829
94.1
94.3
94.0
36,519
37,719
36,498
86.7
86.3
87.4
237
218
225
August 7, 2018 Dallas ISD Evaluation & Assessment (Office of Institutional Research) rpt_ATTENDANCE 2018-19 Data Packet
9W.L. LASSITER, JR. EARLY COLLEGE HIGH SCHOOL (90)
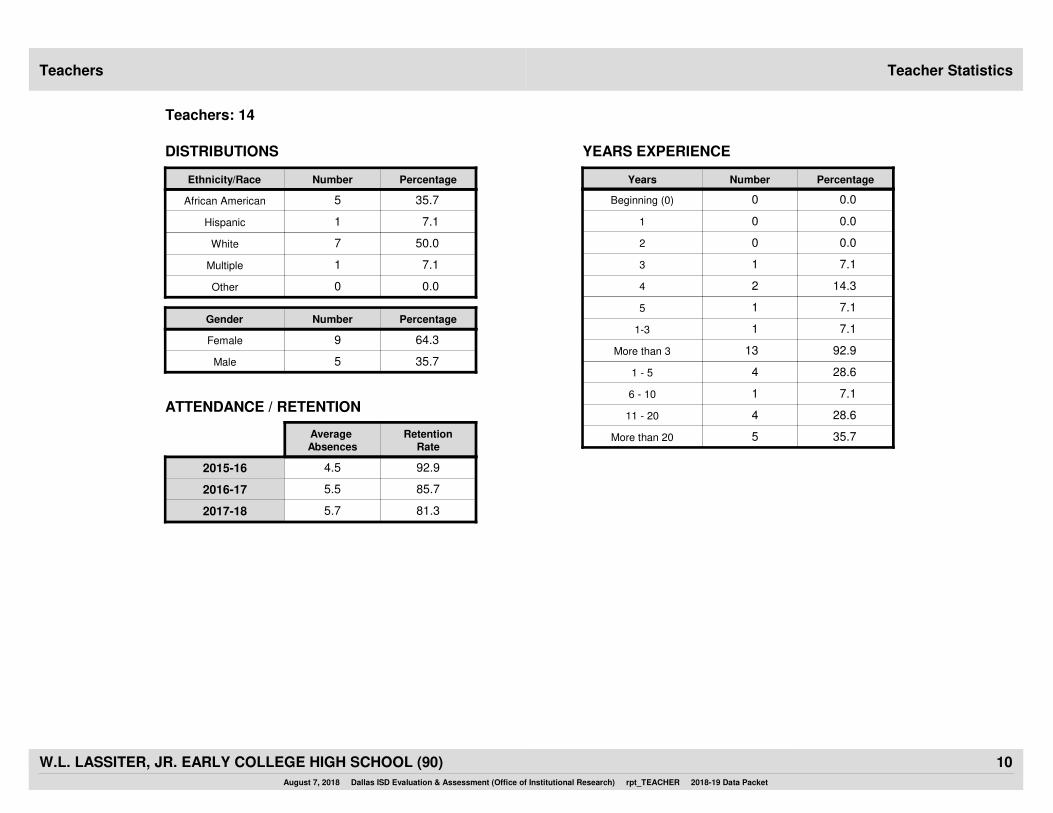
Teacher StatisticsTeachers
0.0
Percentage
0Beginning (0)
41 - 5
16 - 10
411 - 20
5More than 20
Years Number
81.3
85.7
92.9
1
64.39
35.75
7.1
7.11
35.75
50.07White
African American
Hispanic
Multiple
Male
Female
5.5
4.5
Number PercentageEthnicity/Race
DISTRIBUTIONS YEARS EXPERIENCE
Teachers: 14
5.7
Average Absences
RetentionRate
28.6
7.1
28.6
35.7
2015-16
2016-17
2017-18
Number PercentageGender
0.001
0.002
7.113
7.111-3
14.324
7.115
13More than 3 92.9
0 0.0Other
ATTENDANCE / RETENTION
August 7, 2018 Dallas ISD Evaluation & Assessment (Office of Institutional Research) rpt_TEACHER 2018-19 Data Packet
10W.L. LASSITER, JR. EARLY COLLEGE HIGH SCHOOL (90)
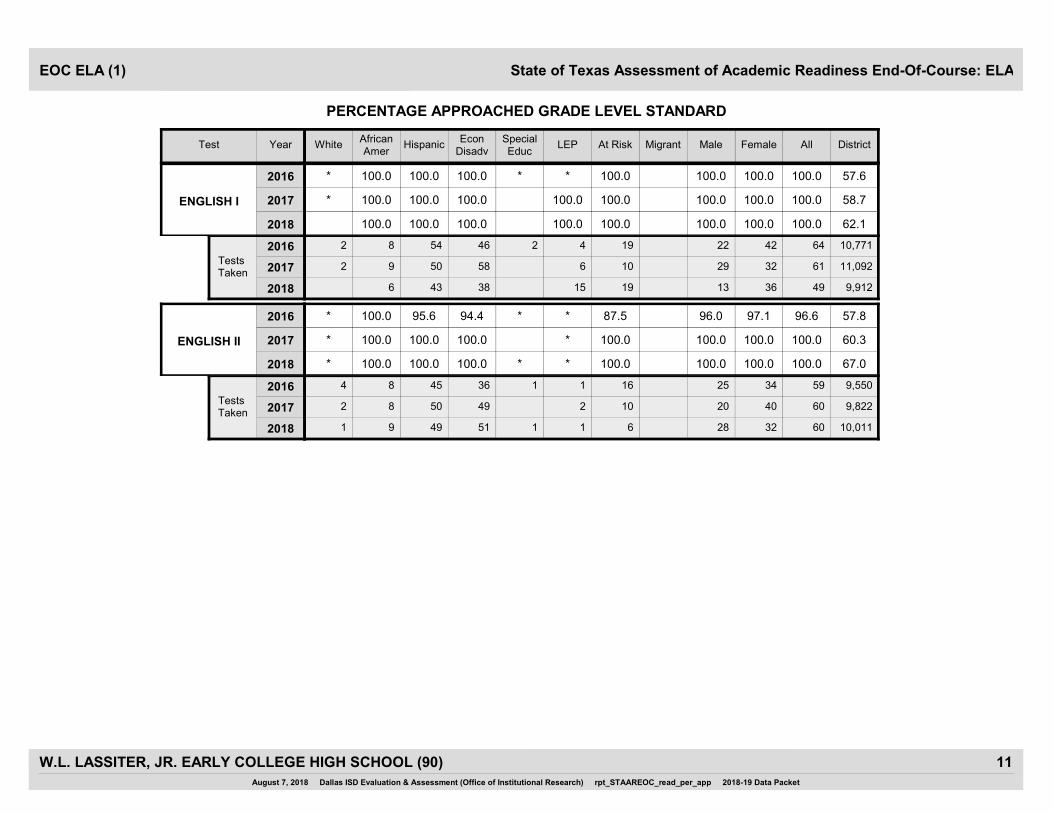
PERCENTAGE APPROACHED GRADE LEVEL STANDARD
FemaleMigrant MaleAt RiskWhiteAfricanAmer
HispanicEcon
DisadvSpecialEduc
LEP All DistrictYearTest
State of Texas Assessment of Academic Readiness End-Of-Course: ELAEOC ELA (1)
100.0 100.0
100.0 100.0
100.0 100.0
62.12018 100.0 100.0 100.0 100.0 100.0100.0
ENGLISH I
57.62016 * 100.0 100.0 100.0 * * 100.0100.0
58.72017 * 100.0 100.0 100.0 100.0 100.0100.0
13 36
22 42
29 32
9,9122018 436 38 15 4919
10,7712016 2 548 46 2 4 6419
11,0922017 2 509 58 6 6110Tests Taken
100.0 100.0
96.0 97.1
100.0 100.0
67.02018 * 100.0 100.0 100.0 * * 100.0100.0
ENGLISH II
57.82016 * 100.0 95.6 94.4 * * 96.687.5
60.32017 * 100.0 100.0 100.0 * 100.0100.0
28 32
25 34
20 40
10,0112018 1 499 51 1 1 606
9,5502016 4 458 36 1 1 5916
9,8222017 2 508 49 2 6010Tests Taken
August 7, 2018 Dallas ISD Evaluation & Assessment (Office of Institutional Research) rpt_STAAREOC_read_per_app 2018-19 Data Packet
11W.L. LASSITER, JR. EARLY COLLEGE HIGH SCHOOL (90)
FemaleMigrant MaleAt RiskWhiteAfricanAmer
HispanicEcon
DisadvSpecialEduc
LEP All DistrictYearTest
State of Texas Assessment of Academic Readiness End-Of-Course: ELA
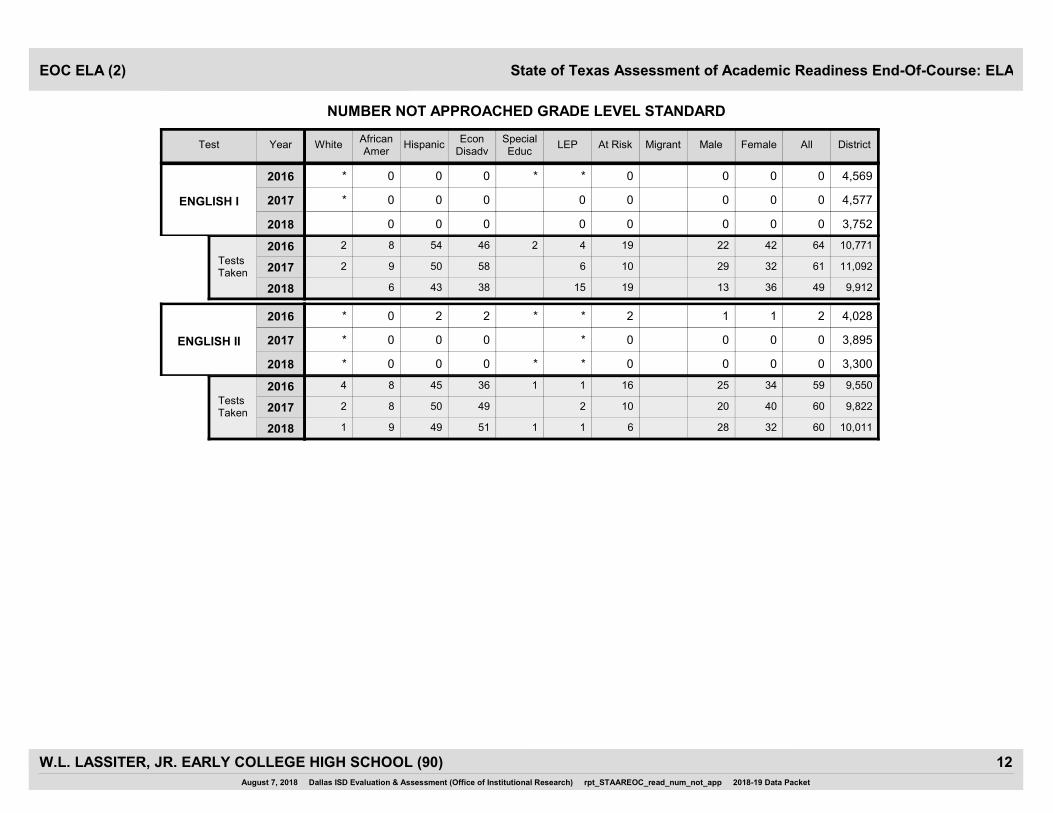
NUMBER NOT APPROACHED GRADE LEVEL STANDARD
EOC ELA (2)
0 0
0 0
0 0
3,7522018 0 0 0 0 00
ENGLISH I
4,5692016 * 0 0 0 * * 00
4,5772017 * 0 0 0 0 00
13 36
22 42
29 32
9,9122018 436 38 15 4919
10,7712016 2 548 46 2 4 6419
11,0922017 2 509 58 6 6110Tests Taken
0 0
1 1
0 0
3,3002018 * 0 0 0 * * 00
ENGLISH II
4,0282016 * 0 2 2 * * 22
3,8952017 * 0 0 0 * 00
28 32
25 34
20 40
10,0112018 1 499 51 1 1 606
9,5502016 4 458 36 1 1 5916
9,8222017 2 508 49 2 6010Tests Taken
August 7, 2018 Dallas ISD Evaluation & Assessment (Office of Institutional Research) rpt_STAAREOC_read_num_not_app 2018-19 Data Packet
12W.L. LASSITER, JR. EARLY COLLEGE HIGH SCHOOL (90)
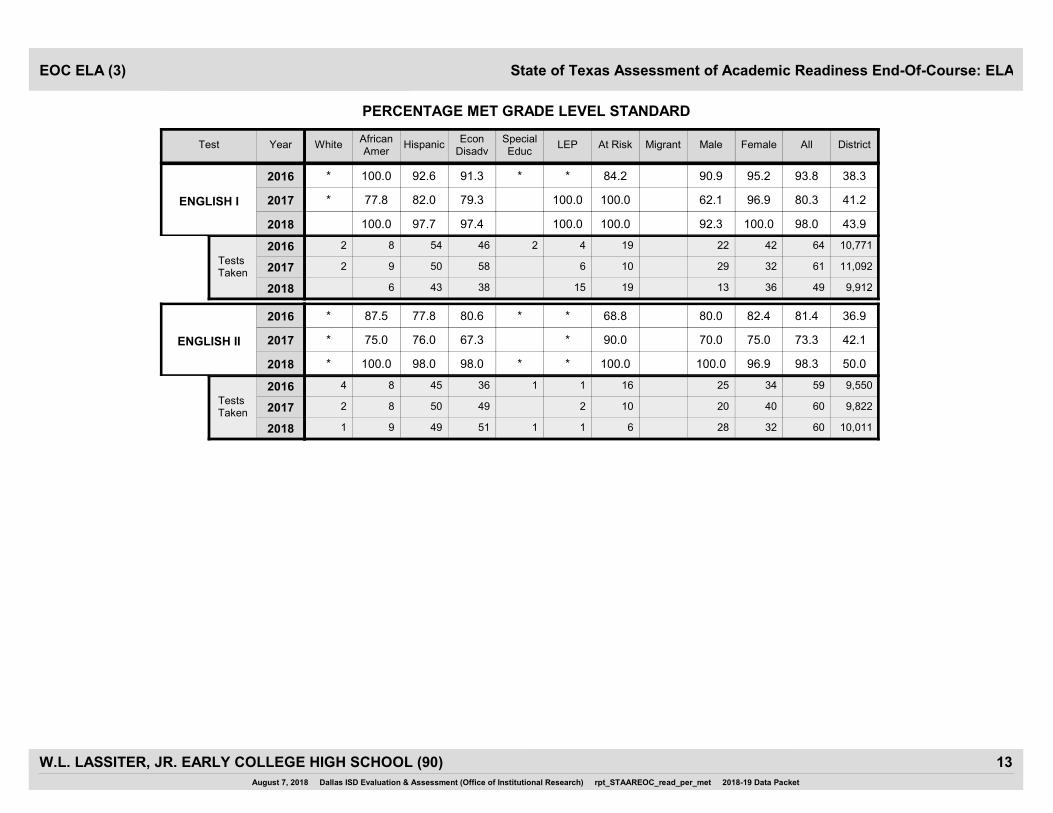
PERCENTAGE MET GRADE LEVEL STANDARD
FemaleMigrant MaleAt RiskWhiteAfricanAmer
HispanicEcon
DisadvSpecialEduc
LEP All DistrictYearTest
State of Texas Assessment of Academic Readiness End-Of-Course: ELAEOC ELA (3)
92.3 100.0
90.9 95.2
62.1 96.9
43.92018 100.0 97.7 97.4 100.0 98.0100.0
ENGLISH I
38.32016 * 100.0 92.6 91.3 * * 93.884.2
41.22017 * 77.8 82.0 79.3 100.0 80.3100.0
13 36
22 42
29 32
9,9122018 436 38 15 4919
10,7712016 2 548 46 2 4 6419
11,0922017 2 509 58 6 6110Tests Taken
100.0 96.9
80.0 82.4
70.0 75.0
50.02018 * 100.0 98.0 98.0 * * 98.3100.0
ENGLISH II
36.92016 * 87.5 77.8 80.6 * * 81.468.8
42.12017 * 75.0 76.0 67.3 * 73.390.0
28 32
25 34
20 40
10,0112018 1 499 51 1 1 606
9,5502016 4 458 36 1 1 5916
9,8222017 2 508 49 2 6010Tests Taken
August 7, 2018 Dallas ISD Evaluation & Assessment (Office of Institutional Research) rpt_STAAREOC_read_per_met 2018-19 Data Packet
13W.L. LASSITER, JR. EARLY COLLEGE HIGH SCHOOL (90)
FemaleMigrant MaleAt RiskWhiteAfricanAmer
HispanicEcon
DisadvSpecialEduc
LEP All DistrictYearTest
State of Texas Assessment of Academic Readiness End-Of-Course: ELA
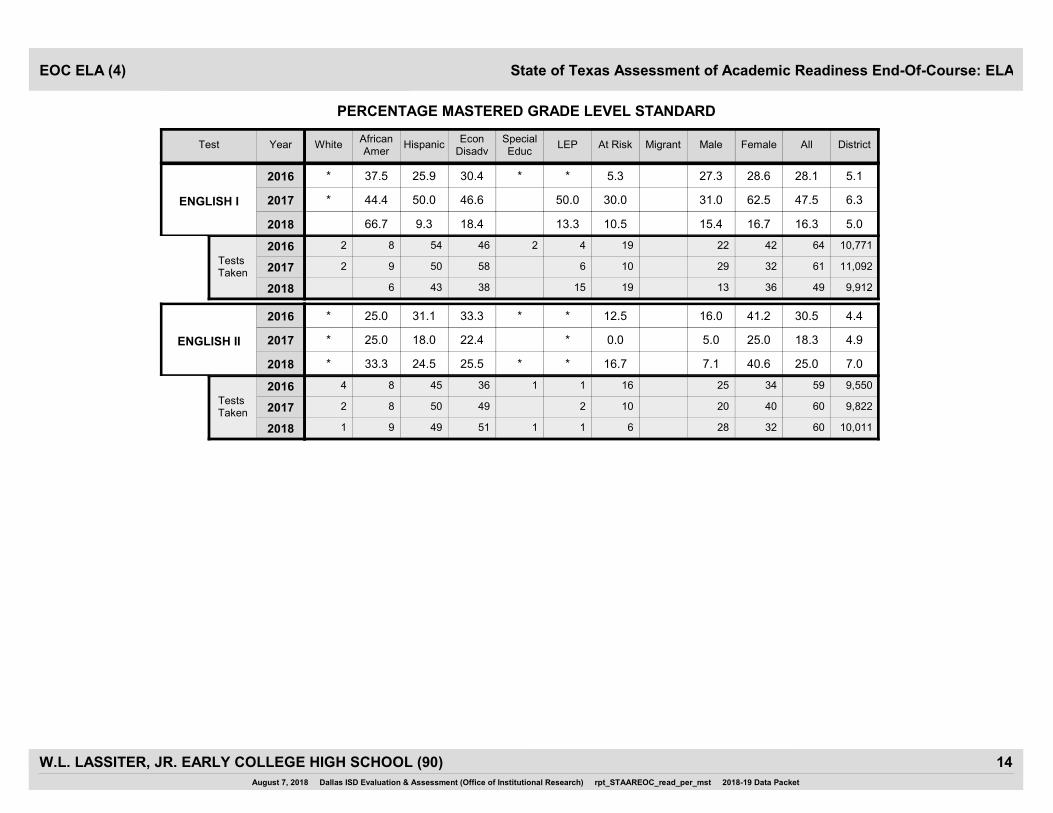
PERCENTAGE MASTERED GRADE LEVEL STANDARD
EOC ELA (4)
15.4 16.7
27.3 28.6
31.0 62.5
5.02018 66.7 9.3 18.4 13.3 16.310.5
ENGLISH I
5.12016 * 37.5 25.9 30.4 * * 28.15.3
6.32017 * 44.4 50.0 46.6 50.0 47.530.0
13 36
22 42
29 32
9,9122018 436 38 15 4919
10,7712016 2 548 46 2 4 6419
11,0922017 2 509 58 6 6110Tests Taken
7.1 40.6
16.0 41.2
5.0 25.0
7.02018 * 33.3 24.5 25.5 * * 25.016.7
ENGLISH II
4.42016 * 25.0 31.1 33.3 * * 30.512.5
4.92017 * 25.0 18.0 22.4 * 18.30.0
28 32
25 34
20 40
10,0112018 1 499 51 1 1 606
9,5502016 4 458 36 1 1 5916
9,8222017 2 508 49 2 6010Tests Taken
August 7, 2018 Dallas ISD Evaluation & Assessment (Office of Institutional Research) rpt_STAAREOC_read_per_mst 2018-19 Data Packet
14W.L. LASSITER, JR. EARLY COLLEGE HIGH SCHOOL (90)
State of Texas Assessment of Academic Readiness End-Of-Course: ELA
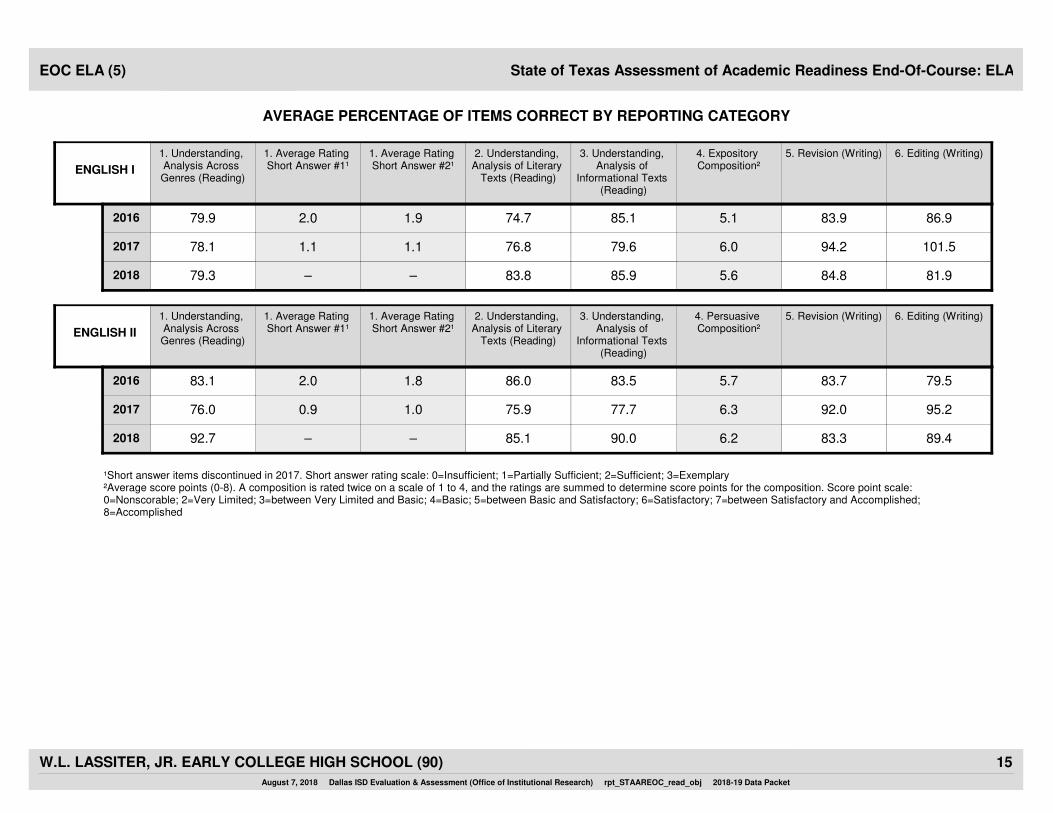
AVERAGE PERCENTAGE OF ITEMS CORRECT BY REPORTING CATEGORY
EOC ELA (5)
2018 79.3 – – 83.8 85.9
2016 79.9 2.0 1.9 74.7 85.1
2017 78.1 1.1 1.1 76.8 79.6
1. Understanding, Analysis Across Genres (Reading)
1. Average Rating Short Answer #1¹
1. Average Rating Short Answer #2¹
2. Understanding, Analysis of Literary
Texts (Reading)
3. Understanding, Analysis of
Informational Texts (Reading)
ENGLISH I
5.6 84.8 81.9
5.1 83.9 86.9
6.0 94.2 101.5
4. Expository Composition²
5. Revision (Writing) 6. Editing (Writing)
2018 92.7 – – 85.1 90.0
2016 83.1 2.0 1.8 86.0 83.5
2017 76.0 0.9 1.0 75.9 77.7
1. Understanding, Analysis Across Genres (Reading)
1. Average Rating Short Answer #1¹
1. Average Rating Short Answer #2¹
2. Understanding, Analysis of Literary
Texts (Reading)
3. Understanding, Analysis of
Informational Texts (Reading)
ENGLISH II
6.2 83.3 89.4
5.7 83.7 79.5
6.3 92.0 95.2
4. Persuasive Composition²
5. Revision (Writing) 6. Editing (Writing)
¹Short answer items discontinued in 2017. Short answer rating scale: 0=Insufficient; 1=Partially Sufficient; 2=Sufficient; 3=Exemplary²Average score points (0-8). A composition is rated twice on a scale of 1 to 4, and the ratings are summed to determine score points for the composition. Score point scale: 0=Nonscorable; 2=Very Limited; 3=between Very Limited and Basic; 4=Basic; 5=between Basic and Satisfactory; 6=Satisfactory; 7=between Satisfactory and Accomplished; 8=Accomplished
August 7, 2018 Dallas ISD Evaluation & Assessment (Office of Institutional Research) rpt_STAAREOC_read_obj 2018-19 Data Packet
15W.L. LASSITER, JR. EARLY COLLEGE HIGH SCHOOL (90)
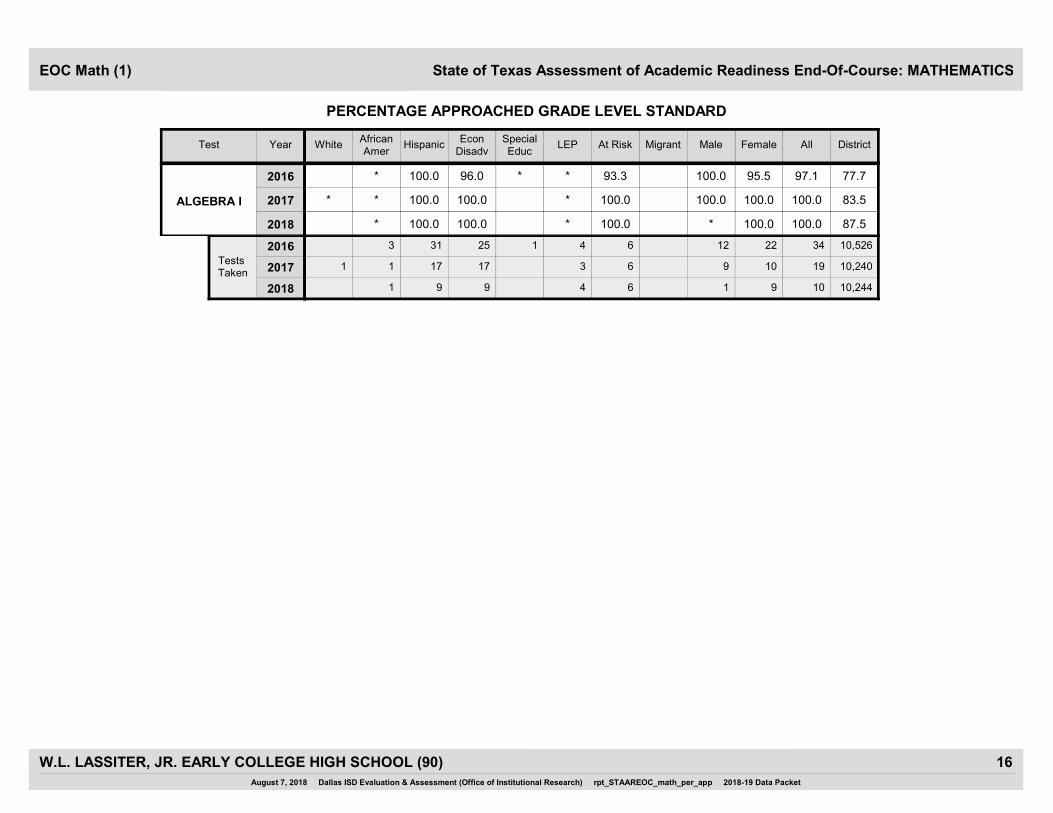
PERCENTAGE APPROACHED GRADE LEVEL STANDARD
FemaleMigrant MaleAt RiskWhiteAfricanAmer
HispanicEcon
DisadvSpecialEduc
LEP All DistrictYearTest
State of Texas Assessment of Academic Readiness End-Of-Course: MATHEMATICSEOC Math (1)
* 100.0
100.0 95.5
100.0 100.0
87.52018 * 100.0 100.0 * 100.0100.0
ALGEBRA I
77.72016 * 100.0 96.0 * * 97.193.3
83.52017 * * 100.0 100.0 * 100.0100.0
1 9
12 22
9 10
10,2442018 91 9 4 106
10,5262016 313 25 1 4 346
10,2402017 1 171 17 3 196Tests Taken
August 7, 2018 Dallas ISD Evaluation & Assessment (Office of Institutional Research) rpt_STAAREOC_math_per_app 2018-19 Data Packet
16W.L. LASSITER, JR. EARLY COLLEGE HIGH SCHOOL (90)
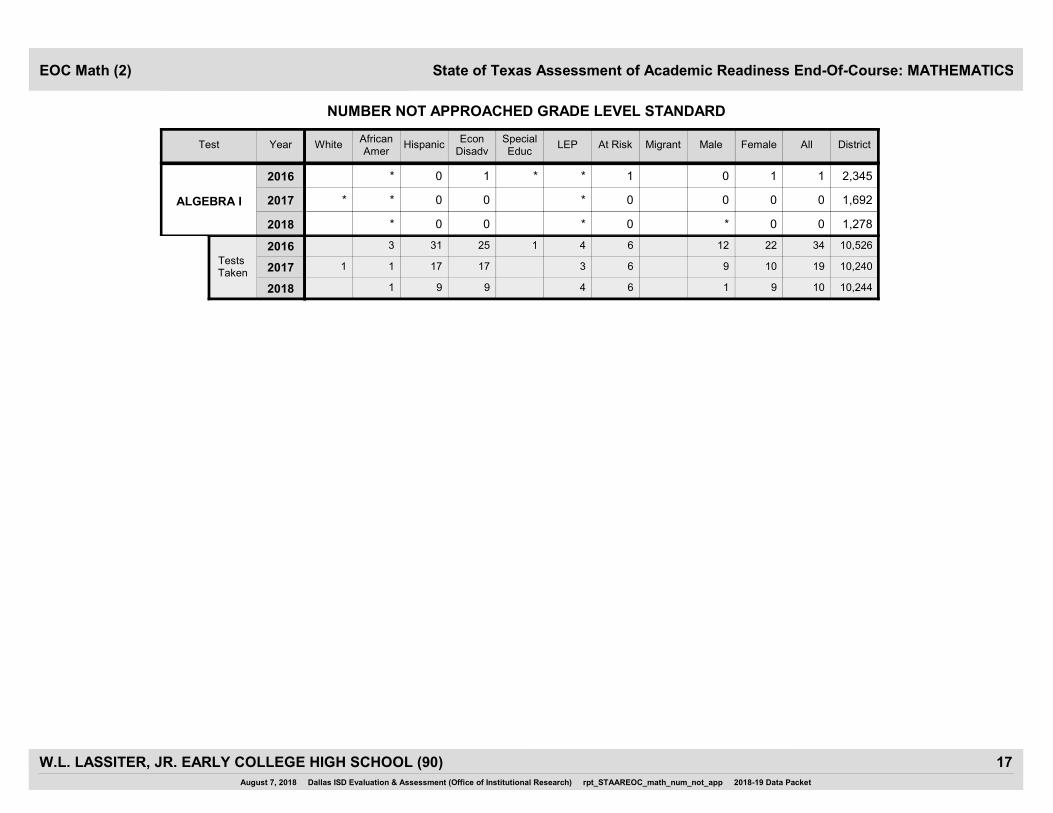
NUMBER NOT APPROACHED GRADE LEVEL STANDARD
FemaleMigrant MaleAt RiskWhiteAfricanAmer
HispanicEcon
DisadvSpecialEduc
LEP All DistrictYearTest
State of Texas Assessment of Academic Readiness End-Of-Course: MATHEMATICSEOC Math (2)
* 0
0 1
0 0
1,2782018 * 0 0 * 00
ALGEBRA I
2,3452016 * 0 1 * * 11
1,6922017 * * 0 0 * 00
1 9
12 22
9 10
10,2442018 91 9 4 106
10,5262016 313 25 1 4 346
10,2402017 1 171 17 3 196Tests Taken
August 7, 2018 Dallas ISD Evaluation & Assessment (Office of Institutional Research) rpt_STAAREOC_math_num_not_app 2018-19 Data Packet
17W.L. LASSITER, JR. EARLY COLLEGE HIGH SCHOOL (90)
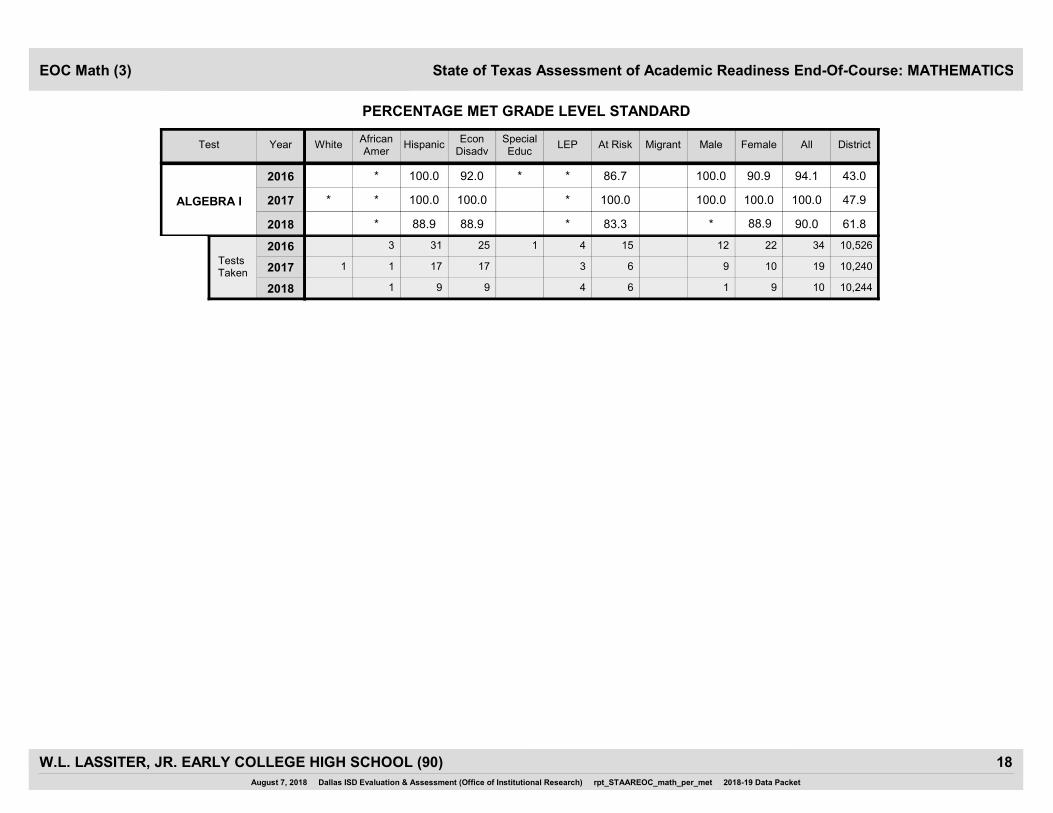
PERCENTAGE MET GRADE LEVEL STANDARD
FemaleMigrant MaleAt RiskWhiteAfricanAmer
HispanicEcon
DisadvSpecialEduc
LEP All DistrictYearTest
State of Texas Assessment of Academic Readiness End-Of-Course: MATHEMATICSEOC Math (3)
* 88.9
100.0 90.9
100.0 100.0
61.82018 * 88.9 88.9 * 90.083.3
ALGEBRA I
43.02016 * 100.0 92.0 * * 94.186.7
47.92017 * * 100.0 100.0 * 100.0100.0
1 9
12 22
9 10
10,2442018 91 9 4 106
10,5262016 313 25 1 4 3415
10,2402017 1 171 17 3 196Tests Taken
August 7, 2018 Dallas ISD Evaluation & Assessment (Office of Institutional Research) rpt_STAAREOC_math_per_met 2018-19 Data Packet
18W.L. LASSITER, JR. EARLY COLLEGE HIGH SCHOOL (90)
FemaleMigrant MaleAt RiskWhiteAfricanAmer
HispanicEcon
DisadvSpecialEduc
LEP All DistrictYearTest
State of Texas Assessment of Academic Readiness End-Of-Course: MATHEMATICS
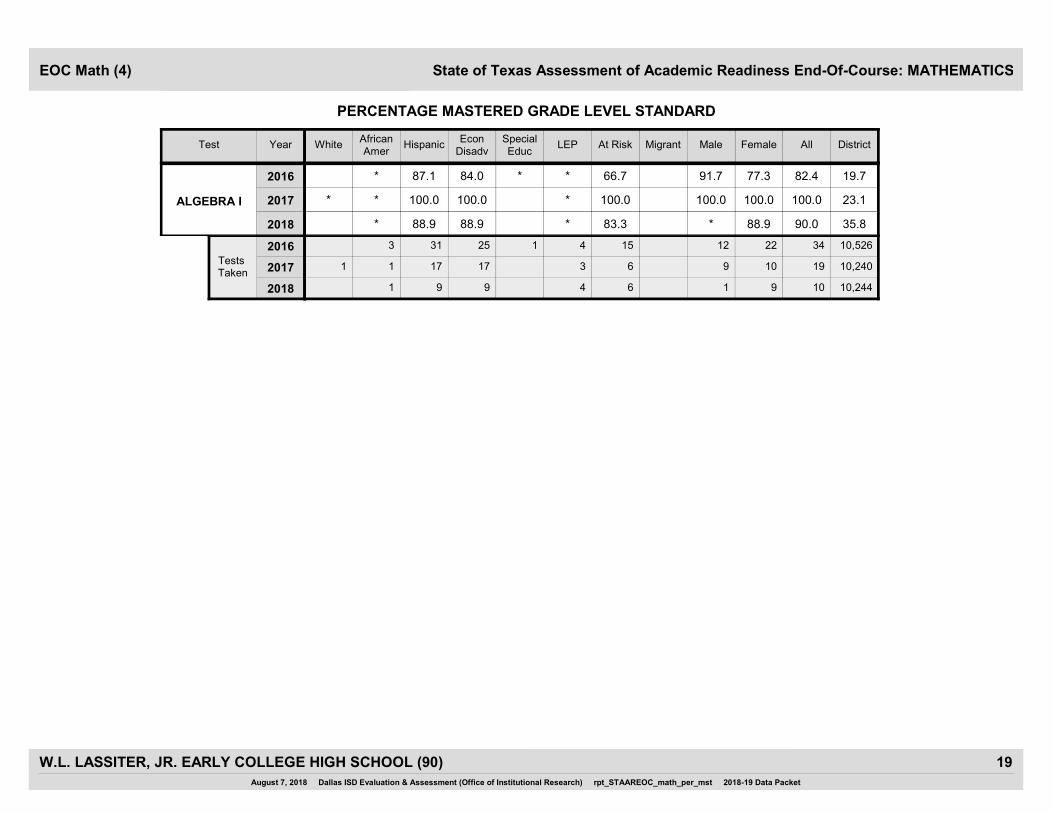
PERCENTAGE MASTERED GRADE LEVEL STANDARD
EOC Math (4)
* 88.9
91.7 77.3
100.0 100.0
35.82018 * 88.9 88.9 * 90.083.3
ALGEBRA I
19.72016 * 87.1 84.0 * * 82.466.7
23.12017 * * 100.0 100.0 * 100.0100.0
1 9
12 22
9 10
10,2442018 91 9 4 106
10,5262016 313 25 1 4 3415
10,2402017 1 171 17 3 196Tests Taken
August 7, 2018 Dallas ISD Evaluation & Assessment (Office of Institutional Research) rpt_STAAREOC_math_per_mst 2018-19 Data Packet
19W.L. LASSITER, JR. EARLY COLLEGE HIGH SCHOOL (90)
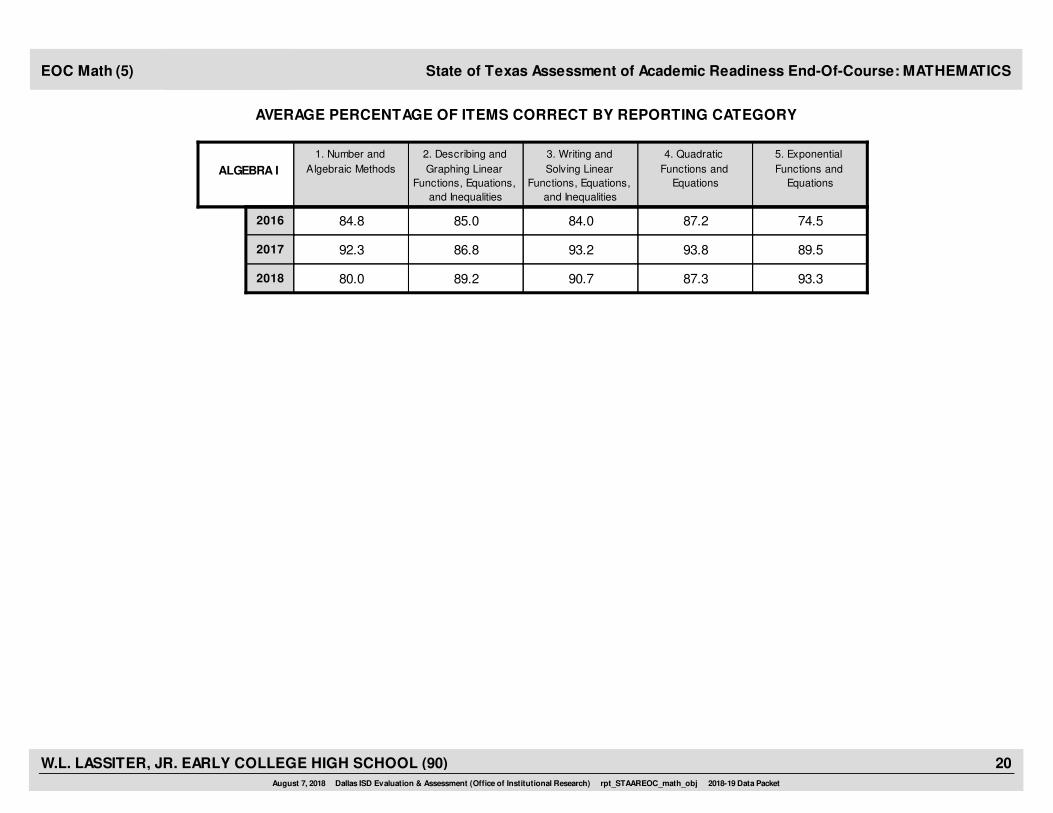
AVERAGE PERCENTAGE OF ITEMS CORRECT BY REPORTING CATEGORY
State of Texas Assessment of Academic Readiness End-Of-Course: MATHEMATICSEOC Math (5)
2018 80.0 89.2 90.7 87.3 93.3
2016 84.8 85.0 84.0 87.2 74.5
2017 92.3 86.8 93.2 93.8 89.5
1. Number and
Algebraic Methods
2. Describing and
Graphing Linear
Functions, Equations,
and Inequalities
3. Writing and
Solving Linear
Functions, Equations,
and Inequalities
4. Quadratic
Functions and
Equations
5. Exponential
Functions and
EquationsALGEBRA I
August 7, 2018 Dallas ISD Evaluation & Assessment (Office of Institutional Research) rpt_STAAREOC_math_obj 2018-19 Data Packet
20W.L. LASSITER, JR. EARLY COLLEGE HIGH SCHOOL (90)
FemaleMigrant MaleAt RiskWhiteAfricanAmer
HispanicEcon
DisadvSpecialEduc
LEP All DistrictYearTest
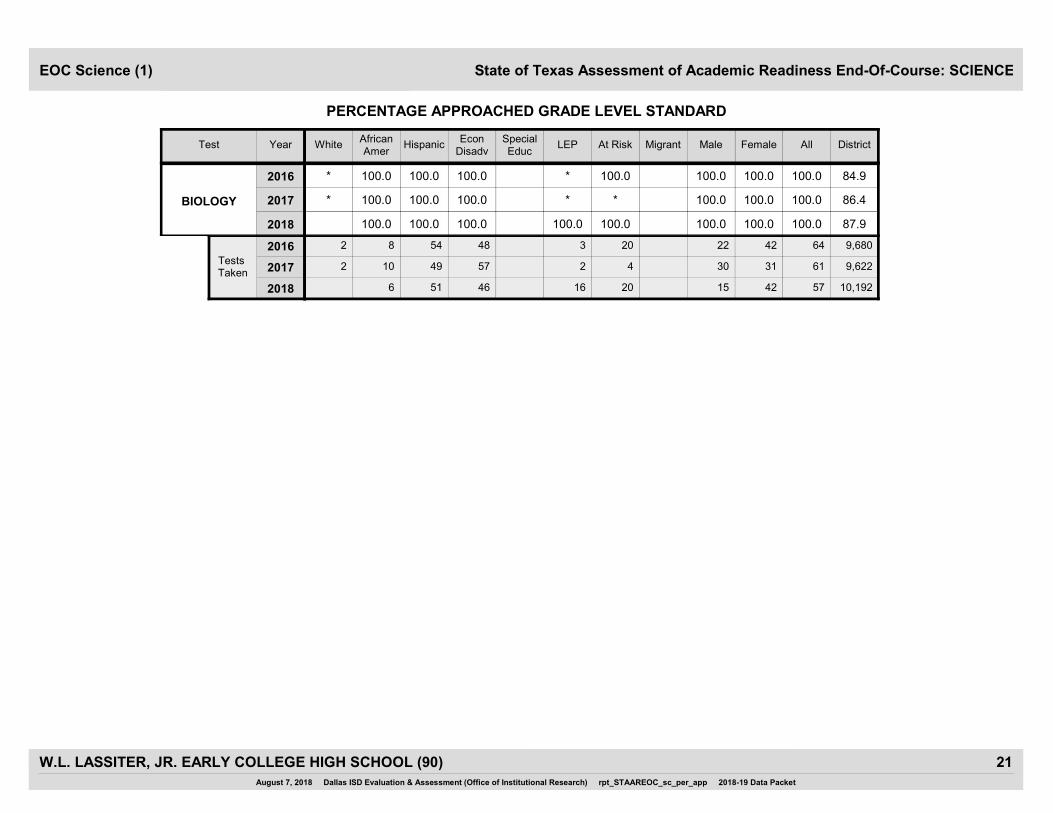
State of Texas Assessment of Academic Readiness End-Of-Course: SCIENCE
PERCENTAGE APPROACHED GRADE LEVEL STANDARD
EOC Science (1)
100.0 100.0
100.0 100.0
100.0 100.0
87.92018 100.0 100.0 100.0 100.0 100.0100.0
BIOLOGY
84.92016 * 100.0 100.0 100.0 * 100.0100.0
86.42017 * 100.0 100.0 100.0 * 100.0*
15 42
22 42
30 31
10,1922018 516 46 16 5720
9,6802016 2 548 48 3 6420
9,6222017 2 4910 57 2 614Tests Taken
August 7, 2018 Dallas ISD Evaluation & Assessment (Office of Institutional Research) rpt_STAAREOC_sc_per_app 2018-19 Data Packet
21W.L. LASSITER, JR. EARLY COLLEGE HIGH SCHOOL (90)

FemaleMigrant MaleAt RiskWhiteAfricanAmer
HispanicEcon
DisadvSpecialEduc
LEP All DistrictYearTest
State of Texas Assessment of Academic Readiness End-Of-Course: SCIENCE
NUMBER NOT APPROACHED GRADE LEVEL STANDARD
EOC Science (2)
0 0
0 0
0 0
1,2342018 0 0 0 0 00
BIOLOGY
1,4662016 * 0 0 0 * 00
1,3102017 * 0 0 0 * 0*
15 42
22 42
30 31
10,1922018 516 46 16 5720
9,6802016 2 548 48 3 6420
9,6222017 2 4910 57 2 614Tests Taken
August 7, 2018 Dallas ISD Evaluation & Assessment (Office of Institutional Research) rpt_STAAREOC_sc_num_not_app 2018-19 Data Packet
22W.L. LASSITER, JR. EARLY COLLEGE HIGH SCHOOL (90)

FemaleMigrant MaleAt RiskWhiteAfricanAmer
HispanicEcon
DisadvSpecialEduc
LEP All DistrictYearTest
State of Texas Assessment of Academic Readiness End-Of-Course: SCIENCE
PERCENTAGE MET GRADE LEVEL STANDARD
EOC Science (3)
86.7 88.1
90.9 76.2
60.0 58.1
57.42018 100.0 86.3 84.8 100.0 87.790.0
BIOLOGY
50.62016 * 87.5 79.6 79.2 * 81.360.0
54.02017 * 60.0 59.2 56.1 * 59.0*
15 42
22 42
30 31
10,1922018 516 46 16 5720
9,6802016 2 548 48 3 6420
9,6222017 2 4910 57 2 614Tests Taken
August 7, 2018 Dallas ISD Evaluation & Assessment (Office of Institutional Research) rpt_STAAREOC_sc_per_met 2018-19 Data Packet
23W.L. LASSITER, JR. EARLY COLLEGE HIGH SCHOOL (90)
FemaleMigrant MaleAt RiskWhiteAfricanAmer
HispanicEcon
DisadvSpecialEduc
LEP All DistrictYearTest
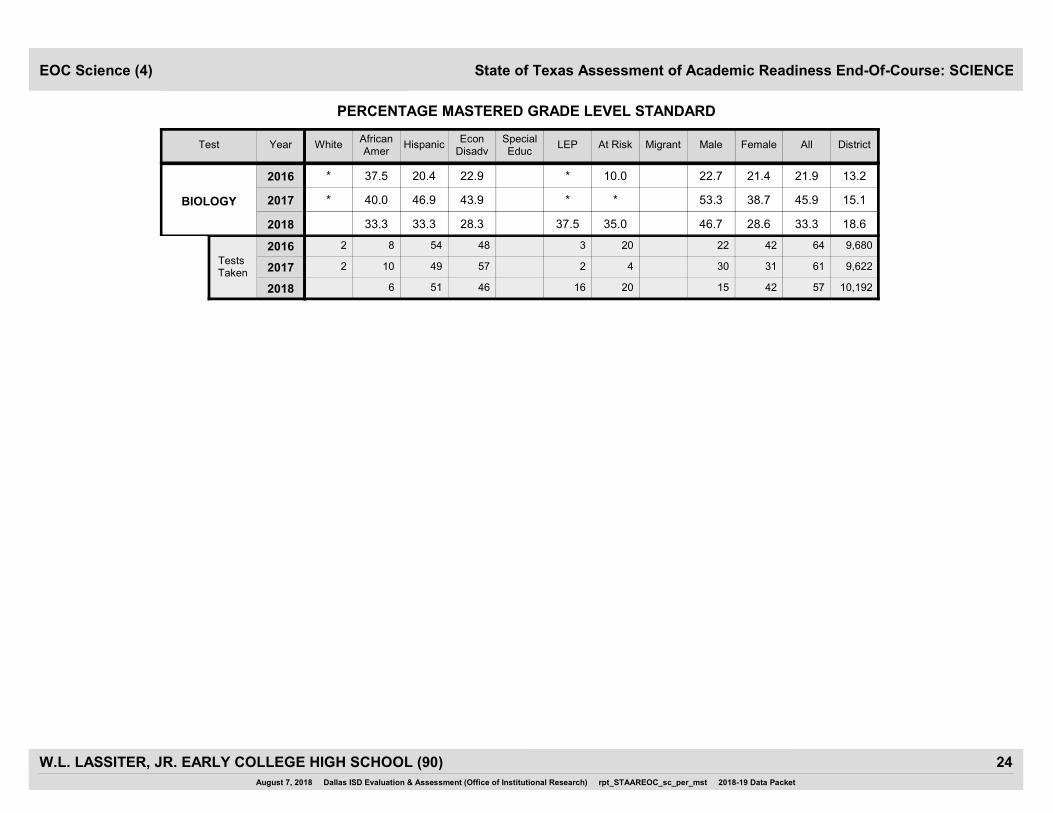
State of Texas Assessment of Academic Readiness End-Of-Course: SCIENCE
PERCENTAGE MASTERED GRADE LEVEL STANDARD
EOC Science (4)
46.7 28.6
22.7 21.4
53.3 38.7
18.62018 33.3 33.3 28.3 37.5 33.335.0
BIOLOGY
13.22016 * 37.5 20.4 22.9 * 21.910.0
15.12017 * 40.0 46.9 43.9 * 45.9*
15 42
22 42
30 31
10,1922018 516 46 16 5720
9,6802016 2 548 48 3 6420
9,6222017 2 4910 57 2 614Tests Taken
August 7, 2018 Dallas ISD Evaluation & Assessment (Office of Institutional Research) rpt_STAAREOC_sc_per_mst 2018-19 Data Packet
24W.L. LASSITER, JR. EARLY COLLEGE HIGH SCHOOL (90)
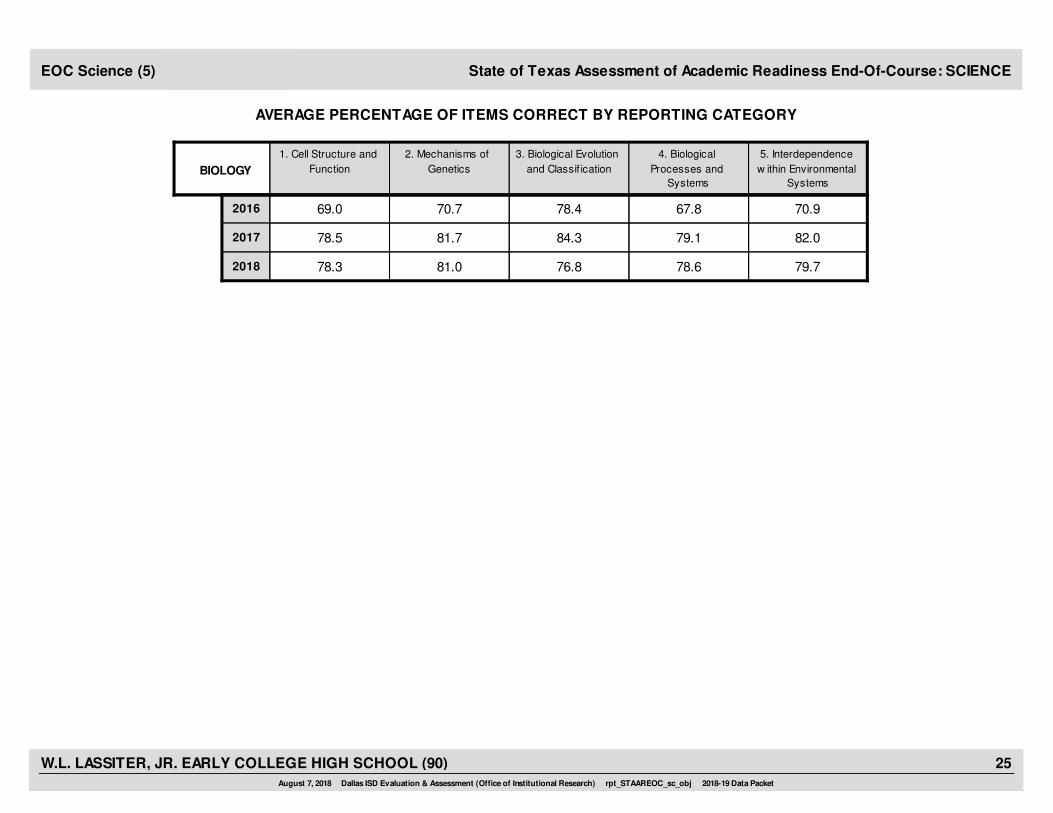
AVERAGE PERCENTAGE OF ITEMS CORRECT BY REPORTING CATEGORY
State of Texas Assessment of Academic Readiness End-Of-Course: SCIENCEEOC Science (5)
2018 78.3 81.0 76.8 78.6 79.7
2016 69.0 70.7 78.4 67.8 70.9
2017 78.5 81.7 84.3 79.1 82.0
1. Cell Structure and
Function
2. Mechanisms of
Genetics
3. Biological Evolution
and Classif ication
4. Biological
Processes and
Systems
5. Interdependence
w ithin Environmental
SystemsBIOLOGY
August 7, 2018 Dallas ISD Evaluation & Assessment (Office of Institutional Research) rpt_STAAREOC_sc_obj 2018-19 Data Packet
25W.L. LASSITER, JR. EARLY COLLEGE HIGH SCHOOL (90)
FemaleMigrant MaleAt RiskWhiteAfricanAmer
HispanicEcon
DisadvSpecialEduc
LEP All DistrictYearTest
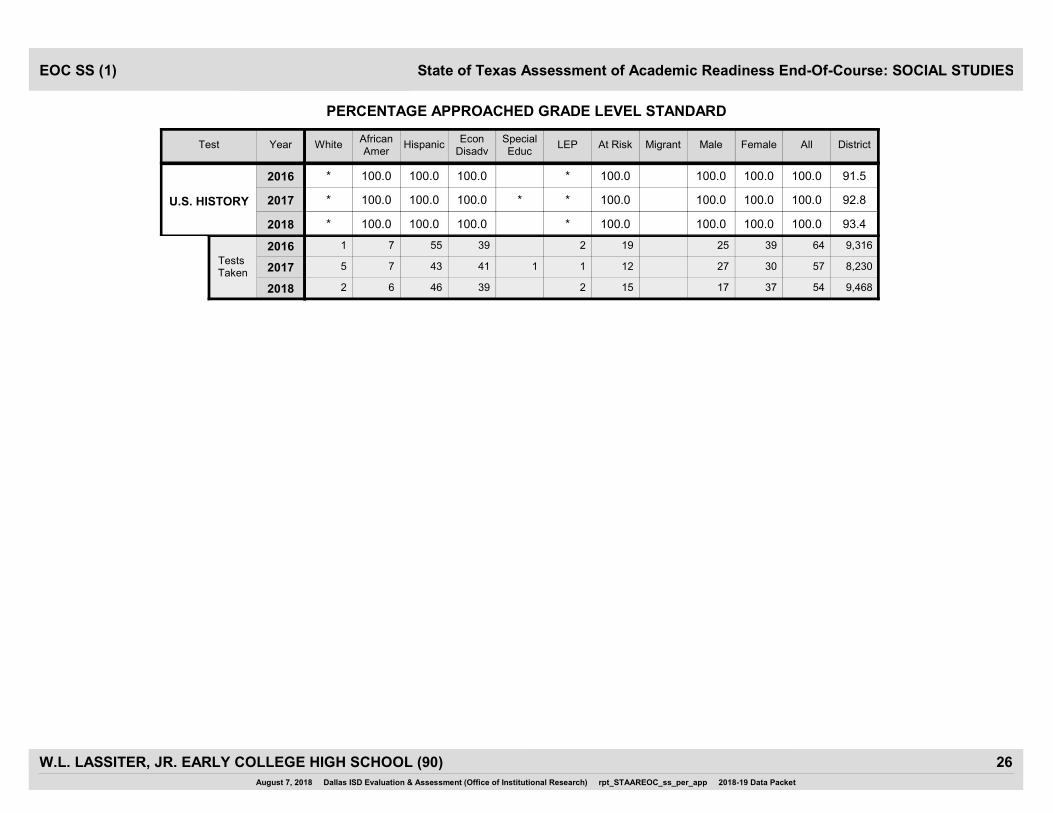
PERCENTAGE APPROACHED GRADE LEVEL STANDARD
EOC SS (1) State of Texas Assessment of Academic Readiness End-Of-Course: SOCIAL STUDIES
100.0 100.0
100.0 100.0
100.0 100.0
93.42018 * 100.0 100.0 100.0 * 100.0100.0
U.S. HISTORY
91.52016 * 100.0 100.0 100.0 * 100.0100.0
92.82017 * 100.0 100.0 100.0 * * 100.0100.0
17 37
25 39
27 30
9,4682018 2 466 39 2 5415
9,3162016 1 557 39 2 6419
8,2302017 5 437 41 1 1 5712Tests Taken
August 7, 2018 Dallas ISD Evaluation & Assessment (Office of Institutional Research) rpt_STAAREOC_ss_per_app 2018-19 Data Packet
26W.L. LASSITER, JR. EARLY COLLEGE HIGH SCHOOL (90)
FemaleMigrant MaleAt RiskWhiteAfricanAmer
HispanicEcon
DisadvSpecialEduc
LEP All DistrictYearTest
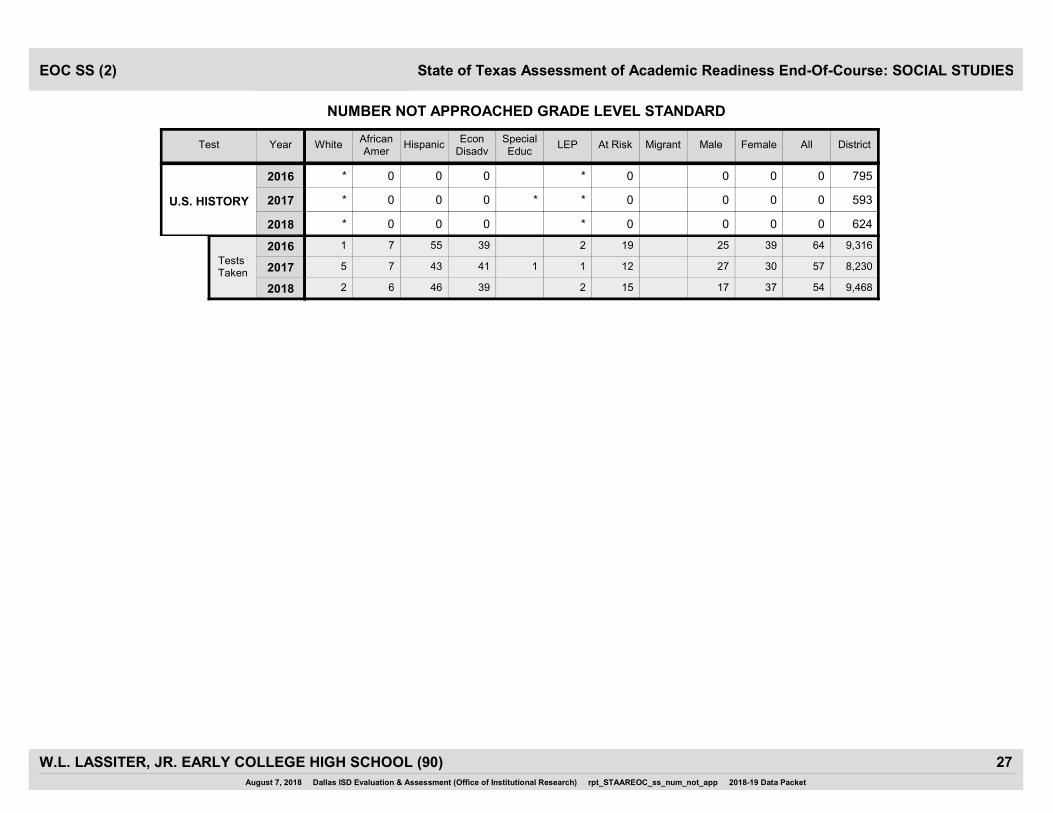
NUMBER NOT APPROACHED GRADE LEVEL STANDARD
EOC SS (2) State of Texas Assessment of Academic Readiness End-Of-Course: SOCIAL STUDIES
0 0
0 0
0 0
6242018 * 0 0 0 * 00
U.S. HISTORY
7952016 * 0 0 0 * 00
5932017 * 0 0 0 * * 00
17 37
25 39
27 30
9,4682018 2 466 39 2 5415
9,3162016 1 557 39 2 6419
8,2302017 5 437 41 1 1 5712Tests Taken
August 7, 2018 Dallas ISD Evaluation & Assessment (Office of Institutional Research) rpt_STAAREOC_ss_num_not_app 2018-19 Data Packet
27W.L. LASSITER, JR. EARLY COLLEGE HIGH SCHOOL (90)
FemaleMigrant MaleAt RiskWhiteAfricanAmer
HispanicEcon
DisadvSpecialEduc
LEP All DistrictYearTest
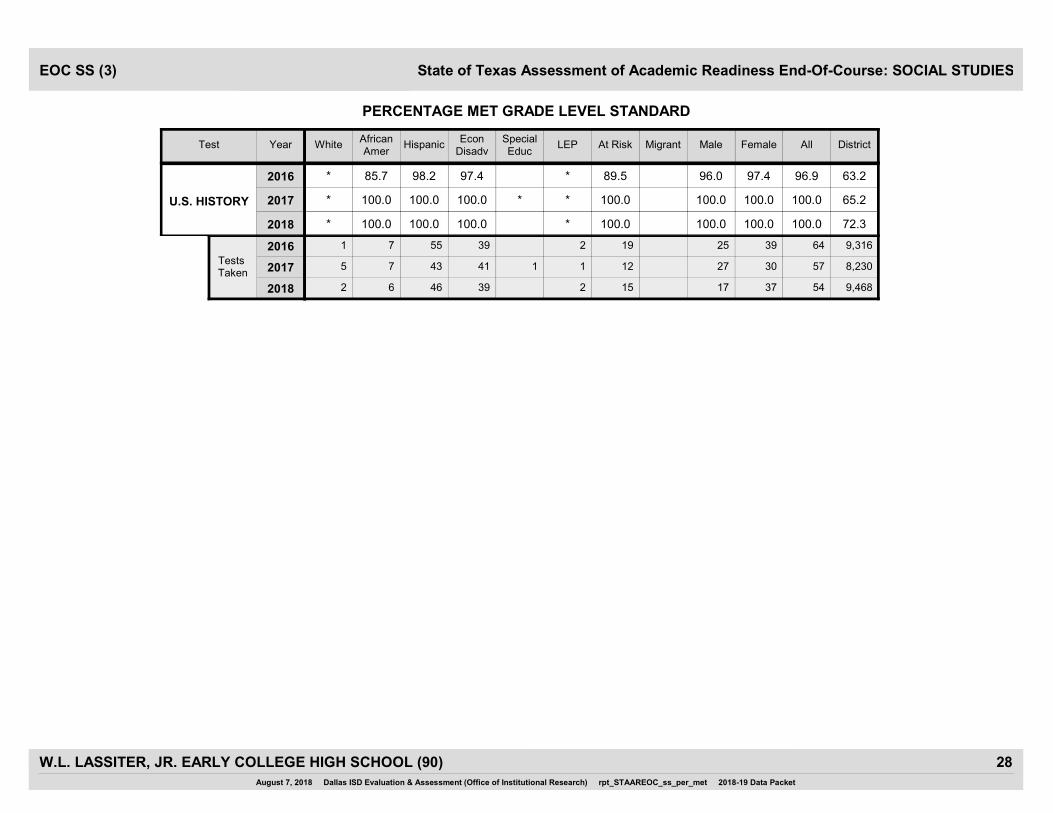
PERCENTAGE MET GRADE LEVEL STANDARD
EOC SS (3) State of Texas Assessment of Academic Readiness End-Of-Course: SOCIAL STUDIES
100.0 100.0
96.0 97.4
100.0 100.0
72.32018 * 100.0 100.0 100.0 * 100.0100.0
U.S. HISTORY
63.22016 * 85.7 98.2 97.4 * 96.989.5
65.22017 * 100.0 100.0 100.0 * * 100.0100.0
17 37
25 39
27 30
9,4682018 2 466 39 2 5415
9,3162016 1 557 39 2 6419
8,2302017 5 437 41 1 1 5712Tests Taken
August 7, 2018 Dallas ISD Evaluation & Assessment (Office of Institutional Research) rpt_STAAREOC_ss_per_met 2018-19 Data Packet
28W.L. LASSITER, JR. EARLY COLLEGE HIGH SCHOOL (90)

FemaleMigrant MaleAt RiskWhiteAfricanAmer
HispanicEcon
DisadvSpecialEduc
LEP All DistrictYearTest
PERCENTAGE MASTERED GRADE LEVEL STANDARD
EOC SS (4) State of Texas Assessment of Academic Readiness End-Of-Course: SOCIAL STUDIES
100.0 89.2
88.0 66.7
88.9 100.0
38.62018 * 66.7 95.7 94.9 * 92.680.0
U.S. HISTORY
26.52016 * 42.9 78.2 74.4 * 75.042.1
30.82017 * 100.0 95.3 97.6 * * 94.783.3
17 37
25 39
27 30
9,4682018 2 466 39 2 5415
9,3162016 1 557 39 2 6419
8,2302017 5 437 41 1 1 5712Tests Taken
August 7, 2018 Dallas ISD Evaluation & Assessment (Office of Institutional Research) rpt_STAAREOC_ss_per_mst 2018-19 Data Packet
29W.L. LASSITER, JR. EARLY COLLEGE HIGH SCHOOL (90)
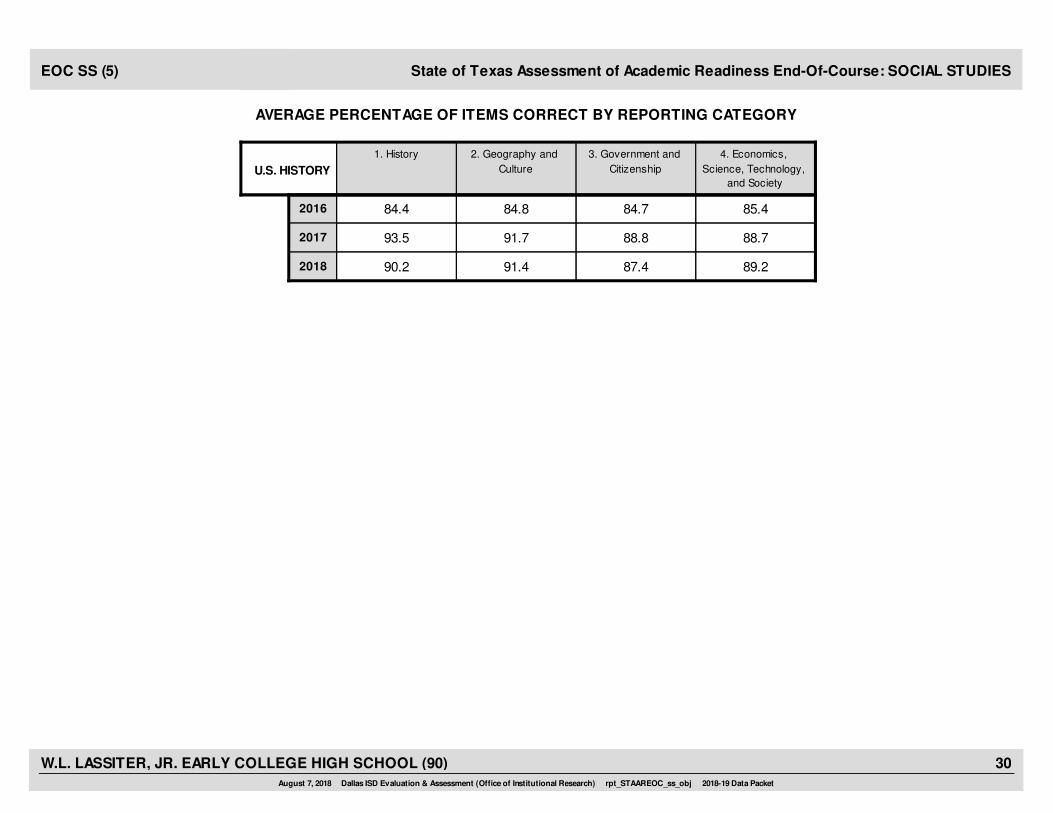
AVERAGE PERCENTAGE OF ITEMS CORRECT BY REPORTING CATEGORY
EOC SS (5) State of Texas Assessment of Academic Readiness End-Of-Course: SOCIAL STUDIES
2018 90.2 91.4 87.4 89.2
2016 84.4 84.8 84.7 85.4
2017 93.5 91.7 88.8 88.7
1. History 2. Geography and
Culture
3. Government and
Citizenship
4. Economics,
Science, Technology,
and SocietyU.S. HISTORY
August 7, 2018 Dallas ISD Evaluation & Assessment (Office of Institutional Research) rpt_STAAREOC_ss_obj 2018-19 Data Packet
30W.L. LASSITER, JR. EARLY COLLEGE HIGH SCHOOL (90)
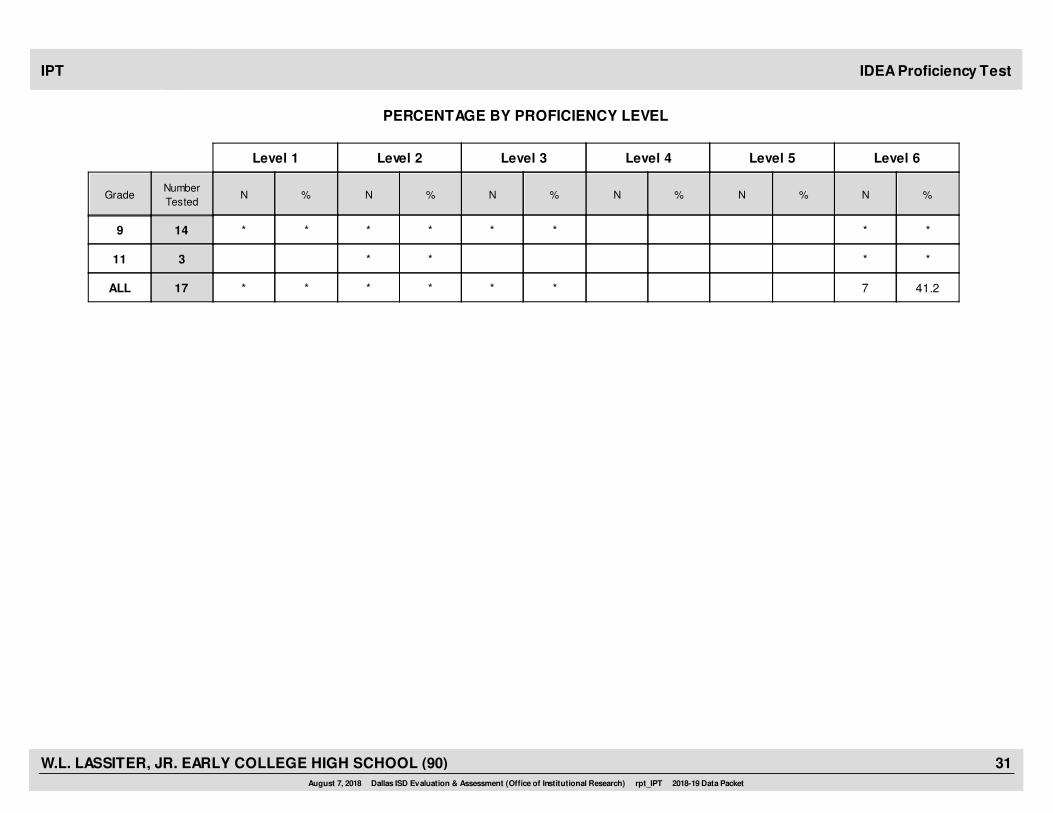
IDEA Proficiency Test
PERCENTAGE BY PROFICIENCY LEVEL
IPT
%NNumber
Tested%NNNGrade N N %%%%
Level 6Level 5Level 4Level 3Level 2Level 1
******* *9 14
*** *11 3
7****** 41.2ALL 17
August 7, 2018 Dallas ISD Evaluation & Assessment (Office of Institutional Research) rpt_IPT 2018-19 Data Packet
31W.L. LASSITER, JR. EARLY COLLEGE HIGH SCHOOL (90)
Course% Items Correct
CourseMark
ACP ACP
Averages % Passing District % Passing
Course Mark(no ACP)
ScaleScore
NumberTested
Course
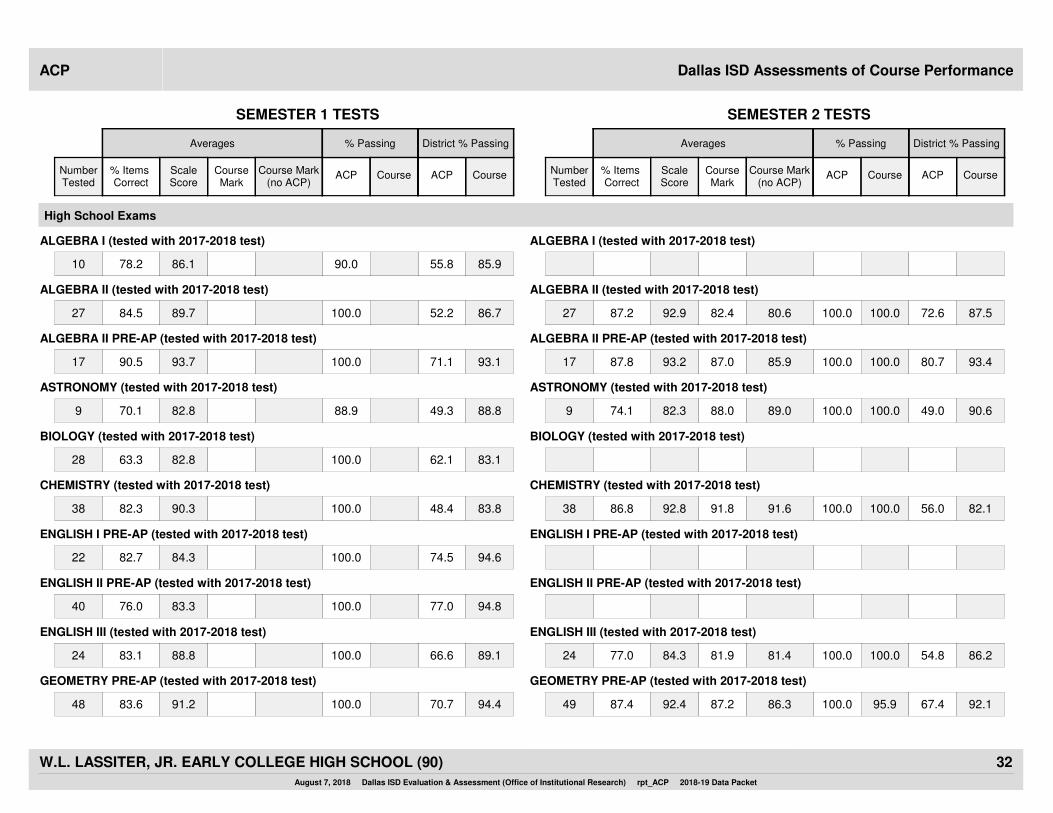
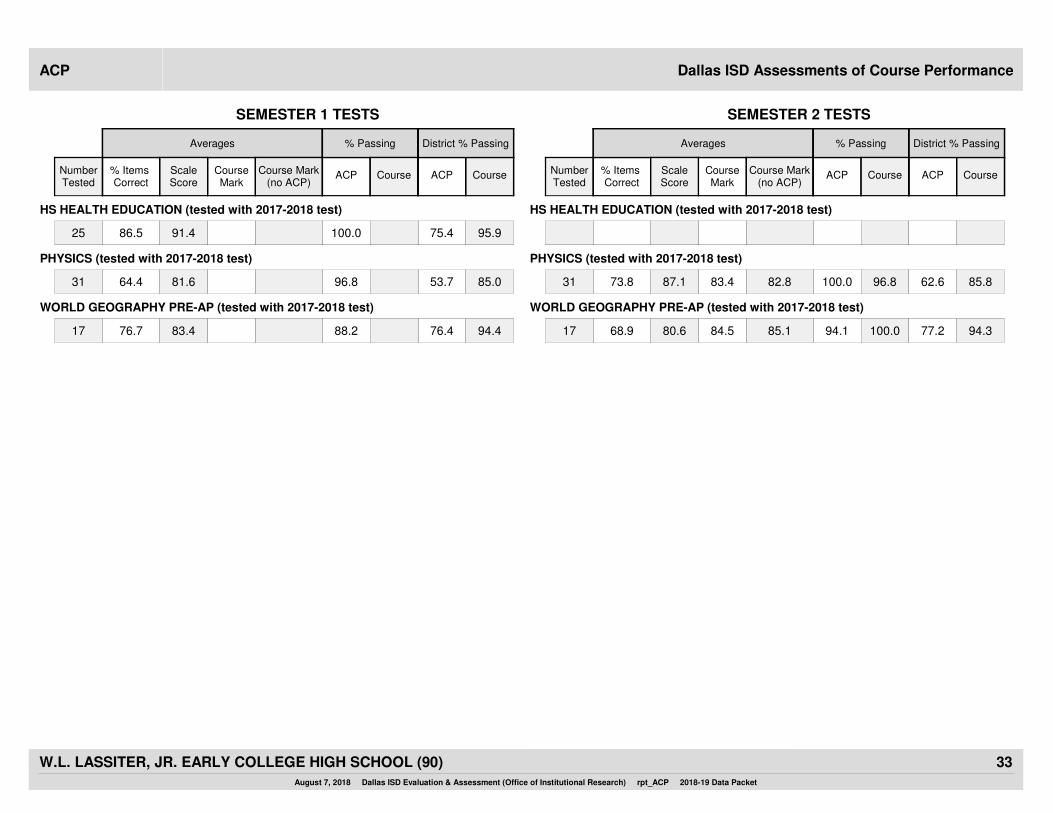
Dallas ISD Assessments of Course PerformanceACP
Course% Items Correct
CourseMark
ACP ACP
Averages % Passing District % Passing
Course Mark(no ACP)
ScaleScore
NumberTested
Course
SEMESTER 1 TESTS SEMESTER 2 TESTS
High School Exams
ALGEBRA I (tested with 2017-2018 test) ALGEBRA I (tested with 2017-2018 test)
78.2 86.1 90.0 55.8 85.910
ALGEBRA II (tested with 2017-2018 test) ALGEBRA II (tested with 2017-2018 test)
84.5 89.7 100.0 52.2 86.7 80.687.2 92.9 82.4 100.0 100.0 72.6 87.52727
ALGEBRA II PRE-AP (tested with 2017-2018 test) ALGEBRA II PRE-AP (tested with 2017-2018 test)
90.5 93.7 100.0 71.1 93.1 85.987.8 93.2 87.0 100.0 100.0 80.7 93.41717
ASTRONOMY (tested with 2017-2018 test) ASTRONOMY (tested with 2017-2018 test)
70.1 82.8 88.9 49.3 88.8 89.074.1 82.3 88.0 100.0 100.0 49.0 90.699
BIOLOGY (tested with 2017-2018 test) BIOLOGY (tested with 2017-2018 test)
63.3 82.8 100.0 62.1 83.128
CHEMISTRY (tested with 2017-2018 test) CHEMISTRY (tested with 2017-2018 test)
82.3 90.3 100.0 48.4 83.8 91.686.8 92.8 91.8 100.0 100.0 56.0 82.13838
ENGLISH I PRE-AP (tested with 2017-2018 test) ENGLISH I PRE-AP (tested with 2017-2018 test)
82.7 84.3 100.0 74.5 94.622
ENGLISH II PRE-AP (tested with 2017-2018 test) ENGLISH II PRE-AP (tested with 2017-2018 test)
76.0 83.3 100.0 77.0 94.840
ENGLISH III (tested with 2017-2018 test) ENGLISH III (tested with 2017-2018 test)
83.1 88.8 100.0 66.6 89.1 81.477.0 84.3 81.9 100.0 100.0 54.8 86.22424
GEOMETRY PRE-AP (tested with 2017-2018 test) GEOMETRY PRE-AP (tested with 2017-2018 test)
83.6 91.2 100.0 70.7 94.4 86.387.4 92.4 87.2 100.0 95.9 67.4 92.14948
August 7, 2018 Dallas ISD Evaluation & Assessment (Office of Institutional Research) rpt_ACP 2018-19 Data Packet
32W.L. LASSITER, JR. EARLY COLLEGE HIGH SCHOOL (90)
Course% Items Correct
CourseMark
ACP ACP
Averages % Passing District % Passing
Course Mark(no ACP)
ScaleScore
NumberTested
Course
Dallas ISD Assessments of Course PerformanceACP
Course% Items Correct
CourseMark
ACP ACP
Averages % Passing District % Passing
Course Mark(no ACP)
ScaleScore
NumberTested
Course
SEMESTER 1 TESTS SEMESTER 2 TESTS
HS HEALTH EDUCATION (tested with 2017-2018 test) HS HEALTH EDUCATION (tested with 2017-2018 test)
86.5 91.4 100.0 75.4 95.925
PHYSICS (tested with 2017-2018 test) PHYSICS (tested with 2017-2018 test)
64.4 81.6 96.8 53.7 85.0 82.873.8 87.1 83.4 100.0 96.8 62.6 85.83131
WORLD GEOGRAPHY PRE-AP (tested with 2017-2018 test) WORLD GEOGRAPHY PRE-AP (tested with 2017-2018 test)
76.7 83.4 88.2 76.4 94.4 85.168.9 80.6 84.5 94.1 100.0 77.2 94.31717
August 7, 2018 Dallas ISD Evaluation & Assessment (Office of Institutional Research) rpt_ACP 2018-19 Data Packet
33W.L. LASSITER, JR. EARLY COLLEGE HIGH SCHOOL (90)
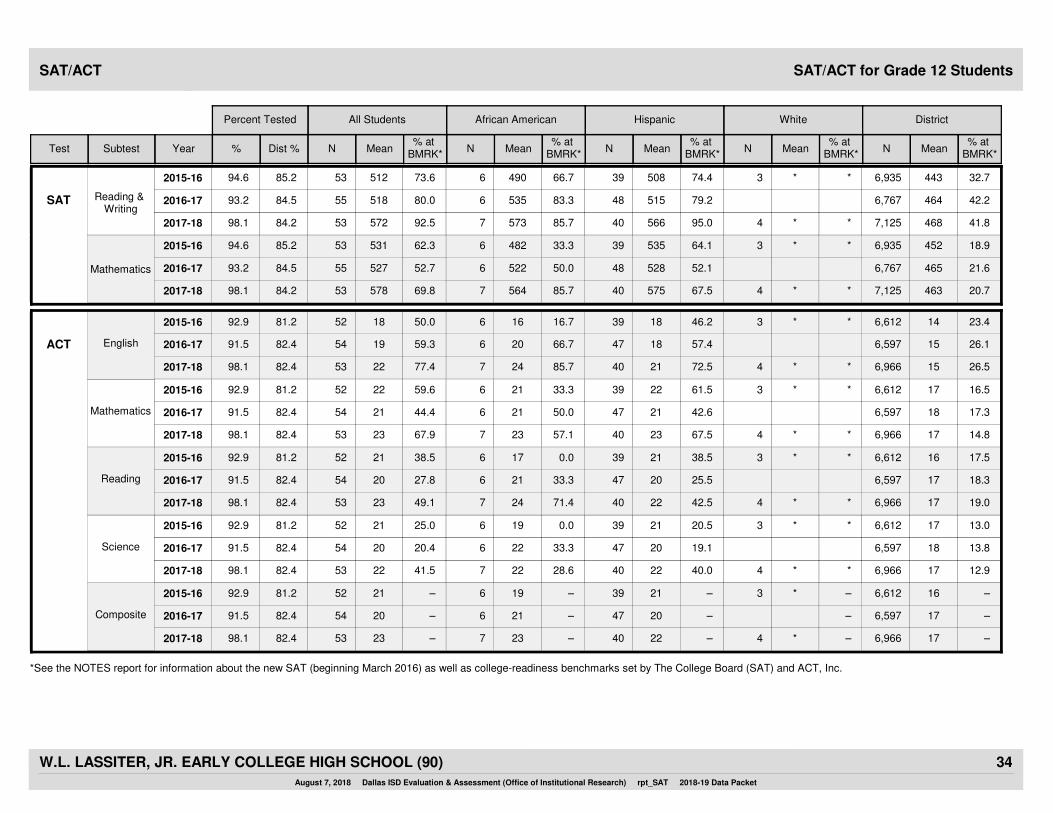
SAT/ACT for Grade 12 StudentsSAT/ACT
All Students Hispanic White DistrictAfrican American
Subtest Year Dist % MeanN N MeanN MeanMeanN N MeanTest %
Percent Tested
% at BMRK*
% at BMRK*
% at BMRK*
% at BMRK*
% at BMRK*
ACT English 6,5971847206195491.5 15
6,612*31839166185292.9 14
6,966*42140247225398.1 15
2015-16
2016-17
2017-18
82.4
81.2
82.4
59.3
50.0
77.4
66.7
16.7
85.7
57.4
46.2
72.5
*
*
26.1
23.4
26.5
Mathematics 6,5972147216215491.5 18
6,612*32239216225292.9 17
6,966*42340237235398.1 17
2015-16
2016-17
2017-18
82.4
81.2
82.4
44.4
59.6
67.9
50.0
33.3
57.1
42.6
61.5
67.5
*
*
17.3
16.5
14.8
Reading 6,5972047216205491.5 17
6,612*32139176215292.9 16
6,966*42240247235398.1 17
2015-16
2016-17
2017-18
82.4
81.2
82.4
27.8
38.5
49.1
33.3
0.0
71.4
25.5
38.5
42.5
*
*
18.3
17.5
19.0
Science 6,5972047226205491.5 18
6,612*32139196215292.9 17
6,966*42240227225398.1 17
2015-16
2016-17
2017-18
82.4
81.2
82.4
20.4
25.0
41.5
33.3
0.0
28.6
19.1
20.5
40.0
*
*
13.8
13.0
12.9
Composite 6,5972047216205491.5 17
6,612*32139196215292.9 16
6,966*42240237235398.1 17
2015-16
2016-17
2017-18
82.4
81.2
82.4
–
–
–
–
–
–
–
–
–
–
–
–
–
–
–
SAT
7,125*45664057375725398.1 468
6,7675154853565185593.2 464
6,935*35083949065125394.6 443
Reading & Writing
2015-16
2016-17
2017-18 84.2
84.5
85.2 73.6
80.0
92.5
66.7
83.3
85.7
74.4
79.2
95.0
*
*
32.7
42.2
41.8
7,125*45754056475785398.1 463
6,7675284852265275593.2 465
6,935*35353948265315394.6 452
Mathematics
2015-16
2016-17
2017-18 84.2
84.5
85.2 62.3
52.7
69.8
33.3
50.0
85.7
64.1
52.1
67.5
*
*
18.9
21.6
20.7
*See the NOTES report for information about the new SAT (beginning March 2016) as well as college-readiness benchmarks set by The College Board (SAT) and ACT, Inc.
August 7, 2018 Dallas ISD Evaluation & Assessment (Office of Institutional Research) rpt_SAT 2018-19 Data Packet
34W.L. LASSITER, JR. EARLY COLLEGE HIGH SCHOOL (90)
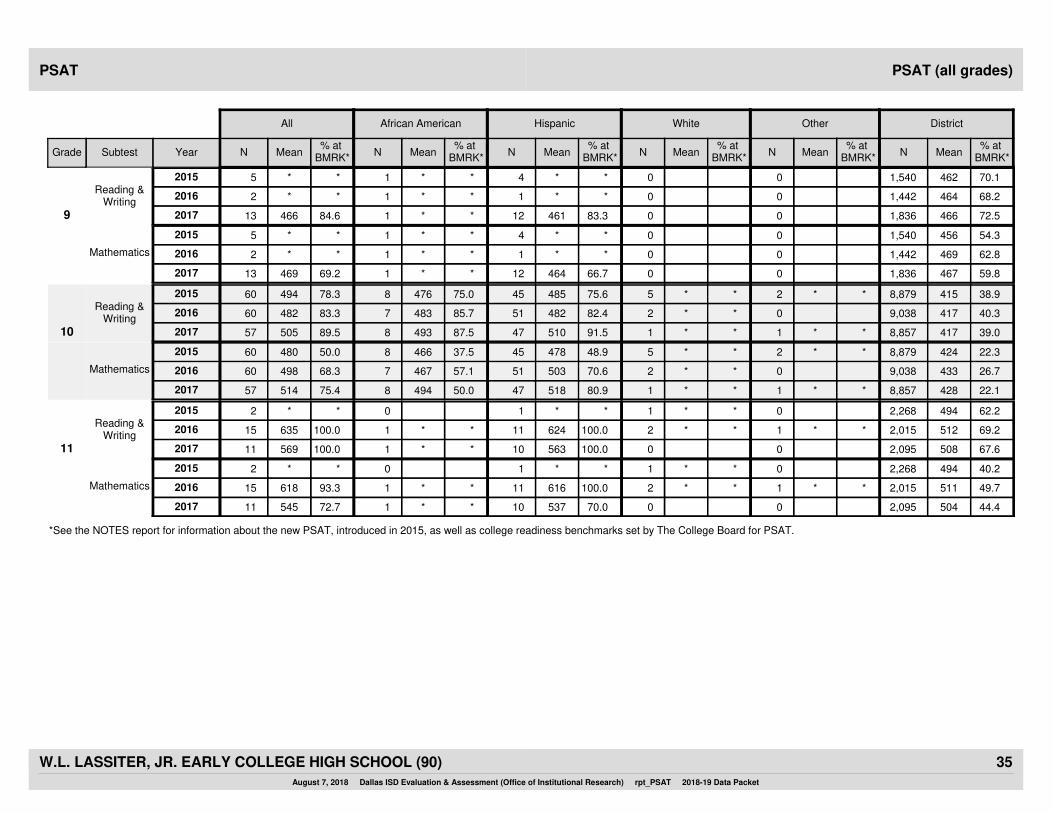
OtherWhite
PSAT (all grades)PSAT
All African American Hispanic District
Mean MeanNN MeanMeanN N MeanMean NNSubtest Year% at
BMRK*% at
BMRK*% at
BMRK*% at
BMRK*% at
BMRK% at
BMRK*% at
BMRK*Grade
9 2017
2015
2016
0 0 4661,836 72.5
0 0 4621,540 70.1
0 0 4641,442 68.2
*1 4611213 466 84.6 * 83.3
*4*15 * * * *
*1*12 * * * *Reading &
Writing
2017
2015
2016
0 0 4671,836 59.8
0 0 4561,540 54.3
0 0 4691,442 62.8
*1 4641213 469 69.2 * 66.7
*4*15 * * * *
*1*12 * * * *Mathematics
10 2017
2015
2016
*
*
*1 *1 4178,857* 39.0
*5 *2 4158,879* 38.9
*2 0 4179,038* 40.3
4938 5104757 505 89.5 87.5 91.5
48545476860 494 78.3 75.0 75.6
48251483760 482 83.3 85.7 82.4Reading &
Writing
2017
2015
2016
*
*
*1 *1 4288,857* 22.1
*5 *2 4248,879* 22.3
*2 0 4339,038* 26.7
4948 5184757 514 75.4 50.0 80.9
47845466860 480 50.0 37.5 48.9
50351467760 498 68.3 57.1 70.6Mathematics
11 2017
2015
2016 *
0 0 5082,095 67.6
*1 0 4942,268* 62.2
*2 *1 5122,015* 69.2
*1 5631011 569 100.0 * 100.0
*102 * * *
62411*115 635 100.0 * 100.0Reading &
Writing
2017
2015
2016 *
0 0 5042,095 44.4
*1 0 4942,268* 40.2
*2 *1 5112,015* 49.7
*1 5371011 545 72.7 * 70.0
*102 * * *
61611*115 618 93.3 * 100.0Mathematics
*See the NOTES report for information about the new PSAT, introduced in 2015, as well as college readiness benchmarks set by The College Board for PSAT.
August 7, 2018 Dallas ISD Evaluation & Assessment (Office of Institutional Research) rpt_PSAT 2018-19 Data Packet
35W.L. LASSITER, JR. EARLY COLLEGE HIGH SCHOOL (90)
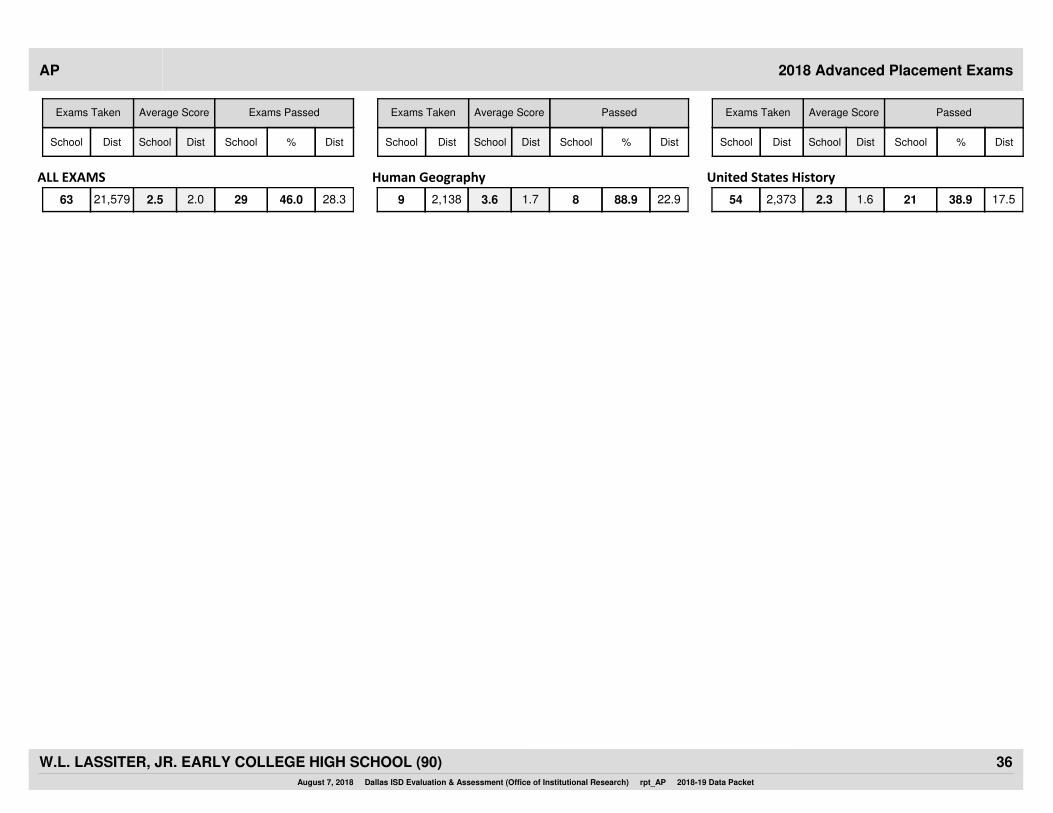
Passed
School Dist%
Passed
School Dist%Dist School
Average Score
2018 Advanced Placement ExamsAP
Dist
Average Score Exams Passed
%DistSchool
Exams Taken Average Score
DistSchoolDistSchool
Exams Taken
DistSchoolDistSchool
Exams Taken
School
ALL EXAMS
21,579 46.063 2.5 28.32.0 29
Human Geography
2,138 88.99 3.6 22.91.7 8
United States History
2,373 38.954 2.3 17.51.6 21
August 7, 2018 Dallas ISD Evaluation & Assessment (Office of Institutional Research) rpt_AP 2018-19 Data Packet
36W.L. LASSITER, JR. EARLY COLLEGE HIGH SCHOOL (90)