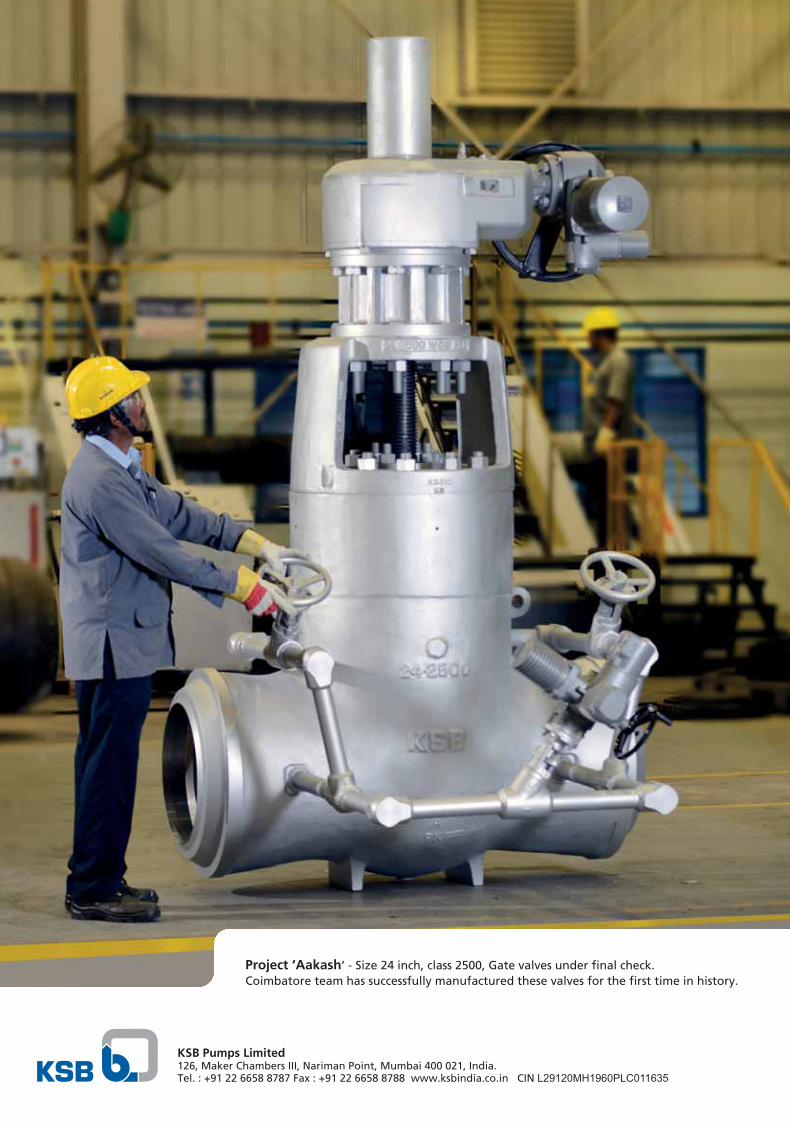
Anisha Motwani - Max Life - from being social to buying social


1
CONTENTS KSB PUMPS LIMITED
Page Nos.
General Information ....................................................................................................... 2
Board’s Report .......................................................................................................... 3 – 6
Annexure
i. Management Discussion and Analysis Report ....................................... 7 – 10
ii. Report on Corporate Governance ...................................................... 11 – 21
iii. Other Annexures ................................................................................. 22 – 48
Auditors’ Report ................................................................................................... 49 – 55
Balance Sheet ................................................................................................................ 56
Statement of Profit & Loss ........................................................................................... 57
Cash Flow ............................................................................................................ 58 – 59
Notes 1 to 43 ....................................................................................................... 60 – 84
Consolidated Financial Statements ..................................................................... 85 – 116
ANNUAL GENERAL MEETING
Date : 26th April, 2017
Day : Wednesday
Time : 3.00 p.m.
Venue : Bajaj Bhavan, Ground Floor, (Kamalnayan Bajaj Hall), 226, Nariman Point, Mumbai- 400 021.
COMMUNICATION DETAILS
Tel No. : 022-66588787
Fax No. : 022-66588788
Shareholders’ Grievance Cell : [email protected]
Website : www.ksbindia.co.in
2
GENERAL INFORMATIONBoard of DirectorsMr. G. Swarup (Chairman)Mr. A.R. BroachaMr. D.N. DamaniaMr. N.N. Kampani
Mr. Pradip Shah
Dr. Stephan BrossMr. V.K. Viswanathan Ms. S.F. Motwani Mr. W. Stegmuller Mr. Rajeev Jain (Managing Director)
Registered Office126, Maker Chambers III, Nariman Point, Mumbai – 400 021
Zonal OfficesNorth - NoidaOffices - Chandigarh, Jaipur & LucknowEast - KolkataOffices - Bhubaneshwar, Jamshedpur & RaipurWest - MumbaiOffices - Ahmedabad, Aurangabad, Baroda, Indore, Nagpur & PuneSouth - ChennaiOffices - Bengaluru & Secunderabad
FactoriesMaharashtra -Pimpri, Pune Chinchwad, Pune Vambori Dist. AhmednagarSinnar, Dist. Nashik Kesurdi, Shirwal, Dist. Satara
Tamil Nadu -NSN Palayam, Coimbatore
Collaborators KSB Aktiengesellschaft, Germany
Bankers Central Bank of India Deutsche Bank AG Standard Chartered Bank
Auditors Deloitte Haskins & Sells LLP
Cost Auditors Dhananjay V. Joshi & Associates
Registrar & Transfer Agent Link Intime India Pvt. Ltd.
Tel. No. : 022 49186270
E-mail : [email protected]
3
BOARD’S REPORT
ToThe Shareholders,
The Board of Directors have pleasure to submit the report and audited financial statements of the Company for the year ended 31st December, 2016.
FINANCIAL RESULTS AND DIVIDEND
Financial Results:
` in Million
Year ended
31.12.2016
Year ended
31.12.2015
Revenue from operations (net) & Other Income 8,528.32 8,496.80Profit before taxation 930.09 1,054.88Less: Tax expense Current 338.00 384.13 Short / (excess)
provision in respect of earlier years 3.83 -
Deferred tax (Credit) (29.29) (27.53)312.54 356.60
Profit for the year 617.55 698.28Balance brought forward 4,095.65 3,620.33Profit for appropriation 4,713.20 4,318.61
Appropriations:Proposed dividend 191.44 191.44Tax on proposed dividend 38.97 31.52General Reserve - -Surplus carried to Balance Sheet 4,482.79 4,095.65
4,713.20 4,318.61
Note: Previous year’s figures have been regrouped/ reclassified, wherever necessary to correspond with the current year classification/disclosure.
Dividend:
The Board of Directors propose a dividend of ` 5.50 per share of ` 10 each (55%).
Dividend Distribution Policy of the company as required under Securities and Exchange Board of India (Listing Obligations and Disclosure Requirements) Regulations, 2015 (“Listing Regulations, 2015”) is available on the Company’s website at www.ksbindia.co.in.
GENERAL REVIEW
Working:
During the year under review, the Company has earned lower profit before tax compared to the previous year due to tough market conditions and price realization. The overall economic slowdown and delay in project execution continued in 2016. Hence, situation of heavy pressure on margins continued in the year.
Export decreased by ` 454 Million from ` 1,587 Million last year to ` 1,133 Million.
The Company expects to complete Phase – I of its expansion plans in April 2017 wherein the new plant facility at MIDC, Shirwal, Maharashtra will be available for manufacturing/processing in respect of activities of high-end engineered pumps for Super Critical Power Plants.
The Company continues with its efforts to maintain growth even during the economic downturn and face new challenges.
Unclaimed Bonus Shares:
Total 20,304 bonus shares held by 144 shareholders were unclaimed in the end of year 2015. During the year no shareholders had approached/ claimed for bonus shares. The total number of shares outstanding at the end the year 2016 is 20,304 held by 144 shareholders.
Fixed Deposits:
The Company has no unclaimed deposits.
Transfer to Investor Education & Protection Fund:
During the year, in accordance with section 205C of the Companies Act, 1956, and Section 125 of the Companies Act, 2013 (“the Act”) an amount of ` 289,313 being unclaimed dividends up to the year 31st December, 2009, were transferred to the Investor Education & Protection Fund established by the Central Government.
Subsidiary & Associate:
The Company has 1 subsidiary, viz. Pofran Sales and Agency Limited and 1 associate, viz. KSB MIL Controls Limited (formerly MIL Controls Limited) as on 31st December, 2016.
4
BOARD’S REPORT (Contd.)
In accordance with Section 129 (3) of the Act and Regulation 34 of Listing Regulations, 2015, the audited consolidated financial statements of the Company form part of the Annual Report. A statement containing salient features of the financial statements of the Company’s subsidiary and associate is annexed to this Report in prescribed form AOC-1.
The audited financial statements of Pofran Sales and Agency Limited have been placed on the website of the Company viz. www.ksbindia.co.in and are available for inspection at the registered office of the Company. The Company will also make available these documents upon request by any member of the Company interested in obtaining the same.
MANAGEMENT DISCUSSION AND ANALYSIS REPORT
Annexed to this Report
REPORT ON CORPORATE GOVERNANCE
Annexed to this Report alongwith certificate thereon.
BUSINESS RESPONSIBILITY REPORT
Regulation 34(2) of Listing Regulations, 2015, inter alia, provides that the annual report of the top 500 listed entities based on market capitalization (calculated as on March 31 of every financial year), shall include a Business Responsibility Report (“BRR”). The Company, being one of such 500 listed entities, has annexed BRR to this Report, as part of the Annual Report, describing initiatives taken by the Company from an environmental, social and governance perspective.
EXTRACT OF ANNUAL RETURN
Pursuant to Section 134(3)(a) of the Act, an extract of Annual Return in prescribed form MGT-9 is annexed to this report.
PARTICULARS OF CONTRACTS OR ARRANGEMENTS WITH RELATED PARTIESContracts or arrangements with related parties referred to under Section 188 of the Act, entered into during the financial year, were on an arm’s length basis. No material contracts or arrangements with related parties were entered into during the year under review. Accordingly,
no transactions are being reported in form AOC-2 in terms of section 134 of the Act.
PARTICULARS OF LOANS, GUARANTEES OR INVESTMENTSThe Company has not granted any loans, guarantees and investments covered under section 186 of the Act during the year.
VIGIL MECHANISM / WHISTLE BLOWER POLICYThe Company has established a vigil mechanism to provide avenues to the Directors and employees to bring to the attention of the management, the concerns about behaviour of employees that raise concerns including fraud by using the mechanism provided in the Whistle Blower Policy. The details of the said policy are included in the report on Corporate Governance.
RISK MANAGEMENT The Company has laid down procedures and informed the Board members about the risk assessment and minimization procedures. These procedures are periodically reviewed to ensure that executive management controls risk through means of a properly defined framework.
SIGNIFICANT AND MATERIAL ORDERS PASSED BY THE REGULATORS OR COURTSThere is no significant or material order passed during the year by any regulators, courts or tribunals impacting the going concern status of the Company or its future operations.
MATERIAL CHANGES AND COMMITMENTS AFFECTING THE FINANCIAL POSITION OF THE COMPANYThere have been no material changes and commitments affecting the financial position of the Company which have occurred between the end of the financial year of the Company to which the financial statements relate and the date of this report.
POLICY ON PREVENTION, PROHIBITION AND REDRESSAL OF SEXUAL HARASSMENT OF WOMEN AT WORKPLACE
The Company has in place a policy for Prevention, Prohibition and Redressal of Sexual Harassment at Workplace in line with the requirements of the Sexual Harassment of
5
BOARD’S REPORT (Contd.)
Women at Workplace (Prevention, Prohibition and Redressal) Act, 2013 and Rules framed thereunder and Internal Complaints Committee has also been set up to redress complaints received regarding sexual harassment. During the year, no complaint with allegations of sexual harassment was received by the Company.
DIRECTORS AND KEY MANAGERIAL PERSONNEL Mr. Werner Stegmuller, Director, retires by rotation and is eligible for re-appointment.
Mr. N. N. Kampani retires by rotation and has expressed his intention not to seek re-appointment. The Board expresses its sincere appreciation for the valuable services provided by him during his tenure as a Director. The Board does not intend to fill this casual vacancy.
Mr. W. Spiegel retired from the services as Managing Director of the Company from 30th June, 2016. The Board expresses its sincere appreciation for the valuable services provided by him during his tenure as Managing Director.
At the Board Meeting held on 27th June, 2016 Mr. Rajeev Jain was appointed as Additional Director and Managing Director of Company effective from 1st July, 2016 and he shall hold office upto the date of ensuing the Annual General Meeting. The Company has received a notice in writing from a member proposing his candidature for appointment of Director under Section 160 of the Companies Act, 2013.
DECLARATIONS BY INDEPENDENT DIRECTORS
The Independent Directors have given a declaration to the Company that they meet the criteria of independence as per Section 149(6) of the Act.
BOARD MEETINGS
During the year ended 31st December, 2016, five meetings of the Board were held.
POLICY ON DIRECTORS’ APPOINTMENT AND REMUNERATION
The policy on Director’s appointment and remuneration including criteria for determining qualifications, positive attributes, independence of Director, and other matters forms part of report on Corporate Governance.
EVALUATION OF BOARD OF DIRECTORS
The details of the annual evaluation of Board, its Committees and individual Directors are mentioned in the report on Corporate Governance.
BOARD COMMITTEES
Your Company has five Committees of Board, viz,
1. Audit Committee
2. Stakeholders’ Relationship Committee
3. Nomination and Remuneration Committee
4. Corporate Social Responsibility Committee
5. Share Transfer Committee
Details of all the Committees along with their composition, terms of reference and meetings held during the year are provided in report on Corporate Governance.
DIRECTORS’ RESPONSIBILITY STATEMENT
Pursuant to Section 134(5) of the Act, the Board of Directors report that:(a) in the preparation of the annual accounts,
the applicable accounting standards had been followed along with proper explanation relating to material departures;
(b) they have selected such accounting policies and applied them consistently and made judgments and estimates that are reasonable and prudent so as to give a true and fair view of the state of affairs of the Company at the end of the financial year and of the profit or loss of the Company for that period;
(c) proper and sufficient care has been taken for the maintenance of adequate accounting records in accordance with the provisions of this Act for safeguarding the assets of the Company and for preventing and detecting fraud and other irregularities;
(d) they have prepared the annual accounts on a going concern basis;
(e) proper internal financial controls are in place and that such internal financial controls are adequate and are operating effectively; and
(f) systems to ensure compliance with the provisions of all applicable laws were in place and that such systems were adequate and operating effectively.
6
BOARD’S REPORT (Contd.)
PARTICULARS OF EMPLOYEES AND RELATED INFORMATIONIn terms of the provisions of Section 197(12) of the Act read with Rule 5 of the Companies (Appointment and Remuneration of Managerial Personnel) Rules, 2014, a statement containing the disclosures pertaining to remuneration and other details as required under the Act and the above Rules are provided in the Annual Report. The disclosures as specified under Rule 5(1) of the Companies (Appointment and Remuneration of Managerial Personnel) Rules, 2014, is annexed to this Report.
The informat ion regarding employee remuneration as required pursuant to Rule 5(2) and Rule 5(3) of the (Appointment and Remuneration of Managerial Personnel) Rules, 2014, is available for inspection by members at the registered office of the Company between 2.00 p.m. and 4.00 p.m. on any working day (Monday to Friday), upto the date of the fifty seventh Annual General Meeting. Any member interested in obtaining such information may write to the Company Secretary and the same will be furnished on such request.
STATUTORY AUDITORSThe existing auditors of the Company M/s Deloitte Haskins & Sells LLP (Registration No. 117366W/W-100018) will retire at the conclusion of this Annual General Meeting of the Company pursuant to the provisions of the Act requiring rotation of auditors. M/s Price Waterhouse Chartered Accountants LLP (Registration No. 012754N/N500016) is being recommended for appointment of auditors.
M/s Price Waterhouse Chartered Accountants LLP have confirmed that their appointment, if made, will be within the limits prescribed under the Act. Members are requested to consider their appointment from the conclusion of this Annual General Meeting until the conclusion of the 62nd Annual General Meeting and to fix their remuneration.
COST AUDITORSThe Company has appointed M/s Dhananjay V. Joshi and Associates, Cost Accountants, Pune as Cost Auditors to carry out the audit of Cost Accounts of the Company for the Financial Year 2016. The Cost Audit Report for Financial Year
2015 which was due to be filed with the Ministry of Corporate Affairs on 28th June, 2016, was filed on 27th May, 2016.
SECRETARIAL AUDITORSThe Company has appointed M/s Nilesh Shah & Associates, Company Secretaries, Mumbai as Secretarial Auditors of the Company. The Secretarial Audit Report for the Year 2016 is annexed to this Report.
COMMENTS ON AUDITORS’ REPORTThere are no qualifications, reservations, adverse remarks or disclaimers made by M/s Deloitte Haskins & Sells LLP, Chartered Accountants, in their Audit Report, M/s Dhananjay V. Joshi and Associates, Cost Accountants in their Cost Audit Report and M/s Nilesh Shah & Associates, Company Secretaries in their Secretarial Audit Report. The Statutory Auditors have not reported any incident of fraud to the Audit Committee of the Company during the financial year 2016.
CONSERVATION OF ENERGY, TECHNOLOGY ABSORPTION AND FOREIGN EXCHANGE EARNINGS AND OUTGOInformation as required to be given under Section 134(3)(m) of the Act read with Rule 8(3) of the Companies (Accounts) Rules, 2014 is furnished in the annexure to this report.
CORPORATE SOCIAL RESPONSIBILITY (CSR)The composition of the CSR Committee, CSR Policy and other required details are given in the Annual Report on CSR Activities annexed to this Report.
ACKNOWLEDGEMENTSThe Board of Directors are grateful to Canadian Kay Pump Ltd., the main shareholder, and to KSB AG, Germany, the Company’s collaborators, for their valuable assistance and support. They wish to record their appreciation for the co-operation and support of the Company’s shareholders, bankers and other lending institutions, all employees including the workers, staff and middle management and all others concerned with the Company’s business.
On behalf of the Board of DirectorsG. SWARUP
Mumbai, 20th February, 2017 Chairman
7
MANAGEMENT DISCUSSION & ANALYSIS REPORT
1.0 INTRODUCTION
The Company is engaged in the business of manufacture of power driven pumps and industrial valves. Castings are mainly produced for captive consumption.
2.0 I N D U S T RY S T R U C T U R E A N D DEVELOPMENT
2.1 General
In 2016, global economic activity remained sluggish. Global growth for 2016 is estimated at 3.1 %. Economic activities in both advanced economies and emerging markets and developing economies is forecast to accelerate in 2017 and 2018.
Indian economy is estimated to register a GDP growth rate of 7.1 % in 2016-17. The temporary negative consumption due to currency exchange initiative is expected to impact the growth. Average Consumer Price Index (“CPI”) inflation declined in 2016 compared to 2015.
2.2 Pumps & Valves Industries
Global economy being sluggish, there has been no upturn in the pumps and valves business worldwide. Markets in Asia had marginal growth during the year.
3.0 OPPORTUNITIES AND THREATS
With India’s growing requirements of energy and capacity addition planned by the Government through various initiatives, though demand is subdued at the moment, there exists substantial opportunity for future growth as the Company’s products are geared up for the requirements.
With the globalisation, new international players are making a thrust in the Indian market by creation of additional manufacturing capacities. This would result in further intensification of competition leading to price pressures.
4.0 SEGMENTWISE PERFORMANCE
During the year under review, pumps and related spares worth ` 6,296 Million (Previous year ` 6,174 Million) and valves and related spares worth ` 1,238 Million (Previous year ` 1,325 Million) were sold.
Out of the above, export of pumps, valves and their spares in terms of value were ` 1,133 Million (Previous year ` 1,588 Million).
5.0 OUTLOOK
The Company expects the market for pumps and services to grow moderately. The market for valves is expected to be sluggish, primarily due to poor demand from the power sector. Company is taking effective steps to improve operational efficiency to maintain the earnings.
6.0 R I S K S & C O N C E R N S T H E MANAGEMENT PERCEIVE
The competition is expected to be more aggressive leading to price pressures. Uncertainty in global economic growth is expected to impact the growth rate in India and consequently the Company’s operations.
The growth in the industrial sector depends on government policies, better infrastructure, removal of labour market rigidities and growth in agricultural sector would depend on favourable monsoons and effectiveness of implication of Government policies to boost income of farmers.
7.0 INTERNAL CONTROL SYSTEM & THEIR ADEQUACY
Internal Control Systems are implemented:-
To safeguard the Company’s assets from loss or damage.
To keep constant check on cost structure.
To provide adequate financial and accounting controls and implement accounting standards.
ANNEXURE TO BOARD’S REPORT

8
MANAGEMENT DISCUSSION & ANALYSIS REPORT (Contd.)
The system is improved and modified continuously to meet with changes in business condition, statutory and accounting requirements.
Internal controls are adequately supported by Internal Audit and periodic review by the management.
The Audit Committee meets periodically to review -
F inanc ia l s ta tement , wi th the management and statutory auditors.
Adequacy/scope of internal audit function, significant findings and followup thereon of any abnormal nature, with the internal auditors.
8.0 D I S C U S S I O N O N F I N A N C I A L PERFORMANCE WITH RESPECT TO OPERATIONAL EFFICIENCY
Due to ongoing investments being funded from internal resources, temporary short term borrowing facilities were utilized during intermittent period. Cost reduction have been achieved in certain areas by implementing efficiency improvement programme within the company.
The following statements cover financial performance review, which are attached to this report.
a) Distribution of income
b) Financial position at a glance
c) Financial summary
9.0 MATERIAL DEVELOPMENTS IN HUMAN RESOURCES, INDUSTRIAL RELATIONS
With the dynamic employment market and limited availability of the competent workforce, attracting and retaining the talent continued to be a major challenge for the Company during the last year. The rise of technology, social media and rapidly
changing business trends have redefined the role of Human Resources. The Company sustained its ongoing efforts on people development initiatives with Leadership Development, Competence and Capability building, Performance Management, Sales Activity Management, Succession Planning and Health and Safety Management in 2016. With this focussed approach and imbibed organizational culture, Company was able to retain the competent and potential workforce and also maintained the attrition level below the average for the Indian Job Market.
In order to understand employee expectations and improve work engagement, the Company have completed the initiative of “KSB Voice- Employee Engagement Survey 2016”. The inputs received from the survey will be used as a development tool to strengthen the organisation development and employee engagement. Employee relation continued to be cordial and we concluded the productivity linked settlement at one of the plants in 2016.
10.0 CAUTION
This report is based on the experience and information available to the Company in the Pump and Valve business and assumption in regard to domestic and global economic conditions, government and regulation policies etc. The performance of the Company is dependent on these factors. It may be materially influenced by the changes therein beyond the Company’s control, affecting the views expressed in or perceived from this report.
On behalf of the Board of Directors,
G SWARUP Chairman
Mumbai, 20th February, 2017
9
MANAGEMENT DISCUSSION & ANALYSIS REPORT (Contd.)
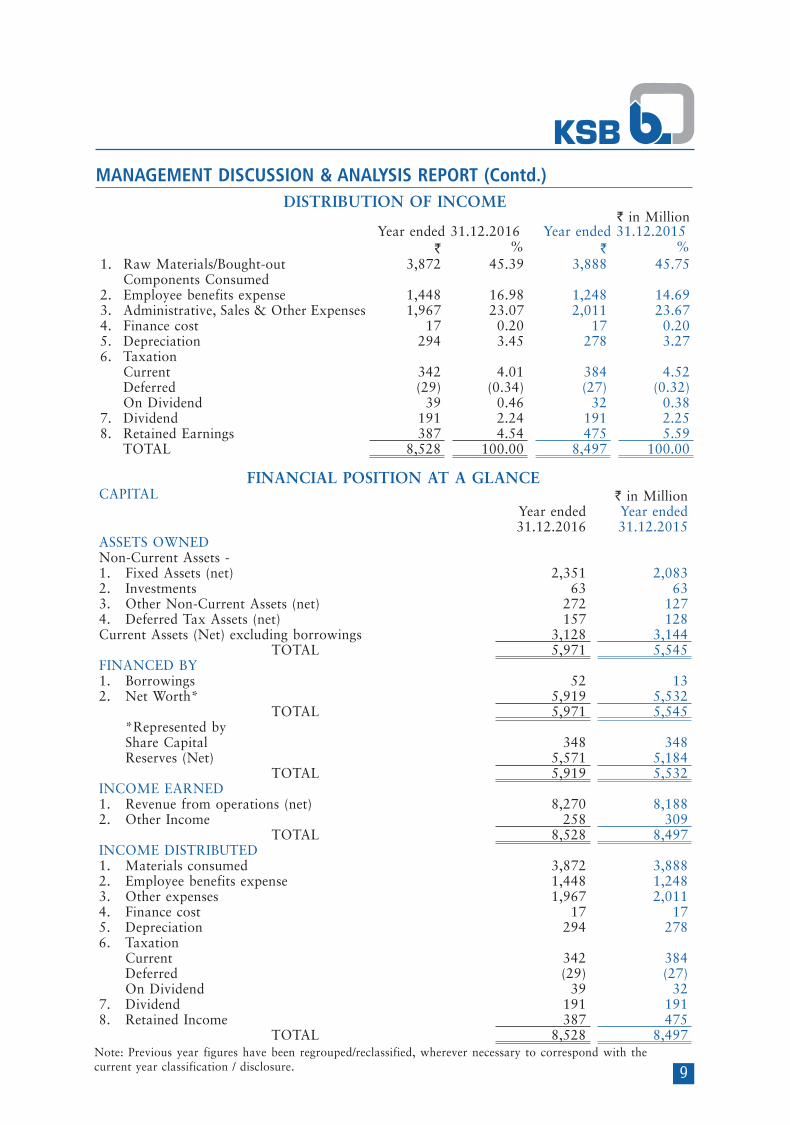
DISTRIBUTION OF INCOME` in Million
Year ended 31.12.2016 Year ended 31.12.2015` % ` %
1. Raw Materials/Bought-out 3,872 45.39 3,888 45.75 Components Consumed
2. Employee benefits expense 1,448 16.98 1,248 14.69 3. Administrative, Sales & Other Expenses 1,967 23.07 2,011 23.67 4. Finance cost 17 0.20 17 0.20 5. Depreciation 294 3.45 278 3.27 6. Taxation
Current 342 4.01 384 4.52 Deferred (29) (0.34) (27) (0.32)On Dividend 39 0.46 32 0.38
7. Dividend 191 2.24 191 2.258. Retained Earnings 387 4.54 475 5.59
TOTAL 8,528 100.00 8,497 100.00
FINANCIAL POSITION AT A GLANCECAPITAL ` in Million Year ended Year ended
31.12.2016 31.12.2015ASSETS OWNEDNon-Current Assets -1. Fixed Assets (net) 2,351 2,0832. Investments 63 633. Other Non-Current Assets (net) 272 1274. Deferred Tax Assets (net) 157 128Current Assets (Net) excluding borrowings 3,128 3,144
TOTAL 5,971 5,545FINANCED BY1. Borrowings 52 132. Net Worth* 5,919 5,532
TOTAL 5,971 5,545 *Represented by Share Capital 348 348 Reserves (Net) 5,571 5,184
TOTAL 5,919 5,532INCOME EARNED1. Revenue from operations (net) 8,270 8,1882. Other Income 258 309
TOTAL 8,528 8,497INCOME DISTRIBUTED1. Materials consumed 3,872 3,8882. Employee benefits expense 1,448 1,2483. Other expenses 1,967 2,0114. Finance cost 17 175. Depreciation 294 2786. Taxation Current 342 384 Deferred (29) (27) On Dividend 39 327. Dividend 191 1918. Retained Income 387 475
TOTAL 8,528 8,497Note: Previous year figures have been regrouped/reclassified, wherever necessary to correspond with the current year classification / disclosure.
10
MANAGEMENT DISCUSSION & ANALYSIS REPORT (Contd.)
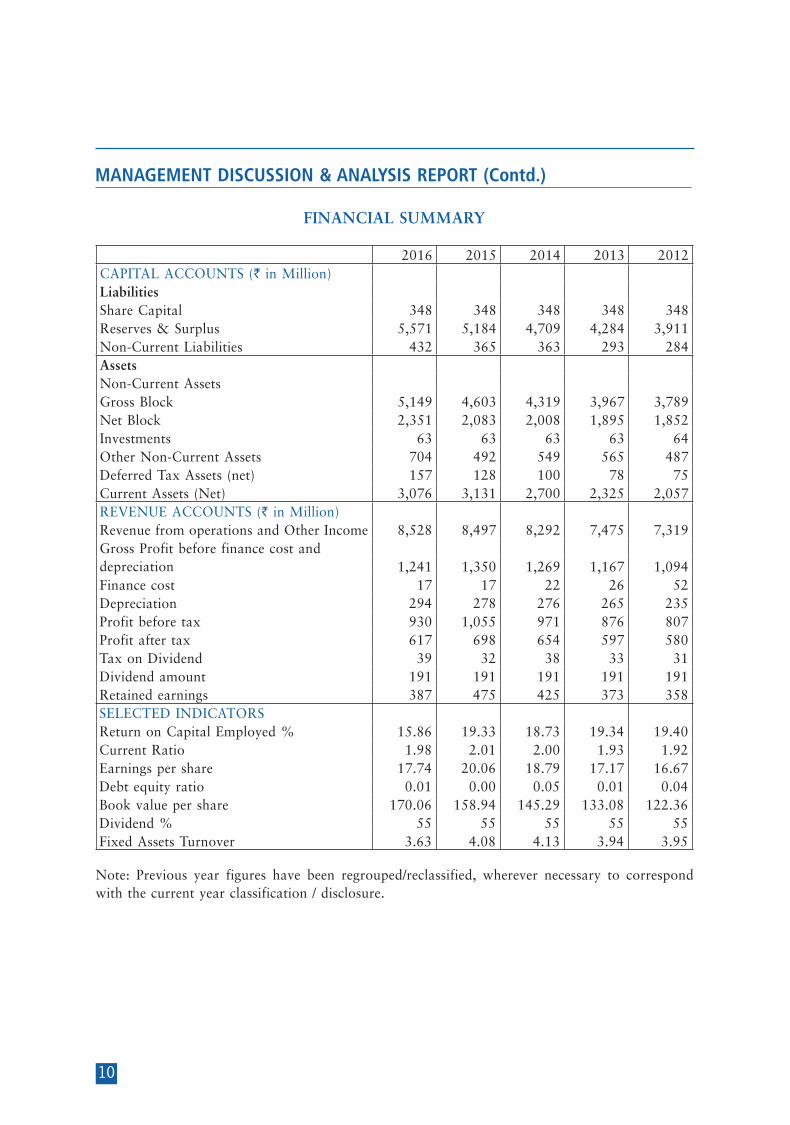
FINANCIAL SUMMARY
2016 2015 2014 2013 2012CAPITAL ACCOUNTS (` in Million)LiabilitiesShare Capital 348 348 348 348 348Reserves & Surplus 5,571 5,184 4,709 4,284 3,911Non-Current Liabilities 432 365 363 293 284AssetsNon-Current Assets Gross Block 5,149 4,603 4,319 3,967 3,789Net Block 2,351 2,083 2,008 1,895 1,852Investments 63 63 63 63 64Other Non-Current Assets 704 492 549 565 487Deferred Tax Assets (net) 157 128 100 78 75Current Assets (Net) 3,076 3,131 2,700 2,325 2,057REVENUE ACCOUNTS (` in Million)Revenue from operations and Other Income 8,528 8,497 8,292 7,475 7,319Gross Profit before finance cost anddepreciation 1,241 1,350 1,269 1,167 1,094Finance cost 17 17 22 26 52Depreciation 294 278 276 265 235Profit before tax 930 1,055 971 876 807Profit after tax 617 698 654 597 580Tax on Dividend 39 32 38 33 31Dividend amount 191 191 191 191 191Retained earnings 387 475 425 373 358SELECTED INDICATORSReturn on Capital Employed % 15.86 19.33 18.73 19.34 19.40Current Ratio 1.98 2.01 2.00 1.93 1.92Earnings per share 17.74 20.06 18.79 17.17 16.67Debt equity ratio 0.01 0.00 0.05 0.01 0.04Book value per share 170.06 158.94 145.29 133.08 122.36Dividend % 55 55 55 55 55Fixed Assets Turnover 3.63 4.08 4.13 3.94 3.95
Note: Previous year figures have been regrouped/reclassified, wherever necessary to correspond with the current year classification / disclosure.
11
REPORT ON CORPORATE GOVERNANCE
ANNEXURE TO BOARD’S REPORT
1. Company’s philosophy of Corporate Governance
The Company aims at conducting its business efficiently, by following professionally acknowledged good governance policies, thus meeting its obligations to all stakeholders in a balanced and accountable manner.
2. Board of Directors
(a) Composition
The Board of Directors comprises of ten Directors, of whom one is Managing Director. The office of Managing Director is held by a nominee of Canadian Kay Pump Ltd., the Company’s main shareholder.
(b) Attendance of each Director at the Board Meetings and the last Annual General Meeting (“AGM”)
Name of the Director DIN of the Director
Category of Directorship
No. of Board Meetings attended
Attendance at the last
AGMMr. G. Swarup 00374298 Chairman – NED 5 YesMr. A. R. Broacha 00056291 NED – I 5 YesMr. D. N. Damania 00403834 NED – I 4 YesMr. N. N. Kampani 00009071 NED 3 NoMr. Pradip Shah 00066242 NED – I 4 YesDr. Stephan Bross 00423114 NED 4 YesMr. V. K. Viswanathan 01782934 NED – I 4 YesMs. S. F. Motwani 00052851 NED – I 2 NoMr. W. Stegmuller 06929923 NED 4 YesMr. W. Spiegel *(Upto 30th June, 2016)
00058903 Managing Director – ED
3 Yes
Mr. Rajeev Jain **(effective from 1st July, 2016)
07475640 Managing Director – ED
2 N.A.
ED : Executive Director NED – I : Non-Executive Director – Independent N.A. : Not Applicable * Mr. W. Spiegel retired on 30th June, 2016. ** Mr. Rajeev Jain is appointed as an Additional Director and Managing Director of the
Company effective from 1st July, 2016 subject to approval of the Members and the Central Government.
12
REPORT ON CORPORATE GOVERNANCE (Contd.)
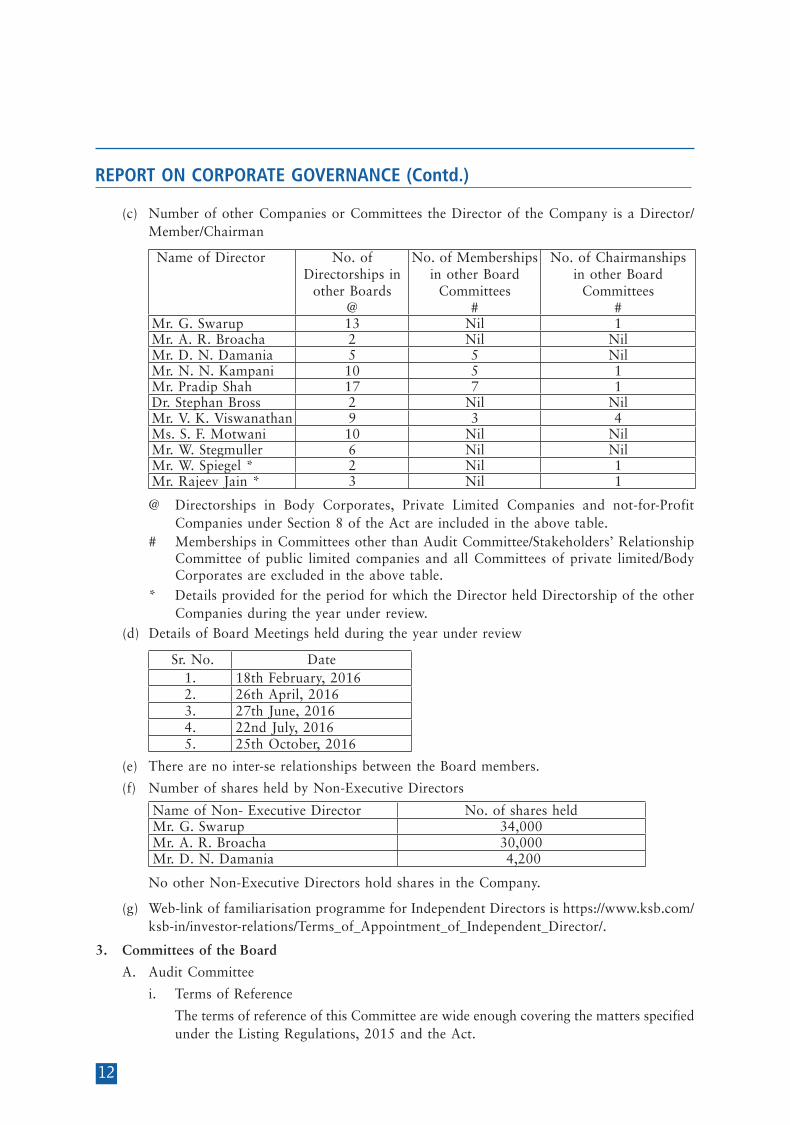
(c) Number of other Companies or Committees the Director of the Company is a Director/Member/Chairman
Name of Director No. of Directorships in
other Boards@
No. of Memberships in other Board
Committees#
No. of Chairmanships in other Board
Committees#
Mr. G. Swarup 13 Nil 1Mr. A. R. Broacha 2 Nil NilMr. D. N. Damania 5 5 NilMr. N. N. Kampani 10 5 1Mr. Pradip Shah 17 7 1Dr. Stephan Bross 2 Nil NilMr. V. K. Viswanathan 9 3 4Ms. S. F. Motwani 10 Nil NilMr. W. Stegmuller 6 Nil NilMr. W. Spiegel * 2 Nil 1Mr. Rajeev Jain * 3 Nil 1
@ Directorships in Body Corporates, Private Limited Companies and not-for-Profit Companies under Section 8 of the Act are included in the above table.
# Memberships in Committees other than Audit Committee/Stakeholders’ Relationship Committee of public limited companies and all Committees of private limited/Body Corporates are excluded in the above table.
* Details provided for the period for which the Director held Directorship of the other Companies during the year under review.
(d) Details of Board Meetings held during the year under review
Sr. No. Date1. 18th February, 20162. 26th April, 20163. 27th June, 20164. 22nd July, 20165. 25th October, 2016
(e) There are no inter-se relationships between the Board members.
(f) Number of shares held by Non-Executive Directors
Name of Non- Executive Director No. of shares heldMr. G. Swarup 34,000 Mr. A. R. Broacha 30,000 Mr. D. N. Damania 4,200
No other Non-Executive Directors hold shares in the Company.
(g) Web-link of familiarisation programme for Independent Directors is https://www.ksb.com/ksb-in/investor-relations/Terms_of_Appointment_of_Independent_Director/.
3. Committees of the Board
A. Audit Committee
i. Terms of Reference
The terms of reference of this Committee are wide enough covering the matters specified under the Listing Regulations, 2015 and the Act.
13
REPORT ON CORPORATE GOVERNANCE (Contd.)
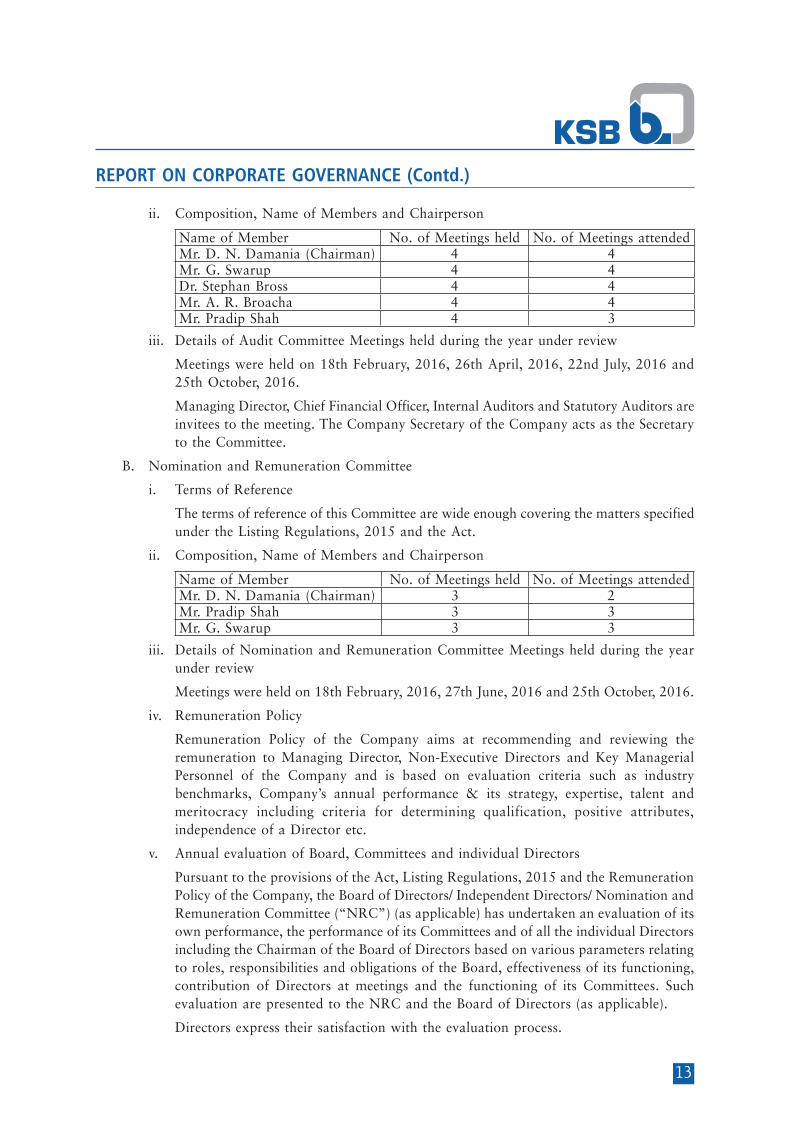
ii. Composition, Name of Members and Chairperson
Name of Member No. of Meetings held No. of Meetings attendedMr. D. N. Damania (Chairman) 4 4Mr. G. Swarup 4 4Dr. Stephan Bross 4 4Mr. A. R. Broacha 4 4Mr. Pradip Shah 4 3
iii. Details of Audit Committee Meetings held during the year under review
Meetings were held on 18th February, 2016, 26th April, 2016, 22nd July, 2016 and 25th October, 2016.
Managing Director, Chief Financial Officer, Internal Auditors and Statutory Auditors are invitees to the meeting. The Company Secretary of the Company acts as the Secretary to the Committee.
B. Nomination and Remuneration Committee
i. Terms of Reference
The terms of reference of this Committee are wide enough covering the matters specified under the Listing Regulations, 2015 and the Act.
ii. Composition, Name of Members and Chairperson
Name of Member No. of Meetings held No. of Meetings attendedMr. D. N. Damania (Chairman) 3 2Mr. Pradip Shah 3 3Mr. G. Swarup 3 3
iii. Details of Nomination and Remuneration Committee Meetings held during the year under review
Meetings were held on 18th February, 2016, 27th June, 2016 and 25th October, 2016.
iv. Remuneration Policy
Remuneration Policy of the Company aims at recommending and reviewing the remuneration to Managing Director, Non-Executive Directors and Key Managerial Personnel of the Company and is based on evaluation criteria such as industry benchmarks, Company’s annual performance & its strategy, expertise, talent and meritocracy including criteria for determining qualification, positive attributes, independence of a Director etc.
v. Annual evaluation of Board, Committees and individual Directors
Pursuant to the provisions of the Act, Listing Regulations, 2015 and the Remuneration Policy of the Company, the Board of Directors/ Independent Directors/ Nomination and Remuneration Committee (“NRC”) (as applicable) has undertaken an evaluation of its own performance, the performance of its Committees and of all the individual Directors including the Chairman of the Board of Directors based on various parameters relating to roles, responsibilities and obligations of the Board, effectiveness of its functioning, contribution of Directors at meetings and the functioning of its Committees. Such evaluation are presented to the NRC and the Board of Directors (as applicable).
Directors express their satisfaction with the evaluation process.
14
REPORT ON CORPORATE GOVERNANCE (Contd.)
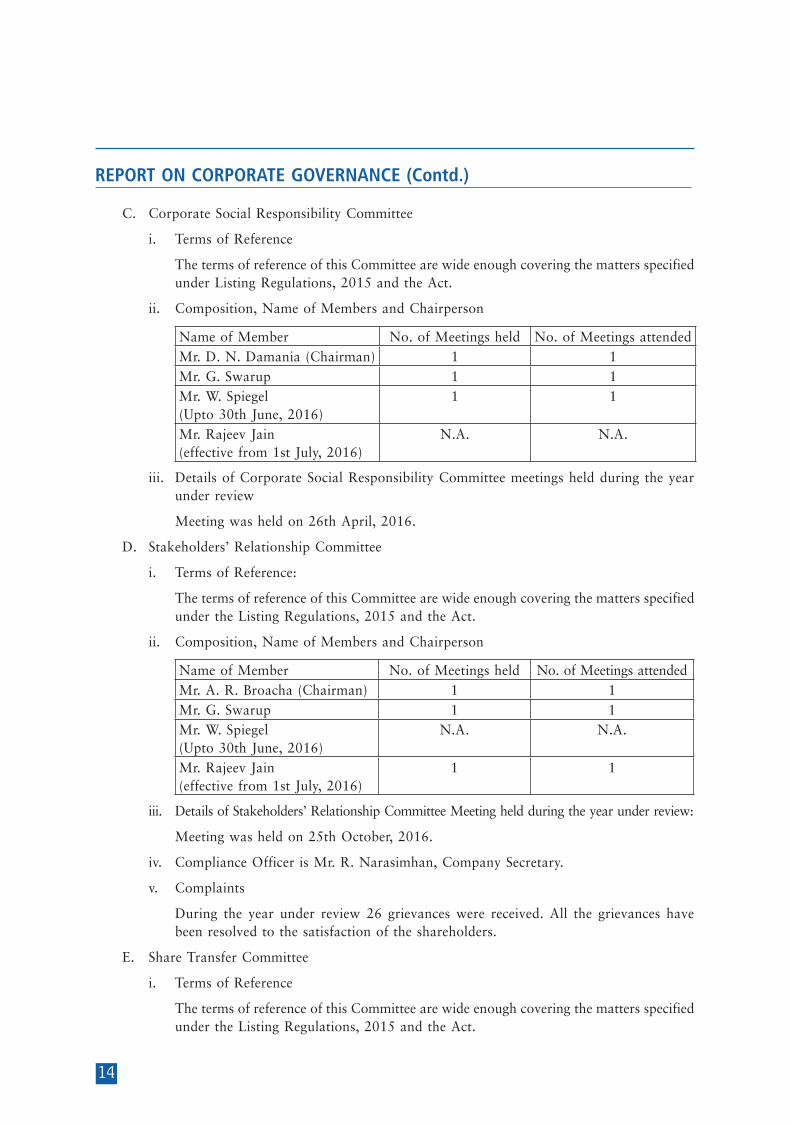
C. Corporate Social Responsibility Committee
i. Terms of Reference
The terms of reference of this Committee are wide enough covering the matters specified under Listing Regulations, 2015 and the Act.
ii. Composition, Name of Members and Chairperson
Name of Member No. of Meetings held No. of Meetings attendedMr. D. N. Damania (Chairman) 1 1Mr. G. Swarup 1 1Mr. W. Spiegel (Upto 30th June, 2016)
1 1
Mr. Rajeev Jain (effective from 1st July, 2016)
N.A. N.A.
iii. Details of Corporate Social Responsibility Committee meetings held during the year under review
Meeting was held on 26th April, 2016.
D. Stakeholders’ Relationship Committee
i. Terms of Reference:
The terms of reference of this Committee are wide enough covering the matters specified under the Listing Regulations, 2015 and the Act.
ii. Composition, Name of Members and Chairperson
Name of Member No. of Meetings held No. of Meetings attendedMr. A. R. Broacha (Chairman) 1 1Mr. G. Swarup 1 1Mr. W. Spiegel (Upto 30th June, 2016)
N.A. N.A.
Mr. Rajeev Jain (effective from 1st July, 2016)
1 1
iii. Details of Stakeholders’ Relationship Committee Meeting held during the year under review:
Meeting was held on 25th October, 2016.
iv. Compliance Officer is Mr. R. Narasimhan, Company Secretary.
v. Complaints
During the year under review 26 grievances were received. All the grievances have been resolved to the satisfaction of the shareholders.
E. Share Transfer Committee
i. Terms of Reference
The terms of reference of this Committee are wide enough covering the matters specified under the Listing Regulations, 2015 and the Act.

15
REPORT ON CORPORATE GOVERNANCE (Contd.)
ii. Composition, Name of Members and Chairperson
Name of Member No. of Meetings held No. of Meetings attendedMr. G. Swarup (Chairman) 3 3Mr. A. R. Broacha 3 3Mr. D. N. Damania 3 3Mr. W. Spiegel (Upto 30th June, 2016)
3 2
Mr. Rajeev Jain (effective from 1st July, 2016)
N.A. N.A.
iii. Details of Share Transfer Committee meetings held during the year under review
Meetings were held on 5th January, 2016, 13th January, 2016 and 8th March, 2016.
4. Remuneration of Directors
The remuneration payable to the Executive Director is approved by the members at the general meeting of the Company. Remuneration of Executive Director consists of a fixed salary, perquisites, performance linked bonus, based on the individual and the Company’s performance and commission based on net profits of the Company subject to a ceiling of 50% of the annual salary. The Board of Directors determine the performance linked bonus from year to year.
(a) Details of remuneration paid/payable to the Executive Directors for the year under review
` ’000s
Name of the Director
Salary Commission Performance linked bonus
Perquisites and Contribution to Provident Fund
Terms of appointment
Mr. W. Spiegel 4,850 834 2,518 5,005 Retired on 30th June, 2016
Mr. Rajeev Jain 5,232 2,616 - 3,461 5 years, effective from
1st July, 2016 to 30th June, 2021
Notes:
i. The above remuneration to Mr. Rajeev Jain excludes contribution for gratuity, superannuation and personal accident insurance premium and the liability for encashable leave as the figures for the Director is not separately available.
ii. The Company does not have a stock option scheme.
iii. The notice period for Mr. Rajeev Jain will be as per the service contract mutually agreed between him and the Board. No severance fees are payable to the Director.
iv. The one-time payment of ` 3,182 Thousand (included in salary above) to Mr. W. Spiegel on his retirement is subject to approval of the members.
(b) The Board of Directors decide the remuneration of Non-Executive Directors which consists of a sitting fee as well as commission based on the net profits of the Company. As approved
16
REPORT ON CORPORATE GOVERNANCE (Contd.)
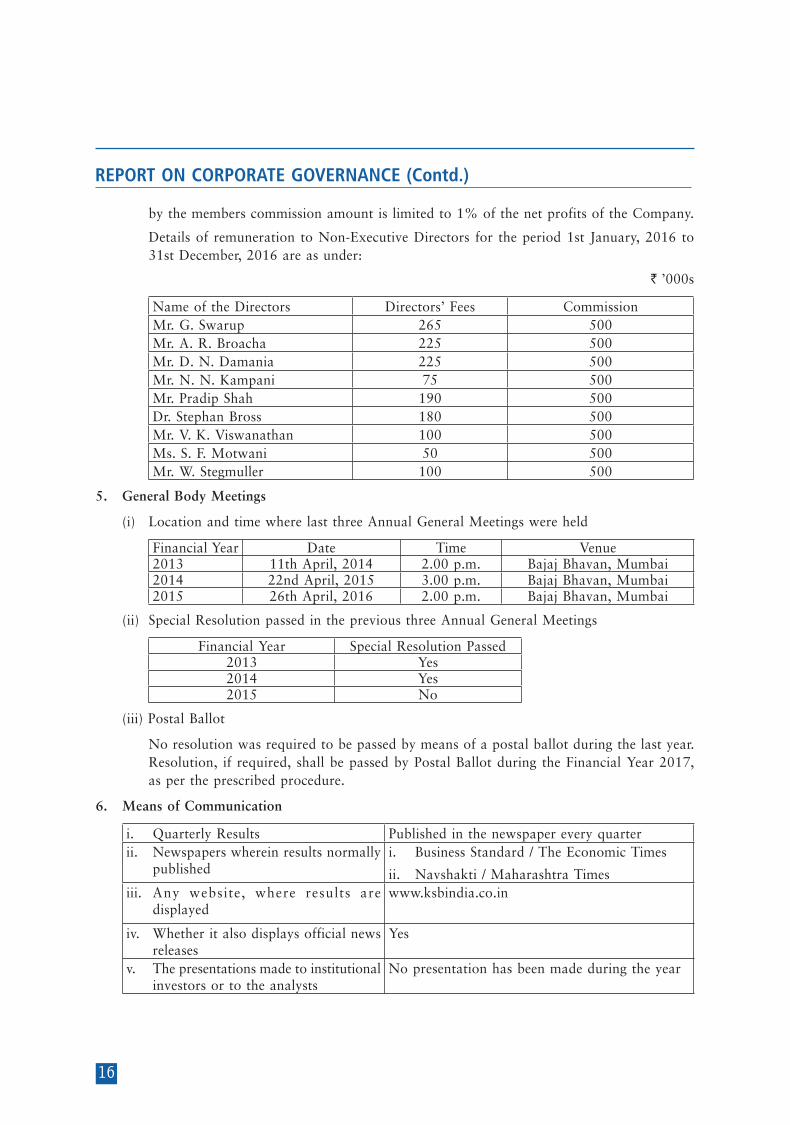
by the members commission amount is limited to 1% of the net profits of the Company.
Details of remuneration to Non-Executive Directors for the period 1st January, 2016 to 31st December, 2016 are as under:
` ’000s
Name of the Directors Directors’ Fees CommissionMr. G. Swarup 265 500Mr. A. R. Broacha 225 500Mr. D. N. Damania 225 500Mr. N. N. Kampani 75 500Mr. Pradip Shah 190 500Dr. Stephan Bross 180 500Mr. V. K. Viswanathan 100 500Ms. S. F. Motwani 50 500Mr. W. Stegmuller 100 500
5. General Body Meetings
(i) Location and time where last three Annual General Meetings were held
Financial Year Date Time Venue2013 11th April, 2014 2.00 p.m. Bajaj Bhavan, Mumbai2014 22nd April, 2015 3.00 p.m. Bajaj Bhavan, Mumbai2015 26th April, 2016 2.00 p.m. Bajaj Bhavan, Mumbai
(ii) Special Resolution passed in the previous three Annual General Meetings
Financial Year Special Resolution Passed2013 Yes2014 Yes2015 No
(iii) Postal Ballot
No resolution was required to be passed by means of a postal ballot during the last year. Resolution, if required, shall be passed by Postal Ballot during the Financial Year 2017,
as per the prescribed procedure.
6. Means of Communication
i. Quarterly Results Published in the newspaper every quarterii. Newspapers wherein results normally
publishedi. Business Standard / The Economic Times
ii. Navshakti / Maharashtra Times iii. Any website, where results are
displayedwww.ksbindia.co.in
iv. Whether it also displays official news releases
Yes
v. The presentations made to institutional investors or to the analysts
No presentation has been made during the year
17
REPORT ON CORPORATE GOVERNANCE (Contd.)
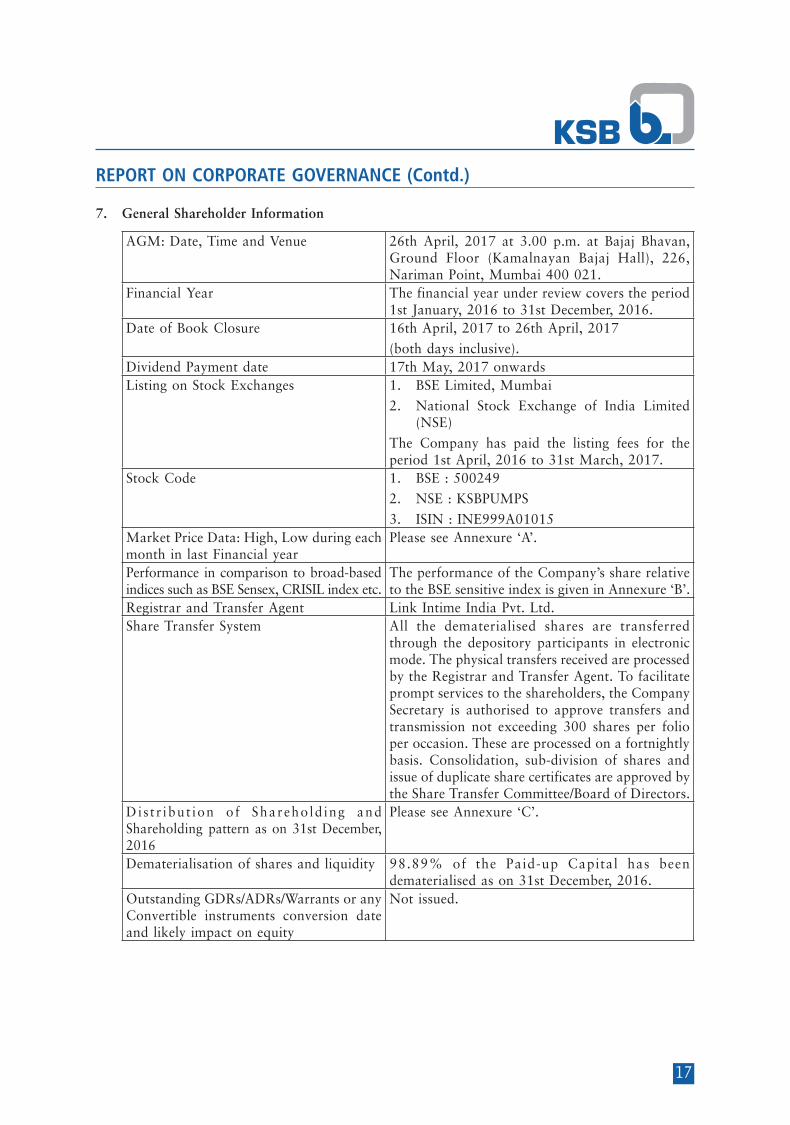
7. General Shareholder Information
AGM: Date, Time and Venue 26th April, 2017 at 3.00 p.m. at Bajaj Bhavan, Ground Floor (Kamalnayan Bajaj Hall), 226, Nariman Point, Mumbai 400 021.
Financial Year The financial year under review covers the period 1st January, 2016 to 31st December, 2016.
Date of Book Closure 16th April, 2017 to 26th April, 2017
(both days inclusive).Dividend Payment date 17th May, 2017 onwardsListing on Stock Exchanges 1. BSE Limited, Mumbai
2. National Stock Exchange of India Limited (NSE)
The Company has paid the listing fees for the period 1st April, 2016 to 31st March, 2017.
Stock Code 1. BSE : 500249
2. NSE : KSBPUMPS
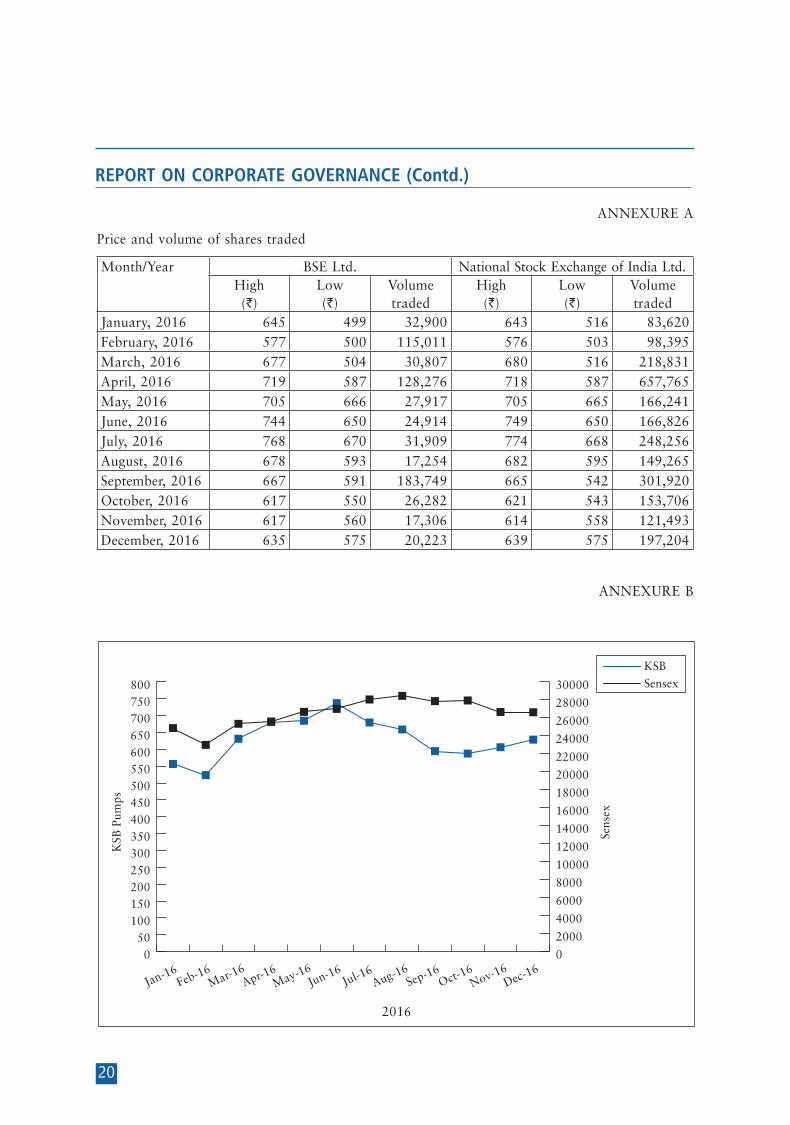
3. ISIN : INE999A01015Market Price Data: High, Low during each month in last Financial year
Please see Annexure ‘A’.
Performance in comparison to broad-based indices such as BSE Sensex, CRISIL index etc.
The performance of the Company’s share relative to the BSE sensitive index is given in Annexure ‘B’.
Registrar and Transfer Agent Link Intime India Pvt. Ltd.Share Transfer System All the dematerialised shares are transferred
through the depository participants in electronic mode. The physical transfers received are processed by the Registrar and Transfer Agent. To facilitate prompt services to the shareholders, the Company Secretary is authorised to approve transfers and transmission not exceeding 300 shares per folio per occasion. These are processed on a fortnightly basis. Consolidation, sub-division of shares and issue of duplicate share certificates are approved by the Share Transfer Committee/Board of Directors.
Distr ibut ion of Shareholding and Shareholding pattern as on 31st December, 2016
Please see Annexure ‘C’.
Dematerialisation of shares and liquidity 98.89% of the Paid-up Capital has been dematerialised as on 31st December, 2016.
Outstanding GDRs/ADRs/Warrants or any Convertible instruments conversion date and likely impact on equity
Not issued.

18
REPORT ON CORPORATE GOVERNANCE (Contd.)
Plant Locations The Company’s plants are located at
Maharashtra-Pimpri, PuneChinchwad, PuneVambori, AhmednagarSinnar, NashikKesurdi, ShirwalTamil Nadu-NSN Palayam, Coimbatore
Address for correspondence Shareholders should address correspondence to
Link Intime India Pvt. Ltd.C 101, 247 Park, L B S Marg, Vikhroli West, Mumbai 400 083Tel No.: 022 49186270E-mail: [email protected]
8. Disclosures
A. Pursuant to requirements of Listing Regulations, 2015 the Company has adopted the policy determining material subsidiaries and the policy on related party transactions and the said policies are available on the Company’s website at www.ksbindia.co.in.
B. Disclosure on Material Related Party Transactions
i. Disclosures on materially significant related party transactions that may have potential conflict with the interests of the company at large
a. Details of shareholdings of Non-Executive Directors and dividend paid thereon
Name of the Directors No. of shares held Dividend paid (`)Mr. G. Swarup 34,000 187,000Mr. A. R. Broacha 30,000 165,000Mr. D. N. Damania 4,200 23,100
b. Related party transactions
Normal trade transactions, sales commission agreement for exports and license and technical collaboration agreements are being entered into with KSB AG, Germany and other group Companies from time to time. Further, remuneration is paid to Directors, dividend is paid on shares held by Directors, etc. Full disclosures on related party transactions, as per the Accounting Standard 18 issued by the Institute of Chartered Accountants of India, is given under Note 36 of the financial statements.
C. Details of non-compliance, penalties and strictures imposed on the Company by the Stock Exchanges/ SEBI/ Statutory Authorities on matters relating to capital markets during the last three years.
The Company has complied with the requirements of regulatory authorities on capital markets and no penalties / strictures have been imposed against it in the last three years.
D. Board Disclosures - Risk Management
The Company has laid down procedures and informed the Board members about the risk assessment and minimization procedures. These procedures are periodically reviewed to ensure that executive management controls risk through means of a properly defined framework.
19
REPORT ON CORPORATE GOVERNANCE (Contd.)
E. Whistle Blower Policy
The Whistle Blower Policy has been adopted to provide appropriate avenues to the employees to bring to the attention of the management, the concerns about any unethical behaviour, by using the mechanism provided in the Policy. We affirm that no Director or employee has been denied access to the Chairman of the Audit Committee during the year under review.
9. NON-MANDATORY REQUIREMENTS
The Company has complied with all requirements of corporate governance specified in Listing Regulations, 2015. The Board has taken cognizance of the discretionary requirements as specified in Part E of Schedule II to the Listing Regulations, 2015 and shall consider adopting the same at an appropriate time.
On behalf of the Board of Directors
G. SWARUPChairman
Mumbai, 20th February, 2017
CERTIFICATE ON CORPORATE GOVERNANCE
To the Members of
KSB Pumps Limited
We have examined the compliance with conditions of Corporate Governance by KSB Pumps Ltd., for the year ended on 31st December, 2016, as stipulated in Regulation 34(3) read with Schedule V of the SEBI (Listing Obligation and Disclosure Requirements) Regulations, 2015.
The compliance with conditions of Corporate Governance is the responsibility of the management. Our examination was limited to the procedures and implementation thereof adopted by the Company for ensuring the compliance of the conditions of the Corporate Governance. It is neither an audit nor an expression of opinion on the financial statements of the Company.
In our opinion and to the best of our information and according to the explanations given to us and the representations made by the management, we certify that the Company has complied with the conditions of Corporate Governance as stipulated in the above mentioned Listing Regulations.
Based on the representation received from the Company and certified by the Registrars and Transfer Agent, no investor grievance is pending for a period exceeding one month as on 31st December, 2016 against the Company and the Registrars and Transfer Agents have reported to the Shareholders’ Relationship Committee on the status of the grievances, if any.
We further state that such compliance is neither an assurance as to the future viability of the Company nor the efficiency or effectiveness with which the management has conducted the affairs of the Company.
For Nilesh Shah & AssociatesCompany Secretaries
(Nilesh Shah)Mumbai, 20th February, 2017 Partner (FCS - 4554) C.P.No.: 2631
20
REPORT ON CORPORATE GOVERNANCE (Contd.)
050
100150200250300350400450500550600650700750800
Dec-16
Nov-16Oct-1
6Sep-16
Aug-16Jul-16
Jun-16May-16
Apr-16Mar-16
Feb-16Jan-16
0
2000
4000
6000
8000
10000
12000
14000
16000
18000
20000
22000
24000
26000
28000
30000
KSB
Pum
ps
Sens
ex
KSBSensex
2016
ANNEXURE A
Price and volume of shares traded
Month/Year BSE Ltd. National Stock Exchange of India Ltd.High(`)
Low(`)
Volume traded
High(`)
Low(`)
Volume traded
January, 2016 645 499 32,900 643 516 83,620February, 2016 577 500 115,011 576 503 98,395March, 2016 677 504 30,807 680 516 218,831April, 2016 719 587 128,276 718 587 657,765May, 2016 705 666 27,917 705 665 166,241June, 2016 744 650 24,914 749 650 166,826July, 2016 768 670 31,909 774 668 248,256August, 2016 678 593 17,254 682 595 149,265September, 2016 667 591 183,749 665 542 301,920October, 2016 617 550 26,282 621 543 153,706November, 2016 617 560 17,306 614 558 121,493December, 2016 635 575 20,223 639 575 197,204
ANNEXURE B

21
REPORT ON CORPORATE GOVERNANCE (Contd.)
Shareholding pattern as on 31st December, 2016
Category No. of Members
No. of Shares held
% to the Capital
Indian Promoters 8 9,003,458 25.87
Foreign Promoters 1 14,110,848 40.54
Mutual Funds & UTI 24 42,48,575 12.21
Banks, Financial Institutions and Insurance Companies 7 9,60,125 2.76
Foreign Institutional Investors 1 6,460 0.02
Private Corporate Bodies 265 2,518,313 7.23
Indian Public/Trust 10,938 3,807,789 10.93
Foreign Nationals/NRIs 340 152,276 0.44
Total 11,584 34,807,844 100.00
ANNEXURE C
Distribution of shareholding as on 31st December, 2016 Number of shares held Members Shares
Number % Number %
1-500 9,766 84.31 983,004 2.82
501-1,000 880 7.6 679,323 1.95
1,001-2,000 584 5.04 866,401 2.5
2,001-3,000 148 1.28 355,762 1.02
3,001-4,000 61 0.52 213,775 0.61
4,001-5,000 32 0.28 145,121 0.42
5,001-10,000 50 0.43 351,002 1.01
10,001 and above 63 0.54 31,213,456 89.67
Total 11,584 100.00 34,807,844 100.00
22
ANNEXURE TO BOARD’S REPORT
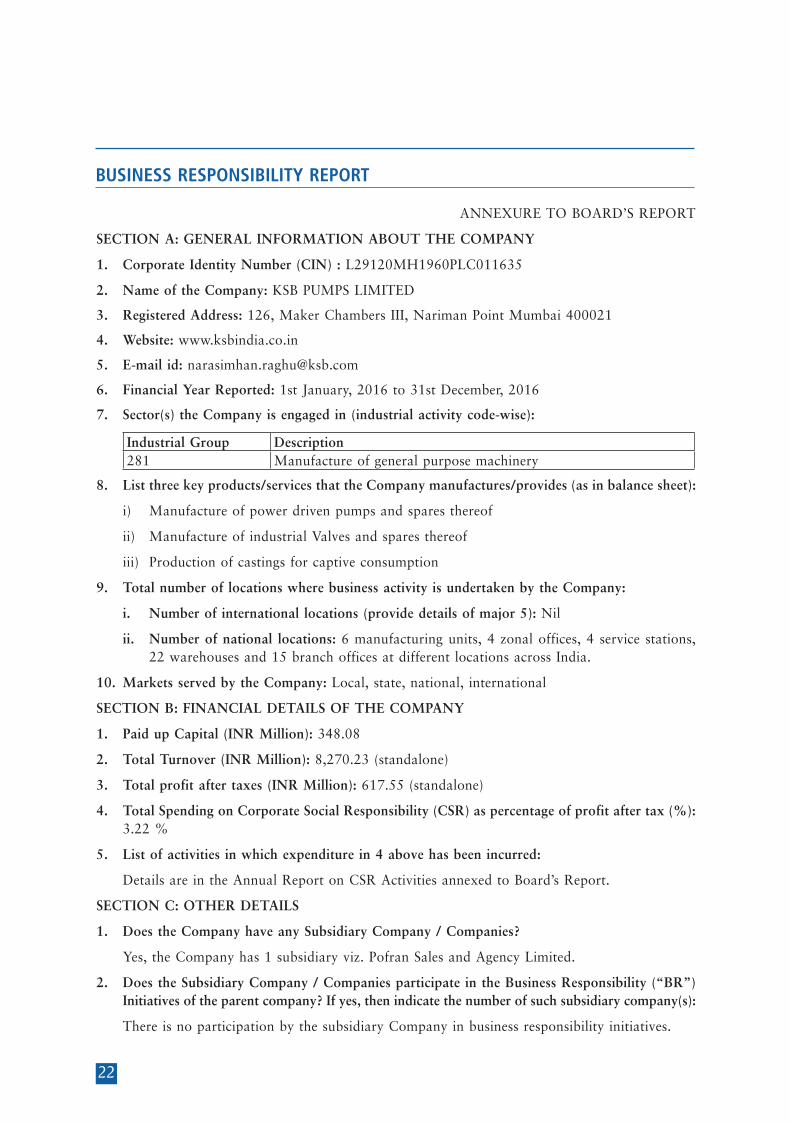
SECTION A: GENERAL INFORMATION ABOUT THE COMPANY
1. Corporate Identity Number (CIN) : L29120MH1960PLC011635
2. Name of the Company: KSB PUMPS LIMITED
3. Registered Address: 126, Maker Chambers III, Nariman Point Mumbai 400021
4. Website: www.ksbindia.co.in
5. E-mail id: [email protected]
6. Financial Year Reported: 1st January, 2016 to 31st December, 2016
7. Sector(s) the Company is engaged in (industrial activity code-wise):
Industrial Group Description281 Manufacture of general purpose machinery
8. List three key products/services that the Company manufactures/provides (as in balance sheet):
i) Manufacture of power driven pumps and spares thereof
ii) Manufacture of industrial Valves and spares thereof
iii) Production of castings for captive consumption
9. Total number of locations where business activity is undertaken by the Company:
i. Number of international locations (provide details of major 5): Nil
ii. Number of national locations: 6 manufacturing units, 4 zonal offices, 4 service stations, 22 warehouses and 15 branch offices at different locations across India.
10. Markets served by the Company: Local, state, national, international
SECTION B: FINANCIAL DETAILS OF THE COMPANY
1. Paid up Capital (INR Million): 348.08
2. Total Turnover (INR Million): 8,270.23 (standalone)
3. Total profit after taxes (INR Million): 617.55 (standalone)
4. Total Spending on Corporate Social Responsibility (CSR) as percentage of profit after tax (%): 3.22 %
5. List of activities in which expenditure in 4 above has been incurred:
Details are in the Annual Report on CSR Activities annexed to Board’s Report.
SECTION C: OTHER DETAILS
1. Does the Company have any Subsidiary Company / Companies?
Yes, the Company has 1 subsidiary viz. Pofran Sales and Agency Limited.
2. Does the Subsidiary Company / Companies participate in the Business Responsibility (“BR”) Initiatives of the parent company? If yes, then indicate the number of such subsidiary company(s):
There is no participation by the subsidiary Company in business responsibility initiatives.
BUSINESS RESPONSIBILITY REPORT

23
BUSINESS RESPONSIBILITY REPORT (Contd.)
3. Do any other entity / entities (e.g. suppliers, distributors etc.) that the Company does business with participate in the BR Initiatives of the Company? If yes, then indicate the percentage of such entity/entities? [Less than 30%, 30-60%, More than 60]
The Company encourages its suppliers, dealers and other stakeholders to support various initiatives taken by the Company towards its business responsibility.
SECTION D: BR INFORMATION
1. Details of Director / Directors responsible for BR
(a) Details of the Director / Directors responsible for implementation of the BR policy/policies:
DIN: 07475640 Name: Mr. Rajeev Jain Designation: Managing Director
(b) Details of the BR head
No. Particulars Details1. DIN Number (if applicable) 074756402. Name Rajeev Jain3. Designation Managing Director4. Telephone number 020 2710 10005. e-mail id [email protected]
2. Principle-wise (as per NVGs) BR Policy/policies (Reply in Y/N):
The National Voluntary Guidelines on Social, Environmental and Economic Responsibilities of Business (NVGs) released by the Ministry of Corporate Affairs has adopted nine areas of Business Responsibility.
These are briefly are as under:
P1 Businesses should conduct and govern themselves with Ethics, Transparency and Accountability
P2 Businesses should provide goods and services that are safe and contribute to sustainability throughout their life cycle
P3 Businesses should promote the wellbeing of all employees
P4 Businesses should respect the interests of, and be responsive towards all stakeholders, especially those who are disadvantaged, vulnerable and marginalized
P5 Businesses should respect and promote human rights
P6 Businesses should respect, protect and make efforts to restore the environment
P7 Businesses, when engaged in influencing public and regulatory policy, should do so in a responsible manner
P8 Businesses should support inclusive growth and equitable development
P9 Businesses should engage with and provide value to their customers and consumers in a responsible manner
24
BUSINESS RESPONSIBILITY REPORT (Contd.)
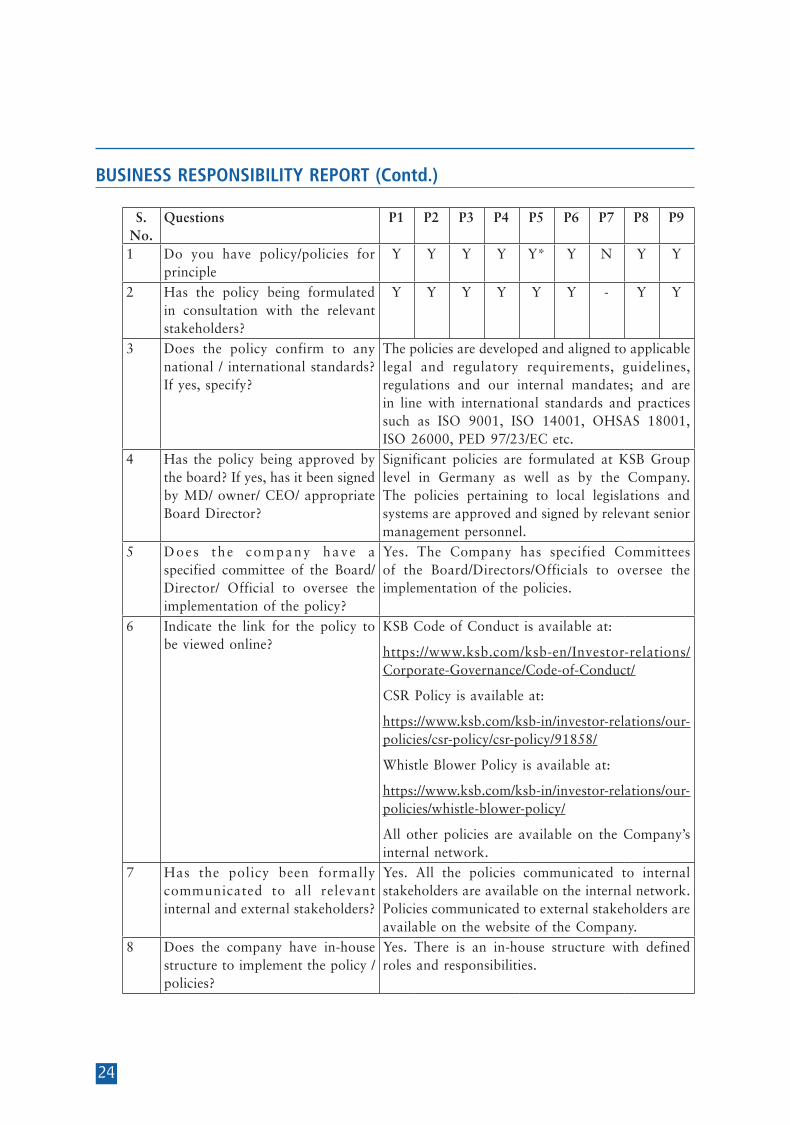
S. No.
Questions P1 P2 P3 P4 P5 P6 P7 P8 P9
1 Do you have policy/policies for principle
Y Y Y Y Y* Y N Y Y
2 Has the policy being formulated in consultation with the relevant stakeholders?
Y Y Y Y Y Y - Y Y
3 Does the policy confirm to any national / international standards? If yes, specify?
The policies are developed and aligned to applicable legal and regulatory requirements, guidelines, regulations and our internal mandates; and are in line with international standards and practices such as ISO 9001, ISO 14001, OHSAS 18001, ISO 26000, PED 97/23/EC etc.
4 Has the policy being approved by the board? If yes, has it been signed by MD/ owner/ CEO/ appropriate Board Director?
Significant policies are formulated at KSB Group level in Germany as well as by the Company. The policies pertaining to local legislations and systems are approved and signed by relevant senior management personnel.
5 Does the company have a specified committee of the Board/ Director/ Official to oversee the implementation of the policy?
Yes. The Company has specified Committees of the Board/Directors/Officials to oversee the implementation of the policies.
6 Indicate the link for the policy to be viewed online?
KSB Code of Conduct is available at:
https://www.ksb.com/ksb-en/Investor-relations/Corporate-Governance/Code-of-Conduct/
CSR Policy is available at:
https://www.ksb.com/ksb-in/investor-relations/our-policies/csr-policy/csr-policy/91858/
Whistle Blower Policy is available at:
https://www.ksb.com/ksb-in/investor-relations/our-policies/whistle-blower-policy/
All other policies are available on the Company’s internal network.
7 Has the policy been formally communicated to all relevant internal and external stakeholders?
Yes. All the policies communicated to internal stakeholders are available on the internal network. Policies communicated to external stakeholders are available on the website of the Company.
8 Does the company have in-house structure to implement the policy / policies?
Yes. There is an in-house structure with defined roles and responsibilities.

25
BUSINESS RESPONSIBILITY REPORT (Contd.)
9 Does the Company have a grievance redressal mechanism related to the policy/policies to address stakeholders’ grievances related to the policy/policies?
Yes. The Company has a grievance redressal mechanism.
10 Has the company carried out independent audit/evaluation of the working of this policy by an internal or external agency?
Yes. The Company’s policies and procedures are supported by internal risk controls. These risk controls are continually evaluated for their efficacy through internal audit mechanism and are also subject to external audits.
*This Principle is encompassed in the KSB Code of Conduct.
2a. If answer to S. No. 1 against any principle, is ‘No’, please explain why: (Tick up to 2 options)
S. No
Questions P1 P2 P3 P4 P5 P6 P7 P8 P9
1 The company has not understood the Principle
– – – – – – – – –
2 The company is not at a stage where it finds itself in a position to formulate and implement the policies on specified principles
– – – – – – – – –
3 The company does not have financial or manpower resources available for the task
– – – – – – – – –
4 It is planned to be done within next 6 months
– – – – – – – – –
5 It is planned to be done within the next 1 year
– – – – – – – – –
6 Any other reason (please specify) P7The Company through the various industry forums endeavours to promote growth and technological progress, economic reforms, inclusive development policies and sustainable business principles. Therefore, need for a formal policy has not been felt.
3. Governance related to BR
(a) Indicate the frequency with which the Board of Directors, Committee of the Board or CEO assess the BR performance of the Company. Within 3 months, 3-6 months, Annually, More than 1 year.
Assessment is an ongoing exercise and is an inherent part of corporate functions.
(b) Does the Company publish a BR or a Sustainability Report? What is the hyperlink for viewing this report? How frequently it is published?
This is the first Business Responsibility Report being published by the Company for the Financial Year 2016. The report can be viewed as a part of the Annual Report.
26
BUSINESS RESPONSIBILITY REPORT (Contd.)
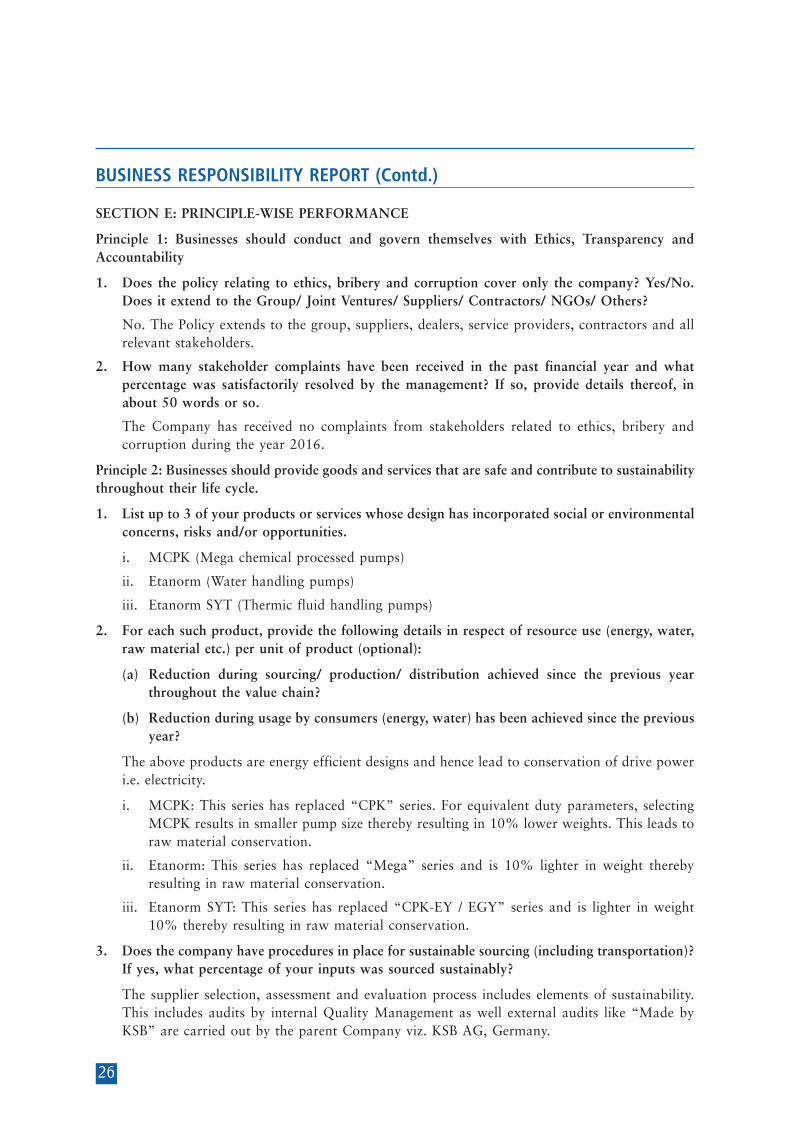
SECTION E: PRINCIPLE-WISE PERFORMANCE
Principle 1: Businesses should conduct and govern themselves with Ethics, Transparency and Accountability
1. Does the policy relating to ethics, bribery and corruption cover only the company? Yes/No. Does it extend to the Group/ Joint Ventures/ Suppliers/ Contractors/ NGOs/ Others?
No. The Policy extends to the group, suppliers, dealers, service providers, contractors and all relevant stakeholders.
2. How many stakeholder complaints have been received in the past financial year and what percentage was satisfactorily resolved by the management? If so, provide details thereof, in about 50 words or so.
The Company has received no complaints from stakeholders related to ethics, bribery and corruption during the year 2016.
Principle 2: Businesses should provide goods and services that are safe and contribute to sustainability throughout their life cycle.
1. List up to 3 of your products or services whose design has incorporated social or environmental concerns, risks and/or opportunities.
i. MCPK (Mega chemical processed pumps)
ii. Etanorm (Water handling pumps)
iii. Etanorm SYT (Thermic fluid handling pumps)
2. For each such product, provide the following details in respect of resource use (energy, water, raw material etc.) per unit of product (optional):
(a) Reduction during sourcing/ production/ distribution achieved since the previous year throughout the value chain?
(b) Reduction during usage by consumers (energy, water) has been achieved since the previous year?
The above products are energy efficient designs and hence lead to conservation of drive power i.e. electricity.
i. MCPK: This series has replaced “CPK” series. For equivalent duty parameters, selecting MCPK results in smaller pump size thereby resulting in 10% lower weights. This leads to raw material conservation.
ii. Etanorm: This series has replaced “Mega” series and is 10% lighter in weight thereby resulting in raw material conservation.
iii. Etanorm SYT: This series has replaced “CPK-EY / EGY” series and is lighter in weight 10% thereby resulting in raw material conservation.
3. Does the company have procedures in place for sustainable sourcing (including transportation)? If yes, what percentage of your inputs was sourced sustainably?
The supplier selection, assessment and evaluation process includes elements of sustainability. This includes audits by internal Quality Management as well external audits like “Made by KSB” are carried out by the parent Company viz. KSB AG, Germany.
27
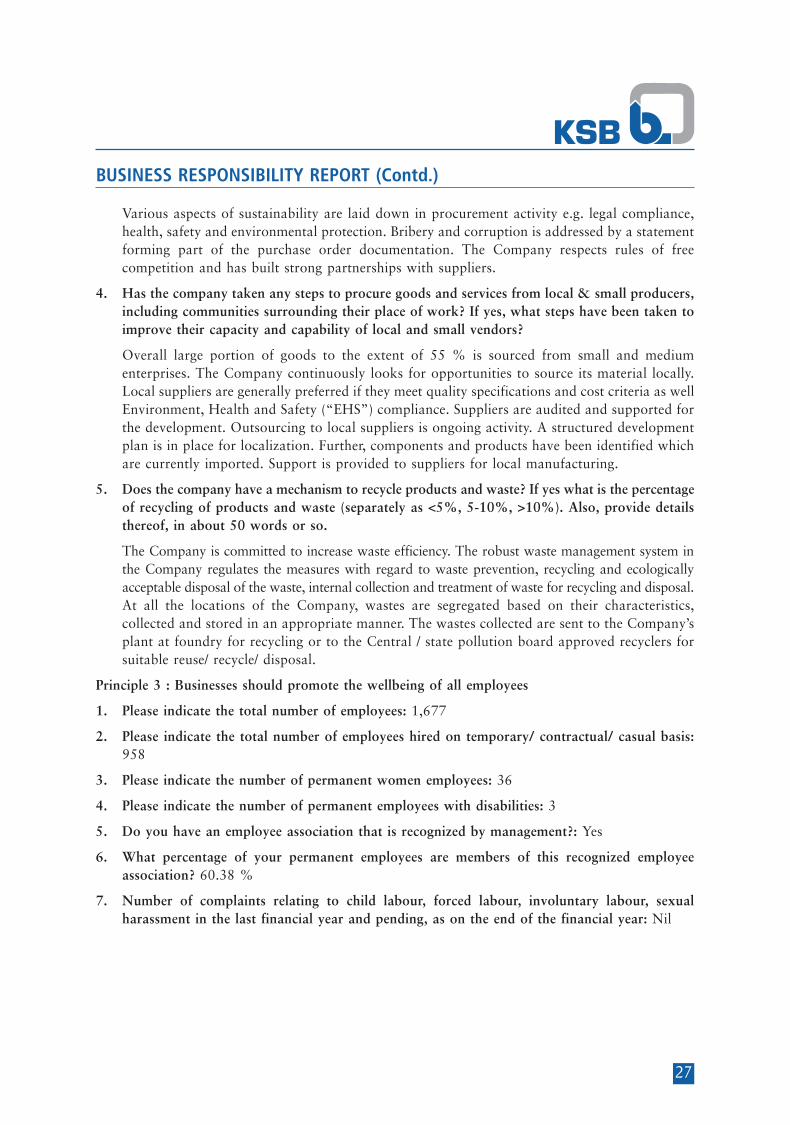
BUSINESS RESPONSIBILITY REPORT (Contd.)
Various aspects of sustainability are laid down in procurement activity e.g. legal compliance, health, safety and environmental protection. Bribery and corruption is addressed by a statement forming part of the purchase order documentation. The Company respects rules of free competition and has built strong partnerships with suppliers.
4. Has the company taken any steps to procure goods and services from local & small producers, including communities surrounding their place of work? If yes, what steps have been taken to improve their capacity and capability of local and small vendors?
Overall large portion of goods to the extent of 55 % is sourced from small and medium enterprises. The Company continuously looks for opportunities to source its material locally. Local suppliers are generally preferred if they meet quality specifications and cost criteria as well Environment, Health and Safety (“EHS”) compliance. Suppliers are audited and supported for the development. Outsourcing to local suppliers is ongoing activity. A structured development plan is in place for localization. Further, components and products have been identified which are currently imported. Support is provided to suppliers for local manufacturing.
5. Does the company have a mechanism to recycle products and waste? If yes what is the percentage of recycling of products and waste (separately as <5%, 5-10%, >10%). Also, provide details thereof, in about 50 words or so.
The Company is committed to increase waste efficiency. The robust waste management system in the Company regulates the measures with regard to waste prevention, recycling and ecologically acceptable disposal of the waste, internal collection and treatment of waste for recycling and disposal. At all the locations of the Company, wastes are segregated based on their characteristics, collected and stored in an appropriate manner. The wastes collected are sent to the Company’s plant at foundry for recycling or to the Central / state pollution board approved recyclers for suitable reuse/ recycle/ disposal.
Principle 3 : Businesses should promote the wellbeing of all employees
1. Please indicate the total number of employees: 1,677
2. Please indicate the total number of employees hired on temporary/ contractual/ casual basis: 958
3. Please indicate the number of permanent women employees: 36
4. Please indicate the number of permanent employees with disabilities: 3
5. Do you have an employee association that is recognized by management?: Yes
6. What percentage of your permanent employees are members of this recognized employee association? 60.38 %
7. Number of complaints relating to child labour, forced labour, involuntary labour, sexual harassment in the last financial year and pending, as on the end of the financial year: Nil

28
BUSINESS RESPONSIBILITY REPORT (Contd.)
8. What percentage of your under mentioned employees were given safety & skill up-gradation training in the last year?
(a) Permanent Employees : 90.70 %
(b) Permanent Women Employees: 95.20%
(c) Casual/ Temporary/ Contractual Employees: 94.44%
(d) Employees with Disabilities: 100%
Principle 4 : Businesses should respect the interests of, and be responsive towards all stakeholders, especially those who are disadvantaged, vulnerable and marginalized
1. Has the company mapped its internal and external stakeholders?
Yes. The company has mapped its internal and external stakeholders.
2. Out of the above, has the company identified the disadvantaged, vulnerable & marginalized stakeholders?
Yes. The company has identified the disadvantaged, vulnerable & marginalized stakeholders.
3. Are there any special initiatives taken by the company to engage with the disadvantaged, vulnerable and marginalized stakeholders. If so, provide details thereof, in about 50 words or so.
The details of initiatives undertaken for disadvantaged, vulnerable and marginalised stakeholders are in the Annual Report on CSR Activities annexed to Board’s Report.
Principle 5 : Businesses should respect and promote human rights
1. Does the policy of the company on human rights cover only the company or extend to the Group/ Joint Ventures/ Suppliers/ Contractors/ NGOs/ Others?
The Company’s policy on human rights extends to the group, suppliers, dealers, service providers, contractors and all relevant stakeholders.
2. How many stakeholder complaints have been received in the past financial year and what percent was satisfactorily resolved by the management? Nil
Principle 6 : Businesses should respect, protect and make efforts to restore the environment
1. Does the policy related to Principle 6 cover only the company or extends to the Group/ Joint Ventures/ Suppliers/ Contractors/ NGOs/ others.
The Company has well laid down policies, principles and standards that all its units in India must adhere to. Our Environment, Health and Safety Policy also specifies requirements to be extended to the contractors.
2. Does the company have strategies / initiatives to address global environmental issues such as climate change, global warming, etc.? Y/N. If yes, please give hyperlink for webpage etc.
Yes. The strategies / initiatives are covered in the action arising on implementation of the Policy.
3. Does the company identify and assess potential environmental risks? Y/N
Yes. The Company identifies and assesses potential environmental risks.
29
BUSINESS RESPONSIBILITY REPORT (Contd.)
4. Does the company have any project related to Clean Development Mechanism? If so, provide details thereof, in about 50 words or so. Also, if yes, whether any environmental compliance report is filed?
The Company currently does not have any Clean Development Mechanism Project.
5. Has the company undertaken any other initiatives on – clean technology, energy efficiency, renewable energy, etc. Y/N. If yes, please give hyperlink for web page etc.
Innovative technologies are used to reduce the impact on the environment. In the entire chain of manufacturing, the emphasis is on preserving natural resources. Processes are designed to minimize use of raw materials and energy.
Details of conservation of energy are in the annexure to the Board’s Report.
6. Are the emissions/waste generated by the company within the permissible limits given by CPCB/SPCB for the financial year being reported?
The Company is in compliance with the applicable environmental laws and regulations. The Company’s emissions, effluents and waste are within Central and State Pollution Control Boards permission limits.
7. Number of show cause / legal notices received from CPCB/SPCB which are pending (i.e. not resolved to satisfaction) as on end of Financial Year: Nil
Principle 7: Businesses, when engaged in influencing public and regulatory policy, should do so in a responsible manner
1. Is your company a member of any trade and chamber or association? If Yes, name only those major ones that your business deals with:
The Company is a member of:
i. Mahratta Chamber of Commerce Industries and Agriculture (MCCIA)
ii. Indian Pumps Manufacturers’ Association (IPMA)
iii. Confederation of Indian Industry (CII)
iv. Indo-German Chamber of Commerce (IGCC)
2. Have you advocated/lobbied through above associations for the advancement or improvement of public good? Yes/No; if yes specify the broad areas (drop box: Governance and Administration, Economic Reforms, Inclusive Development Policies, Energy security, Water, Food Security, Sustainable Business Principles, Others)
Yes, following are the broad areas:
i. Governance and Administration
ii. Economic Reforms
iii. Inclusive Development Policies
iv. Energy & Water Conservation
v. Sustainable Business

30
BUSINESS RESPONSIBILITY REPORT (Contd.)
Principle 8 : Businesses should support inclusive growth and equitable development
1. Does the company have specified programmes/ initiatives/ projects in pursuit of the policy related to Principle 8? If yes details thereof.
The details of programmes/ initiatives/ projects are in the Annual Report on CSR Activities annexed to Board’s Report.
2. Are the programmes/ projects undertaken through in-house team/ own foundation/ external NGO/ government structures/ any other organization?
The activities are undertaken through KSB Care Charitable Trust.
3. Have you done any impact assessment of your initiative?
The impact assessment of initiatives is an ongoing exercise as per the CSR activities.
4. What is your company’s direct contribution to community development projects- Amount in INR and the details of the projects undertaken.
The details of contribution are in the Annual Report on CSR Activities annexed to Board’s Report.
5. Have you taken steps to ensure that this community development initiative is successfully adopted by the community? Please explain in 50 words, or so.
The Company ensures its presence is established right from the commencement of the initiatives. It collaborates with the communities right from need identification to project implementation phase. The Company has extensive engagement with various stakeholders. The feedback from the stakeholders are analysed and various actions like improvement actions are prioritized.
Principle 9: Businesses should engage with and provide value to their customers and consumers in a responsible manner
1. What percentage of customer complaints/consumer cases are pending as on the end of financial year.
There were no new/ pending consumer complaints/ cases filed against the Company during the year.
2. Does the company display product information on the product label, over and above what is mandated as per local laws? Yes/ No/ N.A./ Remarks(additional information)
Yes, apart from the mandated declarations, additional declarations are furnished on the products / labels relating to the products and their usage.
3. Is there any case filed by any stakeholder against the company regarding unfair trade practices, irresponsible advertising and/or anti-competitive behaviour during the last five years and pending as on end of financial year. If so, provide details thereof, in about 50 words or so: NIL
4. Did your company carry out any consumer survey/consumer satisfaction trends?
The Company did not carry a customer satisfaction survey during the year since the Company carries the survey after reasonable intervals.
On behalf of the Board of Directors
G. SWARUPMumbai, 20th February, 2017 Chairman
31
ANNEXURE TO BOARD’S REPORT
G. Swarup ChairmanA. R. BroachaD. N. DamaniaN. N. Kampani
Verghese Oommen Pradip Shah Directors Chief Financial Officer Dr. Stephan Bross
V. K. ViswanathanS. F. Motwani
R. Narasimhan W. Stegmuller Company Secretary Rajeev Jain Managing Director
Mumbai, 20th February, 2017
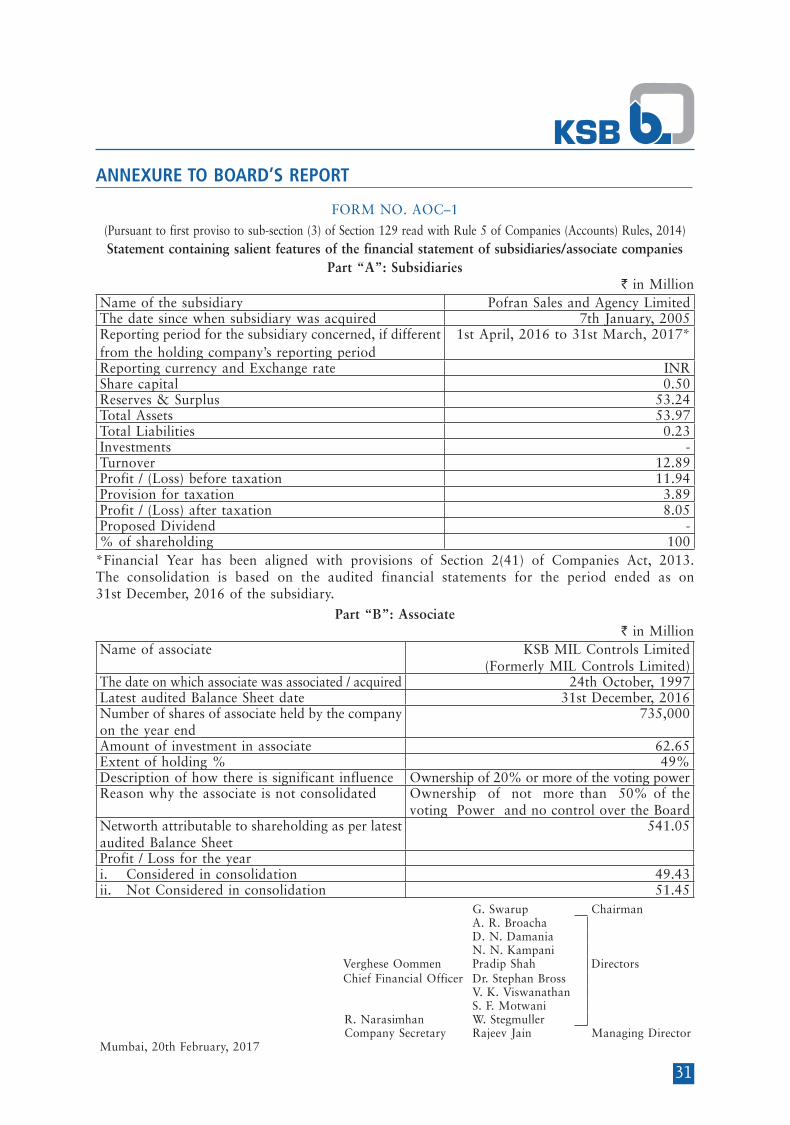
FORM NO. AOC–1
(Pursuant to first proviso to sub-section (3) of Section 129 read with Rule 5 of Companies (Accounts) Rules, 2014)Statement containing salient features of the financial statement of subsidiaries/associate companies
Part “A”: Subsidiaries` in Million
Name of the subsidiary Pofran Sales and Agency LimitedThe date since when subsidiary was acquired 7th January, 2005Reporting period for the subsidiary concerned, if different from the holding company’s reporting period
1st April, 2016 to 31st March, 2017*
Reporting currency and Exchange rate INRShare capital 0.50Reserves & Surplus 53.24Total Assets 53.97Total Liabilities 0.23Investments -Turnover 12.89Profit / (Loss) before taxation 11.94Provision for taxation 3.89Profit / (Loss) after taxation 8.05Proposed Dividend -% of shareholding 100
*Financial Year has been aligned with provisions of Section 2(41) of Companies Act, 2013. The consolidation is based on the audited financial statements for the period ended as on 31st December, 2016 of the subsidiary.
Part “B”: Associate ` in Million
Name of associate KSB MIL Controls Limited (Formerly MIL Controls Limited)
The date on which associate was associated / acquired 24th October, 1997Latest audited Balance Sheet date 31st December, 2016Number of shares of associate held by the company on the year end
735,000
Amount of investment in associate 62.65Extent of holding % 49%Description of how there is significant influence Ownership of 20% or more of the voting powerReason why the associate is not consolidated Ownership of not more than 50% of the
voting Power and no control over the BoardNetworth attributable to shareholding as per latest audited Balance Sheet
541.05
Profit / Loss for the yeari. Considered in consolidation 49.43ii. Not Considered in consolidation 51.45
32
ANNEXURE TO BOARD’S REPORT (Contd.)
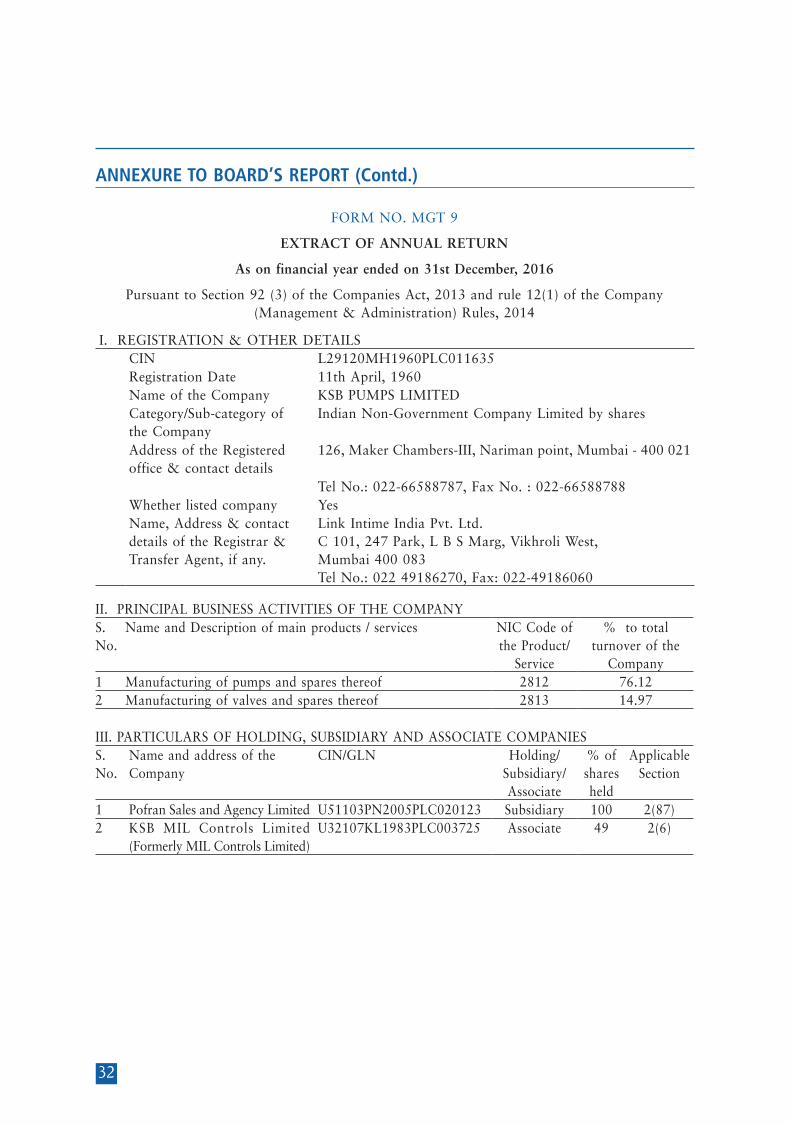
FORM NO. MGT 9
EXTRACT OF ANNUAL RETURN
As on financial year ended on 31st December, 2016
Pursuant to Section 92 (3) of the Companies Act, 2013 and rule 12(1) of the Company (Management & Administration) Rules, 2014
I. REGISTRATION & OTHER DETAILSCIN L29120MH1960PLC011635Registration Date 11th April, 1960Name of the Company KSB PUMPS LIMITEDCategory/Sub-category of the Company
Indian Non-Government Company Limited by shares
Address of the Registered office & contact details
126, Maker Chambers-III, Nariman point, Mumbai - 400 021
Tel No.: 022-66588787, Fax No. : 022-66588788Whether listed company YesName, Address & contact details of the Registrar & Transfer Agent, if any.
Link Intime India Pvt. Ltd. C 101, 247 Park, L B S Marg, Vikhroli West, Mumbai 400 083 Tel No.: 022 49186270, Fax: 022-49186060
II. PRINCIPAL BUSINESS ACTIVITIES OF THE COMPANY S. No.
Name and Description of main products / services NIC Code of the Product/
Service
% to total turnover of the
Company1 Manufacturing of pumps and spares thereof 2812 76.122 Manufacturing of valves and spares thereof 2813 14.97
III. PARTICULARS OF HOLDING, SUBSIDIARY AND ASSOCIATE COMPANIESS. No.
Name and address of the Company
CIN/GLN Holding/ Subsidiary/ Associate
% of shares held
Applicable Section
1 Pofran Sales and Agency Limited U51103PN2005PLC020123 Subsidiary 100 2(87)2 KSB MIL Controls Limited
(Formerly MIL Controls Limited)U32107KL1983PLC003725 Associate 49 2(6)
33
ANNEXURE TO BOARD’S REPORT (Contd.)
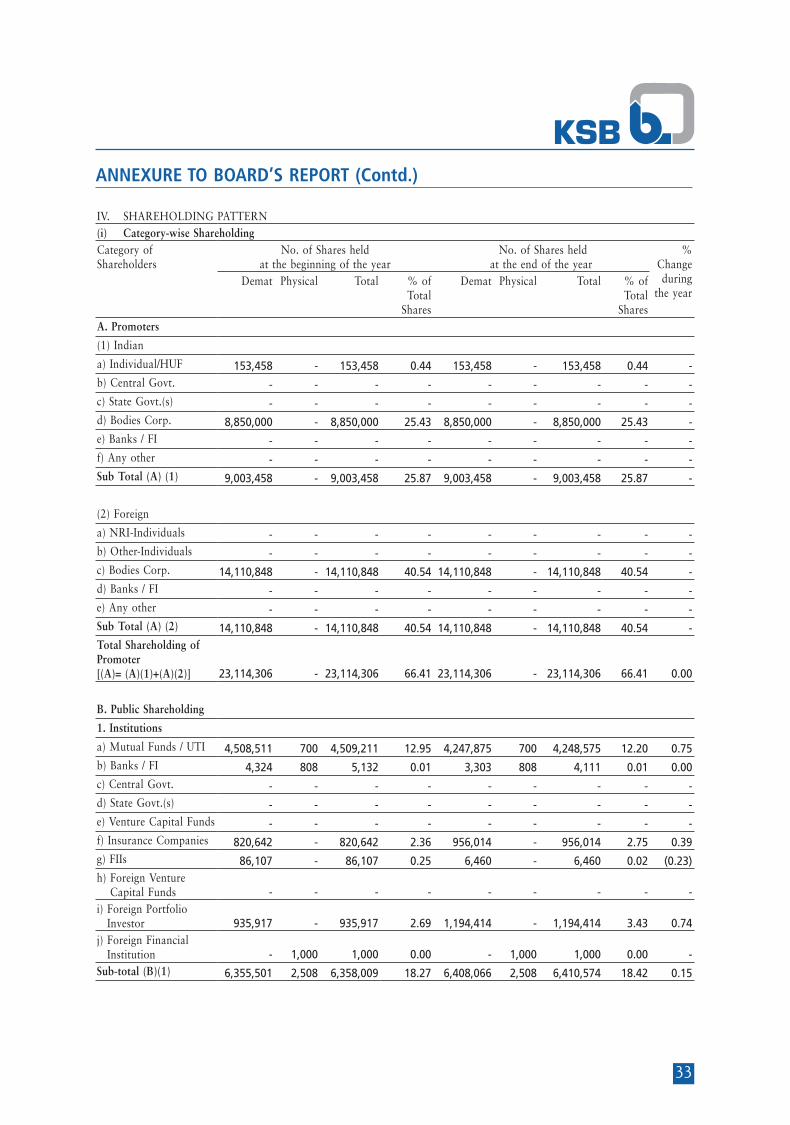
IV. SHAREHOLDING PATTERN (i) Category-wise ShareholdingCategory of Shareholders
No. of Shares held at the beginning of the year
No. of Shares held at the end of the year
% Change during
the year Demat Physical Total % of
Total Shares
Demat Physical Total % of Total
SharesA. Promoters
(1) Indian
a) Individual/HUF 153,458 - 153,458 0.44 153,458 - 153,458 0.44 -b) Central Govt. - - - - - - - - -c) State Govt.(s) - - - - - - - - -d) Bodies Corp. 8,850,000 - 8,850,000 25.43 8,850,000 - 8,850,000 25.43 -e) Banks / FI - - - - - - - - -f) Any other - - - - - - - - -Sub Total (A) (1) 9,003,458 - 9,003,458 25.87 9,003,458 - 9,003,458 25.87 -
(2) Foreign
a) NRI-Individuals - - - - - - - - -b) Other-Individuals - - - - - - - - -c) Bodies Corp. 14,110,848 - 14,110,848 40.54 14,110,848 - 14,110,848 40.54 -d) Banks / FI - - - - - - - - -e) Any other - - - - - - - - -Sub Total (A) (2) 14,110,848 - 14,110,848 40.54 14,110,848 - 14,110,848 40.54 -Total Shareholding of Promoter [(A)= (A)(1)+(A)(2)] 23,114,306 - 23,114,306 66.41 23,114,306 - 23,114,306 66.41 0.00
B. Public Shareholding
1. Institutions
a) Mutual Funds / UTI 4,508,511 700 4,509,211 12.95 4,247,875 700 4,248,575 12.20 0.75b) Banks / FI 4,324 808 5,132 0.01 3,303 808 4,111 0.01 0.00c) Central Govt. - - - - - - - - - d) State Govt.(s) - - - - - - - - - e) Venture Capital Funds - - - - - - - - - f) Insurance Companies 820,642 - 820,642 2.36 956,014 - 956,014 2.75 0.39g) FIIs 86,107 - 86,107 0.25 6,460 - 6,460 0.02 (0.23)h) Foreign Venture
Capital Funds - - - - - - - - -i) Foreign Portfolio
Investor 935,917 - 935,917 2.69 1,194,414 - 1,194,414 3.43 0.74j) Foreign Financial
Institution - 1,000 1,000 0.00 - 1,000 1,000 0.00 -Sub-total (B)(1) 6,355,501 2,508 6,358,009 18.27 6,408,066 2,508 6,410,574 18.42 0.15

34
ANNEXURE TO BOARD’S REPORT (Contd.)
Category of Shareholders
No. of Shares held at the beginning of the year
No. of Shares held at the end of the year
% Change during
the year Demat Physical Total % of
Total Shares
Demat Physical Total % of Total
Shares2. Non-Institutions
a) Bodies Corp.
i) Indian 1,299,497 3,966 1,303,463 3.74 1,318,933 3,966 1,322,899 3.80 0.06ii) Overseas - - - - - - - - -b) Individuals
i) Individual shareholders holding nominal share capital upto ` 1 lakh 2,845,333 328,593 3,173,926 9.11 2,796,912 318,258 3,115,170 8.94 (0.17)
ii) Individual shareholders holding nominal share capital in excess of ` 1 lakh 527,515 50,112 577,627 1.66 488,595 50,112 538,707 1.55 (0.11)
c) Trusts 1,016 - 1,016 0.00 1,716 - 1,716 0.00 0.00d) Hindu Undivided
Family 97,088 - 97,088 0.28 95,841 - 95,841 0.28 0.00e) Non-Resident Indians 126,691 5,604 132,295 0.38 146,672 5,604 152,276 0.44 0.06f) Directors/Relatives 34,200 - 34,200 0.10 41,420 - 41,420 0.12 0.02g) Clearing Members 15,914 - 15,914 0.05 14,935 - 14,935 0.04 (0.01)Sub-total (B)(2) 4,947,254 388,275 5,335,529 15.32 4,905,024 377,940 5,282,964 15.17 (0.15)Total Public Shareholding [(B) = (B)(1)+(B)(2)] 11,302,755 390,783 11,693,538 33.59 11,313,090 380,448 11,693,538 33.59 0.00C. Shares held by
Custodian for GDRs & ADRs - - - - - - - - -
Grand Total (A+B+C) 34,417,061 390,783 34,807,844 100.00 34,427,396 380,448 34,807,844 100.00 0.00
(ii) Shareholding of PromoterS.
No.Shareholder’s Name Shareholding at the beginning of
the yearShareholding at the end of the
year%
change in shareholding during the
year
No. of Shares
% of total Shares of the
Company
% of Shares Pledged/
encumbered to total Shares
No. of Shares
% of total Shares of the
Company
% of Shares Pledged/
encumbered to total Shares
1 Vikram Swarup 40,000 0.11 - 40,000 0.11 - -2 Gaurav Swarup 34,000 0.10 - 34,000 0.10 - -3 Bindu Vikram Swarup 16,000 0.05 - 16,000 0.05 - -4 Parul Swarup 3,058 0.01 - 3,058 0.01 - -5 Vikram Swarup & Gaurav Swarup 60,400 0.17 - 60,400 0.17 - -6 The Industrial And Prudential
Investment Co. Ltd.7,140,000 20.51 - 7,140,000 20.51 - -
7 Paharpur Cooling Towers Ltd. 1,450,000 4.17 - 1,450,000 4.17 - -8 New Holding And Trading Co. Ltd. 260,000 0.75 - 260,000 0.75 - -9 Canadian Kay Pump Limited 14,110,848 40.54 - 14,110,848 40.54 - -
Total 23,114,306 66.41 - 23,114,306 66.41 - -
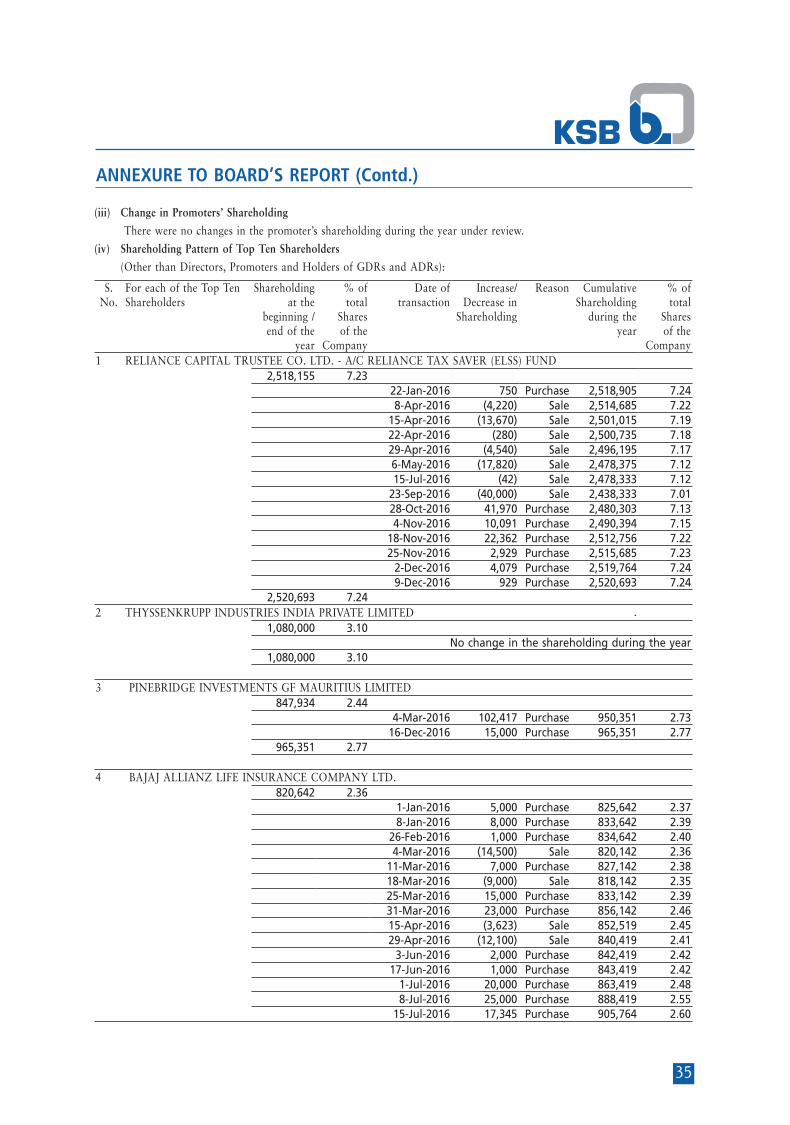
35
ANNEXURE TO BOARD’S REPORT (Contd.)
(iii) Change in Promoters’ Shareholding
There were no changes in the promoter’s shareholding during the year under review.
(iv) Shareholding Pattern of Top Ten Shareholders
(Other than Directors, Promoters and Holders of GDRs and ADRs):
S. No.
For each of the Top Ten Shareholders
Shareholding at the
beginning /end of the
year
% of total
Shares of the
Company
Date of transaction
Increase/ Decrease in
Shareholding
Reason Cumulative Shareholding
during the year
% of total
Shares of the
Company1 RELIANCE CAPITAL TRUSTEE CO. LTD. - A/C RELIANCE TAX SAVER (ELSS) FUND
2,518,155 7.2322-Jan-2016 750 Purchase 2,518,905 7.248-Apr-2016 (4,220) Sale 2,514,685 7.22
15-Apr-2016 (13,670) Sale 2,501,015 7.1922-Apr-2016 (280) Sale 2,500,735 7.1829-Apr-2016 (4,540) Sale 2,496,195 7.176-May-2016 (17,820) Sale 2,478,375 7.1215-Jul-2016 (42) Sale 2,478,333 7.12
23-Sep-2016 (40,000) Sale 2,438,333 7.0128-Oct-2016 41,970 Purchase 2,480,303 7.134-Nov-2016 10,091 Purchase 2,490,394 7.15
18-Nov-2016 22,362 Purchase 2,512,756 7.2225-Nov-2016 2,929 Purchase 2,515,685 7.23
2-Dec-2016 4,079 Purchase 2,519,764 7.249-Dec-2016 929 Purchase 2,520,693 7.24
2,520,693 7.24 2 THYSSENKRUPP INDUSTRIES INDIA PRIVATE LIMITED .
1,080,000 3.10 No change in the shareholding during the year
1,080,000 3.10
3 PINEBRIDGE INVESTMENTS GF MAURITIUS LIMITED 847,934 2.44
4-Mar-2016 102,417 Purchase 950,351 2.7316-Dec-2016 15,000 Purchase 965,351 2.77
965,351 2.77
4 BAJAJ ALLIANZ LIFE INSURANCE COMPANY LTD. 820,642 2.36
1-Jan-2016 5,000 Purchase 825,642 2.378-Jan-2016 8,000 Purchase 833,642 2.39
26-Feb-2016 1,000 Purchase 834,642 2.404-Mar-2016 (14,500) Sale 820,142 2.36
11-Mar-2016 7,000 Purchase 827,142 2.3818-Mar-2016 (9,000) Sale 818,142 2.3525-Mar-2016 15,000 Purchase 833,142 2.3931-Mar-2016 23,000 Purchase 856,142 2.4615-Apr-2016 (3,623) Sale 852,519 2.4529-Apr-2016 (12,100) Sale 840,419 2.41
3-Jun-2016 2,000 Purchase 842,419 2.4217-Jun-2016 1,000 Purchase 843,419 2.42
1-Jul-2016 20,000 Purchase 863,419 2.488-Jul-2016 25,000 Purchase 888,419 2.55
15-Jul-2016 17,345 Purchase 905,764 2.60
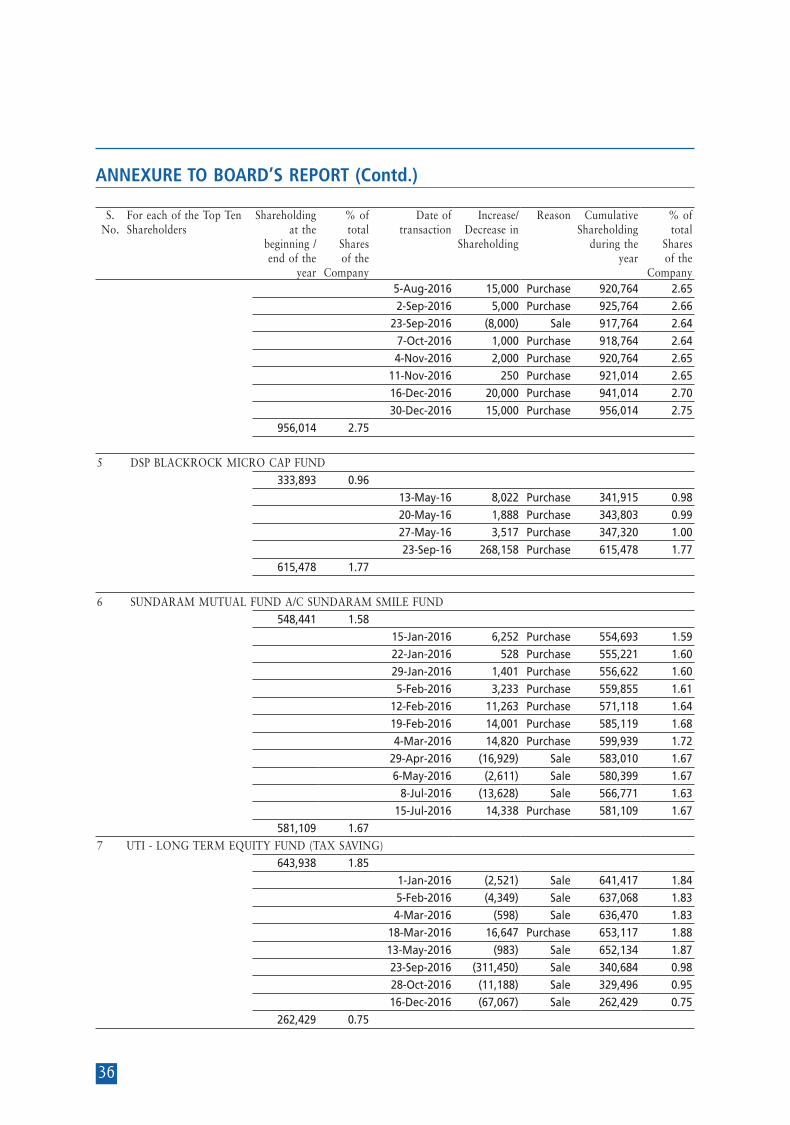
36
ANNEXURE TO BOARD’S REPORT (Contd.)
S. No.
For each of the Top Ten Shareholders
Shareholding at the
beginning /end of the
year
% of total
Shares of the
Company
Date of transaction
Increase/ Decrease in
Shareholding
Reason Cumulative Shareholding
during the year
% of total
Shares of the
Company5-Aug-2016 15,000 Purchase 920,764 2.65
2-Sep-2016 5,000 Purchase 925,764 2.66
23-Sep-2016 (8,000) Sale 917,764 2.64
7-Oct-2016 1,000 Purchase 918,764 2.64
4-Nov-2016 2,000 Purchase 920,764 2.65
11-Nov-2016 250 Purchase 921,014 2.65
16-Dec-2016 20,000 Purchase 941,014 2.70
30-Dec-2016 15,000 Purchase 956,014 2.75
956,014 2.75
5 DSP BLACKROCK MICRO CAP FUND 333,893 0.96
13-May-16 8,022 Purchase 341,915 0.98
20-May-16 1,888 Purchase 343,803 0.99
27-May-16 3,517 Purchase 347,320 1.00
23-Sep-16 268,158 Purchase 615,478 1.77
615,478 1.77
6 SUNDARAM MUTUAL FUND A/C SUNDARAM SMILE FUND 548,441 1.58
15-Jan-2016 6,252 Purchase 554,693 1.59
22-Jan-2016 528 Purchase 555,221 1.60
29-Jan-2016 1,401 Purchase 556,622 1.60
5-Feb-2016 3,233 Purchase 559,855 1.61
12-Feb-2016 11,263 Purchase 571,118 1.64
19-Feb-2016 14,001 Purchase 585,119 1.68
4-Mar-2016 14,820 Purchase 599,939 1.72
29-Apr-2016 (16,929) Sale 583,010 1.67
6-May-2016 (2,611) Sale 580,399 1.67
8-Jul-2016 (13,628) Sale 566,771 1.63
15-Jul-2016 14,338 Purchase 581,109 1.67
581,109 1.67
7 UTI - LONG TERM EQUITY FUND (TAX SAVING)643,938 1.85
1-Jan-2016 (2,521) Sale 641,417 1.84
5-Feb-2016 (4,349) Sale 637,068 1.83
4-Mar-2016 (598) Sale 636,470 1.83
18-Mar-2016 16,647 Purchase 653,117 1.88
13-May-2016 (983) Sale 652,134 1.87
23-Sep-2016 (311,450) Sale 340,684 0.98
28-Oct-2016 (11,188) Sale 329,496 0.95
16-Dec-2016 (67,067) Sale 262,429 0.75
262,429 0.75
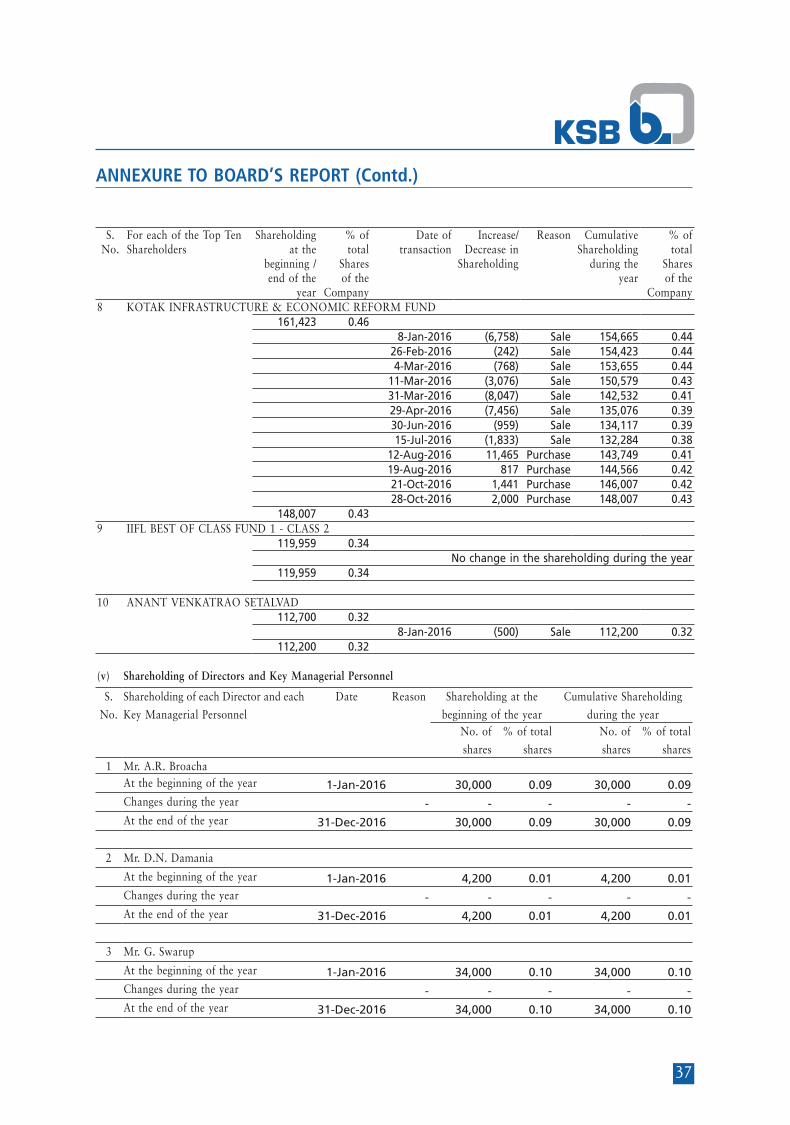
37
ANNEXURE TO BOARD’S REPORT (Contd.)
S. No.
For each of the Top Ten Shareholders
Shareholding at the
beginning /end of the
year
% of total
Shares of the
Company
Date of transaction
Increase/ Decrease in
Shareholding
Reason Cumulative Shareholding
during the year
% of total
Shares of the
Company8 KOTAK INFRASTRUCTURE & ECONOMIC REFORM FUND
161,423 0.468-Jan-2016 (6,758) Sale 154,665 0.44
26-Feb-2016 (242) Sale 154,423 0.444-Mar-2016 (768) Sale 153,655 0.44
11-Mar-2016 (3,076) Sale 150,579 0.4331-Mar-2016 (8,047) Sale 142,532 0.4129-Apr-2016 (7,456) Sale 135,076 0.3930-Jun-2016 (959) Sale 134,117 0.3915-Jul-2016 (1,833) Sale 132,284 0.38
12-Aug-2016 11,465 Purchase 143,749 0.4119-Aug-2016 817 Purchase 144,566 0.4221-Oct-2016 1,441 Purchase 146,007 0.4228-Oct-2016 2,000 Purchase 148,007 0.43
148,007 0.439 IIFL BEST OF CLASS FUND 1 - CLASS 2
119,959 0.34No change in the shareholding during the year
119,959 0.34
10 ANANT VENKATRAO SETALVAD 112,700 0.32
8-Jan-2016 (500) Sale 112,200 0.32 112,200 0.32
(v) Shareholding of Directors and Key Managerial Personnel
S.
No.
Shareholding of each Director and each
Key Managerial Personnel
Date Reason Shareholding at the
beginning of the year
Cumulative Shareholding
during the yearNo. of
shares
% of total
shares
No. of
shares
% of total
shares1 Mr. A.R. Broacha
At the beginning of the year 1-Jan-2016 30,000 0.09 30,000 0.09Changes during the year - - - - -At the end of the year 31-Dec-2016 30,000 0.09 30,000 0.09
2 Mr. D.N. Damania
At the beginning of the year 1-Jan-2016 4,200 0.01 4,200 0.01Changes during the year - - - - -At the end of the year 31-Dec-2016 4,200 0.01 4,200 0.01
3 Mr. G. Swarup
At the beginning of the year 1-Jan-2016 34,000 0.10 34,000 0.10Changes during the year - - - - -At the end of the year 31-Dec-2016 34,000 0.10 34,000 0.10

38
ANNEXURE TO BOARD’S REPORT (Contd.)
V. INDEBTEDNESS Indebtedness of the Company including interest outstanding/accrued but not due for payment.
` in MillionParticulars Secured Loans
excluding
deposits
Unsecured Loans Deposits Total
Indebtedness
Indebtedness at the beginning of the financial yeari) Principal Amount 12.97 - - 12.97 ii) Interest due but not paid - - - -iii) Interest accrued but not due - - - -Total (i + ii + iii) 12.97 - - 12.97Change in Indebtedness during the financial yearAddition (Net) 38.87 - - 38.87 Reduction (Net) - - - - Net Change 38.87 - - 38.87Indebtedness at the end of the financial yeari) Principal Amount 51.84 - - 51.84 ii) Interest due but not paid - - - -iii) Interest accrued but not due - - - -Total (i + ii + iii) 51.84 - - 51.84
VI. REMUNERATION OF DIRECTORS AND KEY MANAGERIAL PERSONNELA. Remuneration to Managing Director, Whole-time Directors and/or Manager ` in Million
S.
No.
Particulars of Remuneration to
Managing Director
Mr. Rajeev Jain
(effective from
1st July, 2016)
Mr. W. Spiegel
(upto
30th June, 2016)
Total
Amount
1 Gross salary
(a) Salary as per provisions contained in Section 17(1) of the
Income-tax Act, 19618.80 8.24 17.04
(b) Value of perquisites u/s 17(2) Income-tax Act, 1961 1.88 4.77 6.65(c) Profits in lieu of salary under Section 17(3) Income-tax
Act, 1961 - - -
2 Stock Option - - -3 Sweat Equity - - -4 Commission - - -
- as % of profit - - -- others, specify - - -
5 Others (Contribution to Provident Fund) 0.63 0.20 0.83Total (A) 11.31 13.21 24.52Ceiling as per the Act 49.13

39
ANNEXURE TO BOARD’S REPORT (Contd.)
B. Remuneration to other Directors ` in MillionS.
No.Particulars of Remuneration Name of Directors Total
Amount1 Independent Directors Mr. A.R.
Broacha Mr. V.K.
Viswanathan Mr. Pradip
Shah Ms. S. F. Motwani
Mr. D. N. Damania
Fee for attending board/ committee meetings
0.23 0.10 0.19 0.05 0.23
Commission 0.50 0.50 0.50 0.50 0.50Others - - - - -Total (1) 0.73 0.60 0.69 0.55 0.73 3.30
2 Other Non-Executive Directors
Mr. G. Swarup Mr. N.N. Kampani
Dr. Stephan Bross
Mr. W. Stegmuller
Fee for attending board/ committee meetings
0.26 0.07 0.18 0.10
Commission 0.50 0.50 0.50 0.50Others - - - -Total (2) 0.76 0.57 0.68 0.60 2.61Total (B)=(1+2) 5.91Total Managerial Remuneration (A) + (B)
30.43
Overall Ceiling as per the Act 58.95
C. Remuneration to Key Managerial Personnel other than MD / Manager / WTD ` in MillionS.
No.Particulars of Remuneration Key Managerial Personnel Total
AmountDesignation Chief Financial Officer Company Secretary
1 Gross salary
(a) Salary as per provisions contained in Section 17(1) of the Income-tax Act, 1961
9.52 2.41 11.93
(b) Value of perquisites u/s 17(2) Income-tax Act, 1961 0.12 0.02 0.14(c) Profits in lieu of salary under Section 17(3)
Income-tax Act, 1961 - -
2 Stock Option - -3 Sweat Equity - -4 Commission
- as % of profit - -- others, specify - -
5 Others (Contribution to Provident Fund) 0.38 0.11 0.49Total 10.02 2.54 12.56
VII. PENALTIES / PUNISHMENT/ COMPOUNDING OF OFFENCES:
During the year under review, no penalties were levied against the Company, its Directors or any of its officers.
On behalf of Board of Directors
G. SwarupMumbai, 20th February, 2017 Chairman
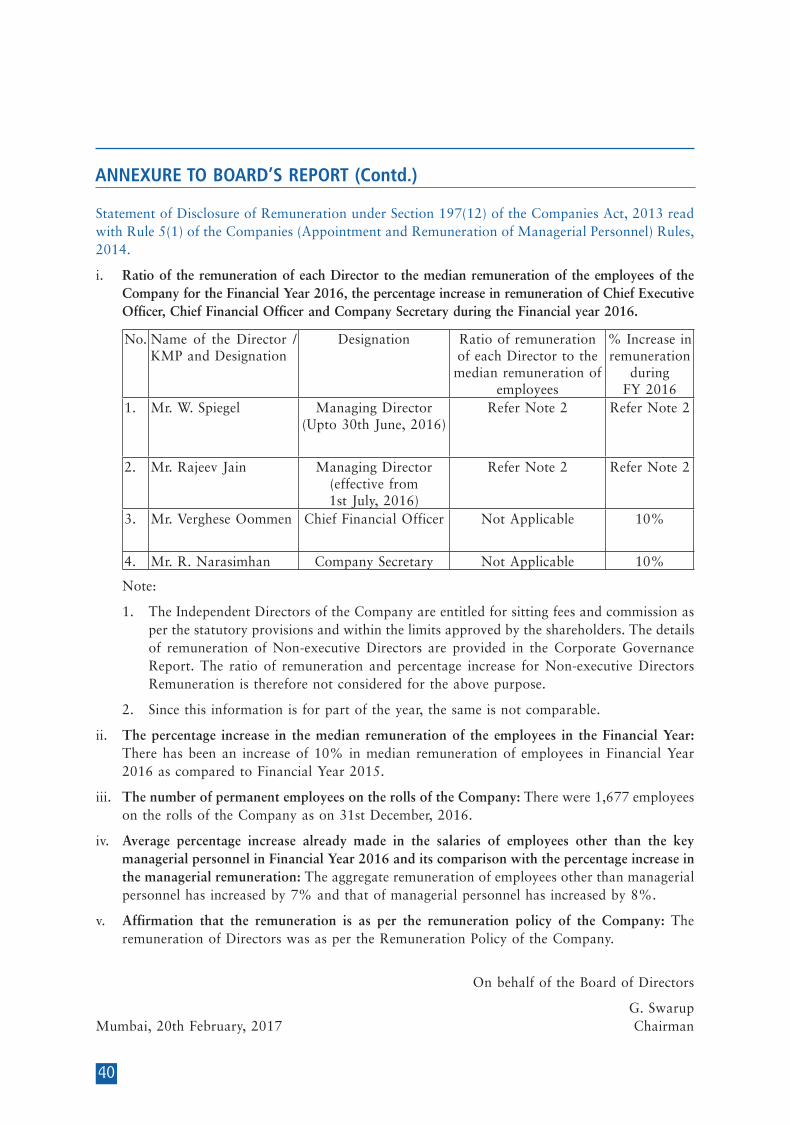
40
ANNEXURE TO BOARD’S REPORT (Contd.)
Statement of Disclosure of Remuneration under Section 197(12) of the Companies Act, 2013 read with Rule 5(1) of the Companies (Appointment and Remuneration of Managerial Personnel) Rules, 2014.
i. Ratio of the remuneration of each Director to the median remuneration of the employees of the Company for the Financial Year 2016, the percentage increase in remuneration of Chief Executive Officer, Chief Financial Officer and Company Secretary during the Financial year 2016.
No. Name of the Director / KMP and Designation
Designation Ratio of remuneration of each Director to the median remuneration of
employees
% Increase in remuneration
during FY 2016
1. Mr. W. Spiegel Managing Director (Upto 30th June, 2016)
Refer Note 2 Refer Note 2
2. Mr. Rajeev Jain Managing Director (effective from 1st July, 2016)
Refer Note 2 Refer Note 2
3. Mr. Verghese Oommen Chief Financial Officer Not Applicable 10%
4. Mr. R. Narasimhan Company Secretary Not Applicable 10%
Note:
1. The Independent Directors of the Company are entitled for sitting fees and commission as per the statutory provisions and within the limits approved by the shareholders. The details of remuneration of Non-executive Directors are provided in the Corporate Governance Report. The ratio of remuneration and percentage increase for Non-executive Directors Remuneration is therefore not considered for the above purpose.
2. Since this information is for part of the year, the same is not comparable.
ii. The percentage increase in the median remuneration of the employees in the Financial Year: There has been an increase of 10% in median remuneration of employees in Financial Year 2016 as compared to Financial Year 2015.
iii. The number of permanent employees on the rolls of the Company: There were 1,677 employees on the rolls of the Company as on 31st December, 2016.
iv. Average percentage increase already made in the salaries of employees other than the key managerial personnel in Financial Year 2016 and its comparison with the percentage increase in the managerial remuneration: The aggregate remuneration of employees other than managerial personnel has increased by 7% and that of managerial personnel has increased by 8%.
v. Affirmation that the remuneration is as per the remuneration policy of the Company: The remuneration of Directors was as per the Remuneration Policy of the Company.
On behalf of the Board of Directors
G. SwarupMumbai, 20th February, 2017 Chairman

41
ANNEXURE TO BOARD’S REPORT (Contd.)
A. CONSERVATION OF ENERGY
The Company is constantly engaged in various initiatives towards conservation of energy. Recent measures implemented include installation of automatic schedulers for central air conditioning system at Pimpri and Chinchwad plants, rain harvesting at Pimpri plant and variable frequency drive at Chinchwad test field.
B. TECHNOLOGY ABSORPTION
1. Performance and Product Improvements
More products from our Submersible range are now available as energy efficient products as certified by Bureau of Energy Efficiency. This will continue to remain Company’s focus area in the near future.
2. Research and Development
The development of new series catering to API markets is now complete. Existing product basket catering to sewage and dewatering segment is now enhanced.
3. Benefits of Research and Development
The enhancement in the product basket would meet the growing industry needs with competitive products.
4. Future Plans
Development activities to introduce new series catering to Energy sector have started and will continue in the next year.
5. Expenditure on Research and Development
The recurring expenditure during the year amounted to ` 2.93 Million (previous year ` 2.94 Million) and it is 0.04% (previous year 0.04%) of the total turnover. There is no capital expenditure during the year under review and previous year.
6. Technology Absorption, Adaptation and Innovation
Development of new series of between bearing pumps catering to API markets is now complete. Higher capacity sewage pumps for the local markets are now available.
C. FOREIGN EXCHANGE EARNINGS AND OUTGO
Exports during the year were ` 1,133 Million. Total foreign exchange earned during the year was ` 1,194 Million. Export orders outstanding for execution are ` 484 Million. Total foreign exchange used during the year was ` 961 Million.
On behalf of the Board of Directors
G. SwarupChairman
Mumbai, 20th February, 2017
42
ANNEXURE TO BOARD’S REPORT (Contd.)
FORM NO. MR-3
SECRETARIAL AUDIT REPORT
FOR THE FINANCIAL YEAR ENDED 31ST DECEMBER, 2016
[Pursuant to Section 204(1) of the Companies Act, 2013 and Rule No. 9 of the Companies (Appointment and Remuneration Personnel) Rules, 2014]
ToThe Members,KSB PUMPS LIMITED126, Maker Chambers- III,Nariman Point,Mumbai 400 021
Dear Sir / Madam,
We have conducted the secretarial audit of the compliance of applicable statutory provisions and the adherence to good Corporate Governance practice by KSB Pumps Limited (hereinafter called “the Company”). The Secretarial Audit was conducted in a manner that provided us a reasonable basis for evaluating the corporate conducts / statutory compliances and expressing our opinion thereon.
Based on our verification of the Company’s Books, Papers, Minutes Books, Forms and Returns filed with regulatory authorities and other records maintained by the Company and also the information provided by the Company, its officers, agents and authorized representatives during the conduct of secretarial audit, we hereby report that in our opinion, the Company has, during the financial year ended 31st December, 2016, complied with the statutory provisions listed hereunder and also that the Company has proper Board processes and compliance mechanism in place to the extent, in the manner and subject to reporting made hereinafter:
We herewith report that maintenance of proper and updated Books, Papers, Minutes Books, filing of Forms and Returns with applicable regulatory authorities and maintaining other records is responsibility of management and of the Company. Our responsibility is to verify the content of the documents produced before us, make objective evaluation of the content in respect of compliance and report thereon. We have examined on test check basis, the books, papers, minute books, forms and returns filed and other records maintained by the Company and produced before us for the financial year ended 31st December, 2016, as per the provisions of:
(i) The Companies Act, 2013 and the rules made there under;
(ii) The Securities Contracts (Regulation) Act, 1956 (‘SCRA’) and the rules made there under;
(iii) The Depositories Act, 1996 and the Regulations and Bye-laws framed there under;
(iv) Foreign Exchange Management Act, 1999 and the rules and regulations made there under, to the extent of Foreign Direct Investment (FDI), Overseas Direct Investment (ODI) and External Commercial Borrowings (ECB), to the extent to which the same was applicable to the Company;
(v) The following Regulations and Guidelines prescribed under the Securities and Exchange Board of India Act, 1992 (‘SEBI Act’):-
(a) The Securities and Exchange Board of India (Substantial Acquisition of Shares and Takeovers) Regulations, 2011;
43
ANNEXURE TO BOARD’S REPORT (Contd.)
(b) The Securities and Exchange Board of India (Prohibition of Insider Trading) Regulations, 1992;
(c) The Securities and Exchange Board of India (Registrars to an Issue and Share Transfer Agents) Regulations, 1993, regarding the Companies Act and dealing with client;
(d) The Securities and Exchange Board of India (Listing Obligations and Disclosure Requirement) Regulations, 2015.
(vi) Considering activities of the Company, there is no specific regulator / law subject to whose approval the company can carry on / continue business operation and hence no comment is invited in respect of the same. We have also in-principally verified systems and mechanism which is in place and the system driven Legal Compliance System established in the Company and followed by the Company which tracks compliances and generates necessary certificates and ensures Compliance of other applicable Laws like Labour Laws, Environmental Law, Legal Metrology Act etc (in addition to the above mentioned Laws (i to v) and applicable to the Company) and we have also relied on the representation made by the Company and its Officers in respect of systems and mechanism formed/followed by the Company for compliances of other applicable Acts, Laws and Regulations and found the satisfactory operation of the of the same.
We have also examined compliance with the applicable clauses of the following:
(i) Secretarial Standard issued by the Institute of Company Secretaries of India;
(ii) The Listing Agreement(s) entered into by the Company with the Bombay Stock Exchange and the National Stock Exchange.
We further Report that, during the year, it was not mandatory on the part of the Company to comply with the following Regulations / Guidelines:
(a) The Securities and Exchange Board of India (Employee Stock Option Scheme and Employee Stock Purchase Scheme) Guidelines, 1999;
(b) The Securities and Exchange Board of India (Delisting of Equity Shares) Regulations, 2009;
(c) The Securities and Exchange Board of India (Buy Back of Securities) Regulations, 1998;
(d) The Securities and Exchange Board of India (Issue and Listing of Debt Securities) Regulations, 2008;
(e) The Securities and Exchange Board of India (Issue of Capital and Disclosure Requirements) Regulations, 2009 (to the extent applicable);
Based on aforesaid information provided by the Company, we report that during the financial year under report, the Company has complied with the provisions of the above mentioned Act/s including the applicable provisions of the Companies Act, 2013 and Rules, Regulations, Standards etc. mentioned above and we have not found material observation / instances of material non- Compliance in respect of the same.
We further report that:
The Board of Directors of the Company is duly constituted with proper balance of Executive Directors, Non-Executive Directors and Independent Directors. The changes in the composition of the Board of Directors that took place during the year under review were carried out in compliance with the provisions of the Act.
44
ANNEXURE TO BOARD’S REPORT (Contd.)
We also report that adequate notice and in case of urgency shorter notice was given to all Directors to schedule the Board Meetings and necessary compliances as envisaged in the Secretarial Standard was carried out in respect of holding of Board Meeting with Short Notice. The agenda along with detailed notes to agenda were sent at least 7 days in advance unless the meeting was called at the short notice and a reasonable system exists for Board Members to seek and obtain further information and clarifications on the agenda items before the meeting and for meaningful participation at the meetings.
It is noted that majority decision is carried through and proper system is in place which facilitates / ensure to capture and record, the dissenting member’s views, if any, as part of the Minutes.
Based on representation made by the Company and its Officers explaining us in respect of internal systems and mechanism established by the Company which ensures compliances of other Acts, Laws and Regulations applicable to the Company, we report that there are adequate systems and processes in the Company commensurate with the size and operations of the Company to monitor and ensure compliance with applicable laws, rules and regulations.
We further report that during the year under report, the Company has not undertaken any corporate action having a major bearing on the Company’s affairs in pursuance of aforesaid laws, rules and regulations, guidelines, standards, etc. as mentioned above. However, the following major event which took place during the year under review:
Managerial Personnel of the Company subject to the approval of the Shareholders and Central Government during the year under review and the Company has duly made an application to the Central Government for seeking its approval in this regard.
For Nilesh Shah & AssociatesCompany Secretaries
Hetal ShahPartner (FCS: 8063) C.P. No. : 8964
Mumbai, 20th February, 2017
Note : This Report has to be read with “Annexure - A”
45
ANNEXURE TO BOARD’S REPORT (Contd.)
'ANNEXURE A'
To,The Members,KSB PUMPS LIMITED126, Maker Chambers- III,Nariman Point,Mumbai 400 021
1. Maintenance of secretarial record is the responsibility of the management of the Company. Our responsibility is to express an opinion on these secretarial records based on our audit.
2. We have followed the audit practices and processes as were appropriate to obtain reasonable assurance about the correctness of the contents of the Secretarial records. The verification was done on test basis (by verifying records made available to us) to ensure that correct facts are reflected in secretarial records. We believe that the processes and practices, we followed, provide a reasonable basis for our opinion.
3. We have not verified the correctness and appropriateness of financial records and Books of Accounts of the company.
4. Wherever required, we have obtained Management representation about the compliance of laws, rules and regulations and occurrence of events.
5. The compliance of the provisions of Corporate and other applicable laws, rules, regulations, standards is responsibility of management. Our examination was limited to the verification of process followed by Company to ensure adequate Compliance.
6. The Secretarial Audit Report is neither an assurance as to the future viability of the company nor of the efficacy or effectiveness with which the management has conducted the affairs of the company.
For Nilesh Shah & AssociatesCompany Secretaries
Hetal ShahPartner (FCS: 8063) C.P. No. : 8964
Mumbai, 20th February, 2017
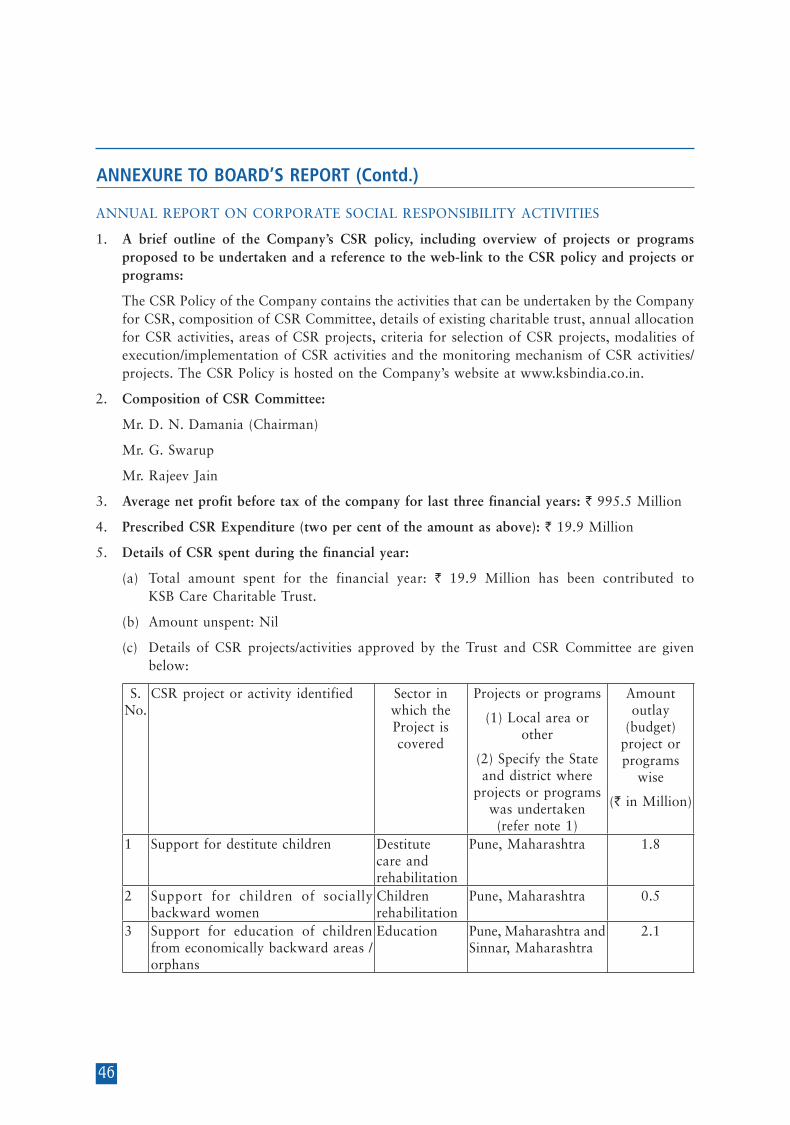
46
ANNEXURE TO BOARD’S REPORT (Contd.)
ANNUAL REPORT ON CORPORATE SOCIAL RESPONSIBILITY ACTIVITIES
1. A brief outline of the Company’s CSR policy, including overview of projects or programs proposed to be undertaken and a reference to the web-link to the CSR policy and projects or programs:
The CSR Policy of the Company contains the activities that can be undertaken by the Company for CSR, composition of CSR Committee, details of existing charitable trust, annual allocation for CSR activities, areas of CSR projects, criteria for selection of CSR projects, modalities of execution/implementation of CSR activities and the monitoring mechanism of CSR activities/ projects. The CSR Policy is hosted on the Company’s website at www.ksbindia.co.in.
2. Composition of CSR Committee:
Mr. D. N. Damania (Chairman)
Mr. G. Swarup
Mr. Rajeev Jain
3. Average net profit before tax of the company for last three financial years: ` 995.5 Million
4. Prescribed CSR Expenditure (two per cent of the amount as above): ` 19.9 Million
5. Details of CSR spent during the financial year:
(a) Total amount spent for the financial year: ` 19.9 Million has been contributed to KSB Care Charitable Trust.
(b) Amount unspent: Nil
(c) Details of CSR projects/activities approved by the Trust and CSR Committee are given below:
S. No.
CSR project or activity identified Sector in which the Project is covered
Projects or programs
(1) Local area or other
(2) Specify the State and district where
projects or programs was undertaken (refer note 1)
Amount outlay
(budget) project or programs
wise
(` in Million)
1 Support for destitute children Destitute care and rehabilitation
Pune, Maharashtra 1.8
2 Support for children of socially backward women
Children rehabilitation
Pune, Maharashtra 0.5
3 Support for education of children from economically backward areas / orphans
Education Pune, Maharashtra and Sinnar, Maharashtra
2.1

47
ANNEXURE TO BOARD’S REPORT (Contd.)
S. No.
CSR project or activity identified Sector in which the Project is covered
Projects or programs
(1) Local area or other
(2) Specify the State and district where
projects or programs was undertaken (refer note 1)
Amount outlay
(budget) project or programs
wise
(` in Million)
4 Support for recreational and cultural centre for disabled children
Promoting differently abled children
Pune, Maharashtra and Coimbatore, Tamil Nadu
2.1
5 Support for deprived / cancer patients Promoting healthcare including preventive healthcare
Pune, Maharashtra 4.5
6 Support for old age home Destitute care Pune, Maharashtra 1.97 Sanitation in rural village Sanitation Nashik, Maharashtra 0.78 Providing vocational skills for
livelihood of women from rural areasEmployment Nashik, Maharashtra 0.2
9 Support for children, destitute women and education
Children/ women rehabilitation, education
Nashik, Maharashtra 2.5
10 Education support for mentally/ physically challenged children
Education Nashik, Maharashtra and Coimbatore, Tamil Nadu
3.7
Total 20.0
Notes:
1. The programs and projects identified are in and around manufacturing locations of the Company.
2. The Company spends the amounts allocated for CSR activities through its implementing agency KSB Care Charitable Trust, Mumbai. The trustees and the CSR committee approves the projects identified. The above projects/activities undertaken during the year 2016 are from the contribution, which the company made during the year 2015. Similarly, the contribution which has been made in 2016 will be spent for the projects to be approved in 2017. The said trust spends the amount on CSR activities as per the specific instructions given by the CSR Committee over a specified time frame. No overhead expenditure is proposed to be incurred on these projects.
3. For the amount spent on the projects or programmes (direct expenditure/overheads), cumulative expenditure upto the reporting period and amount spent (direct or through implementing agency) refer Note 2 above.
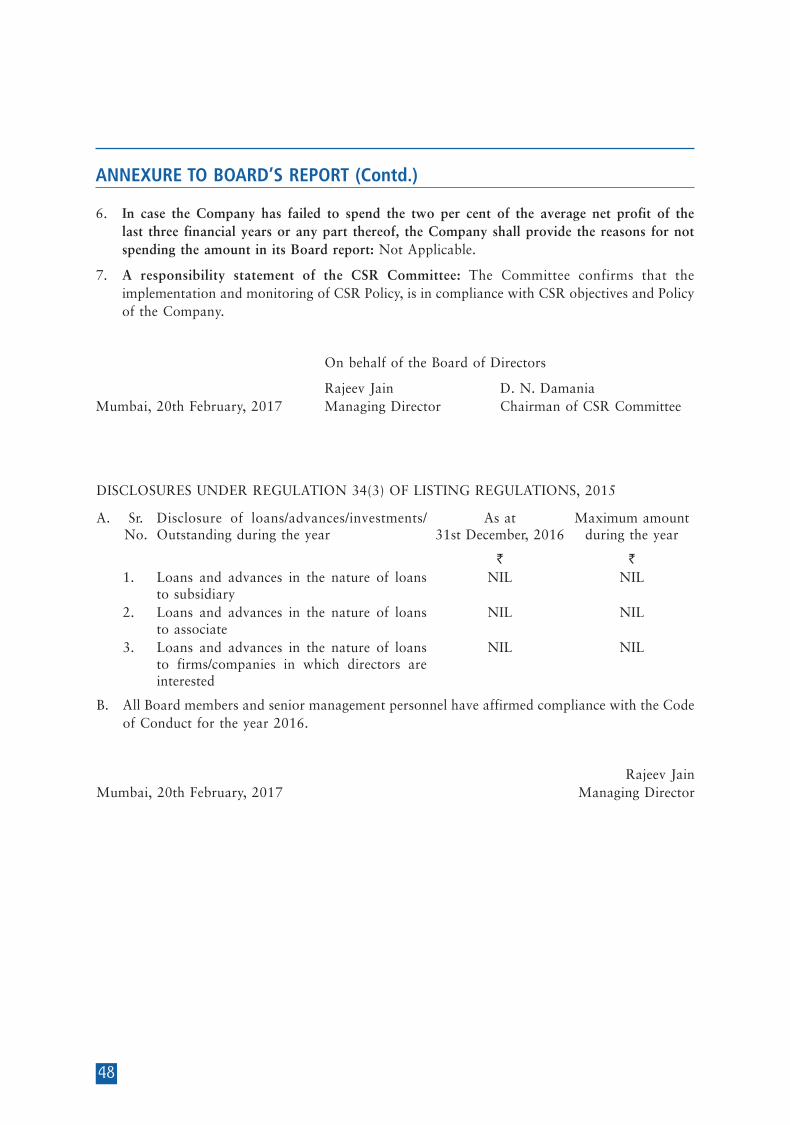
48
ANNEXURE TO BOARD’S REPORT (Contd.)
6. In case the Company has failed to spend the two per cent of the average net profit of the last three financial years or any part thereof, the Company shall provide the reasons for not spending the amount in its Board report: Not Applicable.
7. A responsibility statement of the CSR Committee: The Committee confirms that the implementation and monitoring of CSR Policy, is in compliance with CSR objectives and Policy of the Company.
On behalf of the Board of Directors
Rajeev Jain D. N. DamaniaMumbai, 20th February, 2017 Managing Director Chairman of CSR Committee
DISCLOSURES UNDER REGULATION 34(3) OF LISTING REGULATIONS, 2015
A. Sr. No.
Disclosure of loans/advances/investments/ Outstanding during the year
As at 31st December, 2016
`
Maximum amount during the year
`
1. Loans and advances in the nature of loans to subsidiary
NIL NIL
2. Loans and advances in the nature of loans to associate
NIL NIL
3. Loans and advances in the nature of loans to firms/companies in which directors are interested
NIL NIL
B. All Board members and senior management personnel have affirmed compliance with the Code of Conduct for the year 2016.
Rajeev JainMumbai, 20th February, 2017 Managing Director


49
INDEPENDENT AUDITOR’S REPORT
To The Members Of KSB PUMPS LIMITED
Report on the Standalone Financial Statements
We have audited the accompanying standalone financial statements of KSB PUMPS LIMITED (“the Company”), which comprise the Balance Sheet as at 31st December, 2016, the Statement of Profit and Loss and the Cash Flow Statement for the year then ended, and a summary of the significant accounting policies and other explanatory information.
Management’s Responsibility for the Standalone Financial Statements
The Company’s Board of Directors is responsible for the matters stated in Section 134(5) of the Companies Act, 2013 (“the Act”) with respect to the preparation of these standalone financial statements that give a true and fair view of the financial position, financial performance and cash flows of the Company in accordance with the accounting principles generally accepted in India, including the Accounting Standards prescribed under section 133 of the Act, as applicable.
This responsibility also includes maintenance of adequate accounting records in accordance with the provisions of the Act for safeguarding the assets of the Company and for preventing and detecting frauds and other irregularities; selection and application of appropriate accounting policies; making judgments and estimates that are reasonable and prudent; and design, implementation and maintenance of adequate internal financial controls, that were operating effectively for ensuring the accuracy and completeness of the accounting records, relevant to the preparation and presentation of the financial statements that give a true and fair view and are free from material misstatement, whether due to fraud or error.
Auditor’s Responsibility
Our responsibility is to express an opinion on these standalone financial statements based on our audit.
We have taken into account the provisions of the Act, the accounting and auditing standards and matters which are required to be included in the audit report under the provisions of the Act and the Rules made thereunder and the Order under section 143 (11) of the Act.
We conducted our audit of the standalone financial statements in accordance with the Standards on Auditing specified under Section 143(10) of the Act. Those Standards require that we comply with ethical requirements and plan and perform the audit to obtain reasonable assurance about whether the financial statements are free from material misstatement.
An audit involves performing procedures to obtain audit evidence about the amounts and the disclosures in the financial statements. The procedures selected depend on the auditor’s judgment, including the assessment of the risks of material misstatement of the financial statements, whether due to fraud or error. In making those risk assessments, the Auditor considers internal financial control relevant to the Company’s preparation of the financial statements that give a true and fair view in order to design audit procedures that are appropriate in the circumstances. An audit also includes evaluating the appropriateness of the accounting policies used and the reasonableness of the accounting estimates made by the Company’s Directors, as well as evaluating the overall presentation of the financial statements.
We believe that the audit evidence we have obtained is sufficient and appropriate to provide a basis for our audit opinion on the standalone financial statements.
Opinion
In our opinion and to the best of our information and according to the explanations given to us, the aforesaid standalone financial statements give the information required by the Act in the manner so required and give a true and fair view in conformity with the accounting principles
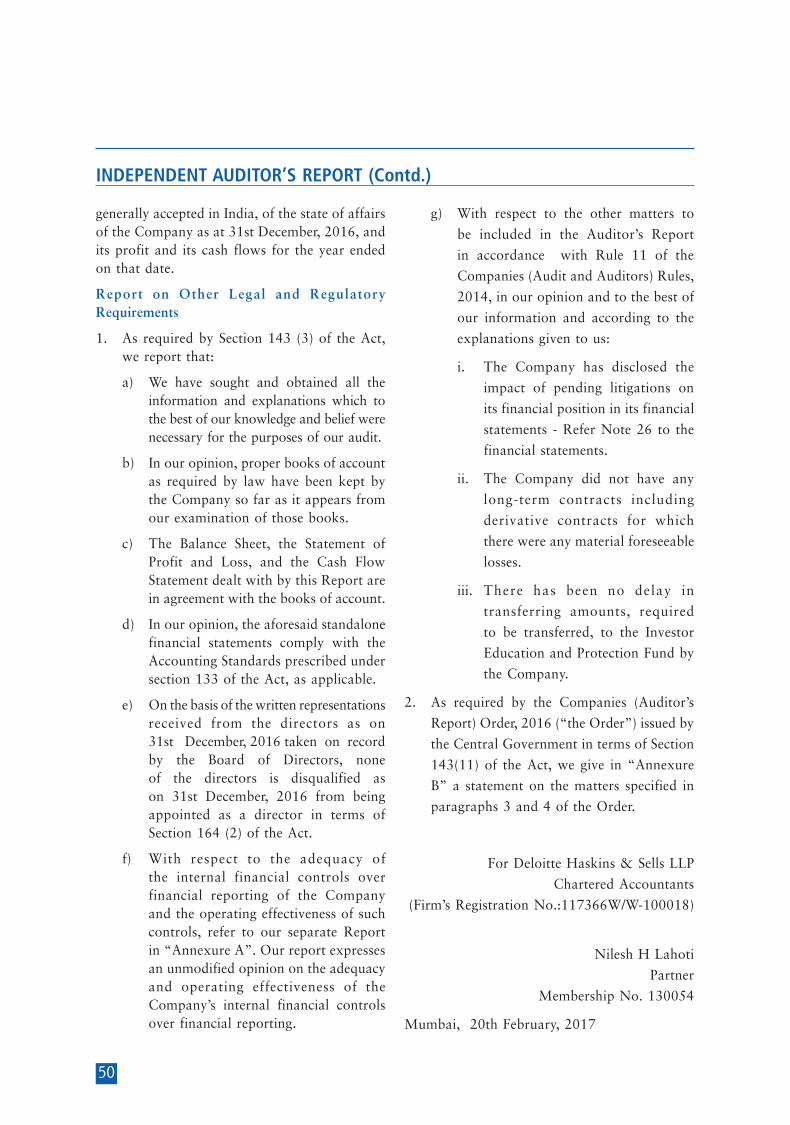
50
INDEPENDENT AUDITOR’S REPORT (Contd.)
generally accepted in India, of the state of affairs of the Company as at 31st December, 2016, and its profit and its cash flows for the year ended on that date.
Report on Other Legal and Regulatory Requirements
1. As required by Section 143 (3) of the Act, we report that:
a) We have sought and obtained all the information and explanations which to the best of our knowledge and belief were necessary for the purposes of our audit.
b) In our opinion, proper books of account as required by law have been kept by the Company so far as it appears from our examination of those books.
c) The Balance Sheet, the Statement of Profit and Loss, and the Cash Flow Statement dealt with by this Report are in agreement with the books of account.
d) In our opinion, the aforesaid standalone financial statements comply with the Accounting Standards prescribed under section 133 of the Act, as applicable.
e) On the basis of the written representations received from the directors as on 31st December, 2016 taken on record by the Board of Directors, none of the directors is disqualified as on 31st December, 2016 from being appointed as a director in terms of Section 164 (2) of the Act.
f) With respect to the adequacy of the internal financial controls over financial reporting of the Company and the operating effectiveness of such controls, refer to our separate Report in “Annexure A”. Our report expresses an unmodified opinion on the adequacy and operating effectiveness of the Company’s internal financial controls over financial reporting.
g) With respect to the other matters to
be included in the Auditor’s Report
in accordance with Rule 11 of the
Companies (Audit and Auditors) Rules,
2014, in our opinion and to the best of
our information and according to the
explanations given to us:
i. The Company has disclosed the
impact of pending litigations on
its financial position in its financial
statements - Refer Note 26 to the
financial statements.
ii. The Company did not have any
long-term contracts including
derivative contracts for which
there were any material foreseeable
losses.
iii. There has been no delay in
transferring amounts, required
to be transferred, to the Investor
Education and Protection Fund by
the Company.
2. As required by the Companies (Auditor’s
Report) Order, 2016 (“the Order”) issued by
the Central Government in terms of Section
143(11) of the Act, we give in “Annexure
B” a statement on the matters specified in
paragraphs 3 and 4 of the Order.
For Deloitte Haskins & Sells LLP
Chartered Accountants
(Firm’s Registration No.:117366W/W-100018)
Nilesh H Lahoti
Partner
Membership No. 130054
Mumbai, 20th February, 2017

51
ANNEXURE TO THE INDEPENDENT AUDITOR’S REPORT
ANNEXURE “A” TO THE INDEPENDENT AUDITOR’S REPORT
(Referred to in paragraph 1(f) under ‘Report on Other Legal and Regulatory Requirements’ of our report of even date)
Report on the Internal Financial Controls Over Financial Reporting under Clause (i) of Sub-section 3 of Section 143 of the Companies Act, 2013 (“the Act”)
We have audited the internal financial controls over financial reporting of the Company as of 31st December, 2016 in conjunction with our audit of the standalone financial statements of the Company for the year ended on that date.
Management’s Responsibility for Internal Financial Controls
The Company’s management is responsible for establishing and maintaining internal financial controls based on the internal control over financial reporting criteria established by the Company considering the essential components of internal control stated in the Guidance Note on Audit of Internal Financial Controls over Financial Reporting issued by the Institute of Chartered Accountants of India. These responsibilities include the design, implementation and maintenance of adequate internal financial controls that were operating effectively for ensuring the orderly and efficient conduct of its business, including adherence to company’s policies, the safeguarding of its assets, the prevention and detection of frauds and errors, the accuracy and completeness of the accounting records, and the timely preparation of reliable financial information, as required under the Companies Act, 2013.
Auditor’s Responsibility
Our responsibility is to express an opinion on the Company's internal financial controls over financial reporting based on our audit. We conducted our audit in accordance with the Guidance Note on Audit of Internal
Financial Controls Over Financial Reporting (the “Guidance Note”) issued by the Institute of Chartered Accountants of India and the Standards on Auditing prescribed under Section 143(10) of the Companies Act, 2013, to the extent applicable to an audit of internal financial controls. Those Standards and the Guidance Note require that we comply with ethical requirements and plan and perform the audit to obtain reasonable assurance about whether adequate internal financial controls over financial reporting was established and maintained and if such controls operated effectively in all material respects.
Our audit involves performing procedures to obtain audit evidence about the adequacy of the internal financial controls system over financial reporting and their operating effectiveness. Our audit of internal financial controls over financial reporting included obtaining an understanding of internal financial controls over financial reporting, assessing the risk that a material weakness exists, and testing and evaluating the design and operating effectiveness of internal control based on the assessed risk. The procedures selected depend on the auditor’s judgement, including the assessment of the risks of material misstatement of the financial statements, whether due to fraud or error.
We believe that the audit evidence we have obtained is sufficient and appropriate to provide a basis for our audit opinion on the Company’s internal financial controls system over financial reporting.
Meaning of Internal Financial Controls over Financial Reporting
A company's internal financial control over financial reporting is a process designed to provide reasonable assurance regarding the reliability of financial reporting and the preparation of financial statements for external purposes in accordance with generally accepted accounting principles. A company's internal financial control over financial reporting

52
ANNEXURE TO THE INDEPENDENT AUDITOR’S REPORT (Contd.)
includes those policies and procedures that (1) pertain to the maintenance of records that, in reasonable detail, accurately and fairly reflect the transactions and dispositions of the assets of the company; (2) provide reasonable assurance that transactions are recorded as necessary to permit preparation of financial statements in accordance with generally accepted accounting principles, and that receipts and expenditures of the company are being made only in accordance with authorisations of management and directors of the company; and (3) provide reasonable assurance regarding prevention or timely detection of unauthorised acquisition, use, or disposition of the company's assets that could have a material effect on the financial statements.
Inherent Limitations of Internal Financial Controls over Financial Reporting
Because of the inherent limitations of internal financial controls over financial reporting, including the possibility of collusion or improper management override of controls, material misstatements due to error or fraud may occur and not be detected. Also, projections of any evaluation of the internal financial controls over financial reporting to future periods are subject to the risk that the internal financial control over financial reporting may become inadequate because of changes in conditions, or
that the degree of compliance with the policies or procedures may deteriorate.
Opinion
In our opinion, to the best of our information and according to the explanations given to us, the Company has, in all material respects, an adequate internal financial controls system over financial reporting and such internal financial controls over financial reporting were operating effectively as at 31st December, 2016, based on the internal control over financial reporting criteria established by the Company considering the essential components of internal control stated in the Guidance Note on Audit of Internal Financial Controls Over Financial Reporting issued by the Institute of Chartered Accountants of India.
For Deloitte Haskins & Sells LLPChartered Accountants
(Firm’s Registration No.:117366W/W-100018)
Nilesh H LahotiPartner
Membership No. 130054
Mumbai, 20th February, 2017
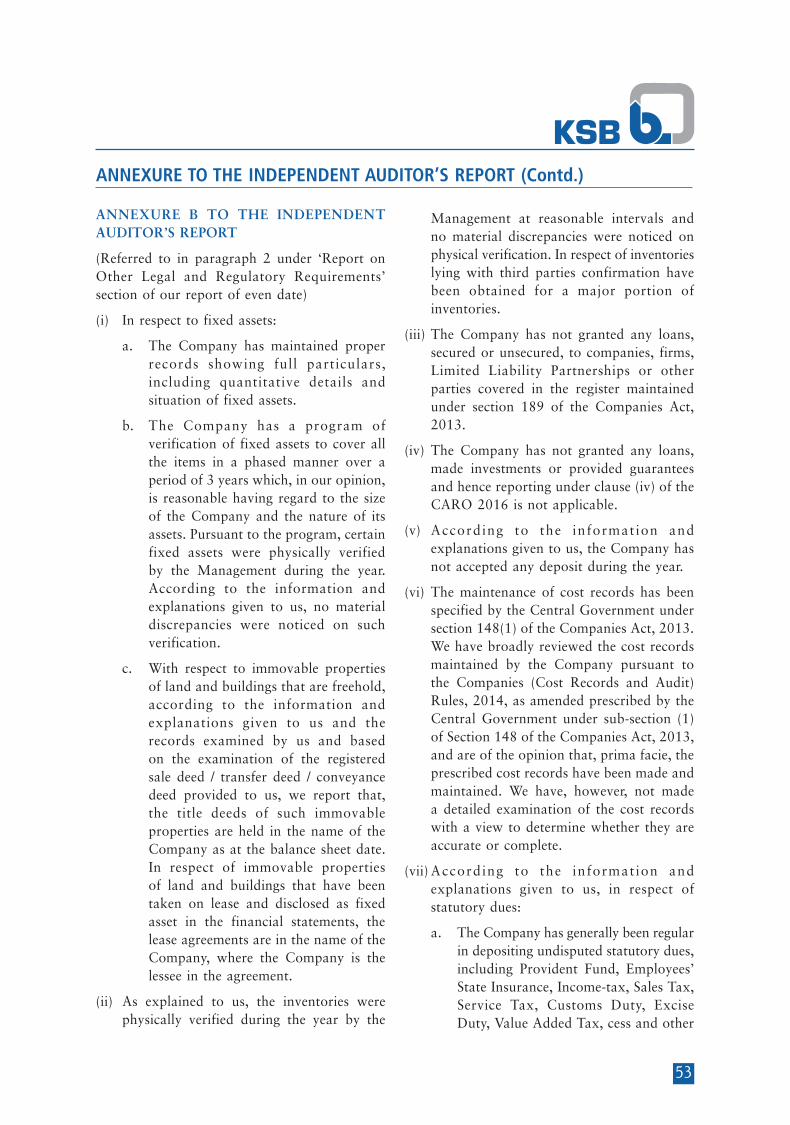
53
ANNEXURE TO THE INDEPENDENT AUDITOR’S REPORT (Contd.)
ANNEXURE B TO THE INDEPENDENT AUDITOR’S REPORT
(Referred to in paragraph 2 under ‘Report on Other Legal and Regulatory Requirements’ section of our report of even date)
(i) In respect to fixed assets:
a. The Company has maintained proper records showing full particulars, including quantitative details and situation of fixed assets.
b. The Company has a program of verification of fixed assets to cover all the items in a phased manner over a period of 3 years which, in our opinion, is reasonable having regard to the size of the Company and the nature of its assets. Pursuant to the program, certain fixed assets were physically verified by the Management during the year. According to the information and explanations given to us, no material discrepancies were noticed on such verification.
c. With respect to immovable properties of land and buildings that are freehold, according to the information and explanations given to us and the records examined by us and based on the examination of the registered sale deed / transfer deed / conveyance deed provided to us, we report that, the title deeds of such immovable properties are held in the name of the Company as at the balance sheet date. In respect of immovable properties of land and buildings that have been taken on lease and disclosed as fixed asset in the financial statements, the lease agreements are in the name of the Company, where the Company is the lessee in the agreement.
(ii) As explained to us, the inventories were physically verified during the year by the
Management at reasonable intervals and no material discrepancies were noticed on physical verification. In respect of inventories lying with third parties confirmation have been obtained for a major portion of inventories.
(iii) The Company has not granted any loans, secured or unsecured, to companies, firms, Limited Liability Partnerships or other parties covered in the register maintained under section 189 of the Companies Act, 2013.
(iv) The Company has not granted any loans, made investments or provided guarantees and hence reporting under clause (iv) of the CARO 2016 is not applicable.
(v) According to the information and explanations given to us, the Company has not accepted any deposit during the year.
(vi) The maintenance of cost records has been specified by the Central Government under section 148(1) of the Companies Act, 2013. We have broadly reviewed the cost records maintained by the Company pursuant to the Companies (Cost Records and Audit) Rules, 2014, as amended prescribed by the Central Government under sub-section (1) of Section 148 of the Companies Act, 2013, and are of the opinion that, prima facie, the prescribed cost records have been made and maintained. We have, however, not made a detailed examination of the cost records with a view to determine whether they are accurate or complete.
(vii) According to the information and explanations given to us, in respect of statutory dues:
a. The Company has generally been regular in depositing undisputed statutory dues, including Provident Fund, Employees’ State Insurance, Income-tax, Sales Tax, Service Tax, Customs Duty, Excise Duty, Value Added Tax, cess and other
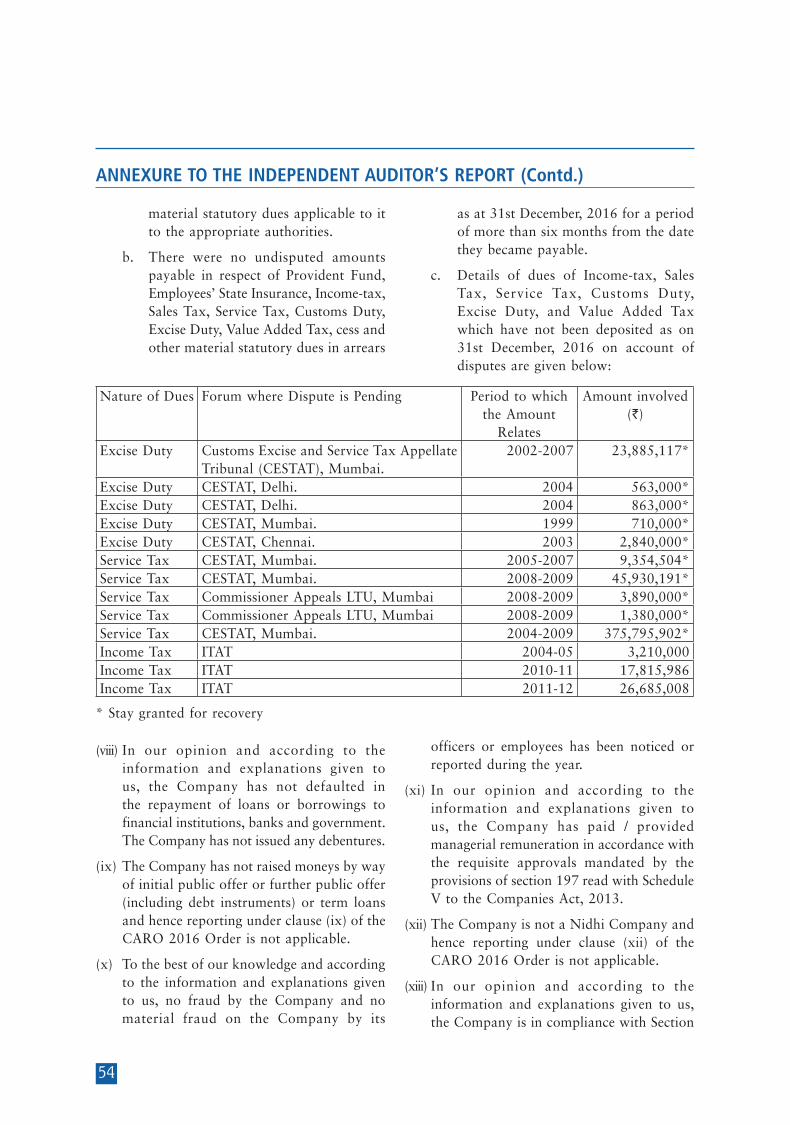
54
ANNEXURE TO THE INDEPENDENT AUDITOR’S REPORT (Contd.)
material statutory dues applicable to it to the appropriate authorities.
b. There were no undisputed amounts payable in respect of Provident Fund, Employees’ State Insurance, Income-tax, Sales Tax, Service Tax, Customs Duty, Excise Duty, Value Added Tax, cess and other material statutory dues in arrears
as at 31st December, 2016 for a period of more than six months from the date they became payable.
c. Details of dues of Income-tax, Sales Tax, Service Tax, Customs Duty, Excise Duty, and Value Added Tax which have not been deposited as on 31st December, 2016 on account of disputes are given below:
Nature of Dues Forum where Dispute is Pending Period to which the Amount
Relates
Amount involved (`)
Excise Duty Customs Excise and Service Tax Appellate Tribunal (CESTAT), Mumbai.
2002-2007 23,885,117*
Excise Duty CESTAT, Delhi. 2004 563,000*Excise Duty CESTAT, Delhi. 2004 863,000*Excise Duty CESTAT, Mumbai. 1999 710,000*Excise Duty CESTAT, Chennai. 2003 2,840,000*Service Tax CESTAT, Mumbai. 2005-2007 9,354,504*Service Tax CESTAT, Mumbai. 2008-2009 45,930,191*Service Tax Commissioner Appeals LTU, Mumbai 2008-2009 3,890,000*Service Tax Commissioner Appeals LTU, Mumbai 2008-2009 1,380,000*Service Tax CESTAT, Mumbai. 2004-2009 375,795,902*Income Tax ITAT 2004-05 3,210,000Income Tax ITAT 2010-11 17,815,986Income Tax ITAT 2011-12 26,685,008
* Stay granted for recovery
(viii) In our opinion and according to the information and explanations given to us, the Company has not defaulted in the repayment of loans or borrowings to financial institutions, banks and government. The Company has not issued any debentures.
(ix) The Company has not raised moneys by way of initial public offer or further public offer (including debt instruments) or term loans and hence reporting under clause (ix) of the CARO 2016 Order is not applicable.
(x) To the best of our knowledge and according to the information and explanations given to us, no fraud by the Company and no material fraud on the Company by its
officers or employees has been noticed or reported during the year.
(xi) In our opinion and according to the information and explanations given to us, the Company has paid / provided managerial remuneration in accordance with the requisite approvals mandated by the provisions of section 197 read with Schedule V to the Companies Act, 2013.
(xii) The Company is not a Nidhi Company and hence reporting under clause (xii) of the CARO 2016 Order is not applicable.
(xiii) In our opinion and according to the information and explanations given to us, the Company is in compliance with Section

55
ANNEXURE TO THE INDEPENDENT AUDITOR’S REPORT (Contd.)
177 and 188 of the Companies Act, 2013, where applicable, for all transactions with the related parties and the details of related party transactions have been disclosed in the financial statements etc. as required by the applicable accounting standards.
(xiv) During the year the Company has not made any preferential allotment or private placement of shares or fully or partly convertible debentures and hence reporting under clause (xiv) of CARO 2016 is not applicable to the Company.
(xv) In our opinion and according to the information and explanations given to us, during the year the Company has not entered into any non-cash transactions with its directors or directors of its holding,
subsidiary or associate company or persons connected with them and hence provisions of section 192 of the Companies Act, 2013, are not applicable.
(xvi) The Company is not required to be registered under section 45-I of the Reserve Bank of India Act, 1934.
For Deloitte Haskins & Sells LLPChartered Accountants
(Firm’s Registration No.:117366W/W-100018)
Nilesh H LahotiPartner
Membership No. 130054
Mumbai, 20th February, 2017

56
Balance Sheet as at 31st December, 2016
In terms of our report attached G. Swarup ChairmanFor Deloitte Haskins & Sells LLP A. R. BroachaChartered Accountants D. N. Damania
N. N. KampaniNilesh H Lahoti Verghese Oommen Pradip Shah Directors(Partner) Chief Financial Officer Dr. Stephan Bross
V. K. ViswanathanS. F. MotwaniW. Stegmuller
R. Narasimhan Rajeev Jain Managing Director Company Secretary
Mumbai, 20th February, 2017 Mumbai, 20th February, 2017
Particulars Note No.
As at 31st December, 2016
As at 31st December, 2015
` in Million ` in Million I EQUITY AND LIABILITIES (1) Shareholders’ funds
(a) Share capital 3 348.08 348.08 (b) Reserves and surplus 4 5,571.32 5,184.18
5,919.40 5,532.26 (2) Non-current liabilities
(a) Other long-term liabilities 5 75.42 70.42 (b) Long-term provisions 6 356.66 294.47
432.08 364.89 (3) Current liabilities
(a) Short-term borrowings 7 51.84 12.97 (b) Trade payables 8 Total outstanding dues of micro enterprises and
small enterprises 0.24 0.47
Others 1,725.11 1,545.53 (c) Other current liabilities 9 1,023.97 1,075.66 (d) Short-term provisions 10 446.56 479.08
3,247.72 3,113.71 TOTAL 9,599.20 9,010.86
II ASSETS (1) Non-current assets
(a) Fixed assets (i) Tangible assets 11.A 2,163.08 1,930.42 (ii) Intangible assets 11.B 23.22 10.12 (iii) Capital work-in-progress 164.95 142.18
2,351.25 2,082.72 (b) Non-current investments 12 63.15 63.15 (c) Deferred tax assets (net) 13 157.04 127.75 (d) Long-term loans and advances 14 703.78 492.43
3,275.22 2,766.05 (2) Current assets
(a) Inventories 15 2,118.63 1,826.41 (b) Trade receivables 16 1,797.31 1,771.09 (c) Cash and cash equivalents 17 1,973.81 2,252.39 (d) Short-term loans and advances 18 386.55 354.05 (e) Other current assets 19 47.68 40.87
6,323.98 6,244.81 TOTAL 9,599.20 9,010.86
See accompanying notes forming part of the financial statements
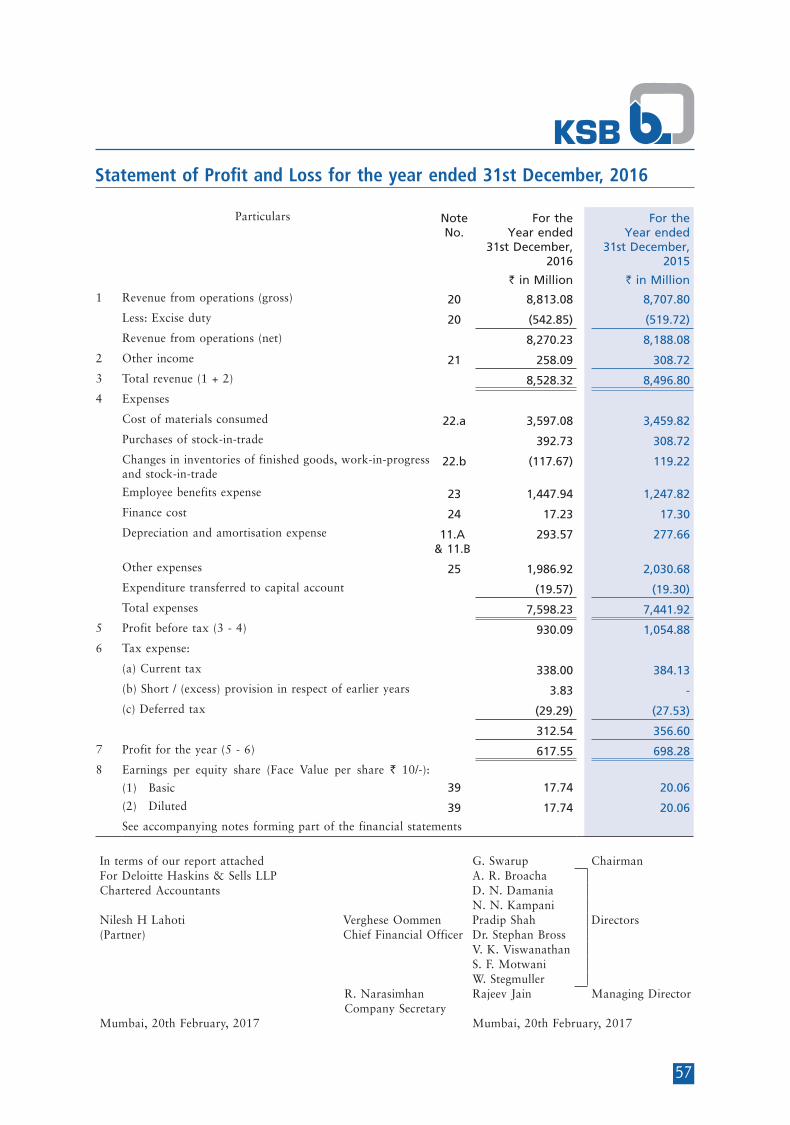
57
Statement of Profit and Loss for the year ended 31st December, 2016
In terms of our report attached G. Swarup ChairmanFor Deloitte Haskins & Sells LLP A. R. BroachaChartered Accountants D. N. Damania
N. N. KampaniNilesh H Lahoti Verghese Oommen Pradip Shah Directors(Partner) Chief Financial Officer Dr. Stephan Bross
V. K. ViswanathanS. F. MotwaniW. Stegmuller
R. Narasimhan Rajeev Jain Managing Director Company Secretary
Mumbai, 20th February, 2017 Mumbai, 20th February, 2017
Particulars Note No.
For the Year ended
31st December, 2016
For the Year ended
31st December, 2015
` in Million ` in Million
1 Revenue from operations (gross) 20 8,813.08 8,707.80
Less: Excise duty 20 (542.85) (519.72)
Revenue from operations (net) 8,270.23 8,188.08
2 Other income 21 258.09 308.72
3 Total revenue (1 + 2) 8,528.32 8,496.80
4 Expenses
Cost of materials consumed 22.a 3,597.08 3,459.82
Purchases of stock-in-trade 392.73 308.72
Changes in inventories of finished goods, work-in-progress and stock-in-trade
22.b (117.67) 119.22
Employee benefits expense 23 1,447.94 1,247.82
Finance cost 24 17.23 17.30
Depreciation and amortisation expense 11.A & 11.B
293.57 277.66
Other expenses 25 1,986.92 2,030.68
Expenditure transferred to capital account (19.57) (19.30)
Total expenses 7,598.23 7,441.92
5 Profit before tax (3 - 4) 930.09 1,054.88
6 Tax expense:
(a) Current tax 338.00 384.13
(b) Short / (excess) provision in respect of earlier years 3.83 -
(c) Deferred tax (29.29) (27.53)
312.54 356.60
7 Profit for the year (5 - 6) 617.55 698.28
8 Earnings per equity share (Face Value per share ` 10/-):
(1) Basic 39 17.74 20.06
(2) Diluted 39 17.74 20.06
See accompanying notes forming part of the financial statements

58
Cash Flow Statement for the year ended 31st December, 2016
Particulars For the Year ended 31st December, 2016
For the Year ended 31st December, 2015
` in Million ` in Million ` in Million ` in Million A. Cash flow from operating activities
Net Profit / (Loss) before tax 930.09 1,054.88 Adjustments for:
Depreciation and amortisation expense 293.57 277.66 (Profit) / loss on sale / disposal / write off of fixed assets (1.64) (4.16)Finance cost 17.23 17.30 Interest income (164.57) (163.50)Income from Trade investements (non-current) (22.05) (71.24)Mark to market loss on derivative contracts (3.66) 3.66 Sundry credit balances & provisions no longer required, written back
(37.56) (50.07)
Unrealised exchange (gain) / loss 1.63 (1.86)
82.95 7.79 Operating profit / (loss) before working capital
changes1,013.04 1,062.67
Adjustment for changes in working capital:
(Increase) / decrease in operating assets:
Inventories (292.22) 191.31 Trade receivables (26.22) 8.97 Short-term loans and advances (32.50) (28.70)Long-term loans and advances 8.01 92.43 Increase / (decrease) in operating liabilities:
Trade payables 216.91 58.82 Other current liabilities (37.88) (24.90)Other long-term liabilities 5.00 3.75 Short-term provisions 26.97 30.62 Long-term provisions 62.19 (1.43)
(69.74) 330.87 Cash generated from operations 943.30 1,393.54 Direct taxes paid (395.48) (281.07)Net cash flow from / (used in) operating activities (A) 547.82 1,112.47
B. Cash flow from investing activities
Purchase of Fixed Assets (798.18) (369.52)Proceeds from sale of fixed assets 2.11 4.97 Bank balances not considered as Cash and cash equivalents 20.23 (219.60)Interest received 157.76 180.94 Income from Trade investements (non-current) 22.05 71.24 Net cash flow from / (used in) investing activities (B) (596.03) (331.97)
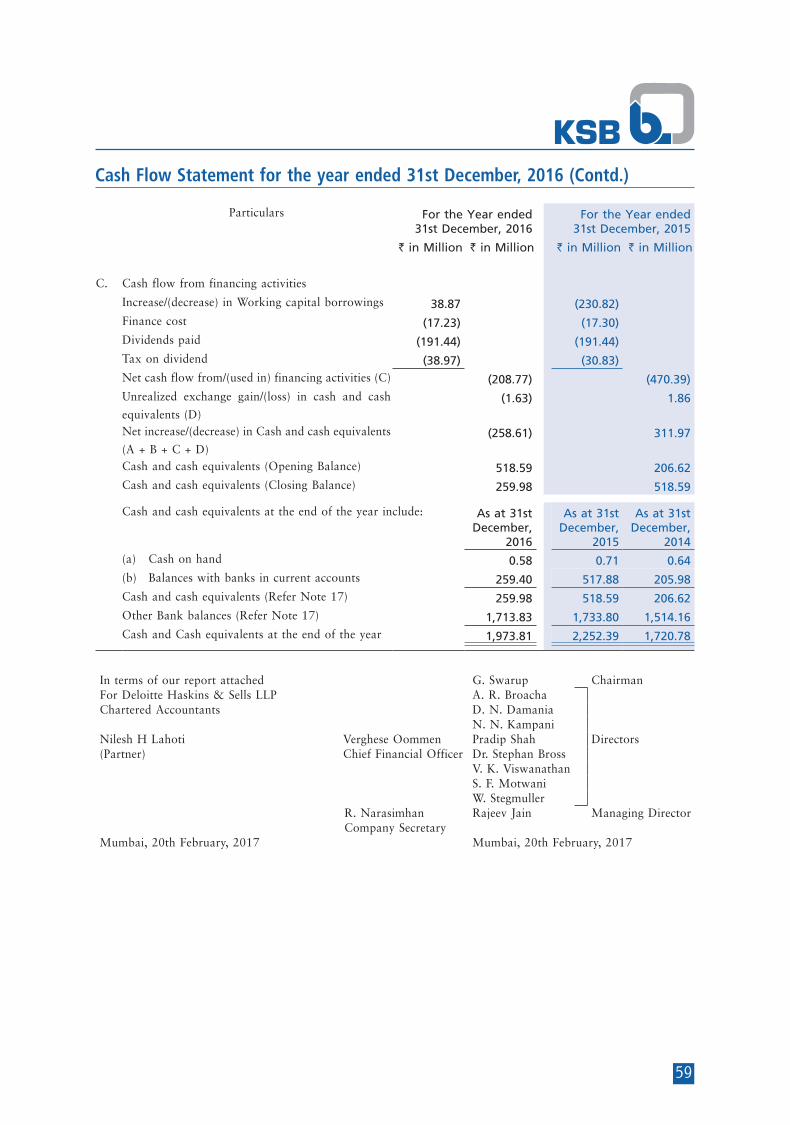
59
Cash Flow Statement for the year ended 31st December, 2016 (Contd.)
Particulars For the Year ended 31st December, 2016
For the Year ended 31st December, 2015
` in Million ` in Million ` in Million ` in Million
C. Cash flow from financing activities
Increase/(decrease) in Working capital borrowings 38.87 (230.82)Finance cost (17.23) (17.30)Dividends paid (191.44) (191.44)Tax on dividend (38.97) (30.83)Net cash flow from/(used in) financing activities (C) (208.77) (470.39)Unrealized exchange gain/(loss) in cash and cash
equivalents (D)(1.63) 1.86
Net increase/(decrease) in Cash and cash equivalents
(A + B + C + D)(258.61) 311.97
Cash and cash equivalents (Opening Balance) 518.59 206.62 Cash and cash equivalents (Closing Balance) 259.98 518.59
Cash and cash equivalents at the end of the year include: As at 31st December,
2016
As at 31st December,
2015
As at 31st December,
2014 (a) Cash on hand 0.58 0.71 0.64 (b) Balances with banks in current accounts 259.40 517.88 205.98 Cash and cash equivalents (Refer Note 17) 259.98 518.59 206.62 Other Bank balances (Refer Note 17) 1,713.83 1,733.80 1,514.16 Cash and Cash equivalents at the end of the year 1,973.81 2,252.39 1,720.78
In terms of our report attached G. Swarup ChairmanFor Deloitte Haskins & Sells LLP A. R. BroachaChartered Accountants D. N. Damania
N. N. KampaniNilesh H Lahoti Verghese Oommen Pradip Shah Directors(Partner) Chief Financial Officer Dr. Stephan Bross
V. K. ViswanathanS. F. MotwaniW. Stegmuller
R. Narasimhan Rajeev Jain Managing Director Company Secretary
Mumbai, 20th February, 2017 Mumbai, 20th February, 2017

60
Notes forming part of the financial statements
1 Company OverviewProducts:The Company is engaged in the business of manufacture of different types of power driven pumps and industrial valves. Castings are mainly produced for captive consumption. Operations:The Company has factories at the following places:-A) Irrigation and Process Pumps Division (I.P.D.) at Pimpri Manufacturing of submersible pumps, vertical and horizontal pumps, series and non-series pumps,
Multistage pumps, chemical process pumps, non clog pumps and water pumps.B) Power Projects Division (P.P.D.) at Chinchwad Manufacturing of primary heat transfer pumps, moderator pumps, main boiler feed pumps and
multistage condense extraction pumps, re-heater drain pumps and auxiliary boiler feed pumps. C) Foundry Division at Vambhori Manufacturing of steel & iron castings including for captive consumption. D) Coimbatore Unit Manufacturing of valves (Globe, Gate, Check, Butterfly & Ball valves).E) Nasik Unit (Sinnar) Established in 1995, this unit is engaged in the manufacture of high pressure and submersible pumps.
2 Significant accounting policies2.1 Fixed assets and depreciation / amortisation:
(a) Fixed assets are stated at cost of acquisition or construction less depreciation/amortisation. Cost comprises the purchase price and other attributable costs on making the assets ready for its intended use.
(b) Depreciation / amortisation on fixed assets: i) Depreciation is provided on the Straight Line Method (SLM)/Written down value (WDV) method
over the useful lives of assets which has been assessed as under based on technical advice, taking into account the nature of the asset, the estimated usage of the asset, the operating conditions of the asset, past history of replacement, maintenance support, etc. Taking into account these factors, the Company has decided to retain the useful life hitherto adopted for various catagories of fixed assets, which are different from those prescribed in Schedule II to the Companies Act, 2013 (Act) except for server and networking (SLM), electrical installation (SLM) and furniture and fixtures (WDV) which are same as prescribed in Schedule II to the Act. Estimated useful lives of assets are as follows -
Buildings - 43 to 90 years (WDV) Plant and Machinery - 09 to 21 years (SLM) Vehicles - 05 to 11 years (WDV) Office Equipments - 10 years (SLM) Computer Equipments - 06 years (SLM) Leasehold land and assets taken on lease are amortised over the period of the lease. ii) Intangible assets are amortised on the straight line method as follows : Rights, techniques, Process and Know-how - 7 to 10 years Software - 3 years
2.2 InvestmentsLong-term Investments are valued at cost of acquisition and related expenses. Provision is made for other than temporary diminution, if any, in the value of such investments.
2.3 InventoriesInventories are stated at the lower of cost and net realisable value. In determining the cost of raw materials, components, stores, spares and loose tools the weighted average method is used.Costs of work-in-progress and manufactured finished products include material costs, labour and factory overheads on the basis of full absorption costing.
2.4 Trade receivables and advancesSpecific debts and advances identified as irrecoverable or doubtful are written-off or provided for, respectively.
2.5 Foreign exchange transactions and translationsTransactions in foreign currencies are recorded at the exchange rates prevailing on the date of the transaction. Realised gains and losses as also exchange differences arising on translation at year end exchange rates of monetory assets and liabilities outstanding at the end of the year are recognised in the Statement of Profit and Loss. Premium/Discount in respect of Forward Contracts is accounted for over the period of contract.
2.6 Revenue Recognition(i) Sales of goods is recognised when all significant risks and rewards of ownership have been transferred
to the buyers. (ii) Dividend income from investments is recognised when the owner’s right to receive the payment is
established. (iii) Income from services rendered is accounted for when the work is performed.

61
Notes forming part of the financial statements (Contd.)
2.7 Employee BenefitsEmployee benefits includes gratuity, superannuation and provident fund and leave encashment benefits under the approved schemes of the Company. In respect of defined contribution plans, the contribution payable for the year is charged to the Statement of Profit and Loss.In respect of defined benefit plans and other long term employee benefits, the employee benefit costs is accounted for based on an actuarial valuation during the year.
2.8 Product WarrantyCost of product warranties is disclosed under the head: (i) ‘raw materials and components consumed’ as consists of free replacement of spares.(ii) ‘miscellaneous expenses’ which includes provision for warranties.
2.9 Taxes on Income Tax expense for the year is included in the determination of the net profit for the year.Deferred tax is recognised on all timing differences, subject to consideration of prudence in respect of deferred tax assets. Deferred tax is measured using the tax rates and the tax laws enacted or substantively enacted as at the reporting date.
2.10 LeasesAssets acquired under finance leases are recognised at the lower of the fair value of the leased assets at inception of the lease and the present value of minimum lease payments. Lease payments are apportioned between the finance charge and the reduction of the outstanding liability. The finance charge is allocated to periods during the lease term at a constant periodic rate of interest on the remaining balance of the liability.Lease arrangements where the risks and rewards incidental to ownership of an asset substantially vest with the lessor are recognised as operating leases. Lease rentals under operating leases are recognised in the Statement of Profit and Loss on a straight-line basis.
2.11 Borrowing CostsBorrowing costs that are directly attributable to the acquisition, construction or production of a qualifying asset are capitalised as part of the cost of that asset. Other borrowing costs are recognised as an expense in the year in which they are incurred.
2.12 Cash Flow StatementThe Cash Flow statement is prepared by the indirect method and presents cash flows by operating, investing and financing activities of the Company.
2.13 Use of EstimatesThe preparation of the financial statements in conformity with the generally accepted accounting principles requires estimates and assumptions to be made that affect the reported amount of assets and liabilities on the date of the financial statements and the reported amount of revenues and expenses during the reporting year. Difference between the actual result and estimates are recognized in the year in which the results are known/materialized.
2.14 Provisions, Contingent Liabilities and Contingent AssetsThe Company recognizes provisions only when it has a present obligation as a result of a past event, it is probable that an outflow of resources embodying economic benefits will be required to settle the obligation and when a reliable estimate of the amount of the obligation can be made. No provision is recognised for: (i) Any possible obligation that arises from past events and the existence of which will be confirmed only
by the occurrence or non-occurrence of one or more uncertain future events not wholly within the control of the Company; or
(ii) Any present obligation that arises from past events but is not recognized because- - It is not probable that an outflow of resources embodying economic benefits will be required to
settle the obligation; or - A reliable estimate of the amount of obligation cannot be made. Such obligations are recorded as Contingent Liabilities. These are assessed continually and only that part of the obligation for which an outflow of resources embodying economic benefits is probable, is provided for, except in the extremely rare circumstances where no reliable estimate can be made.Contingent Assets are not recognized in the financial statements since this may result in the recognition of income that may never be realized.
2.15 Earnings per shareBasic earnings per share is computed by dividing the profit attributable to equity shareholders for the year by the weighted average number of Equity shares outstanding during the year. Diluted earnings per share is computed by dividing the profit attributable to equity shareholders for the year as adjusted for dividend, interest and other charges to expenses or income (net of taxes) relating to the diluted potential equity shares, by the weighted average number of equity shares outstanding during the year as adjusted for the effects of all diluted potential equity shares except where the results are anti-dilutive.
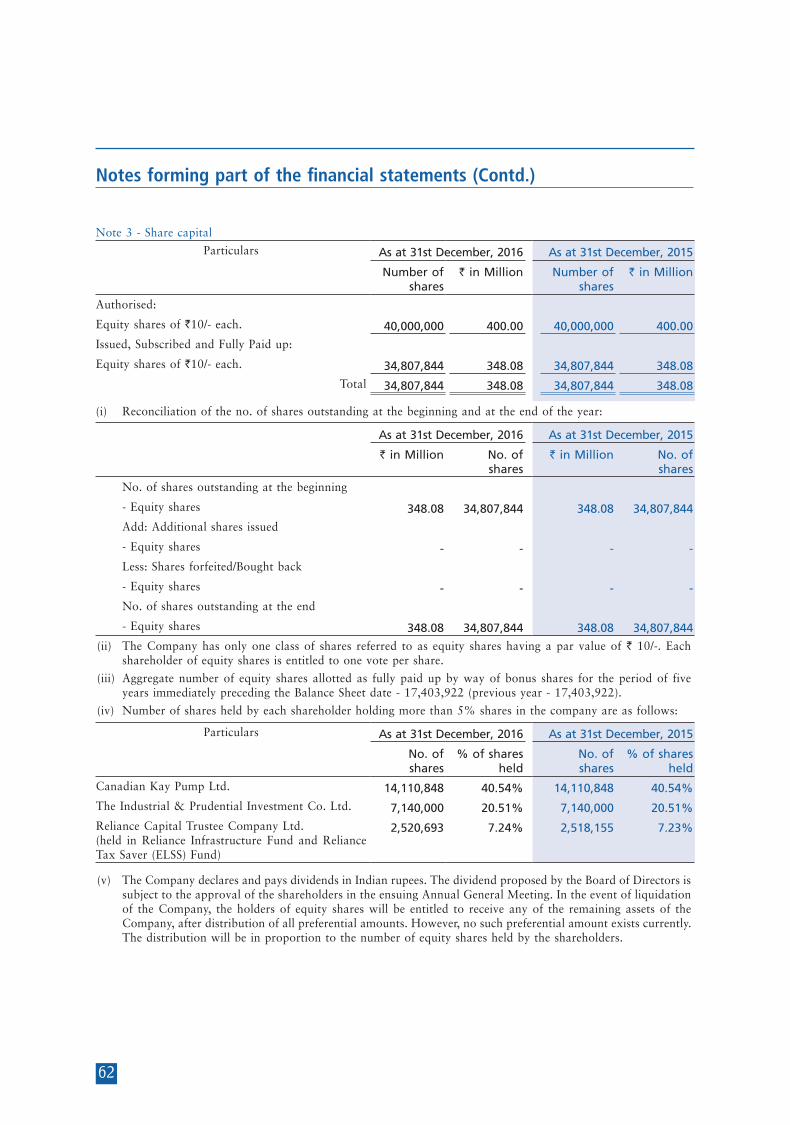
62
Notes forming part of the financial statements (Contd.)
Note 3 - Share capital
Particulars As at 31st December, 2016 As at 31st December, 2015
Number of shares
` in Million Number of shares
` in Million
Authorised:
Equity shares of `10/- each. 40,000,000 400.00 40,000,000 400.00
Issued, Subscribed and Fully Paid up:
Equity shares of `10/- each. 34,807,844 348.08 34,807,844 348.08
Total 34,807,844 348.08 34,807,844 348.08
(i) Reconciliation of the no. of shares outstanding at the beginning and at the end of the year:
As at 31st December, 2016 As at 31st December, 2015
` in Million No. of shares
` in Million No. of shares
No. of shares outstanding at the beginning
- Equity shares 348.08 34,807,844 348.08 34,807,844
Add: Additional shares issued
- Equity shares - - - -
Less: Shares forfeited/Bought back
- Equity shares - - - -
No. of shares outstanding at the end
- Equity shares 348.08 34,807,844 348.08 34,807,844
(ii) The Company has only one class of shares referred to as equity shares having a par value of ` 10/-. Each shareholder of equity shares is entitled to one vote per share.
(iii) Aggregate number of equity shares allotted as fully paid up by way of bonus shares for the period of five years immediately preceding the Balance Sheet date - 17,403,922 (previous year - 17,403,922).
(iv) Number of shares held by each shareholder holding more than 5% shares in the company are as follows:
Particulars As at 31st December, 2016 As at 31st December, 2015
No. of shares
% of shares held
No. of shares
% of shares held
Canadian Kay Pump Ltd. 14,110,848 40.54% 14,110,848 40.54%
The Industrial & Prudential Investment Co. Ltd. 7,140,000 20.51% 7,140,000 20.51%
Reliance Capital Trustee Company Ltd.(held in Reliance Infrastructure Fund and Reliance Tax Saver (ELSS) Fund)
2,520,693 7.24% 2,518,155 7.23%
(v) The Company declares and pays dividends in Indian rupees. The dividend proposed by the Board of Directors is subject to the approval of the shareholders in the ensuing Annual General Meeting. In the event of liquidation of the Company, the holders of equity shares will be entitled to receive any of the remaining assets of the Company, after distribution of all preferential amounts. However, no such preferential amount exists currently. The distribution will be in proportion to the number of equity shares held by the shareholders.
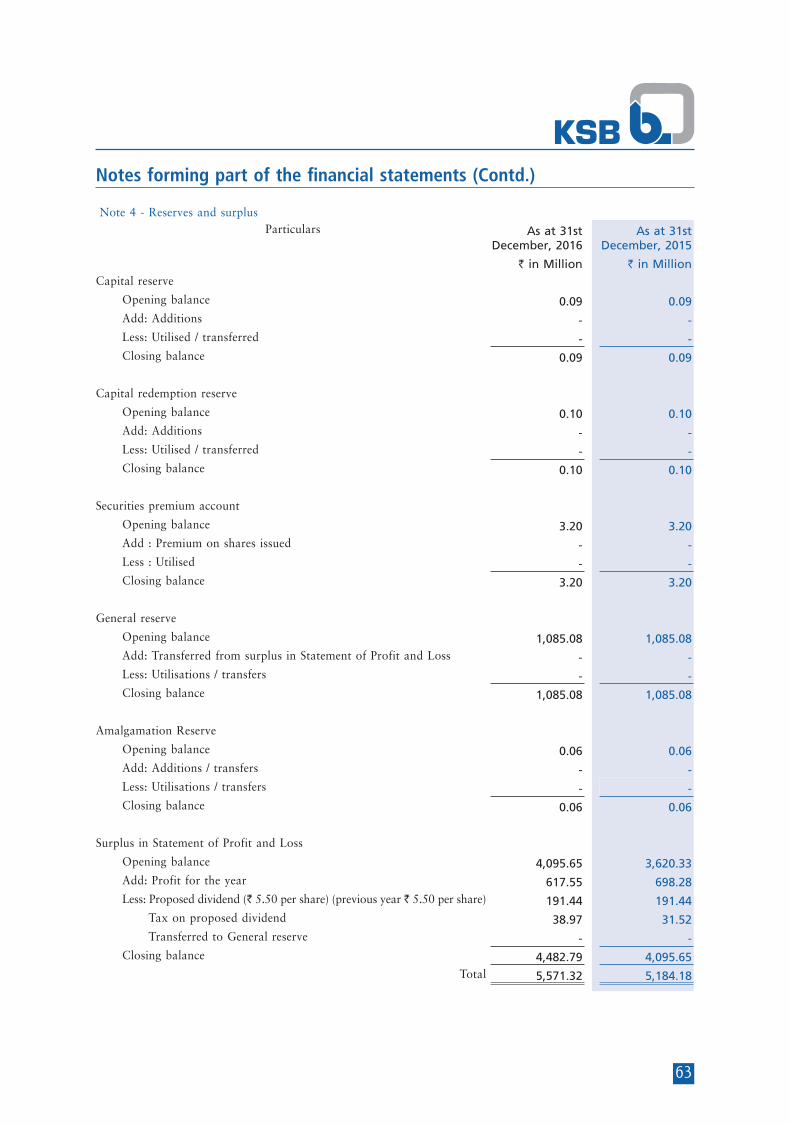
63
Notes forming part of the financial statements (Contd.)
Note 4 - Reserves and surplus Particulars As at 31st
December, 2016 As at 31st
December, 2015
` in Million ` in MillionCapital reserve
Opening balance 0.09 0.09 Add: Additions - - Less: Utilised / transferred - - Closing balance 0.09 0.09
Capital redemption reserve
Opening balance 0.10 0.10 Add: Additions - - Less: Utilised / transferred - - Closing balance 0.10 0.10
Securities premium account
Opening balance 3.20 3.20 Add : Premium on shares issued - - Less : Utilised - - Closing balance 3.20 3.20
General reserve
Opening balance 1,085.08 1,085.08 Add: Transferred from surplus in Statement of Profit and Loss - - Less: Utilisations / transfers - - Closing balance 1,085.08 1,085.08
Amalgamation Reserve
Opening balance 0.06 0.06 Add: Additions / transfers - - Less: Utilisations / transfers - - Closing balance 0.06 0.06
Surplus in Statement of Profit and Loss
Opening balance 4,095.65 3,620.33 Add: Profit for the year 617.55 698.28 Less: Proposed dividend (` 5.50 per share) (previous year ` 5.50 per share) 191.44 191.44
Tax on proposed dividend 38.97 31.52 Transferred to General reserve - -
Closing balance 4,482.79 4,095.65 Total 5,571.32 5,184.18
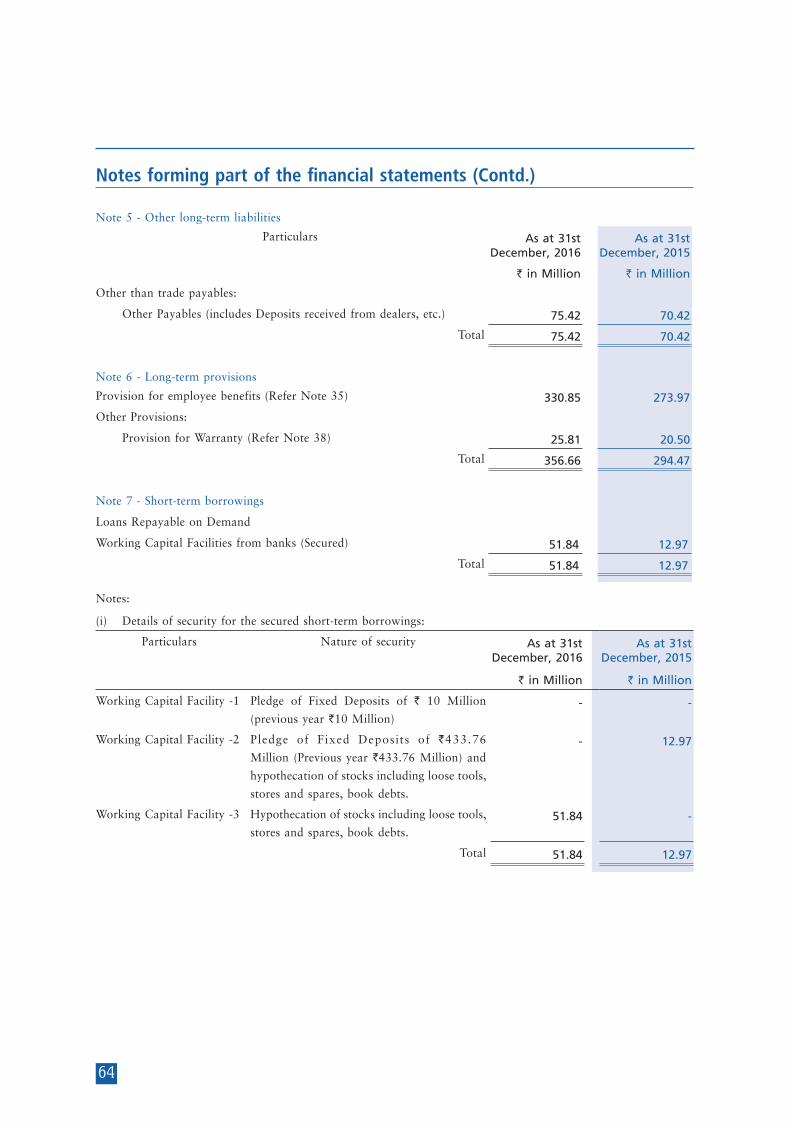
64
Notes forming part of the financial statements (Contd.)
Note 5 - Other long-term liabilities
Particulars As at 31st December, 2016
As at 31st December, 2015
` in Million ` in Million
Other than trade payables:
Other Payables (includes Deposits received from dealers, etc.) 75.42 70.42
Total 75.42 70.42
Note 6 - Long-term provisions
Provision for employee benefits (Refer Note 35) 330.85 273.97
Other Provisions:
Provision for Warranty (Refer Note 38) 25.81 20.50
Total 356.66 294.47
Note 7 - Short-term borrowings
Loans Repayable on Demand
Working Capital Facilities from banks (Secured) 51.84 12.97
Total 51.84 12.97
Notes:
(i) Details of security for the secured short-term borrowings:
Particulars Nature of security As at 31st December, 2016
As at 31st December, 2015
` in Million ` in Million
Working Capital Facility -1 Pledge of Fixed Deposits of ` 10 Million
(previous year `10 Million) - -
Working Capital Facility -2 Pledge of Fixed Deposits of `433.76
Million (Previous year `433.76 Million) and
hypothecation of stocks including loose tools,
stores and spares, book debts.
- 12.97
Working Capital Facility -3 Hypothecation of stocks including loose tools,
stores and spares, book debts. 51.84 -
Total 51.84 12.97
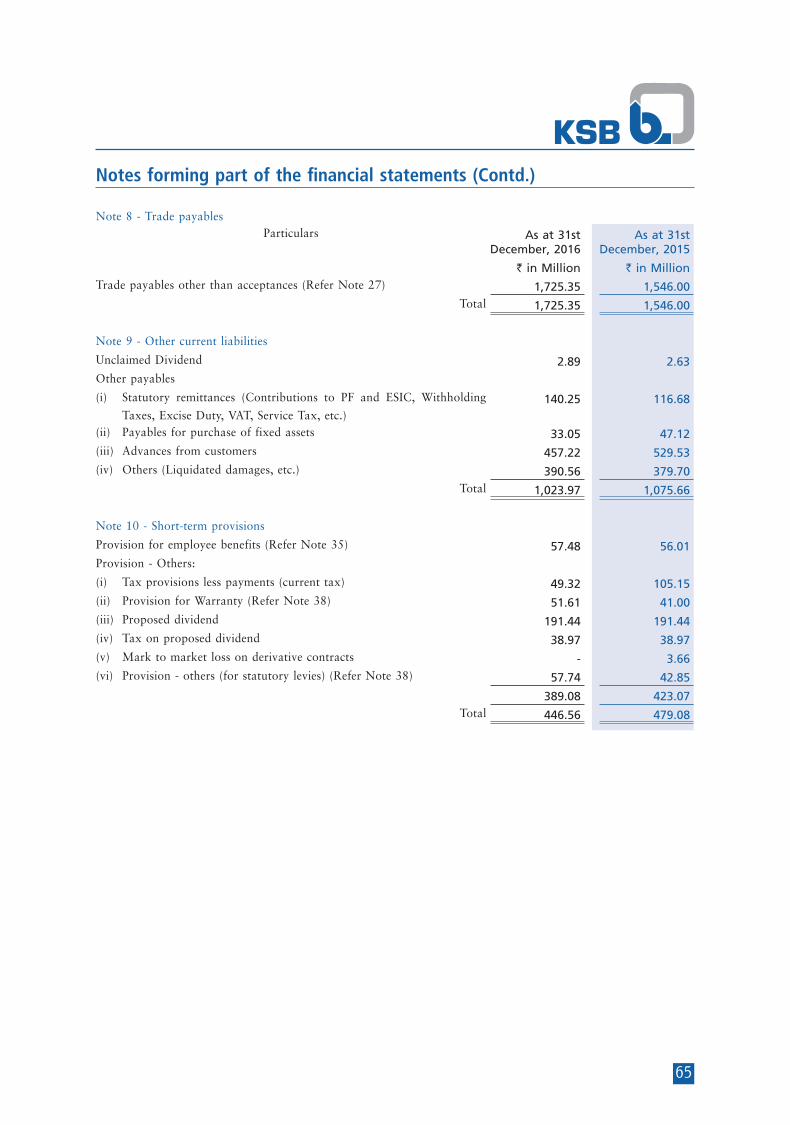
65
Notes forming part of the financial statements (Contd.)
Note 8 - Trade payables Particulars As at 31st
December, 2016As at 31st
December, 2015
` in Million ` in MillionTrade payables other than acceptances (Refer Note 27) 1,725.35 1,546.00
Total 1,725.35 1,546.00
Note 9 - Other current liabilities
Unclaimed Dividend 2.89 2.63 Other payables
(i) Statutory remittances (Contributions to PF and ESIC, Withholding
Taxes, Excise Duty, VAT, Service Tax, etc.) 140.25 116.68
(ii) Payables for purchase of fixed assets 33.05 47.12 (iii) Advances from customers 457.22 529.53 (iv) Others (Liquidated damages, etc.) 390.56 379.70
Total 1,023.97 1,075.66
Note 10 - Short-term provisions
Provision for employee benefits (Refer Note 35) 57.48 56.01 Provision - Others:
(i) Tax provisions less payments (current tax) 49.32 105.15 (ii) Provision for Warranty (Refer Note 38) 51.61 41.00 (iii) Proposed dividend 191.44 191.44 (iv) Tax on proposed dividend 38.97 38.97 (v) Mark to market loss on derivative contracts - 3.66 (vi) Provision - others (for statutory levies) (Refer Note 38) 57.74 42.85
389.08 423.07 Total 446.56 479.08
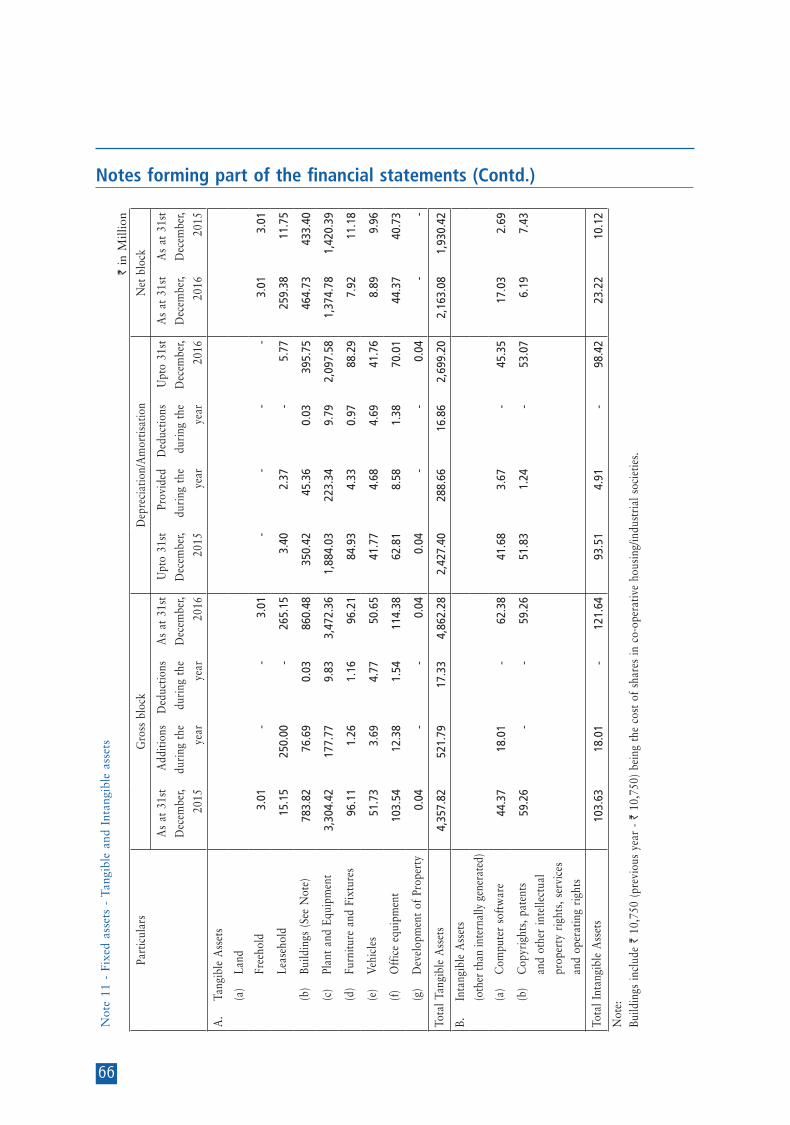
66
Notes forming part of the financial statements (Contd.)
Not
e 11
- F
ixed
ass
ets
- Ta
ngib
le a
nd I
ntan
gibl
e as
sets
` i
n M
illio
n
Part
icul
ars
Gro
ss b
lock
Dep
reci
atio
n/A
mor
tisat
ion
Net
blo
ck
As
at 3
1st
Dec
embe
r,
2015
Add
ition
s
duri
ng t
he
year
Ded
uctio
ns
duri
ng t
he
year
As
at 3
1st
Dec
embe
r,
2016
Upt
o 31
st
Dec
embe
r,
2015
Prov
ided
duri
ng t
he
year
Ded
uctio
ns
duri
ng t
he
year
Upt
o 31
st
Dec
embe
r,
2016
As
at 3
1st
Dec
embe
r,
2016
As
at 3
1st
Dec
embe
r,
2015
A.
Tang
ible
Ass
ets
(a
) La
nd
Free
hold
3.0
1 -
-
3
.01
-
-
-
-
3.0
1 3
.01
Leas
ehol
d 1
5.15
2
50.0
0 -
2
65.1
5 3
.40
2.3
7 -
5
.77
259
.38
11.
75
(b
) Bu
ildin
gs (
See
Not
e) 7
83.8
2 7
6.69
0
.03
860
.48
350
.42
45.
36
0.0
3 3
95.7
5 4
64.7
3 4
33.4
0
(c
)
Plan
t an
d Eq
uipm
ent
3,3
04.4
2 1
77.7
7 9
.83
3,4
72.3
6 1
,884
.03
223
.34
9.7
9 2
,097
.58
1,3
74.7
8 1
,420
.39
(d
)
Furn
iture
and
Fix
ture
s 9
6.11
1
.26
1.1
6 9
6.21
8
4.93
4
.33
0.9
7 8
8.29
7
.92
11.
18
(e
)
Vehi
cles
51.
73
3.6
9 4
.77
50.
65
41.
77
4.6
8 4
.69
41.
76
8.8
9 9
.96
(f
)
Off
ice
equi
pmen
t 1
03.5
4 1
2.38
1
.54
114
.38
62.
81
8.5
8 1
.38
70.
01
44.
37
40.
73
(g
)
Dev
elop
men
t of
Pro
pert
y 0
.04
-
-
0.0
4 0
.04
-
-
0.0
4 -
-
Tota
l Tan
gibl
e A
sset
s 4
,357
.82
521
.79
17.
33
4,8
62.2
8 2
,427
.40
288
.66
16.
86
2,6
99.2
0 2
,163
.08
1,9
30.4
2
B.
Inta
ngib
le A
sset
s
(o
ther
than
inte
rnal
ly g
ener
ated
)
(a
) C
ompu
ter
soft
war
e 4
4.37
1
8.01
-
6
2.38
4
1.68
3
.67
-
45.
35
17.
03
2.6
9
(b
) C
opyr
ight
s, p
aten
ts
and
othe
r in
telle
ctua
l
prop
erty
rig
hts,
ser
vice
s
and
oper
atin
g ri
ghts
59.
26
-
-
59.
26
51.
83
1.2
4 -
5
3.07
6
.19
7.4
3
Tota
l Int
angi
ble
Ass
ets
103
.63
18.
01
-
121
.64
93.
51
4.9
1 -
9
8.42
2
3.22
1
0.12
Not
e:Bu
ildin
gs in
clud
e `
10,7
50 (
prev
ious
yea
r -
` 10
,750
) be
ing
the
cost
of
shar
es in
co-
oper
ativ
e ho
usin
g/in
dust
rial
soc
ietie
s.
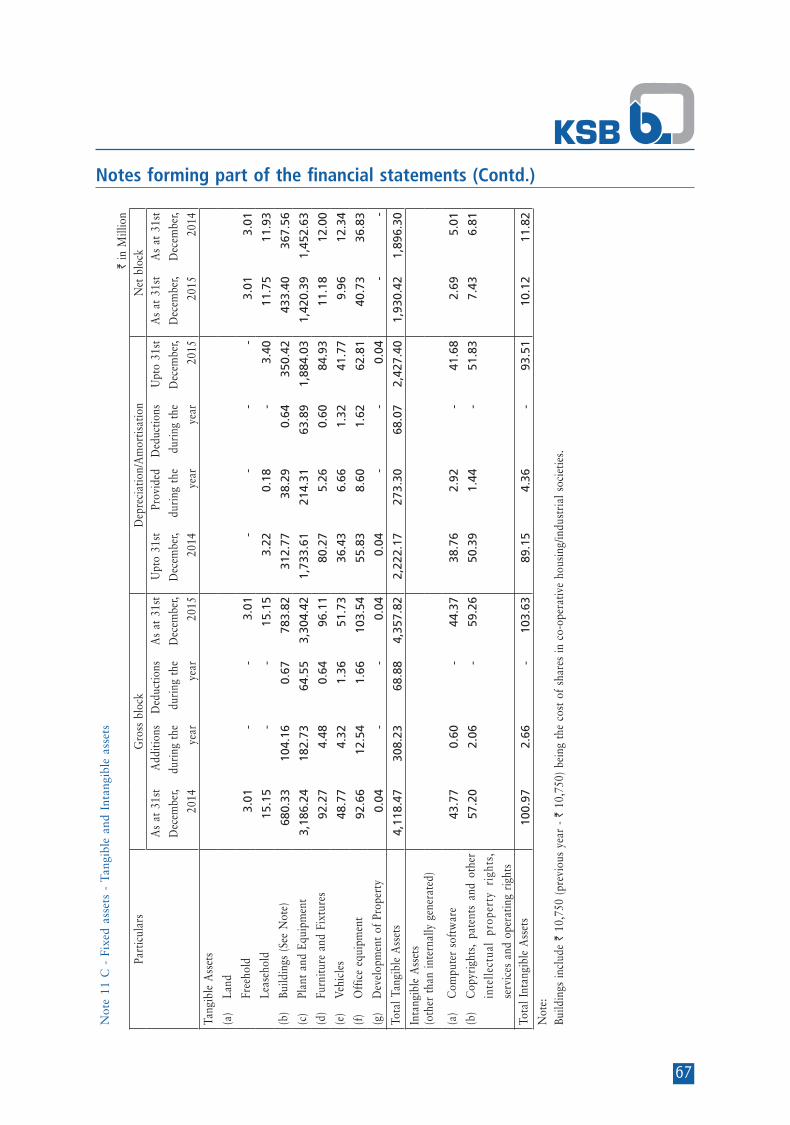
67
Notes forming part of the financial statements (Contd.)
Not
e 11
C -
Fix
ed a
sset
s -
Tang
ible
and
Int
angi
ble
asse
ts `
in M
illio
n Pa
rtic
ular
sG
ross
blo
ckD
epre
ciat
ion/
Am
ortis
atio
nN
et b
lock
As
at 3
1st
Dec
embe
r,
2014
Add
ition
s
duri
ng t
he
year
Ded
uctio
ns
duri
ng t
he
year
As
at 3
1st
Dec
embe
r,
2015
Upt
o 31
st
Dec
embe
r,
2014
Prov
ided
duri
ng t
he
year
Ded
uctio
ns
duri
ng t
he
year
Upt
o 31
st
Dec
embe
r,
2015
As
at 3
1st
Dec
embe
r,
2015
As
at 3
1st
Dec
embe
r,
2014
Tang
ible
Ass
ets
(a)
Land
Fr
eeho
ld 3
.01
-
-
3.0
1 -
-
-
-
3
.01
3.0
1
Leas
ehol
d 1
5.15
-
-
1
5.15
3
.22
0.1
8 -
3
.40
11.
75
11.
93
(b)
Build
ings
(Se
e N
ote)
680
.33
104
.16
0.6
7 7
83.8
2 3
12.7
7 3
8.29
0
.64
350
.42
433
.40
367
.56
(c)
Plan
t an
d Eq
uipm
ent
3,1
86.2
4 1
82.7
3 6
4.55
3
,304
.42
1,7
33.6
1 2
14.3
1 6
3.89
1
,884
.03
1,4
20.3
9 1
,452
.63
(d)
Furn
iture
and
Fix
ture
s 9
2.27
4
.48
0.6
4 9
6.11
8
0.27
5
.26
0.6
0 8
4.93
1
1.18
1
2.00
(e
) Ve
hicl
es 4
8.77
4
.32
1.3
6 5
1.73
3
6.43
6
.66
1.3
2 4
1.77
9
.96
12.
34
(f)
Off
ice
equi
pmen
t 9
2.66
1
2.54
1
.66
103
.54
55.
83
8.6
0 1
.62
62.
81
40.
73
36.
83
(g)
Dev
elop
men
t of
Pro
pert
y 0
.04
-
-
0.0
4 0
.04
-
-
0.0
4 -
-
To
tal T
angi
ble
Ass
ets
4,1
18.4
7 3
08.2
3 6
8.88
4
,357
.82
2,2
22.1
7 2
73.3
0 6
8.07
2
,427
.40
1,9
30.4
2 1
,896
.30
Inta
ngib
le A
sset
s(o
ther
tha
n in
tern
ally
gen
erat
ed)
(a)
Com
pute
r so
ftw
are
43.
77
0.6
0 -
4
4.37
3
8.76
2
.92
-
41.
68
2.6
9 5
.01
(b)
Cop
yrig
hts,
pat
ents
and
oth
er
inte
llect
ual
prop
erty
rig
hts,
serv
ices
and
ope
ratin
g ri
ghts
57.
20
2.0
6 -
5
9.26
5
0.39
1
.44
-
51.
83
7.4
3 6
.81
Tota
l Int
angi
ble
Ass
ets
100
.97
2.6
6 -
1
03.6
3 8
9.15
4
.36
-
93.
51
10.
12
11.
82
Not
e:Bu
ildin
gs in
clud
e `
10,7
50 (
prev
ious
yea
r -
` 10
,750
) be
ing
the
cost
of
shar
es in
co-
oper
ativ
e ho
usin
g/in
dust
rial
soc
ietie
s.

68
Notes forming part of the financial statements (Contd.)
Note 12 - Non-current investmentsParticulars As at
31st December, 2016As at 31st
December, 2015` in Million ` in Million ` in Million
Unquoted, TradeInvestment in equity instruments of subsidiaries (at cost) Pofran Sales & Agency Ltd. - 5,000 (previous year 5,000) equity shares 0.50 0.50of ` 100 each fully paid Investment in equity instruments of associates (at cost) KSB MIL Controls Limited (Previously MIL Controls Limited) 62.65 62.65- 735,000 (previous year -735,000) equity shares of `10 each fully
paid. Investment in equity instruments of Other Entities (at cost) Mula Pravara Electric Co-operative Society Limited - 15,995
(previous year -15,995) shares of `25 each fully paid.
0.40 0.40
Less : Provision for diminution in value of investments (0.40) (0.40) - -
Total 63.15 63.15
Note 13 - Deferred Tax Assets (Net)(i) Break up of deferred tax liability as at year end : Nature of timing difference Provision for Depreciation 112.20 111.51
Total 112.20 111.51 (ii) Break up of deferred tax asset as at year end: Nature of timing difference Provision for compensated absences and gratuity 134.39 114.20 Provision for doubtful debts and advances 72.92 65.28 Others 61.93 59.78
Total 269.24 239.26 (iii) Deferred tax Asset/(Liability) Net 157.04 127.75
Note 14 - Long-term loans and advances(Unsecured - considered good unless otherwise stated)Capital advances 296.25 74.71 Security Deposits Considered good 35.88 35.02 Considered Doubtful 5.30 5.30
41.18 40.32 Less: Provision for doubtful security deposits 5.30 5.30
35.88 35.02 Other loans and advances - Loans and advances to employees 25.49 23.75 - Taxes paid in advance less provisions (current tax) 88.91 91.09 - Balances with government authorities - VAT credit receivable etc. Considered Good 255.78 267.53 Considered Doubtful 6.25 4.64
262.03 272.17 Less: Provision for doubtful loans and advances 6.25 4.64
255.78 267.53 - Prepaid Expenses 1.47 0.33
Total 703.78 492.43
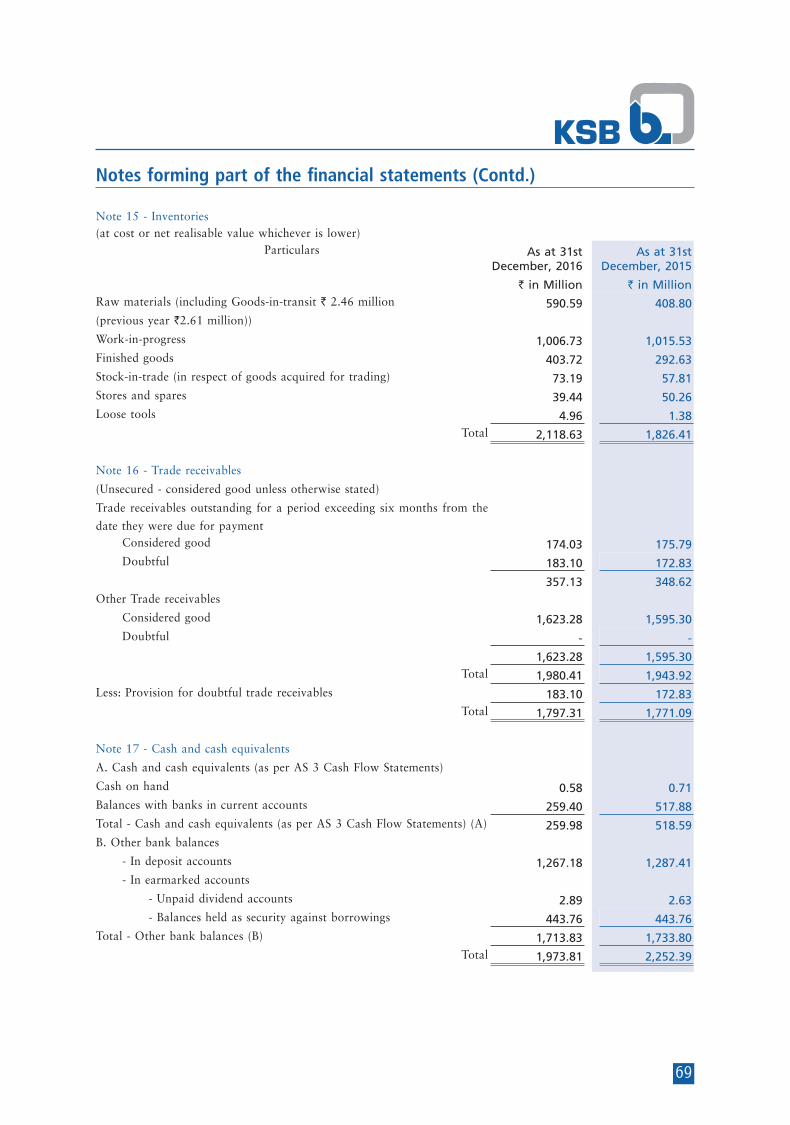
69
Notes forming part of the financial statements (Contd.)
Note 15 - Inventories(at cost or net realisable value whichever is lower)
Particulars As at 31st December, 2016
As at 31st December, 2015
` in Million ` in MillionRaw materials (including Goods-in-transit ` 2.46 million 590.59 408.80 (previous year `2.61 million))
Work-in-progress 1,006.73 1,015.53 Finished goods 403.72 292.63 Stock-in-trade (in respect of goods acquired for trading) 73.19 57.81 Stores and spares 39.44 50.26 Loose tools 4.96 1.38
Total 2,118.63 1,826.41
Note 16 - Trade receivables
(Unsecured - considered good unless otherwise stated)
Trade receivables outstanding for a period exceeding six months from the
date they were due for payment Considered good 174.03 175.79 Doubtful 183.10 172.83
357.13 348.62 Other Trade receivables
Considered good 1,623.28 1,595.30 Doubtful - -
1,623.28 1,595.30 Total 1,980.41 1,943.92
Less: Provision for doubtful trade receivables 183.10 172.83 Total 1,797.31 1,771.09
Note 17 - Cash and cash equivalents
A. Cash and cash equivalents (as per AS 3 Cash Flow Statements)
Cash on hand 0.58 0.71 Balances with banks in current accounts 259.40 517.88 Total - Cash and cash equivalents (as per AS 3 Cash Flow Statements) (A) 259.98 518.59 B. Other bank balances
- In deposit accounts 1,267.18 1,287.41 - In earmarked accounts
- Unpaid dividend accounts 2.89 2.63 - Balances held as security against borrowings 443.76 443.76 Total - Other bank balances (B) 1,713.83 1,733.80
Total 1,973.81 2,252.39
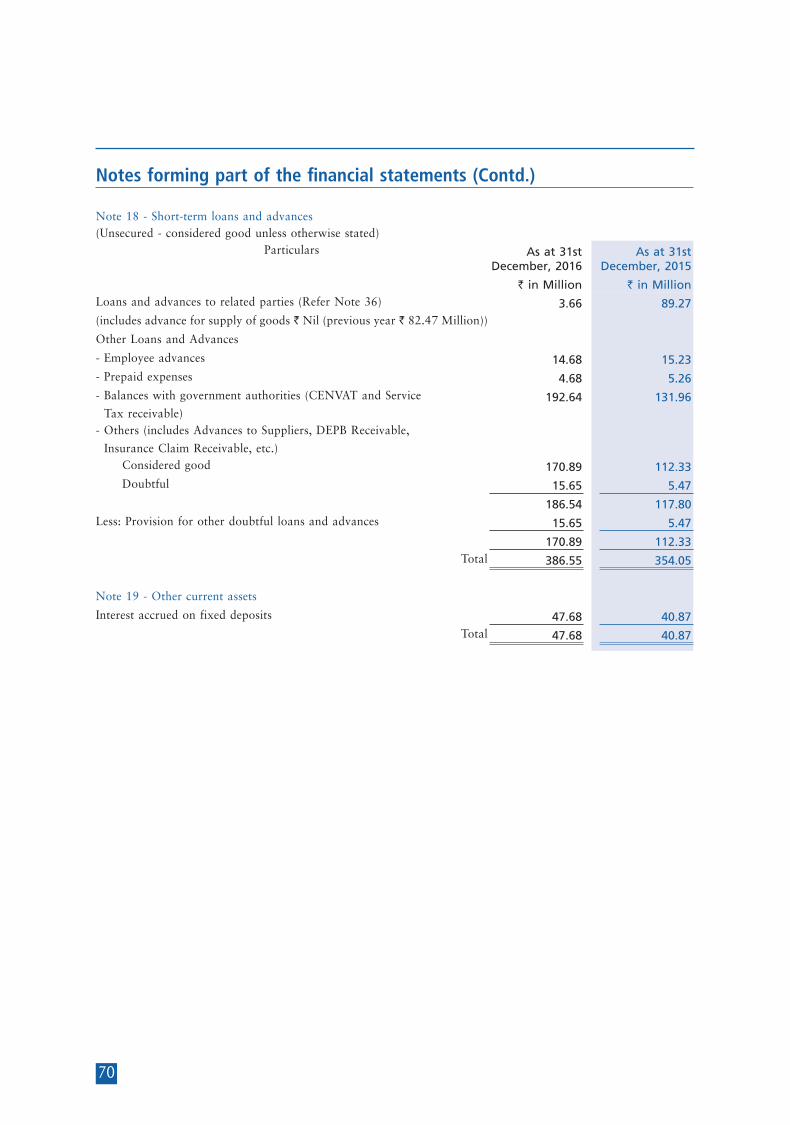
70
Notes forming part of the financial statements (Contd.)
Note 18 - Short-term loans and advances(Unsecured - considered good unless otherwise stated)
Particulars As at 31st December, 2016
As at 31st December, 2015
` in Million ` in MillionLoans and advances to related parties (Refer Note 36) 3.66 89.27 (includes advance for supply of goods ` Nil (previous year ` 82.47 Million))
Other Loans and Advances
- Employee advances 14.68 15.23 - Prepaid expenses 4.68 5.26 - Balances with government authorities (CENVAT and Service
Tax receivable) 192.64 131.96
- Others (includes Advances to Suppliers, DEPB Receivable,
Insurance Claim Receivable, etc.) Considered good 170.89 112.33 Doubtful 15.65 5.47
186.54 117.80 Less: Provision for other doubtful loans and advances 15.65 5.47
170.89 112.33 Total 386.55 354.05
Note 19 - Other current assets
Interest accrued on fixed deposits 47.68 40.87 Total 47.68 40.87
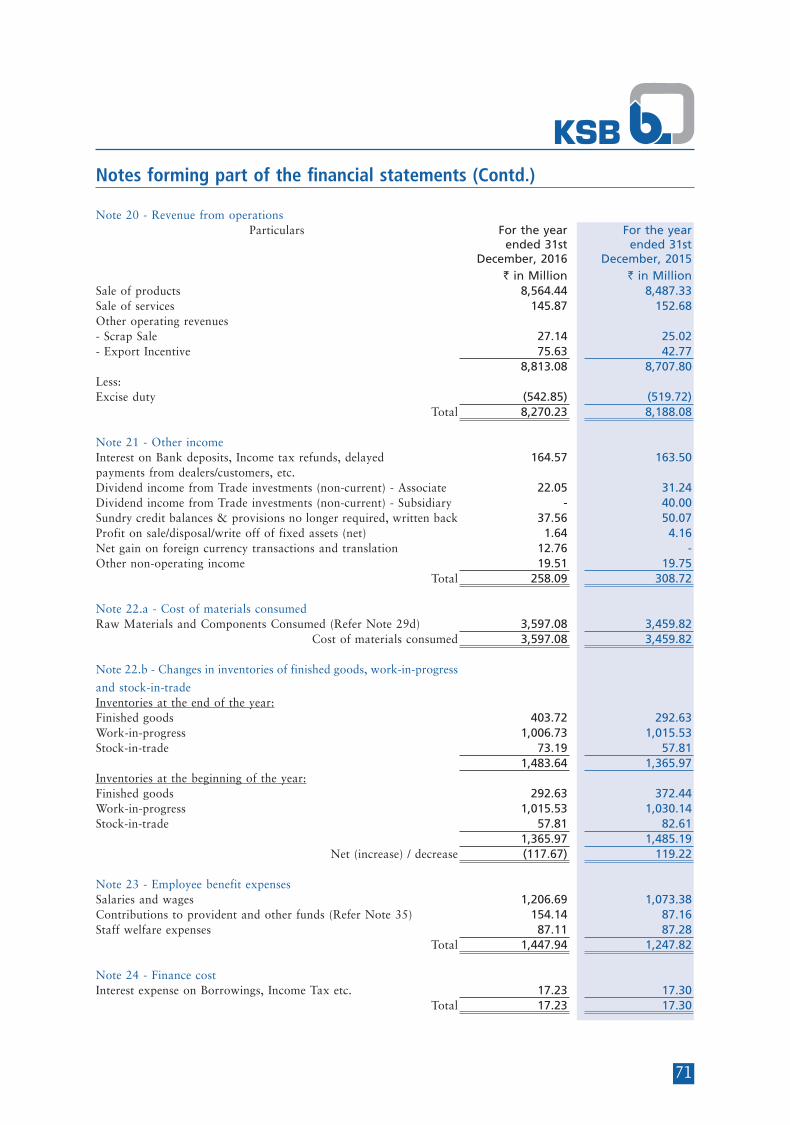
71
Notes forming part of the financial statements (Contd.)
Note 20 - Revenue from operationsParticulars For the year
ended 31st December, 2016
For the year ended 31st
December, 2015 ` in Million ` in Million
Sale of products 8,564.44 8,487.33 Sale of services 145.87 152.68 Other operating revenues - Scrap Sale 27.14 25.02 - Export Incentive 75.63 42.77
8,813.08 8,707.80 Less:Excise duty (542.85) (519.72)
Total 8,270.23 8,188.08
Note 21 - Other incomeInterest on Bank deposits, Income tax refunds, delayed 164.57 163.50 payments from dealers/customers, etc.Dividend income from Trade investments (non-current) - Associate 22.05 31.24 Dividend income from Trade investments (non-current) - Subsidiary - 40.00 Sundry credit balances & provisions no longer required, written back 37.56 50.07 Profit on sale/disposal/write off of fixed assets (net) 1.64 4.16 Net gain on foreign currency transactions and translation 12.76 - Other non-operating income 19.51 19.75
Total 258.09 308.72
Note 22.a - Cost of materials consumed Raw Materials and Components Consumed (Refer Note 29d) 3,597.08 3,459.82
Cost of materials consumed 3,597.08 3,459.82
Note 22.b - Changes in inventories of finished goods, work-in-progress
and stock-in-trade Inventories at the end of the year:Finished goods 403.72 292.63 Work-in-progress 1,006.73 1,015.53 Stock-in-trade 73.19 57.81
1,483.64 1,365.97 Inventories at the beginning of the year:Finished goods 292.63 372.44 Work-in-progress 1,015.53 1,030.14 Stock-in-trade 57.81 82.61
1,365.97 1,485.19 Net (increase) / decrease (117.67) 119.22
Note 23 - Employee benefit expensesSalaries and wages 1,206.69 1,073.38 Contributions to provident and other funds (Refer Note 35) 154.14 87.16 Staff welfare expenses 87.11 87.28
Total 1,447.94 1,247.82
Note 24 - Finance costInterest expense on Borrowings, Income Tax etc. 17.23 17.30
Total 17.23 17.30

72
Notes forming part of the financial statements (Contd.)
Note 25 - Other expensesParticulars For the year ended
31st December, 2016For the year
ended 31st December, 2015
` in Million ` in Million ` in MillionProcessing & Machining Charges 396.66 363.39 Stores Consumed 170.53 164.80 Tools Consumed 53.53 43.97 Water Power and fuel 189.16 175.89 Rent 6.96 7.13 Excise duty relating to increase / (decrease) in finished goods stock (1.18) (14.65)Rates and taxes (Refer Note 38) 43.27 47.46 Insurance (Net) 2.16 2.28 Repairs and maintenance - Buildings 9.83 3.62 - Machinery 60.56 59.21 - Others 69.39 71.59
139.78 134.42 Travelling and conveyance 54.29 58.81 Packing & Forwarding Charges
(net of recoveries - `56.06 Million; previous year `46.14 Million) 212.41 212.94
Directors' fees 1.41 1.39 Auditors' remuneration (net of service tax) and expenses:
Audit fees 1.30 1.30 Tax audit fees 0.30 0.30 Accounts for tax purposes 0.45 0.45 Fees for other services 1.25 1.20 Reimbursement of out-of-pocket expenses 0.05 0.22
3.35 3.47 Cost Audit Fees 0.40 0.40 Sales commission
Export Selling agents 86.60 96.04 Other Selling agents 28.92 33.29
115.52 129.33 Cash Discount 22.42 17.54 Royalty Charges 81.41 90.87 In respect of late delivery under contracts 33.39 80.00 Provision for doubtful receivables and advances (net) 22.06 48.45 Expenditure on Corporate Social Responsibility (Refer Note 42) 19.90 18.30 Legal and professional 22.74 22.34 Net loss on foreign currency transactions and translation - 20.88 Mark to market loss on derivative contracts - 3.66 Miscellaneous expenses 396.75 397.61
Total 1,986.92 2,030.68
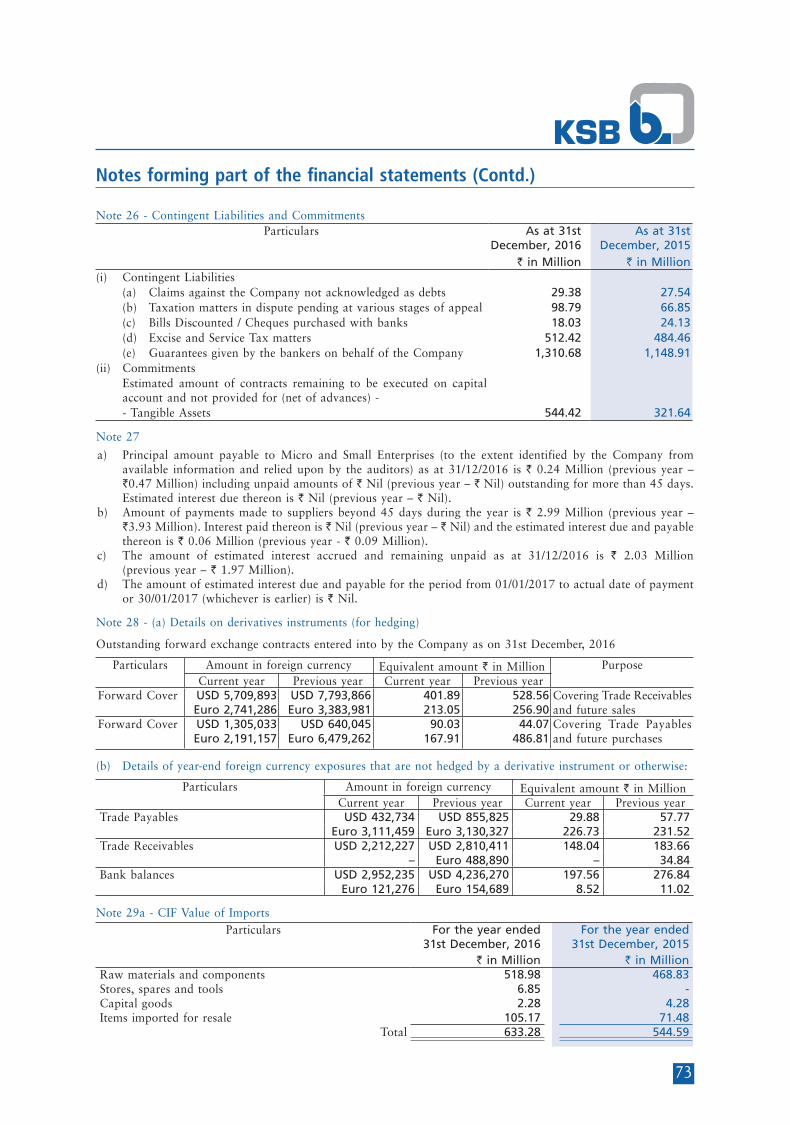
73
Notes forming part of the financial statements (Contd.)
Note 26 - Contingent Liabilities and CommitmentsParticulars As at 31st
December, 2016 As at 31st
December, 2015 ` in Million ` in Million
(i) Contingent Liabilities (a) Claims against the Company not acknowledged as debts 29.38 27.54 (b) Taxation matters in dispute pending at various stages of appeal 98.79 66.85 (c) Bills Discounted / Cheques purchased with banks 18.03 24.13 (d) Excise and Service Tax matters 512.42 484.46 (e) Guarantees given by the bankers on behalf of the Company 1,310.68 1,148.91 (ii) Commitments Estimated amount of contracts remaining to be executed on capital
account and not provided for (net of advances) - - Tangible Assets 544.42 321.64
Note 27
a) Principal amount payable to Micro and Small Enterprises (to the extent identified by the Company from available information and relied upon by the auditors) as at 31/12/2016 is ` 0.24 Million (previous year – `0.47 Million) including unpaid amounts of ` Nil (previous year – ` Nil) outstanding for more than 45 days. Estimated interest due thereon is ` Nil (previous year – ` Nil).
b) Amount of payments made to suppliers beyond 45 days during the year is ` 2.99 Million (previous year – `3.93 Million). Interest paid thereon is ` Nil (previous year – ` Nil) and the estimated interest due and payable thereon is ` 0.06 Million (previous year - ` 0.09 Million).
c) The amount of estimated interest accrued and remaining unpaid as at 31/12/2016 is ` 2.03 Million (previous year – ` 1.97 Million).
d) The amount of estimated interest due and payable for the period from 01/01/2017 to actual date of payment or 30/01/2017 (whichever is earlier) is ` Nil.
Note 28 - (a) Details on derivatives instruments (for hedging)
Outstanding forward exchange contracts entered into by the Company as on 31st December, 2016
Particulars Amount in foreign currency Equivalent amount ` in Million PurposeCurrent year Previous year Current year Previous year
Forward Cover USD 5,709,893 USD 7,793,866 401.89 528.56 Covering Trade Receivables and future sales Euro 2,741,286 Euro 3,383,981 213.05 256.90
Forward Cover USD 1,305,033 USD 640,045 90.03 44.07 Covering Trade Payables and future purchases Euro 2,191,157 Euro 6,479,262 167.91 486.81
(b) Details of year-end foreign currency exposures that are not hedged by a derivative instrument or otherwise:
Particulars Amount in foreign currency Equivalent amount ` in MillionCurrent year Previous year Current year Previous year
Trade Payables USD 432,734 USD 855,825 29.88 57.77 Euro 3,111,459 Euro 3,130,327 226.73 231.52
Trade Receivables USD 2,212,227 USD 2,810,411 148.04 183.66 – Euro 488,890 – 34.84
Bank balances USD 2,952,235 USD 4,236,270 197.56 276.84 Euro 121,276 Euro 154,689 8.52 11.02
Note 29a - CIF Value of ImportsParticulars For the year ended
31st December, 2016For the year ended
31st December, 2015 ` in Million ` in Million
Raw materials and components 518.98 468.83 Stores, spares and tools 6.85 - Capital goods 2.28 4.28 Items imported for resale 105.17 71.48
Total 633.28 544.59
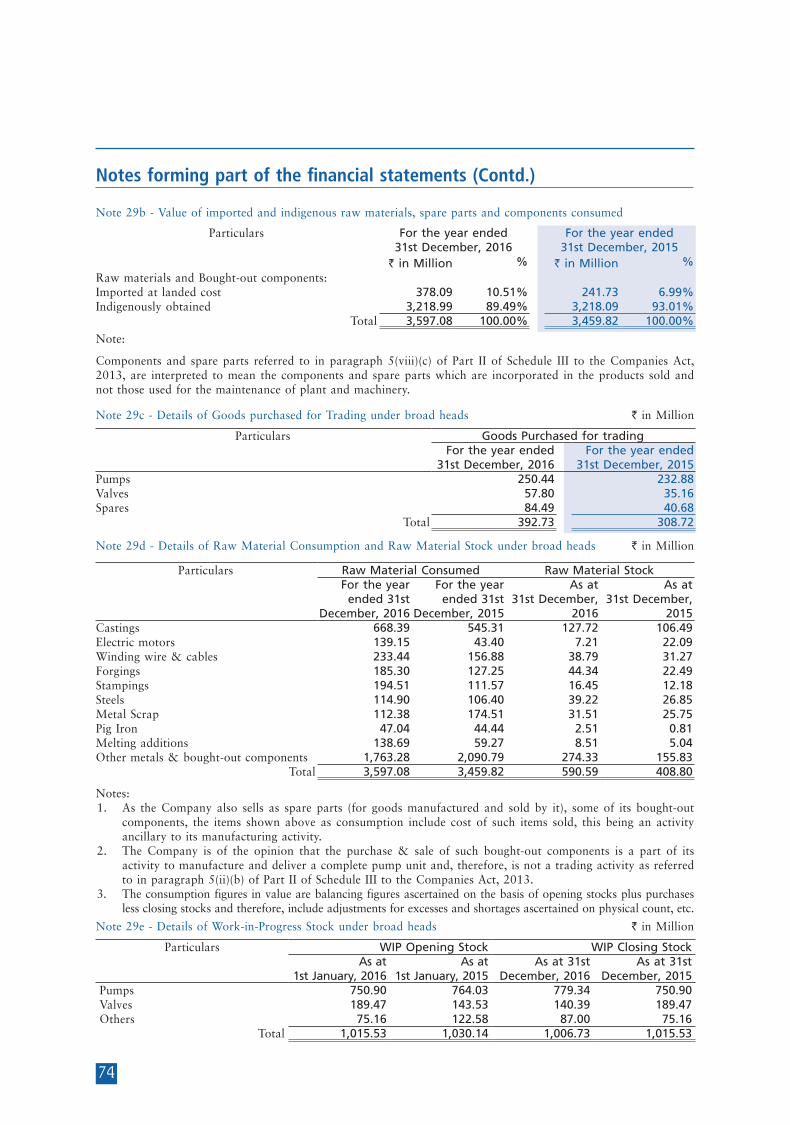
74
Notes forming part of the financial statements (Contd.)
Note 29b - Value of imported and indigenous raw materials, spare parts and components consumed
Particulars For the year ended 31st December, 2016
For the year ended 31st December, 2015
` in Million % ` in Million % Raw materials and Bought-out components:Imported at landed cost 378.09 10.51% 241.73 6.99%Indigenously obtained 3,218.99 89.49% 3,218.09 93.01%
Total 3,597.08 100.00% 3,459.82 100.00%
Note:
Components and spare parts referred to in paragraph 5(viii)(c) of Part II of Schedule III to the Companies Act, 2013, are interpreted to mean the components and spare parts which are incorporated in the products sold and not those used for the maintenance of plant and machinery.
Note 29c - Details of Goods purchased for Trading under broad heads ` in Million
Particulars Goods Purchased for tradingFor the year ended
31st December, 2016For the year ended
31st December, 2015Pumps 250.44 232.88 Valves 57.80 35.16 Spares 84.49 40.68
Total 392.73 308.72
Note 29d - Details of Raw Material Consumption and Raw Material Stock under broad heads ` in Million
Particulars Raw Material Consumed Raw Material StockFor the year
ended 31st December, 2016
For the year ended 31st
December, 2015
As at 31st December,
2016
As at 31st December,
2015Castings 668.39 545.31 127.72 106.49Electric motors 139.15 43.40 7.21 22.09Winding wire & cables 233.44 156.88 38.79 31.27Forgings 185.30 127.25 44.34 22.49Stampings 194.51 111.57 16.45 12.18Steels 114.90 106.40 39.22 26.85Metal Scrap 112.38 174.51 31.51 25.75Pig Iron 47.04 44.44 2.51 0.81Melting additions 138.69 59.27 8.51 5.04Other metals & bought-out components 1,763.28 2,090.79 274.33 155.83
Total 3,597.08 3,459.82 590.59 408.80
Notes:1. As the Company also sells as spare parts (for goods manufactured and sold by it), some of its bought-out
components, the items shown above as consumption include cost of such items sold, this being an activity ancillary to its manufacturing activity.
2. The Company is of the opinion that the purchase & sale of such bought-out components is a part of its activity to manufacture and deliver a complete pump unit and, therefore, is not a trading activity as referred to in paragraph 5(ii)(b) of Part II of Schedule III to the Companies Act, 2013.
3. The consumption figures in value are balancing figures ascertained on the basis of opening stocks plus purchases less closing stocks and therefore, include adjustments for excesses and shortages ascertained on physical count, etc.
Note 29e - Details of Work-in-Progress Stock under broad heads ` in Million
Particulars WIP Opening Stock WIP Closing StockAs at
1st January, 2016As at
1st January, 2015As at 31st
December, 2016As at 31st
December, 2015Pumps 750.90 764.03 779.34 750.90 Valves 189.47 143.53 140.39 189.47 Others 75.16 122.58 87.00 75.16
Total 1,015.53 1,030.14 1,006.73 1,015.53
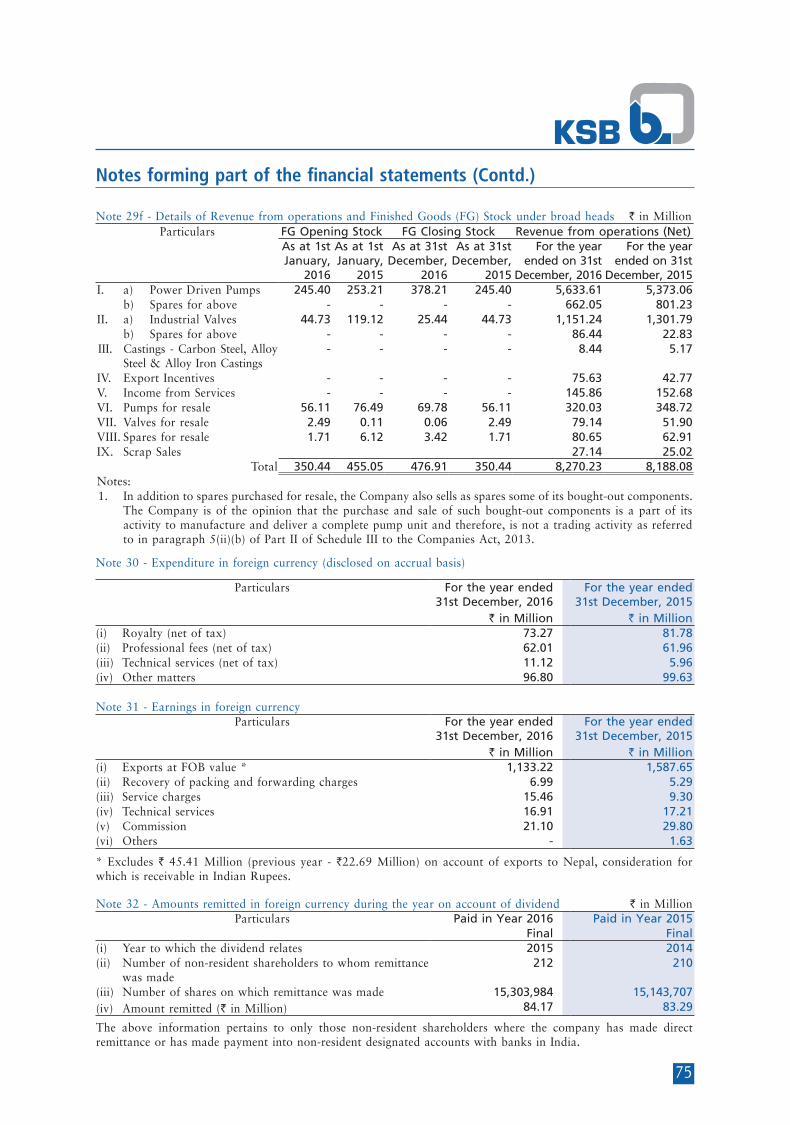
75
Notes forming part of the financial statements (Contd.)
Note 29f - Details of Revenue from operations and Finished Goods (FG) Stock under broad heads ` in MillionParticulars FG Opening Stock FG Closing Stock Revenue from operations (Net)
As at 1st January,
2016
As at 1st January,
2015
As at 31st December,
2016
As at 31st December,
2015
For the year ended on 31st
December, 2016
For the year ended on 31st
December, 2015I. a) Power Driven Pumps 245.40 253.21 378.21 245.40 5,633.61 5,373.06 b) Spares for above - - - - 662.05 801.23 II. a) Industrial Valves 44.73 119.12 25.44 44.73 1,151.24 1,301.79 b) Spares for above - - - - 86.44 22.83 III. Castings - Carbon Steel, Alloy
Steel & Alloy Iron Castings - - - - 8.44 5.17
IV. Export Incentives - - - - 75.63 42.77 V. Income from Services - - - - 145.86 152.68 VI. Pumps for resale 56.11 76.49 69.78 56.11 320.03 348.72 VII. Valves for resale 2.49 0.11 0.06 2.49 79.14 51.90 VIII. Spares for resale 1.71 6.12 3.42 1.71 80.65 62.91 IX. Scrap Sales 27.14 25.02
Total 350.44 455.05 476.91 350.44 8,270.23 8,188.08 Notes:1. In addition to spares purchased for resale, the Company also sells as spares some of its bought-out components.
The Company is of the opinion that the purchase and sale of such bought-out components is a part of its activity to manufacture and deliver a complete pump unit and therefore, is not a trading activity as referred to in paragraph 5(ii)(b) of Part II of Schedule III to the Companies Act, 2013.
Note 30 - Expenditure in foreign currency (disclosed on accrual basis)
Particulars For the year ended 31st December, 2016
For the year ended 31st December, 2015
` in Million ` in Million(i) Royalty (net of tax) 73.27 81.78 (ii) Professional fees (net of tax) 62.01 61.96 (iii) Technical services (net of tax) 11.12 5.96 (iv) Other matters 96.80 99.63
Note 31 - Earnings in foreign currencyParticulars For the year ended
31st December, 2016For the year ended
31st December, 2015 ` in Million ` in Million
(i) Exports at FOB value * 1,133.22 1,587.65 (ii) Recovery of packing and forwarding charges 6.99 5.29 (iii) Service charges 15.46 9.30 (iv) Technical services 16.91 17.21 (v) Commission 21.10 29.80 (vi) Others - 1.63
* Excludes ` 45.41 Million (previous year - `22.69 Million) on account of exports to Nepal, consideration for which is receivable in Indian Rupees.
Note 32 - Amounts remitted in foreign currency during the year on account of dividend ` in MillionParticulars Paid in Year 2016 Paid in Year 2015
Final Final(i) Year to which the dividend relates 2015 2014(ii) Number of non-resident shareholders to whom remittance
was made212 210
(iii) Number of shares on which remittance was made 15,303,984 15,143,707 (iv) Amount remitted (` in Million) 84.17 83.29
The above information pertains to only those non-resident shareholders where the company has made direct remittance or has made payment into non-resident designated accounts with banks in India.

76
Notes forming part of the financial statements (Contd.)
Note 33 - Research and Development expenditure debited to the Statement of Profit and Loss aggregating ` 2.93 Million (previous year - ` 2.94 Million) has been incurred by the Company and disclosed under Miscellaneous expenses (Refer note 25).
Note 34 - The net exchange differences arising during the year recognised appropriately in the Statement of Profit and Loss - net gain- ` 12.76 Million (previous year - net loss - ` 20.88 Million)
Note 35 Disclosures under Accounting Standards
35.1 Details of Employee Benefits as required by the Accounting Standard 15 (Revised) Employee benefits are as under:
35.1.a Defined contribution plan
Amount recognised as an expense in the Statement of Profit and Loss in respect of Defined Contribution Plan towards Provident Fund is ` 54.21 Million (previous year ` 54.61 Million).
35.1.b Defined benefit plans
i. Actuarial gains and losses in respect of defined benefit plans are recognised in the Statement of Profit & Loss.
ii. The Defined Benefit Plans comprise of Gratuity and superannuation.
Gratuity is a benefit to an employee based on 15/20/25/30 days (depending on the grade/category of the employee and the completed years of service) last drawn salary for each completed year of service. Superannuation is a benefit to certain employees at ` 1000 / 500 / 250 (depending on the grade/category of the employee and the completed years of service) per month for each completed year of service.
Both the plans are funded. ` in Million
Particulars Gratuity Superannuation
Year 2016
Year 2015
Year 2016
Year 2015
(A) Changes in the present value of defined obligation representing
reconciliation of opening and closing balances thereof are as follows :1 Present Value of Defined Benefit Obligation as at 1st January 493.00 459.29 31.76 30.52 2 Current Service cost 28.23 29.31 1.69 1.45 3 Interest cost 39.52 35.95 2.55 2.38 4 Losses (gains) on Curtailment - - - - 5 Liabilities extinguished on settlements - - - - 6 Plan ammendments - - - - 7 Actuarial (gains) / losses 53.13 (11.77) 3.47 (0.99)8 Benefits paid (61.88) (19.78) (4.28) (1.60)9 Present Value of Defined Benefit Obligation as at 31st December 552.00 493.00 35.19 31.76
(B) Changes in the fair value of plan assets representing reconciliation of
opening and closing balances thereof are as follows :1 Fair value of Plan assets as at 1st January 323.97 278.92 23.69 22.68 2 Expected return on plan assets 24.89 24.06 1.90 1.78 3 Actuarial gains and (losses) 1.30 2.29 (0.55) 0.27 4 Actual contributions by employers 38.75 38.48 1.21 1.26 5 Benefits paid (61.88) (19.78) (4.28) (2.30)6 Plan assets as at 31st December 327.03 323.97 21.97 23.69

77
Notes forming part of the financial statements (Contd.)
` in Million
Particulars Gratuity Superannuation
Year 2016
Year 2015
Year 2016
Year 2015
(C) Analysis of Defined Benefit Obligation :
1 Defined Benefit Obligation as at 31st December 552.00 493.00 35.19 31.76 2 Fair Value of Plan Assets at the end of year (327.03) (323.97) (21.97) (23.69)3 Net (Asset)/Liability recognised in the Balance Sheet as at
31st December224.97 169.03 13.22 8.07
(D) Reconciliation of Present Value of Defined Benefit Obligation and fair
value of plan assets showing amount recognised in the Balance Sheet :1 Present value of Defined Benefit Obligation 552.00 493.00 35.19 31.76 2 Fair value of plan assets 327.03 323.97 21.97 23.69 3 Funded status [Surplus/(Deficit)] (224.97) (169.03) (13.22) (8.07)4 Unrecognised Past Service Costs - - - - 5 Net Asset/(Liability) recognised in Balance Sheet (224.97) (169.03) (13.22) (8.07)
(E) Components of employer expenses recognised in the statement of
profit and loss for the year ended 31st December1 Current Service cost 28.23 29.31 1.69 1.45 2 Interest cost 39.52 35.95 2.55 2.38 3 Expected return on plan assets (24.89) (24.06) (1.90) (1.78)4 Curtailment cost/(credit) - - - - 5 Settlement cost/(credit) - - - - 6 Past Service cost - - - - 7 Actuarial Losses/(Gains) 51.83 (14.06) 4.02 (1.26)8 Total expense recognised in the Statement of Profit & Loss under
Contribution to Provident Fund and other Funds94.69 27.14 6.36 0.79
(F) In respect of Funded Benefits with respect to gratuity and
superannuation, the fair value of Plan assets represents the amounts
invested through "Insurer Managed Funds"(G) Actuarial Assumptions :
1 Discount Rate (%) 6.75 8.00 6.75 8.002 Expected Return on plan assets (%) 8.00 8.00 8.00 8.003 Salary Escalation (%) 7.50 7.50 N/A N/A4 Medical cost inflation N/A N/A N/A N/A5 Withdrawal Rate (%) 7.00 7.00 7.00 7.00
The Discount rate is based on the prevailing market yields of Indian Government securities as at the Balance Sheet date for the estimated terms of the obligations.
Expected Rate of Return of Plan Assets : This is based on the expectation of the average long term rate of return expected on investments of the Fund during the estimated term of obligations.
Salary Escalation Rate : The estimates of future salary increases considered takes into account the inflation, seniority,
promotion and other relevant factors.
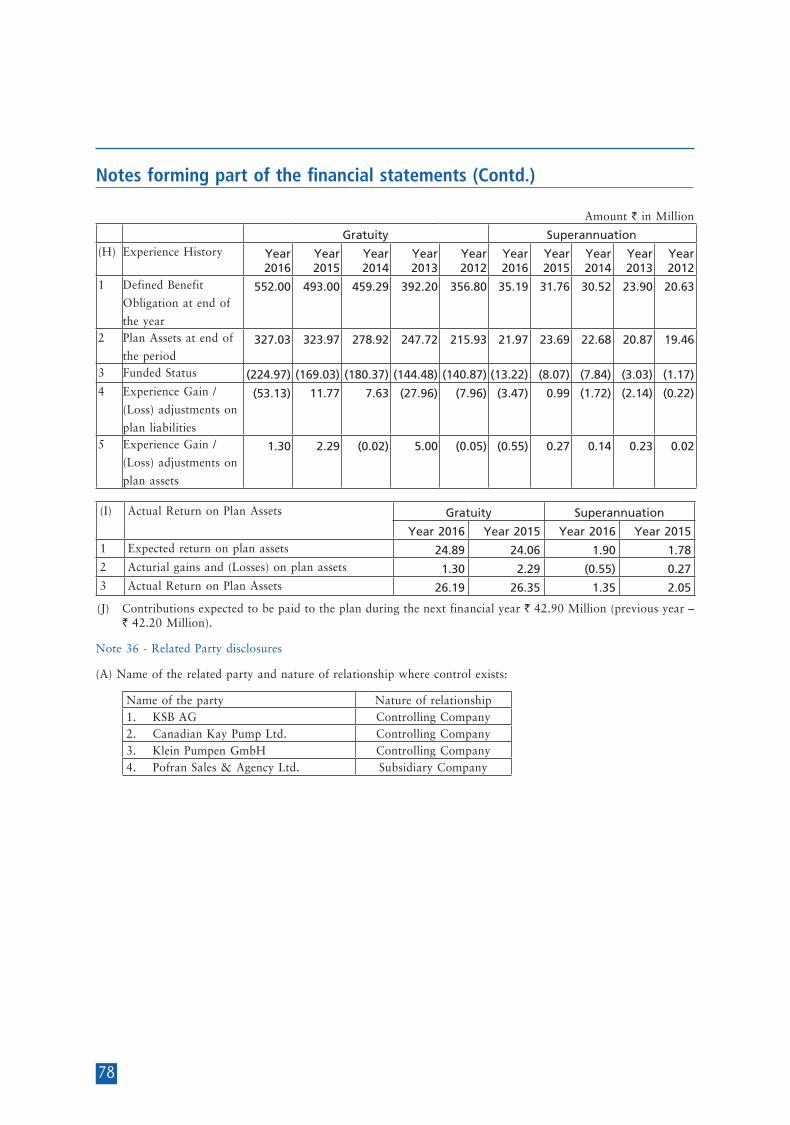
78
Notes forming part of the financial statements (Contd.)
Amount ` in Million
Gratuity Superannuation(H) Experience History Year
2016Year 2015
Year 2014
Year 2013
Year 2012
Year 2016
Year 2015
Year 2014
Year 2013
Year 2012
1 Defined Benefit
Obligation at end of
the year
552.00 493.00 459.29 392.20 356.80 35.19 31.76 30.52 23.90 20.63
2 Plan Assets at end of
the period327.03 323.97 278.92 247.72 215.93 21.97 23.69 22.68 20.87 19.46
3 Funded Status (224.97) (169.03) (180.37) (144.48) (140.87) (13.22) (8.07) (7.84) (3.03) (1.17)4 Experience Gain /
(Loss) adjustments on
plan liabilities
(53.13) 11.77 7.63 (27.96) (7.96) (3.47) 0.99 (1.72) (2.14) (0.22)
5 Experience Gain /
(Loss) adjustments on
plan assets
1.30 2.29 (0.02) 5.00 (0.05) (0.55) 0.27 0.14 0.23 0.02
(I) Actual Return on Plan Assets Gratuity Superannuation
Year 2016 Year 2015 Year 2016 Year 20151 Expected return on plan assets 24.89 24.06 1.90 1.78 2 Acturial gains and (Losses) on plan assets 1.30 2.29 (0.55) 0.27 3 Actual Return on Plan Assets 26.19 26.35 1.35 2.05
(J) Contributions expected to be paid to the plan during the next financial year ` 42.90 Million (previous year – ` 42.20 Million).
Note 36 - Related Party disclosures
(A) Name of the related party and nature of relationship where control exists:
Name of the party Nature of relationship1. KSB AG Controlling Company2. Canadian Kay Pump Ltd. Controlling Company3. Klein Pumpen GmbH Controlling Company4. Pofran Sales & Agency Ltd. Subsidiary Company
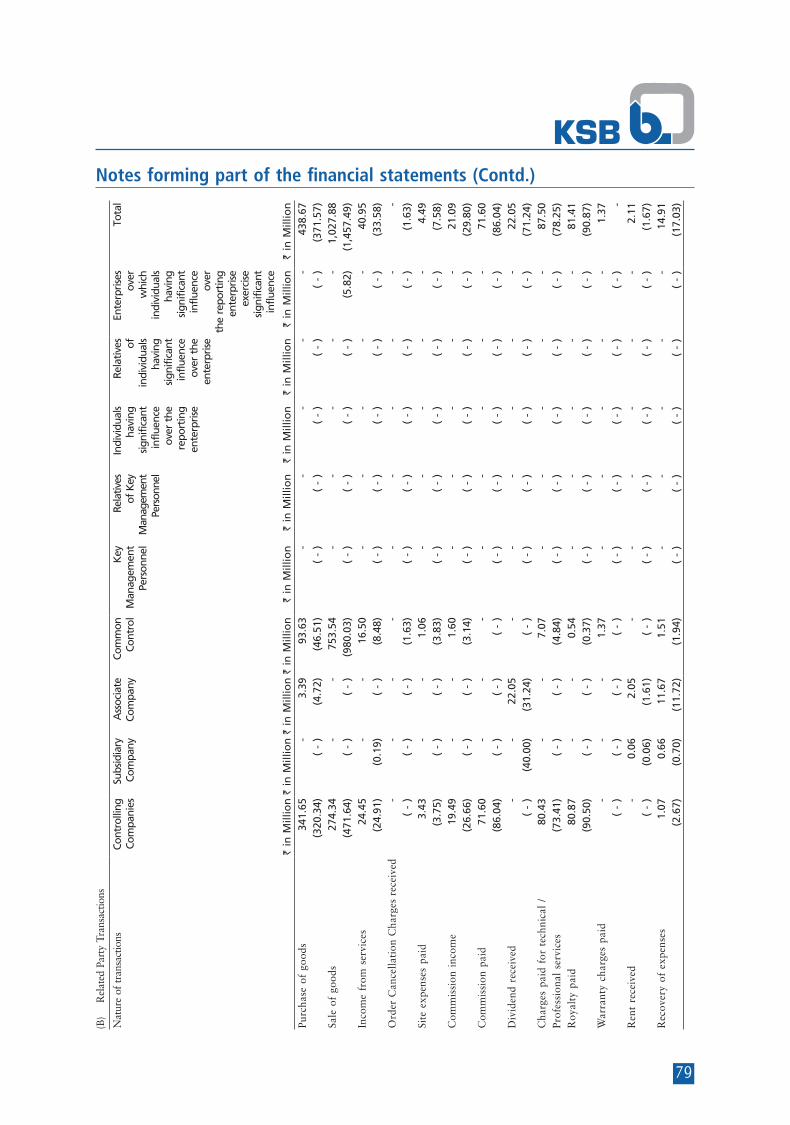
79
Notes forming part of the financial statements (Contd.)
(B)
R
elat
ed P
arty
Tra
nsac
tions
Nat
ure
of t
rans
actio
nsCo
ntro
lling
Com
pani
esSu
bsid
iary
Com
pany
Ass
ocia
teCo
mpa
nyCo
mm
onCo
ntro
lK
eyM
anag
emen
tPe
rson
nel
Rela
tives
of K
eyM
anag
emen
tPe
rson
nel
Indi
vidu
als
havi
ng
sign
ific
ant
infl
uenc
e ov
er t
he
repo
rtin
gen
terp
rise
Rela
tive
s of
indi
vidu
als
havi
ng
sign
ific
ant
infl
uenc
e ov
er t
he
ente
rpri
se
Ente
rpri
ses
over
whi
ch
indi
vidu
als
havi
ngsi
gnif
ican
t in
flue
nce
over
th
e re
port
ing
ente
rpri
se
exer
cise
sign
ific
ant
infl
uenc
e
Tota
l
` in
Mill
ion
` in
Mill
ion
` in
Mill
ion
` in
Mill
ion
` in
Mill
ion
` in
Mill
ion
` in
Mill
ion
` in
Mill
ion
` in
Mill
ion
` in
Mill
ion
Purc
hase
of
good
s 3
41.6
5 -
3
.39
93.
63
-
-
-
-
-
438
.67
(32
0.34
) (
- )
(
4.72
) (
46.5
1) (
- )
(
- )
(
- )
(
- )
(
- )
(
371.
57)
Sale
of
good
s 2
74.3
4 -
-
7
53.5
4 -
-
-
-
-
1
,027
.88
(47
1.64
) (
- )
(
- )
(
980.
03)
( -
)
( -
)
( -
)
( -
)
(5.
82)
(1,
457.
49)
Inco
me
from
ser
vice
s 2
4.45
-
-
1
6.50
-
-
-
-
-
4
0.95
(
24.9
1) (
0.19
) (
- )
(
8.48
) (
- )
(
- )
(
- )
(
- )
(
- )
(
33.5
8)O
rder
Can
cella
tion
Cha
rges
rec
eive
d -
-
-
-
-
-
-
-
-
-
(
- )
(
- )
(
- )
(
1.63
) (
- )
(
- )
(
- )
(
- )
(
- )
(
1.63
)Si
te e
xpen
ses
paid
3.4
3 -
-
1
.06
-
-
-
-
-
4.4
9 (
3.75
) (
- )
(
- )
(
3.83
) (
- )
(
- )
(
- )
(
- )
(
- )
(
7.58
)C
omm
issi
on i
ncom
e 1
9.49
-
-
1
.60
-
-
-
-
-
21.
09
(26
.66)
( -
)
( -
)
(3.
14)
( -
)
( -
)
( -
)
( -
)
( -
)
(29
.80)
Com
mis
sion
pai
d 7
1.60
-
-
-
-
-
-
-
-
7
1.60
(
86.0
4) (
- )
(
- )
(
- )
(
- )
(
- )
(
- )
(
- )
(
- )
(
86.0
4)D
ivid
end
rece
ived
-
-
22.
05
-
-
-
-
-
-
22.
05
( -
)
(40
.00)
(31
.24)
( -
)
( -
)
( -
)
( -
)
( -
)
( -
)
(71
.24)
Cha
rges
pai
d fo
r te
chni
cal
/ 8
0.43
-
-
7
.07
-
-
-
-
-
87.
50
Prof
essi
onal
ser
vice
s (
73.4
1) (
- )
(
- )
(
4.84
) (
- )
(
- )
(
- )
(
- )
(
- )
(
78.2
5)R
oyal
ty p
aid
80.
87
-
-
0.5
4 -
-
-
-
-
8
1.41
(
90.5
0) (
- )
(
- )
(
0.37
) (
- )
(
- )
(
- )
(
- )
(
- )
(
90.8
7)W
arra
nty
char
ges
paid
-
-
-
1.3
7 -
-
-
-
-
1
.37
( -
)
( -
)
( -
)
( -
)
( -
)
( -
)
( -
)
( -
)
( -
)
-
Ren
t re
ceiv
ed
-
0.0
6 2
.05
-
-
-
-
-
-
2.1
1 (
- )
(
0.06
) (
1.61
) (
- )
(
- )
(
- )
(
- )
(
- )
(
- )
(
1.67
)R
ecov
ery
of e
xpen
ses
1.0
7 0
.66
11.
67
1.5
1 -
-
-
-
-
1
4.91
(
2.67
) (
0.70
) (
11.7
2) (
1.94
) (
- )
(
- )
(
- )
(
- )
(
- )
(
17.0
3)
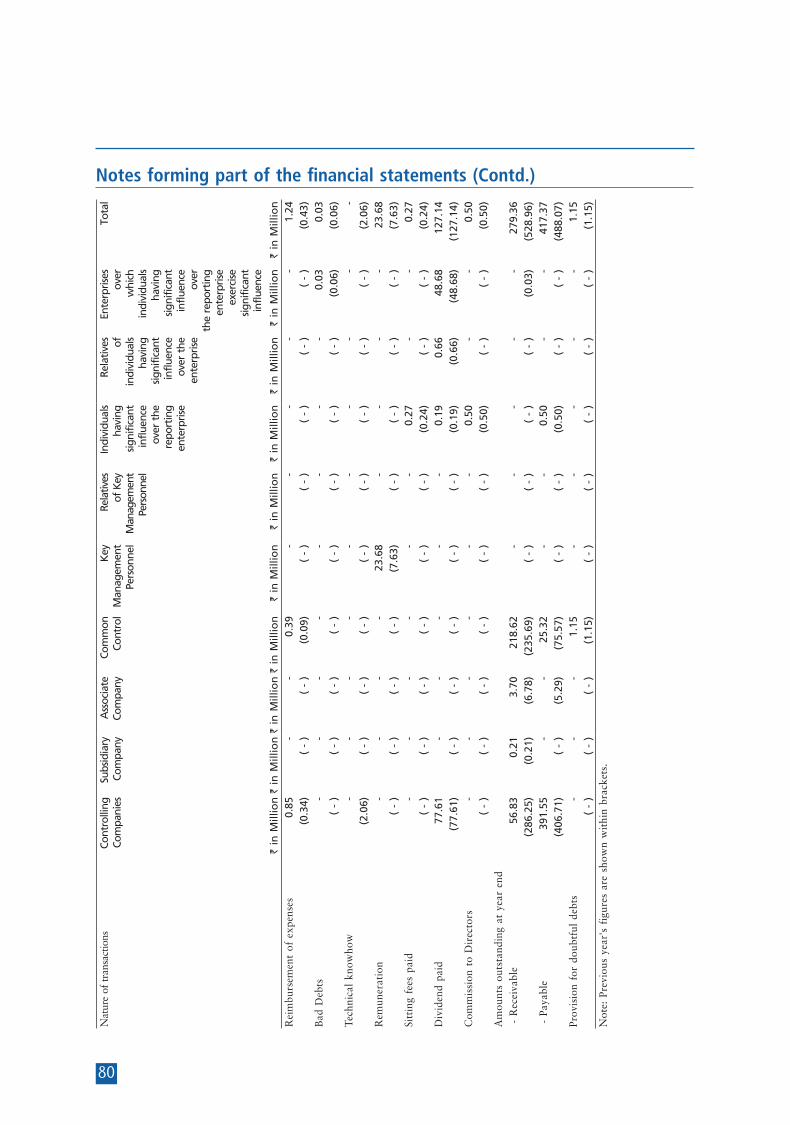
80
Notes forming part of the financial statements (Contd.)
Nat
ure
of t
rans
actio
nsCo
ntro
lling
Com
pani
esSu
bsid
iary
Com
pany
Ass
ocia
teCo
mpa
nyCo
mm
onCo
ntro
lK
eyM
anag
emen
tPe
rson
nel
Rela
tives
of K
eyM
anag
emen
tPe
rson
nel
Indi
vidu
als
havi
ng
sign
ific
ant
infl
uenc
e ov
er t
he
repo
rtin
gen
terp
rise
Rela
tive
s of
indi
vidu
als
havi
ng
sign
ific
ant
infl
uenc
e ov
er t
he
ente
rpri
se
Ente
rpri
ses
over
whi
ch
indi
vidu
als
havi
ngsi
gnif
ican
t in
flue
nce
over
th
e re
port
ing
ente
rpri
se
exer
cise
sign
ific
ant
infl
uenc
e
Tota
l
` in
Mill
ion
` in
Mill
ion
` in
Mill
ion
` in
Mill
ion
` in
Mill
ion
` in
Mill
ion
` in
Mill
ion
` in
Mill
ion
` in
Mill
ion
` in
Mill
ion
Rei
mbu
rsem
ent
of e
xpen
ses
0.8
5 -
-
0
.39
-
-
-
-
-
1.2
4 (
0.34
) (
- )
(
- )
(
0.09
) (
- )
(
- )
(
- )
(
- )
(
- )
(
0.43
)B
ad D
ebts
-
-
-
-
-
-
-
-
0.0
3 0
.03
( -
)
( -
)
( -
)
( -
)
( -
)
( -
)
( -
)
( -
)
(0.
06)
(0.
06)
Tech
nica
l kn
owho
w -
-
-
-
-
-
-
-
-
-
(
2.06
) (
- )
(
- )
(
- )
(
- )
(
- )
(
- )
(
- )
(
- )
(
2.06
)R
emun
erat
ion
-
-
-
-
23.
68
-
-
-
-
23.
68
( -
)
( -
)
( -
)
( -
)
(7.
63)
( -
)
( -
)
( -
)
( -
)
(7.
63)
Sitt
ing
fees
pai
d -
-
-
-
-
-
0
.27
-
-
0.2
7 (
- )
(
- )
(
- )
(
- )
(
- )
(
- )
(
0.24
) (
- )
(
- )
(
0.24
)D
ivid
end
paid
77.
61
-
-
-
-
-
0.1
9 0
.66
48.
68
127
.14
(77
.61)
( -
)
( -
)
( -
)
( -
)
( -
)
(0.
19)
(0.
66)
(48
.68)
(12
7.14
)C
omm
issi
on t
o D
irec
tors
-
-
-
-
-
-
0.5
0 -
-
0
.50
( -
)
( -
)
( -
)
( -
)
( -
)
( -
)
(0.
50)
( -
)
( -
)
(0.
50)
Am
ount
s ou
tsta
ndin
g at
yea
r en
d -
Rec
eiva
ble
56.
83
0.2
1 3
.70
218
.62
-
-
-
-
-
279
.36
(28
6.25
) (
0.21
) (
6.78
) (
235.
69)
( -
)
( -
)
( -
)
( -
)
(0.
03)
(52
8.96
) -
Pay
able
391
.55
-
-
25.
32
-
-
0.5
0 -
-
4
17.3
7 (
406.
71)
( -
)
(5.
29)
(75
.57)
( -
)
( -
)
(0.
50)
( -
)
( -
)
(48
8.07
)Pr
ovis
ion
for
doub
tful
deb
ts -
-
-
1
.15
-
-
-
-
-
1.1
5 (
- )
(
- )
(
- )
(
1.15
) (
- )
(
- )
(
- )
(
- )
(
- )
(
1.15
)N
ote:
Pre
viou
s ye
ar's
fig
ures
are
sho
wn
wit
hin
brac
kets
.
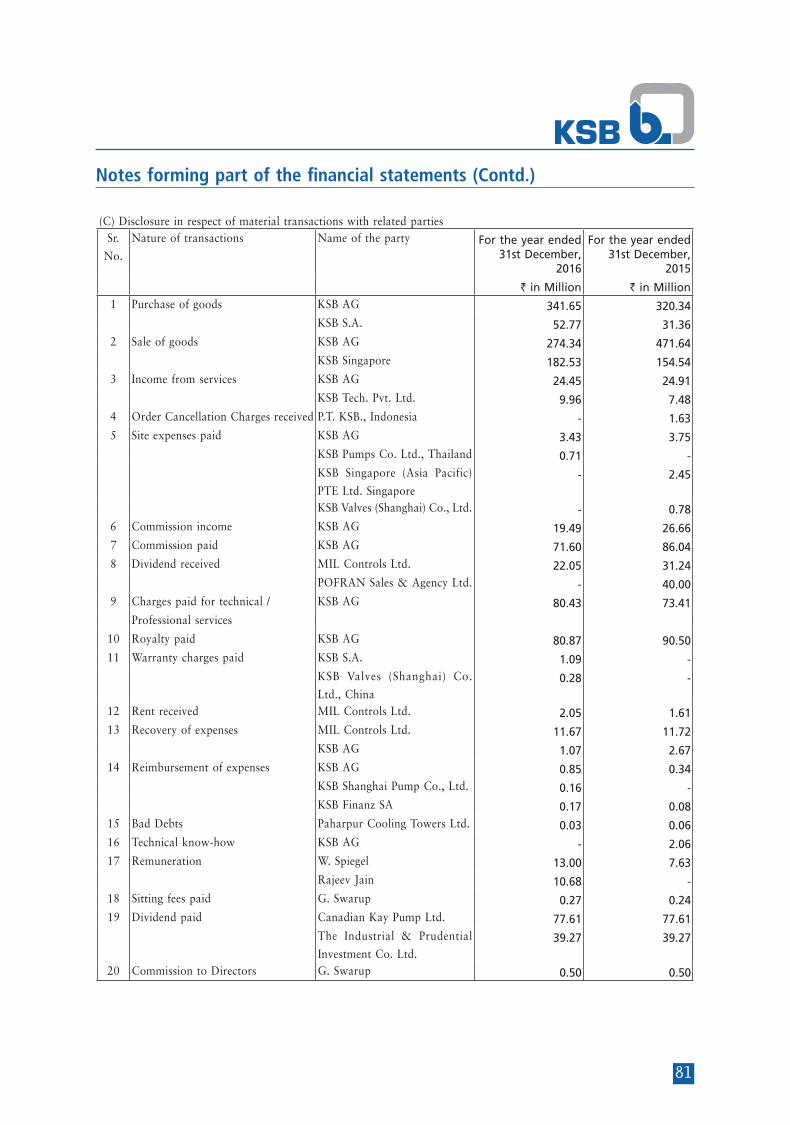
81
Notes forming part of the financial statements (Contd.)
(C) Disclosure in respect of material transactions with related partiesSr.
No.
Nature of transactions Name of the party For the year ended 31st December,
2016
For the year ended 31st December,
2015
` in Million ` in Million 1 Purchase of goods KSB AG 341.65 320.34
KSB S.A. 52.77 31.36 2 Sale of goods KSB AG 274.34 471.64
KSB Singapore 182.53 154.54 3 Income from services KSB AG 24.45 24.91
KSB Tech. Pvt. Ltd. 9.96 7.48 4 Order Cancellation Charges received P.T. KSB., Indonesia - 1.63 5 Site expenses paid KSB AG 3.43 3.75
KSB Pumps Co. Ltd., Thailand 0.71 - KSB Singapore (Asia Pacific)
PTE Ltd. Singapore - 2.45
KSB Valves (Shanghai) Co., Ltd. - 0.78 6 Commission income KSB AG 19.49 26.66 7 Commission paid KSB AG 71.60 86.04 8 Dividend received MIL Controls Ltd. 22.05 31.24
POFRAN Sales & Agency Ltd. - 40.00 9 Charges paid for technical / KSB AG 80.43 73.41
Professional services
10 Royalty paid KSB AG 80.87 90.50 11 Warranty charges paid KSB S.A. 1.09 -
KSB Valves (Shanghai) Co.
Ltd., China 0.28 -
12 Rent received MIL Controls Ltd. 2.05 1.61 13 Recovery of expenses MIL Controls Ltd. 11.67 11.72
KSB AG 1.07 2.67 14 Reimbursement of expenses KSB AG 0.85 0.34
KSB Shanghai Pump Co., Ltd. 0.16 - KSB Finanz SA 0.17 0.08
15 Bad Debts Paharpur Cooling Towers Ltd. 0.03 0.06 16 Technical know-how KSB AG - 2.06 17 Remuneration W. Spiegel 13.00 7.63
Rajeev Jain 10.68 - 18 Sitting fees paid G. Swarup 0.27 0.24 19 Dividend paid Canadian Kay Pump Ltd. 77.61 77.61
The Industrial & Prudential
Investment Co. Ltd. 39.27 39.27
20 Commission to Directors G. Swarup 0.50 0.50
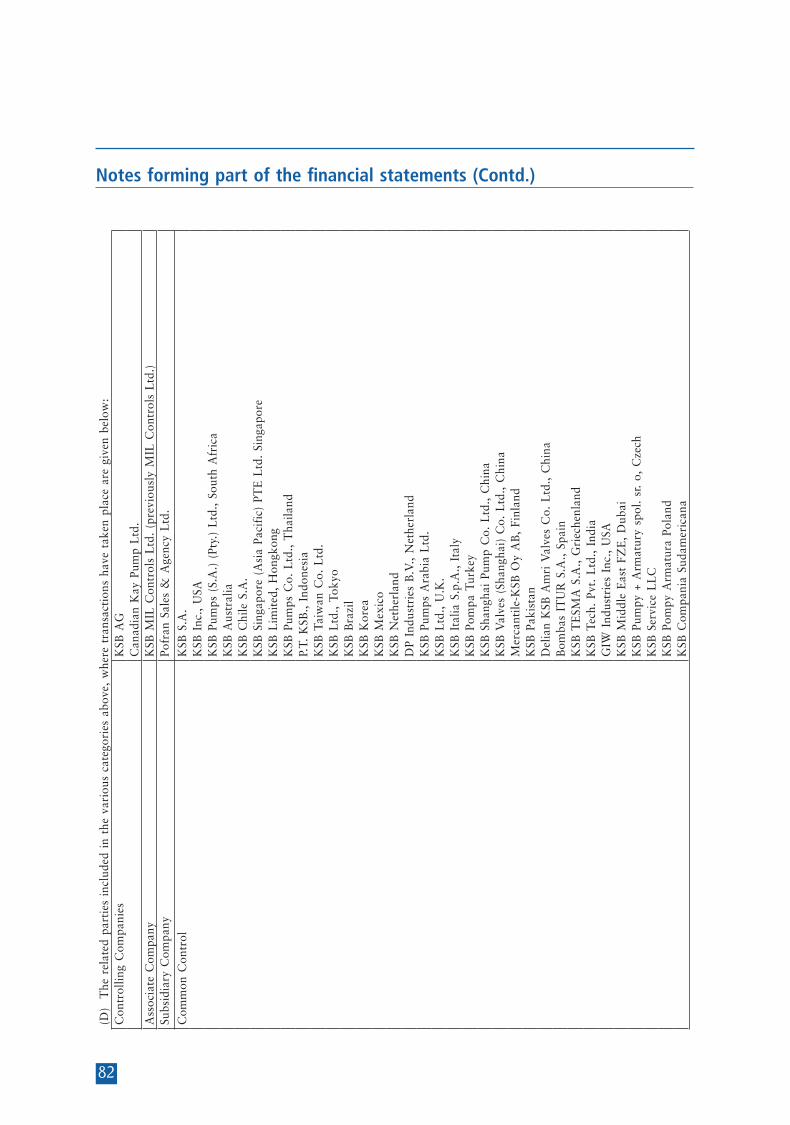
82
Notes forming part of the financial statements (Contd.)
(D)
The
rel
ated
par
ties
inc
lude
d in
the
var
ious
cat
egor
ies
abov
e, w
here
tra
nsac
tion
s ha
ve t
aken
pla
ce a
re g
iven
bel
ow:
Con
trol
ling
Com
pani
esK
SB A
GC
anad
ian
Kay
Pum
p L
td.
Ass
ocia
te C
ompa
nyK
SB M
IL C
ontr
ols
Ltd
. (p
revi
ousl
y M
IL C
ontr
ols
Ltd
.)Su
bsid
iary
Com
pany
Pofr
an S
ales
& A
genc
y L
td.
Com
mon
Con
trol
KSB
S.A
.K
SB I
nc.,
USA
KSB
Pum
ps (
S.A
.) (
Pty.
) L
td.,
Sout
h A
fric
aK
SB A
ustr
alia
KSB
Chi
le S
.A.
KSB
Sin
gapo
re (
Asi
a Pa
cifi
c) P
TE
Ltd
. Si
ngap
ore
KSB
Lim
ited
, H
ongk
ong
KSB
Pum
ps C
o. L
td.,
Tha
iland
P.T.
KSB
., In
done
sia
KSB
Tai
wan
Co.
Ltd
.K
SB L
td.,
Toky
oK
SB B
razi
lK
SB K
orea
K
SB M
exic
oK
SB N
ethe
rlan
dD
P In
dust
ries
B.V
., N
ethe
rlan
dK
SB P
umps
Ara
bia
Ltd
.K
SB L
td.,
U.K
.K
SB I
talia
S.p
.A.,
Ital
yK
SB P
ompa
Tur
key
KSB
Sha
ngha
i Pu
mp
Co.
Ltd
., C
hina
KSB
Val
ves
(Sha
ngha
i) C
o. L
td.,
Chi
naM
erca
ntile
-KSB
Oy
AB
, Fi
nlan
dK
SB P
akis
tan
Del
ian
KSB
Am
ri V
alve
s C
o. L
td.,
Chi
naB
omba
s IT
UR
S.A
., Sp
ain
KSB
TE
SMA
S.A
., G
riec
henl
and
KSB
Tec
h. P
vt.
Ltd
., In
dia
GIW
Ind
ustr
ies
Inc.
, U
SAK
SB M
iddl
e E
ast
FZE
, D
ubai
KSB
Pum
py +
Arm
atur
y sp
ol.
sr.
o, C
zech
KSB
Ser
vice
LL
CK
SB P
ompy
Arm
atur
a Po
land
KSB
Com
pani
a Su
dam
eric
ana
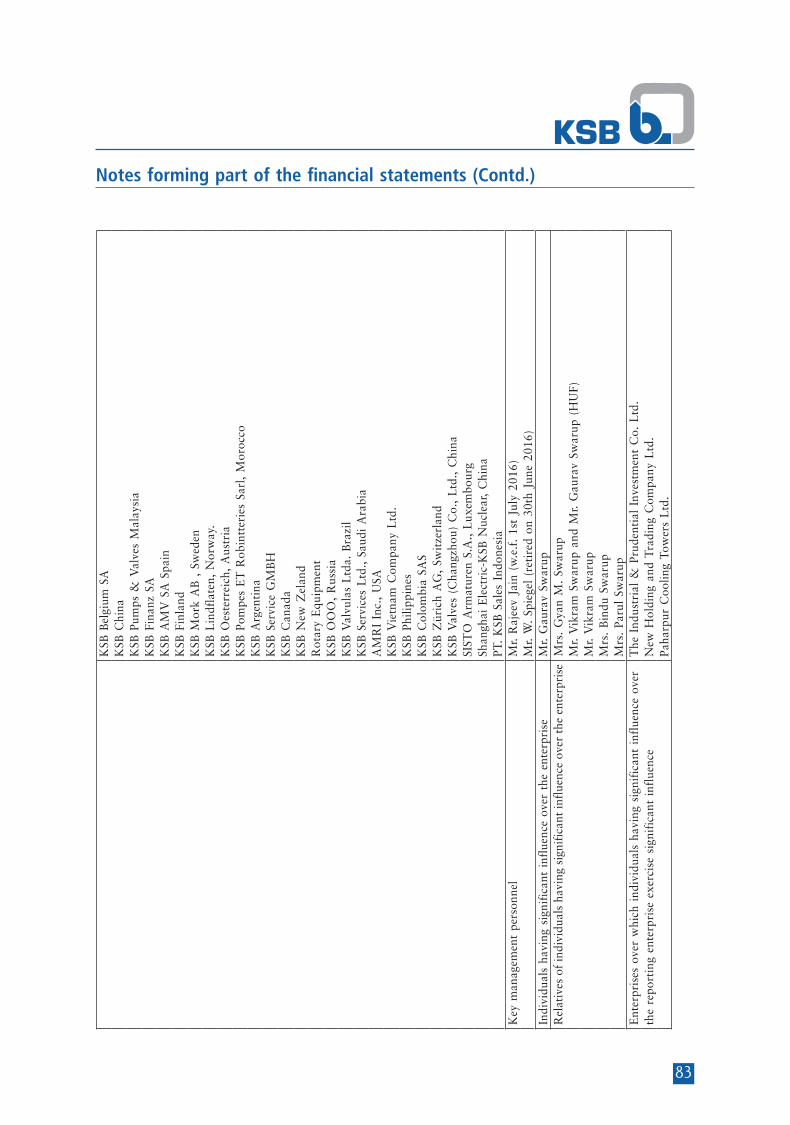
83
Notes forming part of the financial statements (Contd.)
KSB
Bel
gium
SA
KSB
Chi
naK
SB P
umps
& V
alve
s M
alay
sia
KSB
Fin
anz
SAK
SB A
MV
SA
Spa
inK
SB F
inla
ndK
SB M
ork
AB
, S
wed
enK
SB L
indf
late
n, N
orw
ay.
KSB
Oes
terr
eich
, A
ustr
iaK
SB P
ompe
s E
T R
obin
tter
ies
Sarl
, M
oroc
coK
SB A
rgen
tina
KSB
Ser
vice
GM
BH
KSB
Can
ada
KSB
New
Zel
and
Rot
ary
Equ
ipm
ent
KSB
OO
O,
Rus
sia
KSB
Val
vula
s L
tda.
Bra
zil
KSB
Ser
vice
s L
td.,
Saud
i A
rabi
aA
MR
I In
c.,
USA
KSB
Vie
tnam
Com
pany
Ltd
.K
SB P
hilip
pine
sK
SB C
olom
bia
SAS
KSB
Zür
ich
AG
, Sw
itze
rlan
dK
SB V
alve
s (C
hang
zhou
) C
o.,
Ltd
., C
hina
SIST
O A
rmat
uren
S.A
., L
uxem
bour
gSh
angh
ai E
lect
ric-
KSB
Nuc
lear
, C
hina
PT.
KSB
Sal
es I
ndon
esia
Key
man
agem
ent
pers
onne
lM
r. R
ajee
v Ja
in (
w.e
.f.
1st
July
201
6)M
r. W
. Sp
iege
l (r
etir
ed o
n 30
th J
une
2016
)In
divi
dual
s ha
ving
sig
nifi
cant
inf
luen
ce o
ver
the
ente
rpri
seM
r. G
aura
v Sw
arup
Rel
ativ
es o
f in
divi
dual
s ha
ving
sig
nifi
cant
infl
uenc
e ov
er t
he e
nter
pris
eM
rs.
Gya
n M
. Sw
arup
Mr.
Vik
ram
Sw
arup
and
Mr.
Gau
rav
Swar
up (
HU
F)M
r. V
ikra
m S
war
upM
rs.
Bin
du S
war
upM
rs.
Paru
l Sw
arup
Ent
erpr
ises
ove
r w
hich
ind
ivid
uals
hav
ing
sign
ific
ant
infl
uenc
e ov
er
The
Ind
ustr
ial
& P
rude
ntia
l In
vest
men
t C
o. L
td.
the
repo
rtin
g en
terp
rise
exe
rcis
e si
gnif
ican
t in
flue
nce
New
Hol
ding
and
Tra
ding
Com
pany
Ltd
. Pa
harp
ur C
oolin
g To
wer
s L
td.
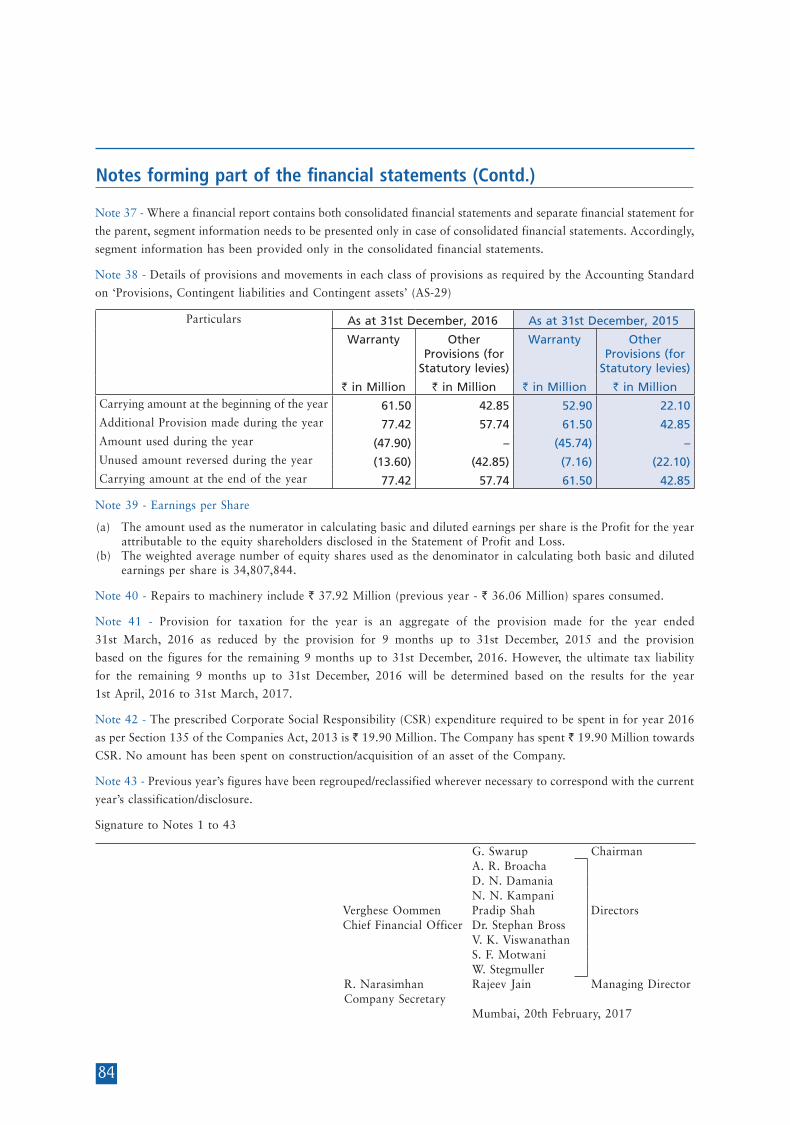
84
Notes forming part of the financial statements (Contd.)
Note 37 - Where a financial report contains both consolidated financial statements and separate financial statement for
the parent, segment information needs to be presented only in case of consolidated financial statements. Accordingly,
segment information has been provided only in the consolidated financial statements.
Note 38 - Details of provisions and movements in each class of provisions as required by the Accounting Standard
on ‘Provisions, Contingent liabilities and Contingent assets’ (AS-29)
Particulars As at 31st December, 2016 As at 31st December, 2015
Warranty Other Provisions (for
Statutory levies)
Warranty Other Provisions (for
Statutory levies)
` in Million ` in Million ` in Million ` in MillionCarrying amount at the beginning of the year 61.50 42.85 52.90 22.10 Additional Provision made during the year 77.42 57.74 61.50 42.85 Amount used during the year (47.90) – (45.74) – Unused amount reversed during the year (13.60) (42.85) (7.16) (22.10)Carrying amount at the end of the year 77.42 57.74 61.50 42.85
Note 39 - Earnings per Share
(a) The amount used as the numerator in calculating basic and diluted earnings per share is the Profit for the year attributable to the equity shareholders disclosed in the Statement of Profit and Loss.
(b) The weighted average number of equity shares used as the denominator in calculating both basic and diluted earnings per share is 34,807,844.
Note 40 - Repairs to machinery include ` 37.92 Million (previous year - ` 36.06 Million) spares consumed.
Note 41 - Provision for taxation for the year is an aggregate of the provision made for the year ended
31st March, 2016 as reduced by the provision for 9 months up to 31st December, 2015 and the provision
based on the figures for the remaining 9 months up to 31st December, 2016. However, the ultimate tax liability
for the remaining 9 months up to 31st December, 2016 will be determined based on the results for the year
1st April, 2016 to 31st March, 2017.
Note 42 - The prescribed Corporate Social Responsibility (CSR) expenditure required to be spent in for year 2016
as per Section 135 of the Companies Act, 2013 is ` 19.90 Million. The Company has spent ` 19.90 Million towards
CSR. No amount has been spent on construction/acquisition of an asset of the Company.
Note 43 - Previous year’s figures have been regrouped/reclassified wherever necessary to correspond with the current
year’s classification/disclosure.
Signature to Notes 1 to 43
G. Swarup ChairmanA. R. BroachaD. N. DamaniaN. N. Kampani
Verghese Oommen Pradip Shah Directors Chief Financial Officer Dr. Stephan Bross
V. K. ViswanathanS. F. MotwaniW. Stegmuller
R. Narasimhan Rajeev Jain Managing Director Company Secretary
Mumbai, 20th February, 2017

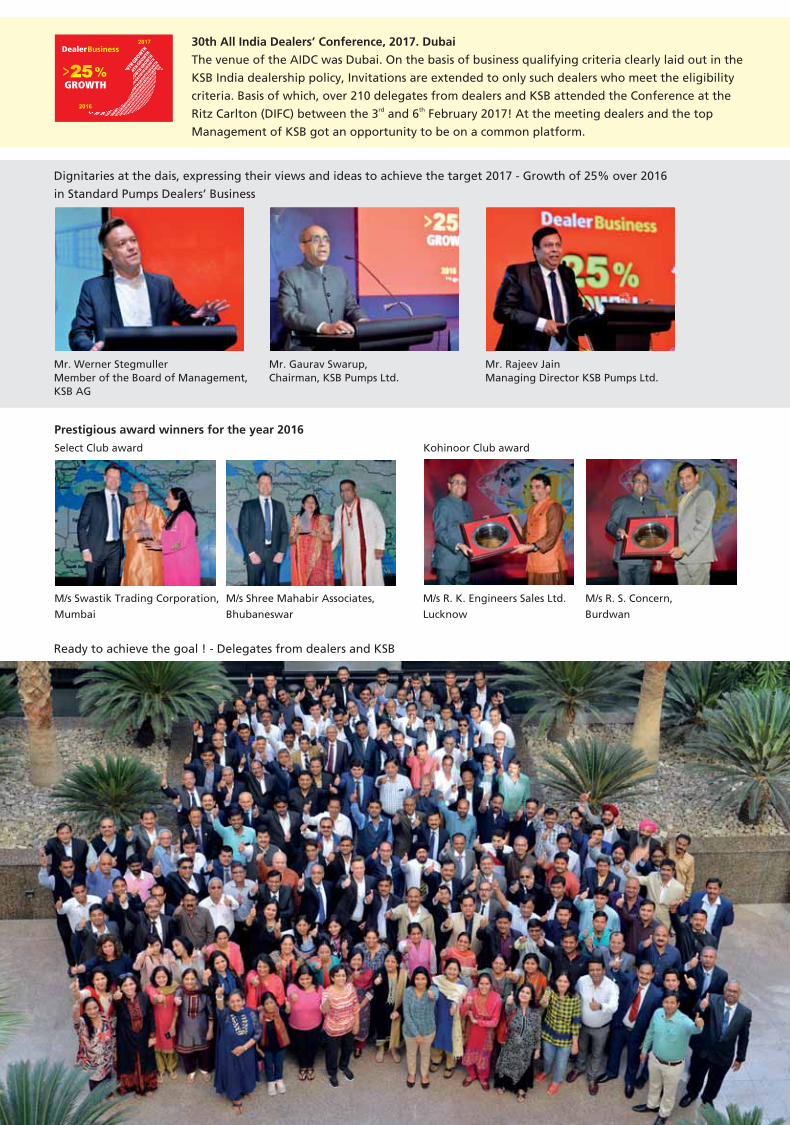
85
INDEPENDENT AUDITOR’S REPORT
To The Members Of KSB PUMPS LIMITED
Report on the Consolidated Financial Statements
We have audited the accompanying consolidated financial statements of KSB PUMPS LIMITED (hereinafter referred to as “the Holding Company”) and its subsidiary (the Holding Company and its subsidiary together referred to as “the Group”) and its associate, comprising of the Consolidated Balance Sheet as at 31st December, 2016, the Consolidated Statement of Profit and Loss, the Consolidated Cash Flow Statement for the year then ended, and a summary of the significant accounting policies and other explanatory information (hereinafter referred to as “the consolidated financial statements”).
Management’s Responsibility for the Consolidated Financial Statements
The Holding Company’s Board of Directors is responsible for the preparation of these consolidated financial statements in terms of the requirements of the Companies Act, 2013 (hereinafter referred to as “the Act”) that give a true and fair view of the consolidated financial position, consolidated financial performance and consolidated cash flows of the Group including its Associate in accordance with the accounting principles generally accepted in India, including the Accounting Standards prescribed under Section 133 of the Act, as applicable. The respective Board of Directors of the companies included in the Group and of its associate are responsible for maintenance of adequate accounting records in accordance with the provisions of the Act for safeguarding the assets of the Group and for preventing and detecting frauds and other irregularities; the selection and application of appropriate accounting policies; making judgments and estimates that are reasonable and prudent; and the design, implementation and maintenance of adequate internal financial controls, that were operating effectively for ensuring the accuracy
and completeness of the accounting records, relevant to the preparation and presentation of the financial statements that give a true and fair view and are free from material misstatement, whether due to fraud or error, which have been used for the purpose of preparation of the consolidated financial statements by the Directors of the Holding Company, as aforesaid.
Auditor’s Responsibility
Our responsibility is to express an opinion on these consolidated financial statements based on our audit. While conducting the audit, we have taken into account the provisions of the Act, the accounting and auditing standards and matters which are required to be included in the audit report under the provisions of the Act and the Rules made thereunder.
We conducted our audit in accordance with the Standards on Auditing specified under Section 143(10) of the Act. Those Standards require that we comply with ethical requirements and plan and perform the audit to obtain reasonable assurance about whether the consolidated financial statements are free from material misstatement.
An audit involves performing procedures to obtain audit evidence about the amounts and the disclosures in the consolidated financial statements. The procedures selected depend on the auditor’s judgment, including the assessment of the risks of material misstatement of the consolidated financial statements, whether due to fraud or error. In making those risk assessments, the auditor considers internal financial control relevant to the Holding Company’s preparation of the consolidated financial statements that give a true and fair view in order to design audit procedures that are appropriate in the circumstances. An audit also includes evaluating the appropriateness of the accounting policies used and the reasonableness of the accounting estimates made by the Holding Company’s Board of Directors, as well as evaluating the overall presentation of the consolidated financial statements.
86
INDEPENDENT AUDITOR’S REPORT (Contd.)
We believe that the audit evidence obtained by us and the audit evidence obtained by the other auditors in terms of their reports referred to in sub-paragraph (a) of the Other Matters paragraph below, is sufficient and appropriate to provide a basis for our audit opinion on the consolidated financial statements.
Opinion
In our opinion and to the best of our information and according to the explanations given to us, the aforesaid consolidated financial statements give the information required by the Act in the manner so required and give a true and fair view in conformity with the accounting principles generally accepted in India, of the consolidated state of affairs of the Group and its associate as at 31st December, 2016, and their consolidated profit and their consolidated cash flows for the year ended on that date.
Other Matters
a) We did not audit the financial statements of Pofran Sales and Agency Limited, a subsidiary, whose financial statements reflect total assets of `53.97 million as at 31st December, 2016, total revenues of `12.89 million and net cash outflows amounting to `1.84 million for the year ended on that date, as considered in the consolidated financial statements. The consolidated financial statements also include the Group’s share of net profit of ` 49.43 million for the year ended 31st December, 2016, as considered in the consolidated financial statements, in respect of an associate, whose financial statements have not been audited by us. These financial statements have been audited by other auditors whose reports have been furnished to us by the Management and our opinion on the consolidated financial statements, in so far as it relates to the amounts and disclosures included in respect of this subsidiary and associate, is based solely on the reports of the other auditors.
Our opinion on the consolidated financial statements, and our report on Other Legal and Regulatory Requirements below is not modified in respect of the above matters with respect to our reliance on the work done and the reports of the other auditors.
Report on Other Legal and Regulatory Requirements
1. As required by Section 143(3) of the Act, we report, to the extent applicable, that:
a) We have sought and obtained all the information and explanations which to the best of our knowledge and belief were necessary for the purposes of our audit of the aforesaid consolidated financial statements.
b) In our opinion, proper books of account as required by law relating to preparation of the aforesaid consolidated financial statements have been kept so far as it appears from our examination of those books and the reports of the other auditors.
c) The Consolidated Balance Sheet, the Consolidated Statement of Profit and Loss, and the Consolidated Cash Flow Statement dealt with by this Report are in agreement with the relevant books of account maintained for the purpose of preparation of the consolidated financial statements.
d) In our opinion, the aforesaid consolidated financial statements comply with the Accounting Standards prescribed under Section 133 of the Act, as applicable.
e) On the bas i s o f the wr i t t en representations received from the directors of the Holding Company as on 31st December, 2016 taken on record by the Board of Directors of the Holding Company and the reports of the statutory auditors of its subsidiary company, and associate
87
INDEPENDENT AUDITOR’S REPORT (Contd.)
company incorporated in India, none of the directors of the Group companies, its associate company incorporated in India is disqual i f ied as on 31st December, 2016 from being appointed as a director in terms of Section 164 (2) of the Act.
f) With respect to the adequacy of the internal financial controls over financial reporting and the operating effectiveness of such controls, refer to our Report in “Annexure A”, which is based on the auditors’ reports of the Holding company, subsidiary company and associate company incorporated in India. Our report expresses an unmodified opinion on the adequacy and operating effectiveness of the Holding company’s, subsidiary company’s and associate company’s incorporated in India internal financial controls over financial reporting.
g) With respect to the other matters to be included in the Auditor’s Report in accordance with Rule 11 of the Companies (Audit and Auditor’s) Rules, 2014, in our opinion and to the best of our information and according to the explanations given to us:
i. The consol idated f inanc ia l statements disclose the impact of pending litigations on the consolidated financial position of the Group and its associate. Refer Note 26 to the consolidated financial statements
ii. The Group and its associate did not have any material foreseeable losses on long-term contracts including derivative contracts.
iii. There has been no delay in transferring amounts, required to be transferred, to the Investor Education and Protection Fund by the Holding Company and its subsidiary company and associate company incorporated in India.
For Deloitte Haskins & Sells LLPChartered Accountants
(Firm’s Registration No.:117366W/W-100018)
Nilesh H LahotiPartner
Membership No. 130054
Mumbai, 20th February, 2017

88
ANNEXURE “A” TO THE INDEPENDENT AUDITOR’S REPORT
(Referred to in paragraph 1(f) under ‘Report on Other Legal and Regulatory Requirements’ of our report of even date)
Report on the Internal Financial Controls Over Financial Reporting under Clause (i) of Sub-section 3 of Section 143 of the Companies Act, 2013 (“the Act”)
In conjunction with our audit of the consolidated financial statements of the Company as of and for the year ended 31st December, 2016, we have audited the internal financial controls over financial reporting of the Holding Company and its subsidiary company and its associate company, which are companies incorporated in India, as of that date.
Management’s Responsibility for Internal Financial Controls
The respective Board of Directors of the Holding company, its subsidiary company and its associate company, which are companies incorporated in India, are responsible for establishing and maintaining internal financial controls based on the internal control over financial reporting criteria established by the Company considering the essential components of internal control stated in the Guidance Note on Audit of Internal Financial Controls Over Financial Reporting issued by the Institute of Chartered Accountants of India (ICAI). These responsibilities include the design, implementation and maintenance of adequate internal financial controls that were operating effectively for ensuring the orderly and efficient conduct of its business, including adherence to the respective company’s policies, the safeguarding of its assets, the prevention and detection of frauds and errors, the accuracy and completeness of the accounting records, and the timely preparation of reliable financial information, as required under the Companies Act, 2013.
Auditor’s Responsibility
Our responsibility is to express an opinion on the Company's internal financial controls over financial reporting based on our audit. We conducted our audit in accordance with the Guidance Note on Audit of Internal Financial Controls Over Financial Reporting (the “Guidance Note”) issued by the Institute of Chartered Accountants of India and the Standards on Auditing, prescribed under Section 143(10) of the Companies Act, 2013, to the extent applicable to an audit of internal financial controls. Those Standards and the Guidance Note require that we comply with ethical requirements and plan and perform the audit to obtain reasonable assurance about whether adequate internal financial controls over financial reporting was established and maintained and if such controls operated effectively in all material respects.
Our audit involves performing procedures to obtain audit evidence about the adequacy of the internal financial controls system over financial reporting and their operating effectiveness. Our audit of internal financial controls over financial reporting included obtaining an understanding of internal financial controls over financial reporting, assessing the risk that a material weakness exists, and testing and evaluating the design and operating effectiveness of internal control based on the assessed risk. The procedures selected depend on the auditor’s judgement, including the assessment of the risks of material misstatement of the financial statements, whether due to fraud or error.
We believe that the audit evidence we have obtained and the audit evidence obtained by the other auditors of the subsidiary company and associate company, which are companies incorporated in India, in terms of their reports referred to in the Other Matters paragraph below, is sufficient and appropriate to provide a basis for our audit opinion on the Company’s internal financial controls system over financial reporting.
89
ANNEXURE “A” TO THE INDEPENDENT AUDITOR’S REPORT (CONTD.)
Meaning of Internal Financial Controls Over Financial Reporting
A company's internal financial control over financial reporting is a process designed to provide reasonable assurance regarding the reliability of financial reporting and the preparation of financial statements for external purposes in accordance with generally accepted accounting principles. A company's internal financial control over financial reporting includes those policies and procedures that (1) pertain to the maintenance of records that, in reasonable detail, accurately and fairly reflect the transactions and dispositions of the assets of the company; (2) provide reasonable assurance that transactions are recorded as necessary to permit preparation of financial statements in accordance with generally accepted accounting principles, and that receipts and expenditures of the company are being made only in accordance with authorisations of management and directors of the company; and (3) provide reasonable assurance regarding prevention or timely detection of unauthorised acquisition, use, or disposition of the company's assets that could have a material effect on the financial statements.
Inherent Limitations of Internal Financial Controls Over Financial Reporting
Because of the inherent limitations of internal financial controls over financial reporting, including the possibility of collusion or improper management override of controls, material misstatements due to error or fraud may occur and not be detected. Also, projections of any evaluation of the internal financial controls over financial reporting to future periods are subject to the risk that the internal financial control over financial reporting may become inadequate because of changes in conditions, or that the degree of compliance with the policies or procedures may deteriorate.
Opinion
In our opinion to the best of our information and according to the explanations given to us, the Holding Company, its subsidiary company and its associate company, which are companies incorporated in India, have, in all material respects, an adequate internal financial controls system over financial reporting and such internal financial controls over financial reporting were operating effectively as at 31st December, 2016, based on the internal control over financial reporting criteria established by the Company considering the essential components of internal control stated in the Guidance Note on Audit of Internal Financial Controls Over Financial Reporting issued by the Institute of Chartered Accountants of India.
Other Matters
Our aforesaid report under Section 143(3)(i) of the Act on the adequacy and operating effectiveness of the internal financial controls over financial reporting insofar as it relates to one subsidiary company and one associate company, which are companies incorporated in India, is based on the corresponding reports of the auditors of such companies incorporated in India.
For Deloitte Haskins & Sells LLPChartered Accountants
(Firm’s Registration No.:117366W/W-100018)
Nilesh H LahotiPartner
Membership No. 130054
Mumbai, 20th February, 2017

90
Consolidated Balance Sheet as at 31st December, 2016
Particulars Note No.
As at 31st December, 2016
As at 31st December, 2015
` in Million ` in Million I EQUITY AND LIABILITIES (1) Shareholders’ funds
(a) Share capital 3 348.08 348.08 (b) Reserves and surplus 4 6,102.96 5,680.38
6,451.04 6,028.46 (2) Non-current liabilities
(a) Other long-term liabilities 5 75.42 70.42 (b) Long-term provisions 6 356.66 294.47
432.08 364.89 (3) Current liabilities
(a) Short-term borrowings 7 51.84 12.97 (b) Trade payables 8 Total outstanding dues of micro enterprises
and small enterprises 0.24 0.47 Others 1,725.33 1,545.25 (c) Other current liabilities 9 1,023.97 1,075.68 (d) Short-term provisions 10 446.56 479.08
3,247.94 3,113.45 TOTAL 10,131.06 9,506.80
II ASSETS (1) Non-current assets
(a) Fixed assets (i) Tangible assets 11.A 2,163.08 1,930.42 (ii) Intangible assets 11.B 23.23 10.14 (iii) Capital work-in-progress 164.95 142.18
2,351.26 2,082.74 (b) Non-current investments 12 541.05 513.67 (c) Deferred tax assets (net) 13 157.04 127.82 (d) Long-term loans and advances 14 704.42 493.20
3,753.77 3,217.43 (2) Current assets
(a) Inventories 15 2,118.63 1,826.41 (b) Trade receivables 16 1,801.07 1,783.73 (c) Cash and cash equivalents 17 2,021.84 2,283.62 (d) Short-term loans and advances 18 386.55 354.05 (e) Other current assets 19 49.20 41.56
6,377.29 6,289.37 TOTAL 10,131.06 9,506.80
See accompanying notes forming part of the financial statements
In terms of our report attached G. Swarup ChairmanFor Deloitte Haskins & Sells LLP A. R. BroachaChartered Accountants D. N. Damania
N. N. KampaniNilesh H Lahoti Verghese Oommen Pradip Shah Directors(Partner) Cheif Financial Officer Dr. Stephan Bross
V. K. ViswanathanS. F. MotwaniW. Stegmuller
R. Narasimhan Rajeev Jain Managing Director Company Secretary
Mumbai, 20th February, 2017 Mumbai, 20th February, 2017

91
Consolidated Statement of Profit and Loss for the year ended 31st December, 2016
In terms of our report attached G. Swarup ChairmanFor Deloitte Haskins & Sells LLP A. R. BroachaChartered Accountants D. N. Damania
N. N. KampaniNilesh H Lahoti Verghese Oommen Pradip Shah Directors(Partner) Cheif Financial Officer Dr. Stephan Bross
V. K. ViswanathanS. F. MotwaniW. Stegmuller
R. Narasimhan Rajeev Jain Managing Director Company Secretary
Mumbai, 20th February, 2017 Mumbai, 20th February, 2017
Particulars Note No.
For the Year ended 31st
December, 2016
For the Year ended 31st
December, 2015
` in Million ` in Million 1 Revenue from operations (gross) 20 8,821.93 8,726.99
Less: Excise duty 20 (542.85) (519.72)Revenue from operations (net) 8,279.08 8,207.27
2 Other income 21 240.03 240.61 3 Total revenue (1+2) 8,519.11 8,447.88 4 Expenses
Cost of materials consumed 22.a 3,597.08 3,459.82 Purchases of stock-in-trade 392.73 308.72 Changes in inventories of finished goods, work-in-progress and stock-in-trade
22.b (117.67) 119.22
Employee benefits expense 23 1,448.60 1,248.52 Finance cost 24 17.23 17.35 Depreciation and amortisation expense 11.A &
11.B 293.58 277.67
Other expenses 25 1,987.14 2,031.02 Expenditure transferred to capital account (19.57) (19.30)Total expenses 7,599.12 7,443.02
5 Profit before tax (3 - 4) 919.99 1,004.86 6 Tax expense:
(a) Current tax 341.82 391.22 (b) Short / (excess) provision in respect of earlier years 3.83 - (c) Deferred tax (29.22) (27.60)
316.43 363.62 7 Profit for the year (5 - 6) 603.56 641.24 8 Add: Share of profit for the year in respect of investment
in Associate Company 49.43 46.08
652.99 687.32 9 Earnings per equity share (Face Value per share `10/-):
(1) Basic 34 18.76 19.75 (2) Diluted 34 18.76 19.75 See accompanying notes forming part of the financial statements
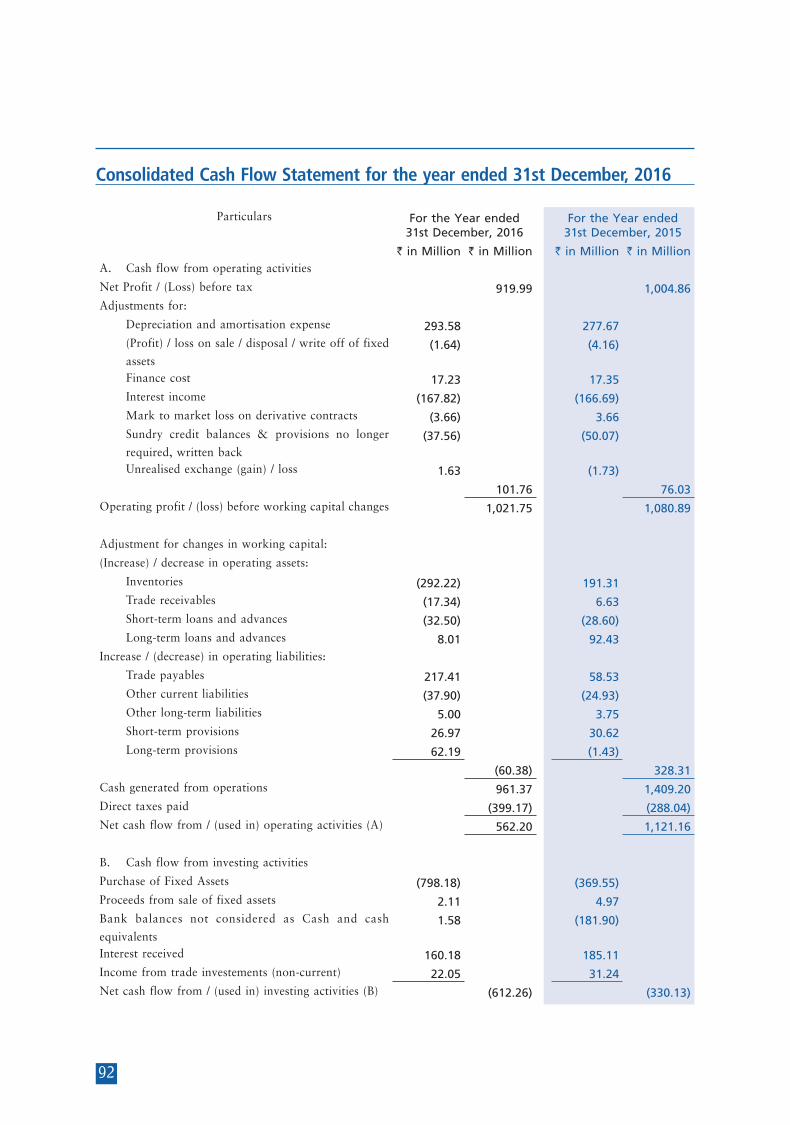
92
Consolidated Cash Flow Statement for the year ended 31st December, 2016
Particulars For the Year ended 31st December, 2016
For the Year ended 31st December, 2015
` in Million ` in Million ` in Million ` in Million A. Cash flow from operating activities
Net Profit / (Loss) before tax 919.99 1,004.86 Adjustments for:
Depreciation and amortisation expense 293.58 277.67 (Profit) / loss on sale / disposal / write off of fixed
assets(1.64) (4.16)
Finance cost 17.23 17.35 Interest income (167.82) (166.69) Mark to market loss on derivative contracts (3.66) 3.66 Sundry credit balances & provisions no longer
required, written back(37.56) (50.07)
Unrealised exchange (gain) / loss 1.63 (1.73)
101.76 76.03 Operating profit / (loss) before working capital changes 1,021.75 1,080.89
Adjustment for changes in working capital:
(Increase) / decrease in operating assets:
Inventories (292.22) 191.31 Trade receivables (17.34) 6.63 Short-term loans and advances (32.50) (28.60) Long-term loans and advances 8.01 92.43 Increase / (decrease) in operating liabilities:
Trade payables 217.41 58.53 Other current liabilities (37.90) (24.93) Other long-term liabilities 5.00 3.75 Short-term provisions 26.97 30.62 Long-term provisions 62.19 (1.43)
(60.38) 328.31 Cash generated from operations 961.37 1,409.20 Direct taxes paid (399.17) (288.04)Net cash flow from / (used in) operating activities (A) 562.20 1,121.16
B. Cash flow from investing activities
Purchase of Fixed Assets (798.18) (369.55)Proceeds from sale of fixed assets 2.11 4.97 Bank balances not considered as Cash and cash
equivalents 1.58 (181.90)
Interest received 160.18 185.11 Income from trade investements (non-current) 22.05 31.24 Net cash flow from / (used in) investing activities (B) (612.26) (330.13)

93
Consolidated Cash Flow Statement for the year ended 31st December, 2016 (Contd.)
Particulars For the Year ended 31st December, 2016
For the Year ended 31st December, 2015
` in Million ` in Million ` in Million ` in Million C. Cash flow from financing activities
Increase / (decrease) in Working capital borrowings 38.87 (230.82)Finance cost (17.23) (17.35)Dividends paid (191.44) (191.44)Tax on dividend (38.97) (38.97)Net cash flow from / (used in) financing activities (C) (208.77) (478.58)Unrealized exchange gain / (loss) in cash and cash
equivalents (D)(1.63) 1.73
Net increase / (decrease) in Cash and cash equivalents
(A + B + C + D)(260.46) 314.18
Cash and cash equivalents (Opening Balance) 521.02 206.84 Cash and cash equivalents (Closing Balance) 260.56 521.02
Cash and cash equivalents at the end of the year include: As at 31st December,
2016
As at 31st December,
2015
As at 31st December,
2014 (a) Cash on hand 0.58 0.71 0.64 (b) Balances with banks in current accounts 259.98 520.31 206.20 Cash and cash equivalents (Refer Note 17) 260.56 521.02 206.84
Other Bank balances (Refer Note 17) 1,761.28 1,762.60 1,580.66 Cash and Cash equivalents at the end of the year 2,021.84 2,283.62 1,787.50
In terms of our report attached G. Swarup ChairmanFor Deloitte Haskins & Sells LLP A. R. BroachaChartered Accountants D. N. Damania
N. N. KampaniNilesh H Lahoti Verghese Oommen Pradip Shah Directors(Partner) Cheif Financial Officer Dr. Stephan Bross
V. K. ViswanathanS. F. MotwaniW. Stegmuller
R. Narasimhan Rajeev Jain Managing Director Company Secretary
Mumbai, 20th February, 2017 Mumbai, 20th February, 2017
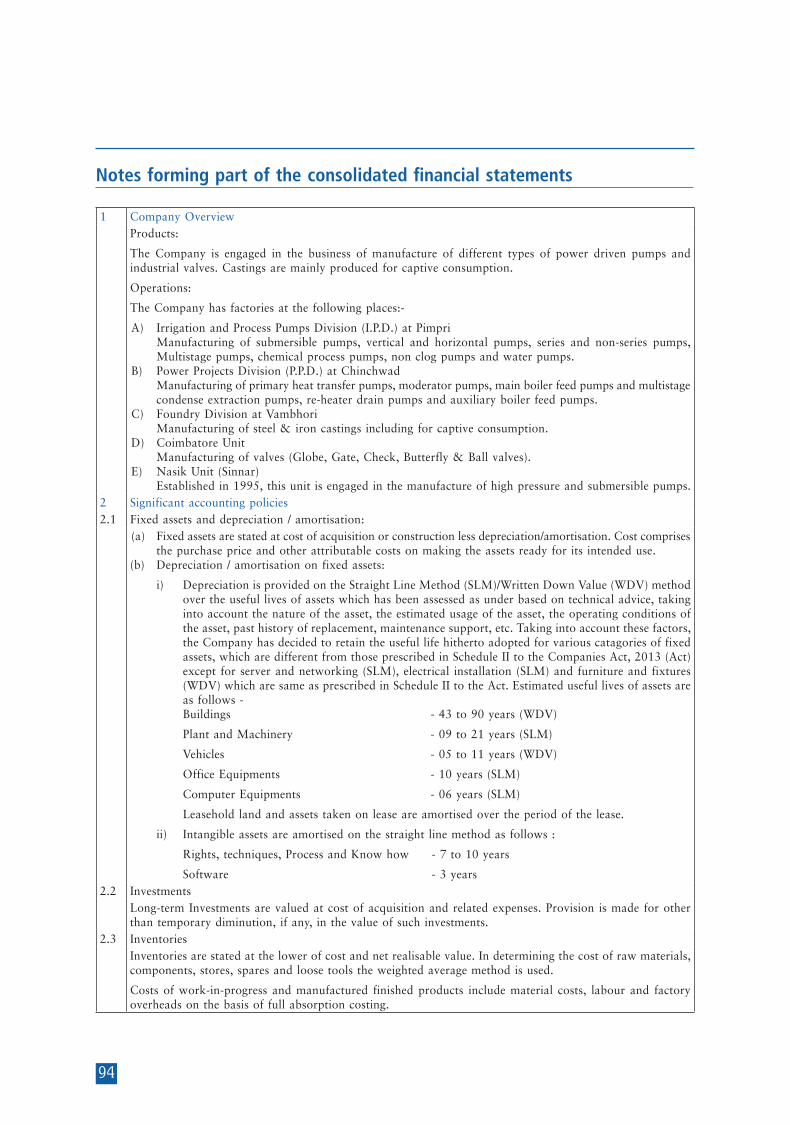
94
Notes forming part of the consolidated financial statements
1 Company OverviewProducts:
The Company is engaged in the business of manufacture of different types of power driven pumps and industrial valves. Castings are mainly produced for captive consumption.
Operations:
The Company has factories at the following places:-
A) Irrigation and Process Pumps Division (I.P.D.) at Pimpri Manufacturing of submersible pumps, vertical and horizontal pumps, series and non-series pumps,
Multistage pumps, chemical process pumps, non clog pumps and water pumps.B) Power Projects Division (P.P.D.) at Chinchwad Manufacturing of primary heat transfer pumps, moderator pumps, main boiler feed pumps and multistage
condense extraction pumps, re-heater drain pumps and auxiliary boiler feed pumps. C) Foundry Division at Vambhori Manufacturing of steel & iron castings including for captive consumption. D) Coimbatore Unit Manufacturing of valves (Globe, Gate, Check, Butterfly & Ball valves).E) Nasik Unit (Sinnar) Established in 1995, this unit is engaged in the manufacture of high pressure and submersible pumps.
2 Significant accounting policies2.1 Fixed assets and depreciation / amortisation:
(a) Fixed assets are stated at cost of acquisition or construction less depreciation/amortisation. Cost comprises the purchase price and other attributable costs on making the assets ready for its intended use.
(b) Depreciation / amortisation on fixed assets:
i) Depreciation is provided on the Straight Line Method (SLM)/Written Down Value (WDV) method over the useful lives of assets which has been assessed as under based on technical advice, taking into account the nature of the asset, the estimated usage of the asset, the operating conditions of the asset, past history of replacement, maintenance support, etc. Taking into account these factors, the Company has decided to retain the useful life hitherto adopted for various catagories of fixed assets, which are different from those prescribed in Schedule II to the Companies Act, 2013 (Act) except for server and networking (SLM), electrical installation (SLM) and furniture and fixtures (WDV) which are same as prescribed in Schedule II to the Act. Estimated useful lives of assets are as follows -
Buildings - 43 to 90 years (WDV)
Plant and Machinery - 09 to 21 years (SLM)
Vehicles - 05 to 11 years (WDV)
Office Equipments - 10 years (SLM)
Computer Equipments - 06 years (SLM)
Leasehold land and assets taken on lease are amortised over the period of the lease.
ii) Intangible assets are amortised on the straight line method as follows :
Rights, techniques, Process and Know how - 7 to 10 years
Software - 3 years2.2 Investments
Long-term Investments are valued at cost of acquisition and related expenses. Provision is made for other than temporary diminution, if any, in the value of such investments.
2.3 InventoriesInventories are stated at the lower of cost and net realisable value. In determining the cost of raw materials, components, stores, spares and loose tools the weighted average method is used.
Costs of work-in-progress and manufactured finished products include material costs, labour and factory overheads on the basis of full absorption costing.

95
Notes forming part of the consolidated financial statements (Contd.)
2.4 Trade receivables and advancesSpecific debts and advances identified as irrecoverable or doubtful are written-off or provided for, respectively.
2.5 Foreign exchange transactions and translationsTransactions in foreign currencies are recorded at the exchange rates prevailing on the date of the transaction. Realised gains and losses as also exchange differences arising on translation at year end exchange rates of monetory assets and liabilities outstanding at the end of the year are recognised in the Statement of Profit and Loss. Premium/Discount in respect of Forward Contracts is accounted for over the period of contract.
2.6 Revenue Recognition(i) Sales of goods is recognised when all significant risks and rewards of ownership have been transferred
to the buyers. (ii) Dividend income from investments is recognised when the owner’s right to receive the payment is
established. (iii) Income from services rendered is accounted for when the work is performed.
2.7 Employee BenefitsEmployee benefits includes gratuity, superannuation and provident fund and leave encashment benefits under the approved schemes of the Company.
In respect of defined contribution plans, the contribution payable for the year is charged to the Statement of Profit and Loss.
In respect of defined benefit plans and other long term employee benefits, the employee benefit costs is accounted for based on an actuarial valuation during the year.
2.8 Product WarrantyCost of product warranties is disclosed under the head:
(i) ‘raw materials and components consumed’ as consists of free replacement of spares.
(ii) ‘miscellaneous expenses’ which includes provision for warranties.2.9 Taxes on Income
Tax expense for the year is included in the determination of the net profit for the year.
Deferred tax is recognised on all timing differences, subject to consideration of prudence in respect of deferred tax assets. Deferred tax is measured using the tax rates and the tax laws enacted or substantively enacted as at the reporting date.
2.10 LeasesAssets acquired under finance leases are recognised at the lower of the fair value of the leased assets at inception of the lease and the present value of minimum lease payments. Lease payments are apportioned between the finance charge and the reduction of the outstanding liability. The finance charge is allocated to periods during the lease term at a constant periodic rate of interest on the remaining balance of the liability.
Lease arrangements where the risks and rewards incidental to ownership of an asset substantially vest with the lessor are recognised as operating leases. Lease rentals under operating leases are recognised in the Statement of Profit and Loss on a straight-line basis.
2.11 Borrowing CostsBorrowing costs that are directly attributable to the acquisition, construction or production of a qualifying asset are capitalised as part of the cost of that asset. Other borrowing costs are recognised as an expense in the year in which they are incurred.
2.12 Cash Flow StatementThe Cash Flow statement is prepared by the indirect method and presents cash flows by operating, investing and financing activities of the Company.
2.13 Use of EstimatesThe preparation of the financial statements in conformity with the generally accepted accounting principles requires estimates and assumptions to be made that affect the reported amount of assets and liabilities on the date of the financial statements and the reported amount of revenues and expenses during the reporting year. Difference between the actual result and estimates are recognized in the year in which the results are known / materialized.

96
Notes forming part of the consolidated financial statements (Contd.)
2.14 Provisions, Contingent Liabilities and Contingent AssetsThe Company recognizes provisions only when it has a present obligation as a result of a past event, it is probable that an outflow of resources embodying economic benefits will be required to settle the obligation and when a reliable estimate of the amount of the obligation can be made.
No provision is recognised for:
(i) Any possible obligation that arises from past events and the existence of which will be confirmed only by the occurrence or non-occurrence of one or more uncertain future events not wholly within the control of the Company; or
(ii) Any present obligation that arises from past events but is not recognized because-
- It is not probable that an outflow of resources embodying economic benefits will be required to settle the obligation; or
- A reliable estimate of the amount of obligation cannot be made.
Such obligations are recorded as Contingent Liabilities. These are assessed continually and only that part of the obligation for which an outflow of resources embodying economic benefits is probable, is provided for, except in the extremely rare circumstances where no reliable estimate can be made.
Contingent Assets are not recognized in the financial statements since this may result in the recognition of income that may never be realized.
2.15 Earnings per shareBasic earnings per share is computed by dividing the profit attributable to equity shareholders for the year by the weighted average number of Equity shares outstanding during the year. Diluted earnings per share is computed by dividing the profit attributable to equity shareholders for the year as adjusted for dividend, interest and other charges to expenses or income (net of taxes) relating to the diluted potential equity shares, by the weighted average number of equity shares outstanding during the year as adjusted for the effects of all diluted potential equity shares except where the results are anti-dilutive.

97
Notes forming part of the consolidated financial statements (Contd.)
Note 3 - Share capital
Particulars As at 31st December, 2016 As at 31st December, 2015
No. of shares
` in Million No. of shares
` in Million
Authorised:
Equity shares of `10/- each. 40,000,000 400.00 40,000,000 400.00 Issued, Subscribed and Fully Paid up:
Equity shares of ` 10/- each. 34,807,844 348.08 34,807,844 348.08 Total 34,807,844 348.08 34,807,844 348.08
(i) Reconciliation of the no. of shares outstanding at the beginning and at the end of the year:
As at 31st December, 2016 As at 31st December, 2015
` in Million No. of shares
` in Million No. of shares
No. of shares outstanding at the beginning
- Equity shares 348.08 34,807,844 348.08 34,807,844Add: Additional shares issued
- Equity shares - - - - Less: Shares forfeited/Bought back
- Equity shares - - - - No. of shares outstanding at the end
- Equity shares 348.08 34,807,844 348.08 34,807,844
(ii) The Company has only one class of shares referred to as equity shares having a par value of ` 10/-. Each shareholder of equity shares is entitled to one vote per share.
(iii) Aggregate number of equity shares allotted as fully paid up by way of bonus shares for the period of five years immediately preceding the Balance Sheet date - 17,403,922 (Previous Year - 17,403,922).
(iv) Number of shares held by each shareholder holding more than 5% shares in the company are as follows:
Particulars As at 31st December, 2016 As at 31st December, 2015
No. of shares
% of shares held
No. of shares
% of shares held
Canadian Kay Pump Ltd. 14,110,848 40.54% 14,110,848 40.54% The Industrial & Prudential Investment Co. Ltd. 7,140,000 20.51% 7,140,000 20.51% Reliance Capital Trustee Company Ltd.
(held in Reliance Infrastructure Fund and Reliance Tax Saver (ELSS) Fund)
2,520,693 7.24% 2,518,155 7.23%
(v) The Company declares and pays dividends in Indian rupees. The dividend proposed by the Board of Directors is subject to the approval of the shareholders in the ensuing Annual General Meeting. In the event of liquidation of the Company, the holders of equity shares will be entitled to receive any of the remaining assets of the Company, after distribution of all preferential amounts. However, no such preferential amount exists currently. The distribution will be in proportion to the number of equity shares held by the shareholders.
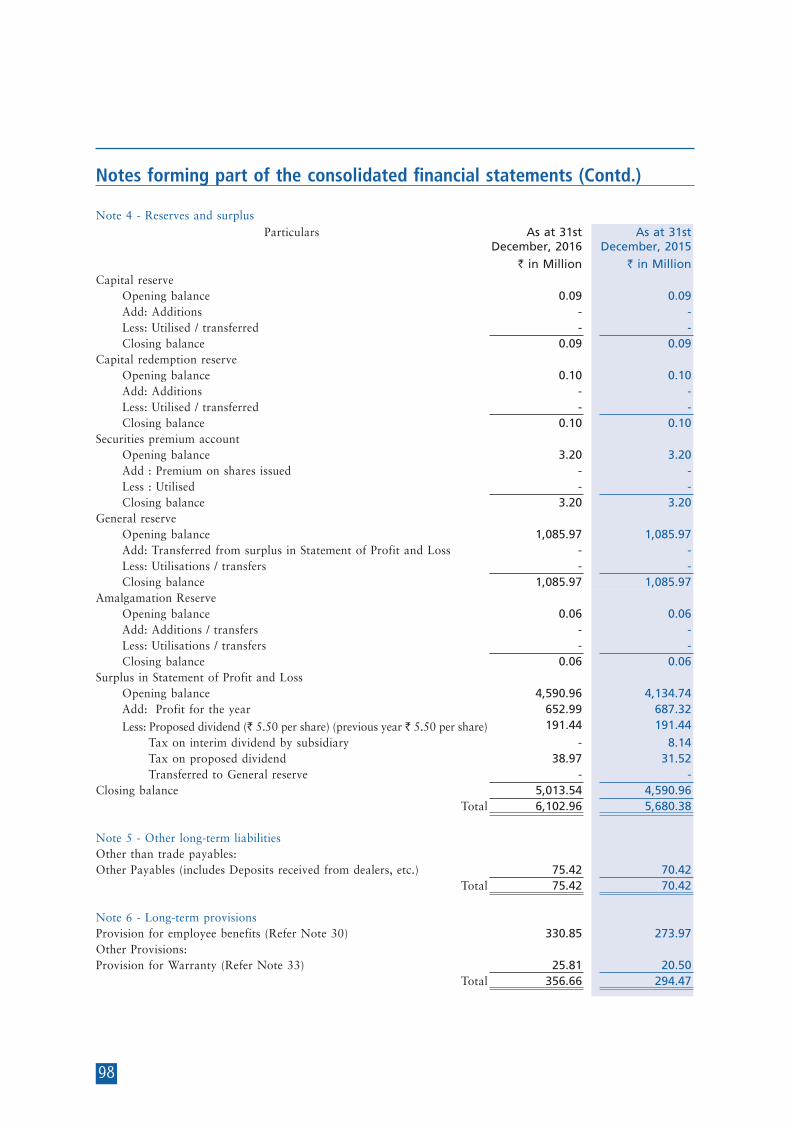
98
Notes forming part of the consolidated financial statements (Contd.)
Note 4 - Reserves and surplus Particulars As at 31st
December, 2016 As at 31st
December, 2015
` in Million ` in MillionCapital reserve Opening balance 0.09 0.09 Add: Additions - - Less: Utilised / transferred - - Closing balance 0.09 0.09 Capital redemption reserve Opening balance 0.10 0.10 Add: Additions - - Less: Utilised / transferred - - Closing balance 0.10 0.10 Securities premium account Opening balance 3.20 3.20 Add : Premium on shares issued - - Less : Utilised - - Closing balance 3.20 3.20 General reserve Opening balance 1,085.97 1,085.97 Add: Transferred from surplus in Statement of Profit and Loss - - Less: Utilisations / transfers - - Closing balance 1,085.97 1,085.97 Amalgamation Reserve Opening balance 0.06 0.06 Add: Additions / transfers - - Less: Utilisations / transfers - - Closing balance 0.06 0.06 Surplus in Statement of Profit and Loss Opening balance 4,590.96 4,134.74 Add: Profit for the year 652.99 687.32
Less: Proposed dividend (` 5.50 per share) (previous year ` 5.50 per share) 191.44 191.44
Tax on interim dividend by subsidiary - 8.14 Tax on proposed dividend 38.97 31.52 Transferred to General reserve - - Closing balance 5,013.54 4,590.96
Total 6,102.96 5,680.38
Note 5 - Other long-term liabilities Other than trade payables:Other Payables (includes Deposits received from dealers, etc.) 75.42 70.42
Total 75.42 70.42
Note 6 - Long-term provisions Provision for employee benefits (Refer Note 30) 330.85 273.97Other Provisions:Provision for Warranty (Refer Note 33) 25.81 20.50
Total 356.66 294.47

99
Notes forming part of the consolidated financial statements (Contd.)
Note 7 - Short-term borrowings Particulars As at 31st
December, 2016As at 31st
December, 2015
` in Million ` in MillionLoans Repayable on Demand
Working Capital Facilities from banks (Secured) 51.84 12.97 Total 51.84 12.97
Notes:
(i) Details of security for the secured short-term borrowings:
Particulars Nature of security As at 31st December, 2016
As at 31st December, 2015
` in Million ` in MillionWorking Capital Facility -1 Pledge of Fixed Deposits of ` 10 Million
(previous year `10 Million) - -
Working Capital Facility -2 Pledge of Fixed Deposits of `433.76
Million (previous year `433.76 Million) and
hypothecation of stocks including loose tools,
stores and spares, book debts.
- 12.97
Working Capital Facility -3 Hypothecation of stocks including loose tools,
stores and spares, book debts. 51.84 - Total 51.84 12.97
Note 8 - Trade payables
Trade payables other than acceptances 1,725.57 1,545.72 Total 1,725.57 1,545.72
Note 9 - Other current liabilities
Unclaimed Dividend 2.89 2.63 Other payables
(i) Statutory remittances (Contributions to PF and ESIC, Withholding Taxes, Excise Duty, VAT, Service Tax, etc.)
140.25 116.70
(ii) Payables for purchase of fixed assets 33.05 47.12 (iii) Advances from customers 457.22 529.53 (iv) Others (Liquidated damages, etc.) 390.56 379.70
Total 1,023.97 1,075.68
Note 10 - Short-term provisions
Provision for employee benefits (Refer Note 30) 57.48 56.01 Provision - Others:
(i) Tax provisions less payments (current tax) 49.32 105.15 (ii) Provision for Warranty (Refer Note 33) 51.61 41.00 (iii) Proposed dividend 191.44 191.44 (iv) Tax on proposed dividend 38.97 38.97 (v) Mark to market loss on derivative contracts - 3.66 (vi) Provision - others (for statutory levies) (Refer Note 33) 57.74 42.85
389.08 423.07 Total 446.56 479.08
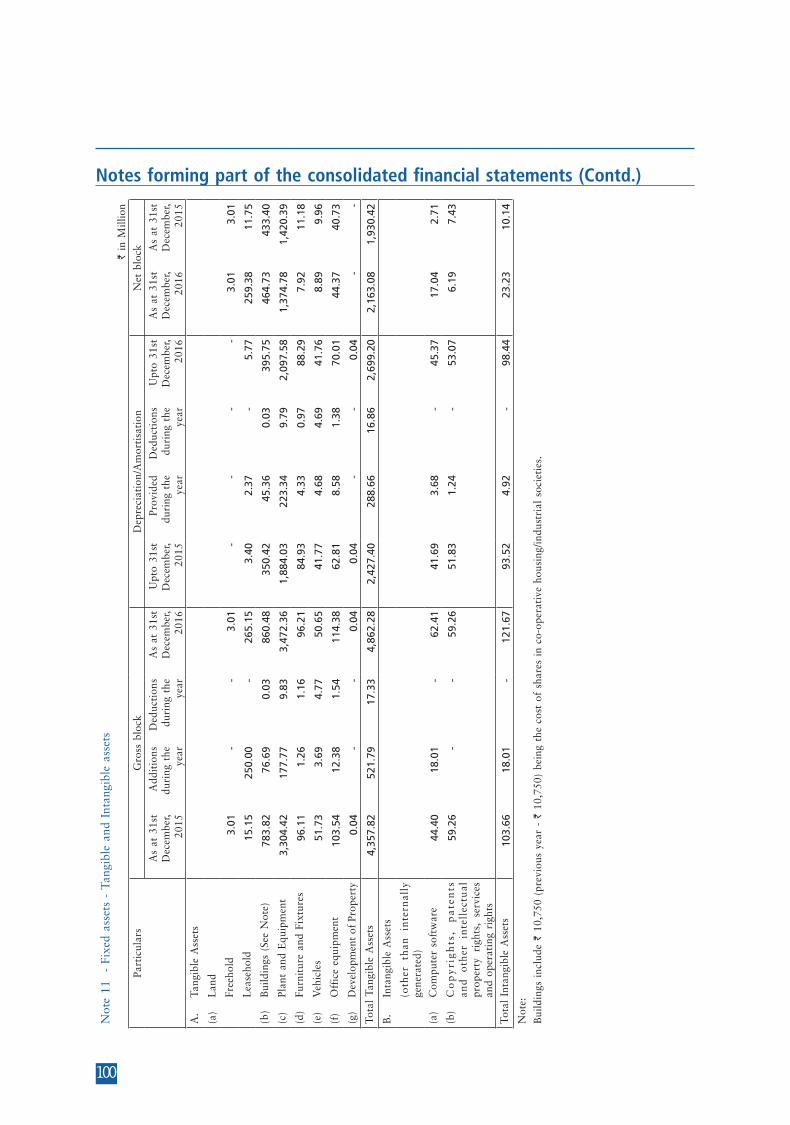
100
Notes forming part of the consolidated financial statements (Contd.)
Not
e 11
-
Fixe
d as
sets
- T
angi
ble
and
Inta
ngib
le a
sset
s `
in
Mill
ion
Part
icul
ars
Gro
ss b
lock
Dep
reci
atio
n/A
mor
tisa
tion
Net
blo
ck
As
at 3
1st
Dec
embe
r, 20
15
Add
itio
ns
duri
ng t
he
year
Ded
ucti
ons
duri
ng t
he
year
As
at 3
1st
Dec
embe
r, 20
16
Upt
o 31
st
Dec
embe
r, 20
15
Prov
ided
du
ring
the
ye
ar
Ded
ucti
ons
duri
ng t
he
year
Upt
o 31
st
Dec
embe
r, 20
16
As
at 3
1st
Dec
embe
r, 20
16
As
at 3
1st
Dec
embe
r, 20
15
A.
Tang
ible
Ass
ets
(a)
Lan
d
Fr
eeho
ld 3
.01
-
-
3.0
1 -
-
-
-
3
.01
3.0
1
L
ease
hold
15.
15
250
.00
-
265
.15
3.4
0 2
.37
-
5.7
7 2
59.3
8 1
1.75
(b)
B
uild
ings
(Se
e N
ote)
783
.82
76.
69
0.0
3 8
60.4
8 3
50.4
2 4
5.36
0
.03
395
.75
464
.73
433
.40
(c)
Pl
ant
and
Equ
ipm
ent
3,3
04.4
2 1
77.7
7 9
.83
3,4
72.3
6 1
,884
.03
223
.34
9.7
9 2
,097
.58
1,3
74.7
8 1
,420
.39
(d)
Fu
rnit
ure
and
Fixt
ures
96.
11
1.2
6 1
.16
96.
21
84.
93
4.3
3 0
.97
88.
29
7.9
2 1
1.18
(e)
V
ehic
les
51.
73
3.6
9 4
.77
50.
65
41.
77
4.6
8 4
.69
41.
76
8.8
9 9
.96
(f)
O
ffic
e eq
uipm
ent
103
.54
12.
38
1.5
4 1
14.3
8 6
2.81
8
.58
1.3
8 7
0.01
4
4.37
4
0.73
(g)
D
evel
opm
ent
of P
rope
rty
0.0
4 -
-
0
.04
0.0
4 -
-
0
.04
-
-
Tota
l Ta
ngib
le A
sset
s 4
,357
.82
521
.79
17.
33
4,8
62.2
8 2
,427
.40
288
.66
16.
86
2,6
99.2
0 2
,163
.08
1,9
30.4
2
B.
Inta
ngib
le A
sset
s
(o
ther
th
an
inte
rnal
ly
gene
rate
d)
(a)
Com
pute
r so
ftw
are
44.
40
18.
01
-
62.
41
41.
69
3.6
8 -
4
5.37
1
7.04
2
.71
(b)
Co
py
rig
hts
, p
ate
nts
an
d
oth
er
inte
llec
tual
pr
oper
ty r
ight
s, s
ervi
ces
and
oper
atin
g ri
ghts
59.
26
-
-
59.
26
51.
83
1.2
4 -
5
3.07
6
.19
7.4
3
Tota
l In
tang
ible
Ass
ets
103
.66
18.
01
-
121
.67
93.
52
4.9
2 -
9
8.44
2
3.23
1
0.14
Not
e:
Bui
ldin
gs i
nclu
de `
10,
750
(pre
viou
s ye
ar -
` 1
0,75
0) b
eing
the
cos
t of
sha
res
in c
o-op
erat
ive
hous
ing/
indu
stri
al s
ocie
ties
.

101
Notes forming part of the consolidated financial statements (Contd.)
Not
e 11
C -
Fix
ed a
sset
s -
Tang
ible
and
Int
angi
ble
asse
ts `
in
Mill
ion
Part
icul
ars
Gro
ss b
lock
Dep
reci
atio
n/A
mor
tisa
tion
Net
blo
ck
As
at 3
1st
Dec
embe
r, 20
14
Add
itio
ns
duri
ng t
he
year
Ded
ucti
ons
duri
ng t
he
year
As
at 3
1st
Dec
embe
r, 20
15
Upt
o 31
st
Dec
embe
r, 20
14
Prov
ided
du
ring
the
ye
ar
Ded
ucti
ons
duri
ng t
he
year
Upt
o 31
st
Dec
embe
r, 20
15
As
at 3
1st
Dec
embe
r, 20
15
As
at 3
1st
Dec
embe
r, 20
14
Tang
ible
Ass
ets
(a)
Lan
d
Fr
eeho
ld 3
.01
-
-
3.0
1 -
-
-
-
3
.01
3.0
1
L
ease
hold
15.
15
-
-
15.
15
3.2
2 0
.18
-
3.4
0 1
1.75
1
1.93
(b)
B
uild
ings
(Se
e N
ote)
680
.33
104
.16
0.6
7 7
83.8
2 3
12.7
7 3
8.29
0
.64
350
.42
433
.40
367
.56
(c)
Pl
ant
and
Equ
ipm
ent
3,1
86.2
4 1
82.7
3 6
4.55
3
,304
.42
1,7
33.6
1 2
14.3
1 6
3.89
1
,884
.03
1,4
20.3
9 1
,452
.63
(d)
Fu
rnit
ure
and
Fixt
ures
92.
27
4.4
8 0
.64
96.
11
80.
27
5.2
6 0
.60
84.
93
11.
18
12.
00
(e)
V
ehic
les
48.
77
4.3
2 1
.36
51.
73
36.
43
6.6
6 1
.32
41.
77
9.9
6 1
2.34
(f)
O
ffic
e eq
uipm
ent
92.
66
12.
54
1.6
6 1
03.5
4 5
5.83
8
.60
1.6
2 6
2.81
4
0.73
3
6.83
(g)
D
evel
opm
ent
of P
rope
rty
0.0
4 -
-
0
.04
0.0
4 -
-
0
.04
-
-
Tota
l Ta
ngib
le A
sset
s 4
,118
.47
308
.23
68.
88
4,3
57.8
2 2
,222
.17
273
.30
68.
07
2,4
27.4
0 1
,930
.42
1,8
96.3
0
Inta
ngib
le A
sset
s
(oth
er
tha
n
inte
rna
lly
gene
rate
d)
(a)
Com
pute
r so
ftw
are
43.
77
0.6
3 -
4
4.40
3
8.76
2
.93
-
41.
69
2.7
1 5
.01
(b)
Co
py
rig
hts
, p
ate
nts
an
d
oth
er
inte
llec
tual
pr
oper
ty r
ight
s, s
ervi
ces
and
oper
atin
g ri
ghts
57.
20
2.0
6 -
5
9.26
5
0.39
1
.44
-
51.
83
7.4
3 6
.81
Tota
l In
tang
ible
Ass
ets
100
.97
2.6
9 -
1
03.6
6 8
9.15
4
.37
-
93.
52
10.
14
11.
82
Not
e:
Bui
ldin
gs i
nclu
de `
10,
750
(pre
viou
s ye
ar -
` 1
0,75
0) b
eing
the
cos
t of
sha
res
in c
o-op
erat
ive
hous
ing/
indu
stri
al s
ocie
ties
.
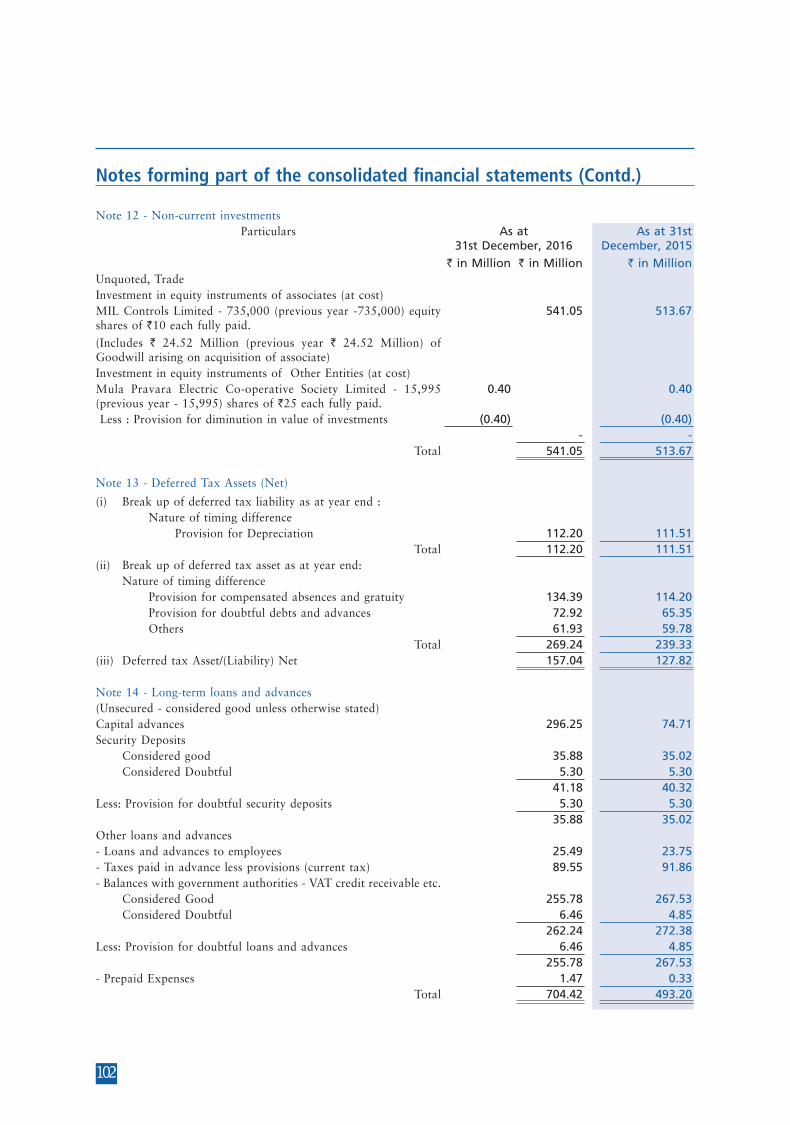
102
Notes forming part of the consolidated financial statements (Contd.)
Note 12 - Non-current investmentsParticulars As at
31st December, 2016As at 31st
December, 2015
` in Million ` in Million ` in Million Unquoted, TradeInvestment in equity instruments of associates (at cost) MIL Controls Limited - 735,000 (previous year -735,000) equity shares of `10 each fully paid.
541.05 513.67
(Includes ` 24.52 Million (previous year ` 24.52 Million) of Goodwill arising on acquisition of associate)Investment in equity instruments of Other Entities (at cost) Mula Pravara Electric Co-operative Society Limited - 15,995 (previous year - 15,995) shares of `25 each fully paid.
0.40 0.40
Less : Provision for diminution in value of investments (0.40) (0.40) - -
Total 541.05 513.67
Note 13 - Deferred Tax Assets (Net)
(i) Break up of deferred tax liability as at year end : Nature of timing difference Provision for Depreciation 112.20 111.51
Total 112.20 111.51 (ii) Break up of deferred tax asset as at year end: Nature of timing difference Provision for compensated absences and gratuity 134.39 114.20 Provision for doubtful debts and advances 72.92 65.35 Others 61.93 59.78
Total 269.24 239.33 (iii) Deferred tax Asset/(Liability) Net 157.04 127.82
Note 14 - Long-term loans and advances(Unsecured - considered good unless otherwise stated)Capital advances 296.25 74.71 Security Deposits Considered good 35.88 35.02 Considered Doubtful 5.30 5.30
41.18 40.32 Less: Provision for doubtful security deposits 5.30 5.30
35.88 35.02 Other loans and advances- Loans and advances to employees 25.49 23.75 - Taxes paid in advance less provisions (current tax) 89.55 91.86 - Balances with government authorities - VAT credit receivable etc. Considered Good 255.78 267.53 Considered Doubtful 6.46 4.85
262.24 272.38 Less: Provision for doubtful loans and advances 6.46 4.85
255.78 267.53 - Prepaid Expenses 1.47 0.33
Total 704.42 493.20

103
Notes forming part of the consolidated financial statements (Contd.)
Note 15 - Inventories(at cost or net realisable value whichever is lower)
Particulars As at 31st December, 2016
As at 31st December, 2015
` in Million ` in Million Raw materials (including Goods-in-transit ` 2.46 Million 590.59 408.80 (previous year `2.61 Million))
Work-in-progress 1,006.73 1,015.53 Finished goods 403.72 292.63 Stock-in-trade (in respect of goods acquired for trading) 73.19 57.81 Stores and spares 39.44 50.26 Loose tools 4.96 1.38
Total 2,118.63 1,826.41
Note 16 - Trade receivables
(Unsecured - considered good unless otherwise stated)
Trade receivables outstanding for a period exceeding six months from the
date they were due for payment Considered good 174.66 175.79 Doubtful 183.10 172.83
357.76 348.62 Other Trade receivables
Considered good 1,626.41 1,607.94 Doubtful - -
1,626.41 1,607.94 Total 1,984.17 1,956.56
Less: Provision for doubtful trade receivables 183.10 172.83 Total 1,801.07 1,783.73
Note 17 - Cash and cash equivalents
A. Cash and cash equivalents (as per AS 3 Cash Flow Statements)
Cash on hand 0.58 0.71 Balances with banks in current accounts 259.98 520.31 Total - Cash and cash equivalents (as per AS 3 Cash Flow Statements) (A) 260.56 521.02 B. Other bank balances
- In deposit accounts 1,314.63 1,316.21 - In earmarked accounts
- Unpaid dividend accounts 2.89 2.63 - Balances held as security against borrowings 443.76 443.76 Total - Other bank balances (B) 1,761.28 1,762.60
Total 2,021.84 2,283.62
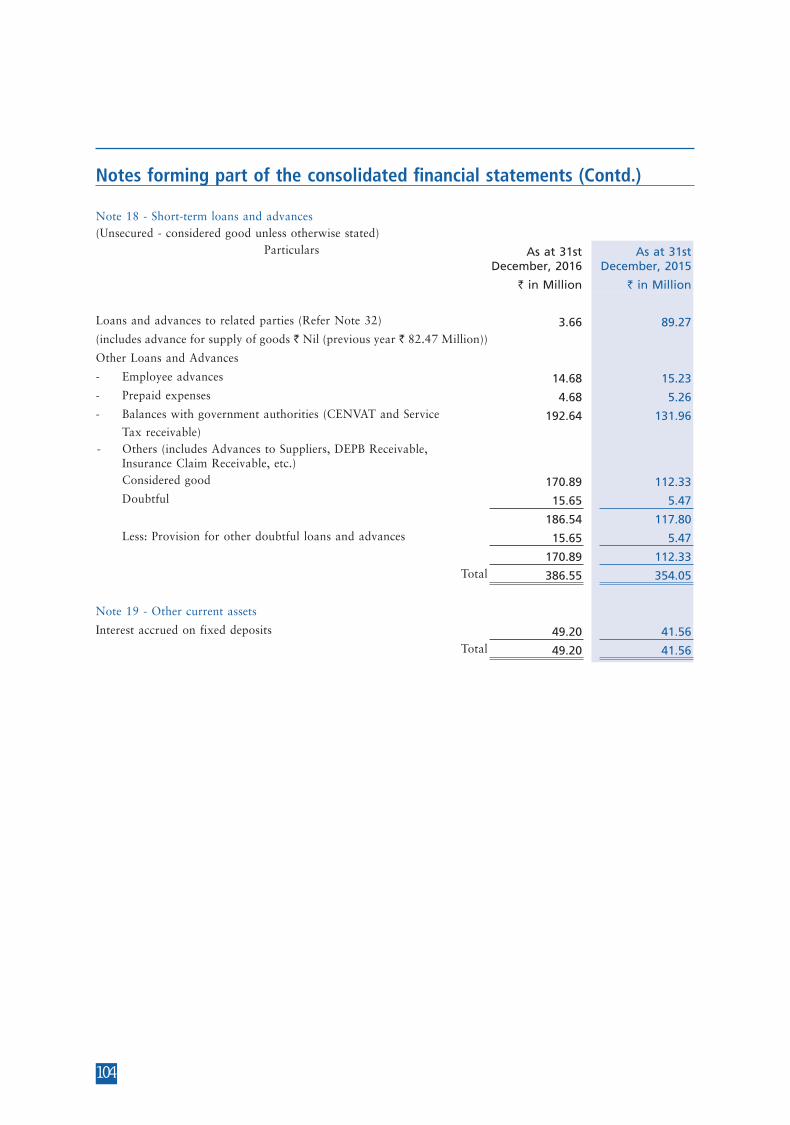
104
Notes forming part of the consolidated financial statements (Contd.)
Note 18 - Short-term loans and advances(Unsecured - considered good unless otherwise stated)
Particulars As at 31st December, 2016
As at 31st December, 2015
` in Million ` in Million
Loans and advances to related parties (Refer Note 32) 3.66 89.27 (includes advance for supply of goods ` Nil (previous year ` 82.47 Million))
Other Loans and Advances
- Employee advances 14.68 15.23 - Prepaid expenses 4.68 5.26 - Balances with government authorities (CENVAT and Service
Tax receivable) 192.64 131.96
- Others (includes Advances to Suppliers, DEPB Receivable, Insurance Claim Receivable, etc.)
Considered good 170.89 112.33 Doubtful 15.65 5.47
186.54 117.80 Less: Provision for other doubtful loans and advances 15.65 5.47
170.89 112.33 Total 386.55 354.05
Note 19 - Other current assets
Interest accrued on fixed deposits 49.20 41.56 Total 49.20 41.56
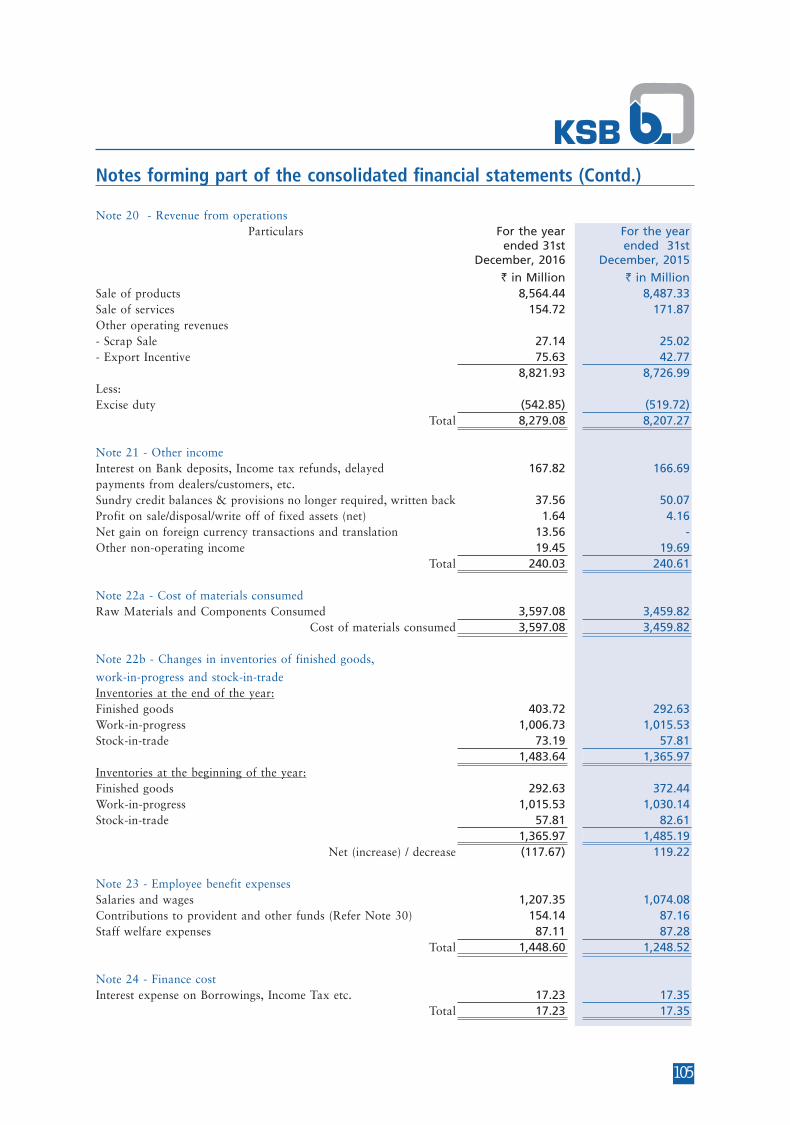
105
Notes forming part of the consolidated financial statements (Contd.)
Note 20 - Revenue from operationsParticulars For the year
ended 31st December, 2016
For the year ended 31st
December, 2015
` in Million ` in Million Sale of products 8,564.44 8,487.33 Sale of services 154.72 171.87 Other operating revenues - Scrap Sale 27.14 25.02 - Export Incentive 75.63 42.77
8,821.93 8,726.99 Less:Excise duty (542.85) (519.72)
Total 8,279.08 8,207.27
Note 21 - Other incomeInterest on Bank deposits, Income tax refunds, delayed 167.82 166.69 payments from dealers/customers, etc.Sundry credit balances & provisions no longer required, written back 37.56 50.07 Profit on sale/disposal/write off of fixed assets (net) 1.64 4.16 Net gain on foreign currency transactions and translation 13.56 - Other non-operating income 19.45 19.69
Total 240.03 240.61
Note 22a - Cost of materials consumed Raw Materials and Components Consumed 3,597.08 3,459.82
Cost of materials consumed 3,597.08 3,459.82
Note 22b - Changes in inventories of finished goods,
work-in-progress and stock-in-trade Inventories at the end of the year:Finished goods 403.72 292.63 Work-in-progress 1,006.73 1,015.53 Stock-in-trade 73.19 57.81
1,483.64 1,365.97 Inventories at the beginning of the year:Finished goods 292.63 372.44 Work-in-progress 1,015.53 1,030.14 Stock-in-trade 57.81 82.61
1,365.97 1,485.19 Net (increase) / decrease (117.67) 119.22
Note 23 - Employee benefit expensesSalaries and wages 1,207.35 1,074.08 Contributions to provident and other funds (Refer Note 30) 154.14 87.16 Staff welfare expenses 87.11 87.28
Total 1,448.60 1,248.52
Note 24 - Finance costInterest expense on Borrowings, Income Tax etc. 17.23 17.35
Total 17.23 17.35

106
Notes forming part of the consolidated financial statements (Contd.)
Note 25 Other expensesParticulars For the year ended
31st December, 2016For the year
ended 31st December, 2015
` in Million ` in Million ` in Million Processing & Machining Charges 396.66 363.39 Stores Consumed 170.53 164.80 Tools Consumed 53.53 43.97 Water Power and fuel 189.16 175.89 Rent 6.96 7.13 Excise duty relating to increase / (decrease) in finished goods stock (1.18) (14.65)Rates and taxes (Refer Note 33) 43.27 47.46 Insurance (Net) 2.16 2.28 Repairs and maintenance - Buildings 9.83 3.62 - Machinery 60.56 59.21 - Others 69.39 71.59
139.78 134.42 Travelling and conveyance 54.29 58.81 Packing & Forwarding Charges (net of recoveries - `56.06 Million; previous year `46.14 Million)
212.41 212.94
Directors' fees 1.41 1.39 Auditors' remuneration (net of service tax) and expenses:
Audit fees 1.30 1.30 Tax audit fees 0.30 0.30 Accounts for tax purposes 0.45 0.45 Fees for other services 1.25 1.20 Reimbursement of out of pocket expenses 0.05 0.22
3.35 3.47
Cost Audit Fees 0.40 0.40 Sales commission
Export Selling agents 86.60 96.04 Other Selling agents 28.95 33.29
115.55 129.33 Cash Discount 22.42 17.54 Royalty Charges 81.41 90.87 In respect of late delivery under contracts 33.39 80.00 Provision for doubtful receivables and advances (net) 22.06 48.66 Expenditure on Corporate Social Responsibility 19.90 18.30 Legal and professional 22.74 22.34 Net loss on foreign currency transactions and translation - 20.94 Mark to market loss on derivative contracts - 3.66 Miscellaneous expenses 396.94 397.68
Total 1,987.14 2,031.02
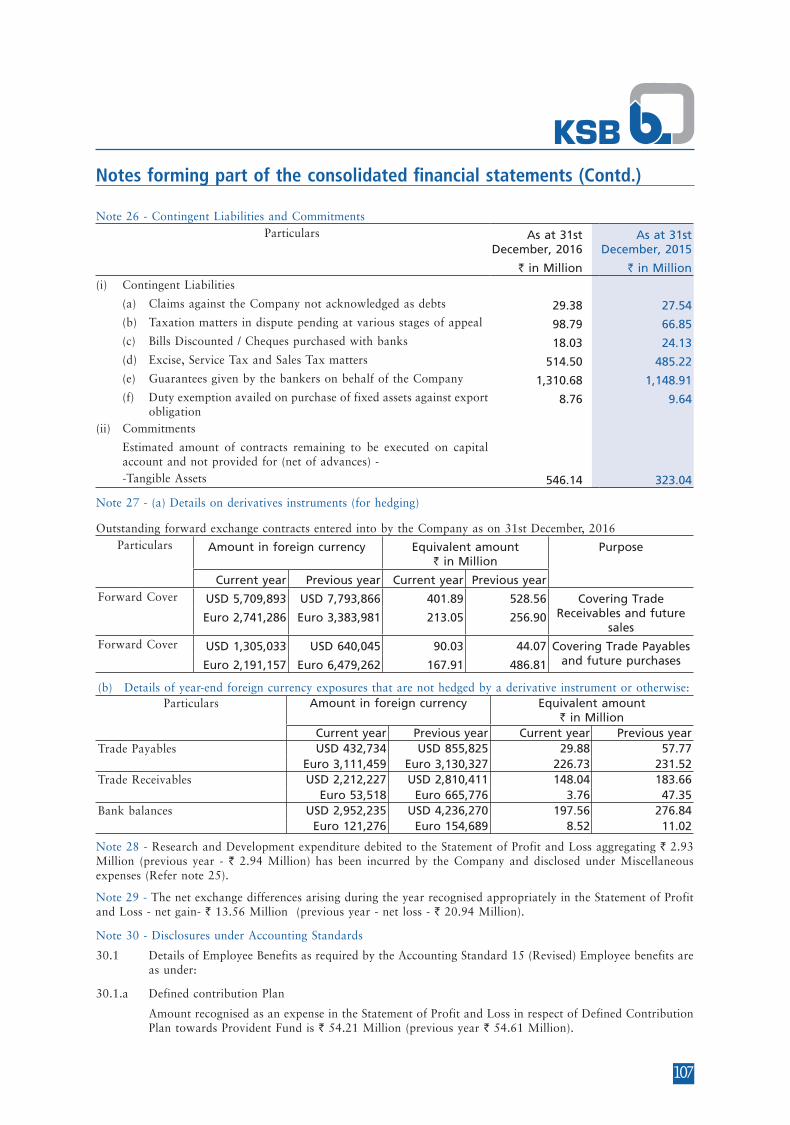
107
Notes forming part of the consolidated financial statements (Contd.)
Note 26 - Contingent Liabilities and CommitmentsParticulars As at 31st
December, 2016 As at 31st
December, 2015
` in Million ` in Million (i) Contingent Liabilities
(a) Claims against the Company not acknowledged as debts 29.38 27.54 (b) Taxation matters in dispute pending at various stages of appeal 98.79 66.85 (c) Bills Discounted / Cheques purchased with banks 18.03 24.13 (d) Excise, Service Tax and Sales Tax matters 514.50 485.22 (e) Guarantees given by the bankers on behalf of the Company 1,310.68 1,148.91 (f) Duty exemption availed on purchase of fixed assets against export
obligation 8.76 9.64
(ii) Commitments
Estimated amount of contracts remaining to be executed on capital account and not provided for (net of advances) -
-Tangible Assets 546.14 323.04
Note 27 - (a) Details on derivatives instruments (for hedging)
Outstanding forward exchange contracts entered into by the Company as on 31st December, 2016Particulars Amount in foreign currency Equivalent amount
` in MillionPurpose
Current year Previous year Current year Previous year Forward Cover USD 5,709,893 USD 7,793,866 401.89 528.56 Covering Trade
Receivables and future sales
Euro 2,741,286 Euro 3,383,981 213.05 256.90
Forward Cover USD 1,305,033 USD 640,045 90.03 44.07 Covering Trade Payables and future purchases Euro 2,191,157 Euro 6,479,262 167.91 486.81
(b) Details of year-end foreign currency exposures that are not hedged by a derivative instrument or otherwise:Particulars Amount in foreign currency Equivalent amount
` in MillionCurrent year Previous year Current year Previous year
Trade Payables USD 432,734 USD 855,825 29.88 57.77 Euro 3,111,459 Euro 3,130,327 226.73 231.52
Trade Receivables USD 2,212,227 USD 2,810,411 148.04 183.66 Euro 53,518 Euro 665,776 3.76 47.35
Bank balances USD 2,952,235 USD 4,236,270 197.56 276.84 Euro 121,276 Euro 154,689 8.52 11.02
Note 28 - Research and Development expenditure debited to the Statement of Profit and Loss aggregating ` 2.93 Million (previous year - ` 2.94 Million) has been incurred by the Company and disclosed under Miscellaneous expenses (Refer note 25).
Note 29 - The net exchange differences arising during the year recognised appropriately in the Statement of Profit and Loss - net gain- ` 13.56 Million (previous year - net loss - ` 20.94 Million).
Note 30 - Disclosures under Accounting Standards
30.1 Details of Employee Benefits as required by the Accounting Standard 15 (Revised) Employee benefits are as under:
30.1.a Defined contribution Plan
Amount recognised as an expense in the Statement of Profit and Loss in respect of Defined Contribution Plan towards Provident Fund is ` 54.21 Million (previous year ` 54.61 Million).
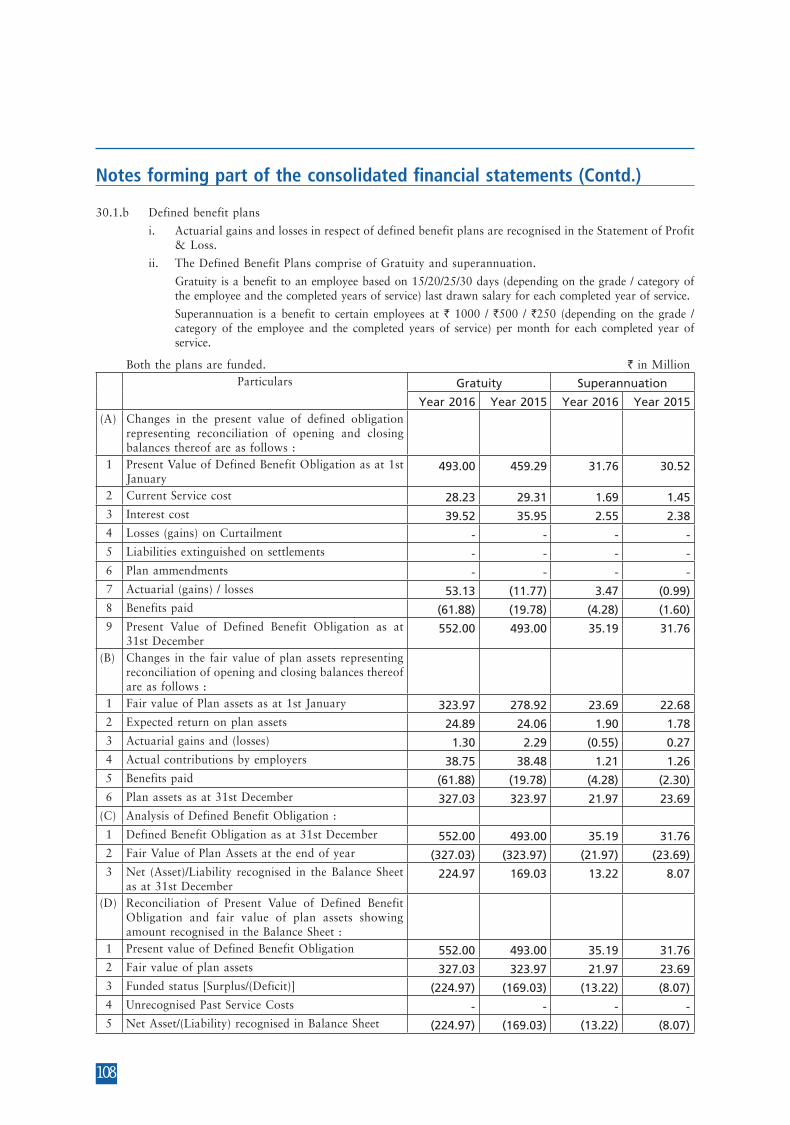
108
Notes forming part of the consolidated financial statements (Contd.)
30.1.b Defined benefit plans
i. Actuarial gains and losses in respect of defined benefit plans are recognised in the Statement of Profit & Loss.
ii. The Defined Benefit Plans comprise of Gratuity and superannuation.
Gratuity is a benefit to an employee based on 15/20/25/30 days (depending on the grade / category of the employee and the completed years of service) last drawn salary for each completed year of service.
Superannuation is a benefit to certain employees at ` 1000 / `500 / `250 (depending on the grade / category of the employee and the completed years of service) per month for each completed year of service.
Both the plans are funded. ` in MillionParticulars Gratuity Superannuation
Year 2016 Year 2015 Year 2016 Year 2015(A) Changes in the present value of defined obligation
representing reconciliation of opening and closing balances thereof are as follows :
1 Present Value of Defined Benefit Obligation as at 1st January
493.00 459.29 31.76 30.52
2 Current Service cost 28.23 29.31 1.69 1.45 3 Interest cost 39.52 35.95 2.55 2.38 4 Losses (gains) on Curtailment - - - - 5 Liabilities extinguished on settlements - - - - 6 Plan ammendments - - - - 7 Actuarial (gains) / losses 53.13 (11.77) 3.47 (0.99)8 Benefits paid (61.88) (19.78) (4.28) (1.60)9 Present Value of Defined Benefit Obligation as at
31st December552.00 493.00 35.19 31.76
(B) Changes in the fair value of plan assets representing reconciliation of opening and closing balances thereof are as follows :
1 Fair value of Plan assets as at 1st January 323.97 278.92 23.69 22.68 2 Expected return on plan assets 24.89 24.06 1.90 1.78 3 Actuarial gains and (losses) 1.30 2.29 (0.55) 0.27 4 Actual contributions by employers 38.75 38.48 1.21 1.26 5 Benefits paid (61.88) (19.78) (4.28) (2.30)6 Plan assets as at 31st December 327.03 323.97 21.97 23.69
(C) Analysis of Defined Benefit Obligation :
1 Defined Benefit Obligation as at 31st December 552.00 493.00 35.19 31.76 2 Fair Value of Plan Assets at the end of year (327.03) (323.97) (21.97) (23.69)3 Net (Asset)/Liability recognised in the Balance Sheet
as at 31st December224.97 169.03 13.22 8.07
(D) Reconciliation of Present Value of Defined Benefit Obligation and fair value of plan assets showing amount recognised in the Balance Sheet :
1 Present value of Defined Benefit Obligation 552.00 493.00 35.19 31.76 2 Fair value of plan assets 327.03 323.97 21.97 23.69 3 Funded status [Surplus/(Deficit)] (224.97) (169.03) (13.22) (8.07)4 Unrecognised Past Service Costs - - - - 5 Net Asset/(Liability) recognised in Balance Sheet (224.97) (169.03) (13.22) (8.07)

109
Notes forming part of the consolidated financial statements (Contd.)
` in MillionParticulars Gratuity Superannuation
Year 2016 Year 2015 Year 2016 Year 2015(E) Components of employer expenses recognised in
the statement of profit and loss for the year ended 31st December
1 Current Service cost 28.23 29.31 1.69 1.45 2 Interest cost 39.52 35.95 2.55 2.38 3 Expected return on plan assets (24.89) (24.06) (1.90) (1.78)4 Curtailment cost/(credit) - - - - 5 Settlement cost/(credit) - - - - 6 Past Service cost - - - - 7 Actuarial Losses/(Gains) 51.83 (14.06) 4.02 (1.26)8 Total expense recognised in the Statement of Profit
& Loss under Contribution to Provident Fund and other Funds
94.69 27.14 6.36 0.79
(F) In respect of Funded Benefits with respect to gratuity and superannuation, the fair value of Plan assets represents the amounts invested through “Insurer Managed Funds”
(G) Actuarial Assumptions :1 Discount Rate (%) 6.75 8.00 6.75 8.002 Expected Return on plan assets (%) 8.00 8.00 8.00 8.003 Salary Escalation (%) 7.50 7.50 N/A N/A4 Medical cost inflation N/A N/A N/A N/A5 Withdrawal Rate (%) 7.00 7.00 7.00 7.00
The Discount rate is based on the prevailing market yields of Indian Government securities as at the Balance Sheet date for the estimated terms of the obligations.
Expected Rate of Return of Plan Assets : This is based on the expectation of the average long term rate of return expected on investments of the Fund during the estimated term of obligations.
Salary Escalation Rate : The estimates of future salary increases considered takes into account the inflation, seniority, promotion and other relevant factors
Amount ` in Million
Gratuity Superannuation(H) Experience History Year
2016Year 2015
Year 2014
Year 2013
Year 2012
Year 2016
Year 2015
Year 2014
Year 2013
Year 2012
1 Defined Benefit Obligation at end of the year
552.00 493.00 459.29 392.20 356.80 35.19 31.76 30.52 23.90 20.63
2 Plan Assets at end of the period 327.03 323.97 278.92 247.72 215.93 21.97 23.69 22.68 20.87 19.46 3 Funded Status (224.97) (169.03) (180.37) (144.48) (140.87) (13.22) (8.07) (7.84) (3.03) (1.17)4 Experience Gain / (Loss)
adjustments on plan liabilities(53.13) 11.77 7.63 (27.96) (7.96) (3.47) 0.99 (1.72) (2.14) (0.22)
5 Experience Gain / (Loss) adjustments on plan assets
1.30 2.29 (0.02) 5.00 (0.05) (0.55) 0.27 0.14 0.23 0.02
Gratuity Superannuation(I) Actual Return on Plan Assets Year 2016 Year 2015 Year 2016 Year 2015
1 Expected return on plan assets 24.89 24.06 1.90 1.78 2 Acturial gains and ( Losses) on plan assets 1.30 2.29 (0.55) 0.27 3 Actual Return on Plan Assets 26.19 26.35 1.35 2.05
(J) Contributions expected to be paid to the plan during the next financial year ` 42.90 Million (previous year-
` 42.20 Million).
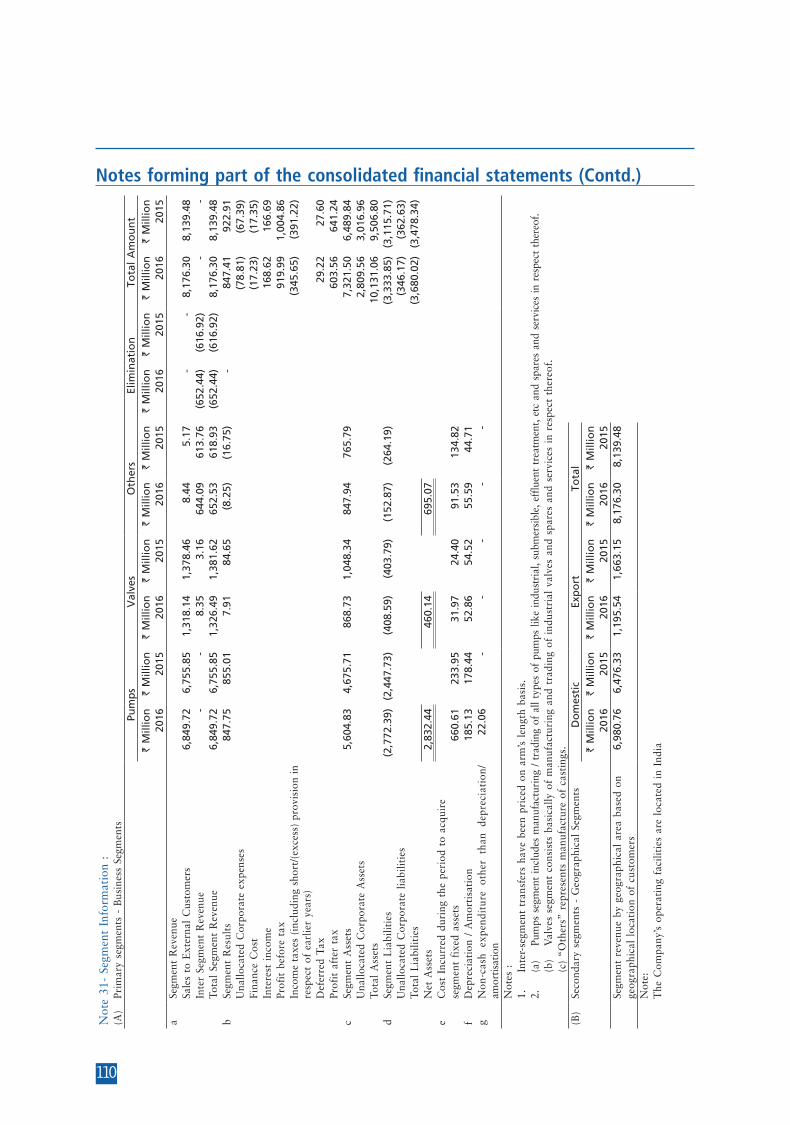
110
Notes forming part of the consolidated financial statements (Contd.)
Not
e 31
- Se
gmen
t In
form
atio
n :
(A)
Prim
ary
segm
ents
- B
usin
ess
Segm
ents
Pum
ps
Val
ves
Oth
ers
Elim
inat
ion
Tota
l A
mo
un
t`
Mill
ion
` M
illio
n`
Mill
ion
` M
illio
n`
Mill
ion
` M
illio
n`
Mill
ion
` M
illio
n`
Mill
ion
` M
illio
n20
1620
1520
1620
1520
1620
1520
1620
1520
1620
15a
Segm
ent
Rev
enue
Sale
s to
Ext
erna
l C
usto
mer
s6,
849.
726,
755.
851,
318.
141,
378.
468.
445.
17-
-8,
176.
308,
139.
48In
ter
Segm
ent
Rev
enue
--
8.35
3.16
644.
0961
3.76
(652
.44)
(616
.92)
--
Tota
l Se
gmen
t R
even
ue6,
849.
726,
755.
851,
326.
491,
381.
6265
2.53
618.
93(6
52.4
4)(6
16.9
2)8,
176.
308,
139.
48b
Segm
ent
Res
ults
847.
7585
5.01
7.91
84.6
5(8
.25)
(16.
75)
-84
7.41
922.
91U
nallo
cate
d C
orpo
rate
exp
ense
s(7
8.81
)(6
7.39
)Fi
nanc
e C
ost
(17.
23)
(17.
35)
Inte
rest
inc
ome
168.
6216
6.69
Prof
it b
efor
e ta
x91
9.99
1,00
4.86
Inco
me
taxe
s (i
nclu
ding
sho
rt/(
exce
ss)
prov
isio
n in
re
spec
t of
ear
lier
year
s)(3
45.6
5)(3
91.2
2)
Def
erre
d Ta
x29
.22
27.6
0Pr
ofit
aft
er t
ax60
3.56
641.
24c
Segm
ent
Ass
ets
5,60
4.83
4,67
5.71
868.
731,
048.
3484
7.94
765.
797,
321.
506,
489.
84U
nallo
cate
d C
orpo
rate
Ass
ets
2,80
9.56
3,01
6.96
Tota
l A
sset
s10
,131
.06
9,50
6.80
dSe
gmen
t L
iabi
litie
s(2
,772
.39)
(2,4
47.7
3)(4
08.5
9)(4
03.7
9)(1
52.8
7)(2
64.1
9)(3
,333
.85)
(3,1
15.7
1)U
nallo
cate
d C
orpo
rate
lia
bilit
ies
(346
.17)
(362
.63)
Tota
l L
iabi
litie
s(3
,680
.02)
(3,4
78.3
4)N
et A
sset
s2,
832.
4446
0.14
695.
07e
Cos
t In
curr
ed d
urin
g th
e pe
riod
to
acqu
ire
segm
ent
fixe
d as
sets
660.
6123
3.95
31.9
724
.40
91.5
313
4.82
fD
epre
ciat
ion
/ A
mor
tisa
tion
185.
1317
8.44
52.8
654
.52
55.5
944
.71
gN
on-c
ash
expe
ndit
ure
othe
r th
an d
epre
ciat
ion/
am
ortis
atio
n22
.06
--
--
-
Not
es :
1.
In
ter-
segm
ent
tran
sfer
s ha
ve b
een
pric
ed o
n ar
m’s
len
gth
basi
s.2.
(a
)
Pum
ps s
egm
ent
incl
udes
man
ufac
turi
ng /
trad
ing
of a
ll ty
pes
of p
umps
like
indu
stri
al, s
ubm
ersi
ble,
eff
luen
t tr
eatm
ent,
etc
and
spar
es a
nd s
ervi
ces
in r
espe
ct t
here
of.
(b
)
Val
ves
segm
ent
cons
ists
bas
ical
ly o
f m
anuf
actu
ring
and
tra
ding
of
indu
stri
al v
alve
s an
d sp
ares
and
ser
vice
s in
res
pect
the
reof
.
(c)
“Oth
ers”
rep
rese
nts
man
ufac
ture
of
cast
ings
.(B
)Se
cond
ary
segm
ents
- G
eogr
aphi
cal
Segm
ents
Do
mes
tic
Exp
ort
Tota
l`
Mill
ion
` M
illio
n`
Mill
ion
` M
illio
n`
Mill
ion
` M
illio
n20
1620
1520
1620
1520
1620
15Se
gmen
t re
venu
e by
geo
grap
hica
l ar
ea b
ased
on
6,98
0.76
6,47
6.33
1,19
5.54
1,66
3.15
8,17
6.30
8,13
9.48
geog
raph
ical
loc
atio
n of
cus
tom
ers
Not
e:
The
Com
pany
’s o
pera
ting
fac
iliti
es a
re l
ocat
ed i
n In
dia
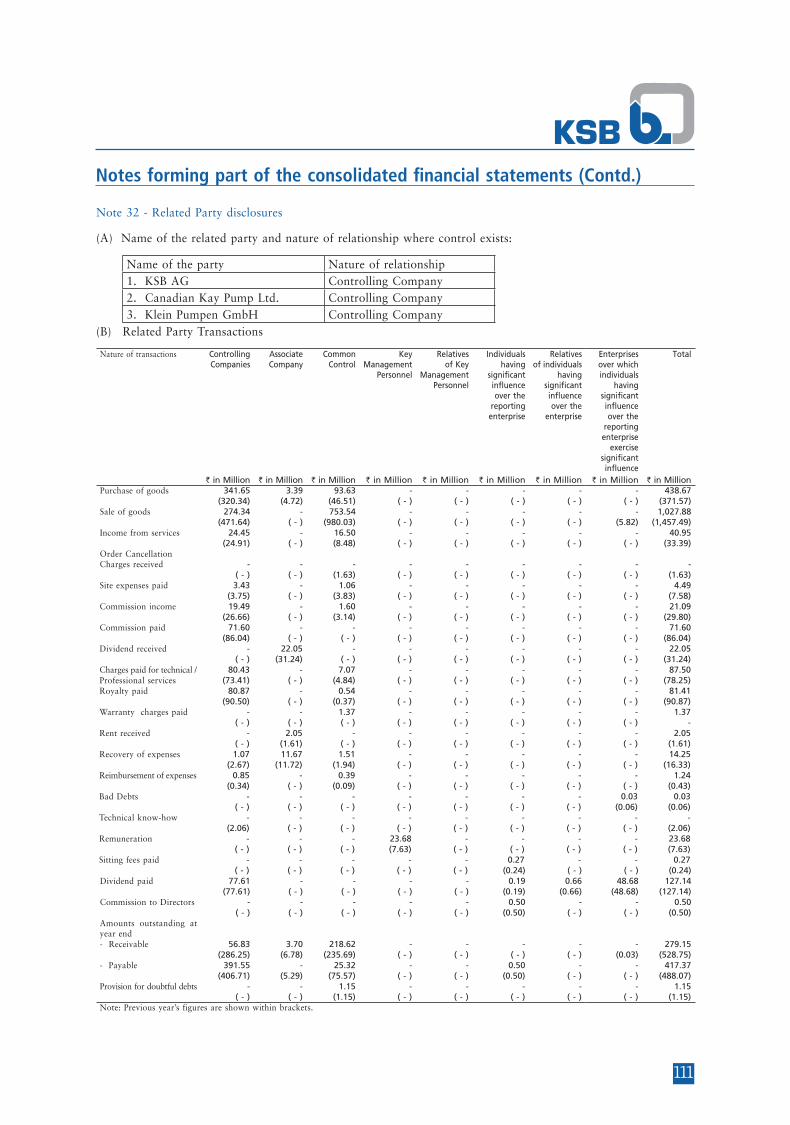
111
Notes forming part of the consolidated financial statements (Contd.)
Note 32 - Related Party disclosures
(A) Name of the related party and nature of relationship where control exists:
Name of the party Nature of relationship1. KSB AG Controlling Company2. Canadian Kay Pump Ltd. Controlling Company3. Klein Pumpen GmbH Controlling Company
(B) Related Party Transactions
Nature of transactions ControllingCompanies
AssociateCompany
CommonControl
KeyManagement
Personnel
Relativesof Key
ManagementPersonnel
Individualshaving
significantinfluence over the
reportingenterprise
Relativesof individuals
having significantinfluence over the
enterprise
Enterprises over which individuals
havingsignificant influence over the
reportingenterprise
exercisesignificant influence
Total
` in Million ` in Million ` in Million ` in Million ` in Million ` in Million ` in Million ` in Million ` in MillionPurchase of goods 341.65 3.39 93.63 - - - - - 438.67
(320.34) (4.72) (46.51) ( - ) ( - ) ( - ) ( - ) ( - ) (371.57)Sale of goods 274.34 - 753.54 - - - - - 1,027.88
(471.64) ( - ) (980.03) ( - ) ( - ) ( - ) ( - ) (5.82) (1,457.49)Income from services 24.45 - 16.50 - - - - - 40.95
(24.91) ( - ) (8.48) ( - ) ( - ) ( - ) ( - ) ( - ) (33.39)Order Cancellation Charges received - - - - - - - - -
( - ) ( - ) (1.63) ( - ) ( - ) ( - ) ( - ) ( - ) (1.63)Site expenses paid 3.43 - 1.06 - - - - - 4.49
(3.75) ( - ) (3.83) ( - ) ( - ) ( - ) ( - ) ( - ) (7.58)Commission income 19.49 - 1.60 - - - - - 21.09
(26.66) ( - ) (3.14) ( - ) ( - ) ( - ) ( - ) ( - ) (29.80)Commission paid 71.60 - - - - - - - 71.60
(86.04) ( - ) ( - ) ( - ) ( - ) ( - ) ( - ) ( - ) (86.04)Dividend received - 22.05 - - - - - - 22.05
( - ) (31.24) ( - ) ( - ) ( - ) ( - ) ( - ) ( - ) (31.24)Charges paid for technical / 80.43 - 7.07 - - - - - 87.50 Professional services (73.41) ( - ) (4.84) ( - ) ( - ) ( - ) ( - ) ( - ) (78.25)Royalty paid 80.87 - 0.54 - - - - - 81.41
(90.50) ( - ) (0.37) ( - ) ( - ) ( - ) ( - ) ( - ) (90.87)Warranty charges paid - - 1.37 - - - - - 1.37
( - ) ( - ) ( - ) ( - ) ( - ) ( - ) ( - ) ( - ) - Rent received - 2.05 - - - - - - 2.05
( - ) (1.61) ( - ) ( - ) ( - ) ( - ) ( - ) ( - ) (1.61)Recovery of expenses 1.07 11.67 1.51 - - - - - 14.25
(2.67) (11.72) (1.94) ( - ) ( - ) ( - ) ( - ) ( - ) (16.33)Reimbursement of expenses 0.85 - 0.39 - - - - - 1.24
(0.34) ( - ) (0.09) ( - ) ( - ) ( - ) ( - ) ( - ) (0.43)Bad Debts - - - - - - - 0.03 0.03
( - ) ( - ) ( - ) ( - ) ( - ) ( - ) ( - ) (0.06) (0.06)Technical know-how - - - - - - - - -
(2.06) ( - ) ( - ) ( - ) ( - ) ( - ) ( - ) ( - ) (2.06)Remuneration - - - 23.68 - - - - 23.68
( - ) ( - ) ( - ) (7.63) ( - ) ( - ) ( - ) ( - ) (7.63)Sitting fees paid - - - - - 0.27 - - 0.27
( - ) ( - ) ( - ) ( - ) ( - ) (0.24) ( - ) ( - ) (0.24)Dividend paid 77.61 - - - - 0.19 0.66 48.68 127.14
(77.61) ( - ) ( - ) ( - ) ( - ) (0.19) (0.66) (48.68) (127.14)Commission to Directors - - - - - 0.50 - - 0.50
( - ) ( - ) ( - ) ( - ) ( - ) (0.50) ( - ) ( - ) (0.50)Amounts outstanding at year end- Receivable 56.83 3.70 218.62 - - - - - 279.15
(286.25) (6.78) (235.69) ( - ) ( - ) ( - ) ( - ) (0.03) (528.75)- Payable 391.55 - 25.32 - - 0.50 - - 417.37
(406.71) (5.29) (75.57) ( - ) ( - ) (0.50) ( - ) ( - ) (488.07)Provision for doubtful debts - - 1.15 - - - - - 1.15
( - ) ( - ) (1.15) ( - ) ( - ) ( - ) ( - ) ( - ) (1.15)Note: Previous year’s figures are shown within brackets.
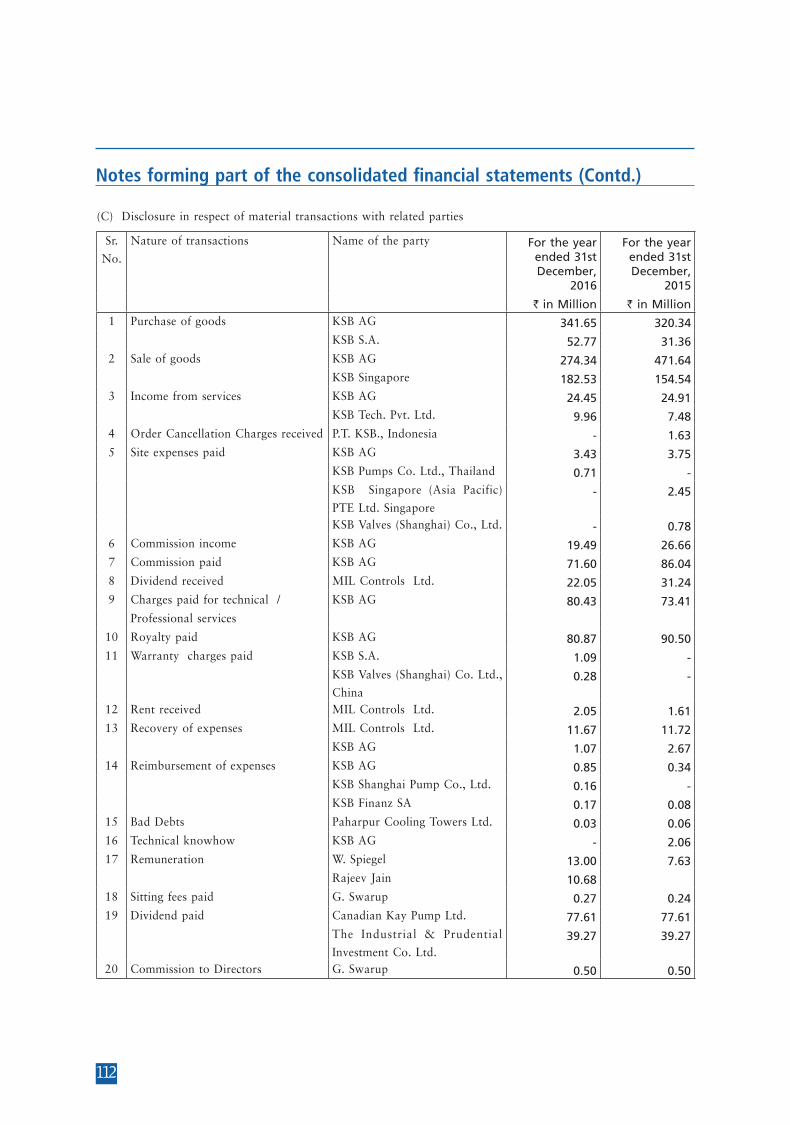
112
Notes forming part of the consolidated financial statements (Contd.)
(C) Disclosure in respect of material transactions with related parties
Sr.
No.
Nature of transactions Name of the party For the year ended 31st December,
2016
For the year ended 31st December,
2015
` in Million ` in Million 1 Purchase of goods KSB AG 341.65 320.34
KSB S.A. 52.77 31.36 2 Sale of goods KSB AG 274.34 471.64
KSB Singapore 182.53 154.54 3 Income from services KSB AG 24.45 24.91
KSB Tech. Pvt. Ltd. 9.96 7.48 4 Order Cancellation Charges received P.T. KSB., Indonesia - 1.63 5 Site expenses paid KSB AG 3.43 3.75
KSB Pumps Co. Ltd., Thailand 0.71 - KSB Singapore (Asia Pacific)
PTE Ltd. Singapore - 2.45
KSB Valves (Shanghai) Co., Ltd. - 0.78 6 Commission income KSB AG 19.49 26.66 7 Commission paid KSB AG 71.60 86.04 8 Dividend received MIL Controls Ltd. 22.05 31.24 9 Charges paid for technical / KSB AG 80.43 73.41
Professional services
10 Royalty paid KSB AG 80.87 90.50 11 Warranty charges paid KSB S.A. 1.09 -
KSB Valves (Shanghai) Co. Ltd.,
China 0.28 -
12 Rent received MIL Controls Ltd. 2.05 1.61 13 Recovery of expenses MIL Controls Ltd. 11.67 11.72
KSB AG 1.07 2.67 14 Reimbursement of expenses KSB AG 0.85 0.34
KSB Shanghai Pump Co., Ltd. 0.16 - KSB Finanz SA 0.17 0.08
15 Bad Debts Paharpur Cooling Towers Ltd. 0.03 0.06 16 Technical knowhow KSB AG - 2.06 17 Remuneration W. Spiegel 13.00 7.63
Rajeev Jain 10.68 18 Sitting fees paid G. Swarup 0.27 0.24 19 Dividend paid Canadian Kay Pump Ltd. 77.61 77.61
The Industrial & Prudential
Investment Co. Ltd. 39.27 39.27
20 Commission to Directors G. Swarup 0.50 0.50

113
Notes forming part of the consolidated financial statements (Contd.)
(D) The related parties included in the various categories above, where transactions have taken place are given below:Controlling Companies KSB AG
Canadian Kay Pump Ltd.Associate Company KSB MIL Controls Ltd. (previously MIL Controls Ltd.)Common Control KSB S.A.
KSB Inc., USAKSB Pumps (S.A.) (Pty.) Ltd., South AfricaKSB AustraliaKSB Chile S.A.KSB Singapore (Asia Pacific) PTE Ltd. SingaporeKSB Limited, HongkongKSB Pumps Co. Ltd., ThailandP.T. KSB., IndonesiaKSB Taiwan Co. Ltd.KSB Ltd., TokyoKSB BrazilKSB Korea KSB MexicoKSB NetherlandDP Industries B.V., NetherlandKSB Pumps Arabia Ltd.KSB Ltd., U.K.KSB Italia S.p.A., ItalyKSB Pompa TurkeyKSB Shanghai Pump Co. Ltd., ChinaKSB Valves (Shanghai) Co. Ltd., ChinaMercantile-KSB Oy AB, FinlandKSB PakistanDelian KSB Amri Valves Co. Ltd., ChinaBombas ITUR S.A., SpainKSB TESMA S.A., GriechenlandKSB Tech. Pvt. Ltd., IndiaGIW Industries Inc., USAKSB Middle East FZE, DubaiKSB Pumpy + Armatury spol. sr. o, CzechKSB Service LLCKSB Pompy Armatura PolandKSB Compania SudamericanaKSB Belgium SAKSB ChinaKSB Pumps & Valves Malaysia KSB Finanz SAKSB AMV SA SpainKSB FinlandKSB Mork AB , SwedenKSB Lindflaten, NorwayKSB Oesterreich, AustriaKSB Pompes ET Robintteries Sarl, Morocco

114
Notes forming part of the consolidated financial statements (Contd.)
KSB ArgentinaKSB Service GMBHKSB CanadaKSB New ZelandRotary EquipmentKSB OOO, RussiaKSB Valvulas Ltda. BrazilKSB Services Ltd., Saudi ArabiaAMRI Inc., USAKSB Vietnam Company Ltd.KSB PhilippinesKSB Colombia SASKSB Zürich AG, SwitzerlandKSB Valves (Changzhou) Co., Ltd., ChinaSISTO Armaturen S.A., LuxembourgShanghai Electric-KSB Nuclear, ChinaPT. KSB Sales Indonesia
Key management personnel Mr. Rajeev Jain (w.e.f. 1st July, 2016)Mr. W. Spiegel (retired on 30th June, 2016)
Individuals having significant influence over the
enterprise
Mr. Gaurav Swarup
Relatives of individuals having significant influence over
the enterprise
Mrs. Gyan M. Swarup
Mr. Vikram Swarup and Mr. Gaurav Swarup (HUF)
Mr. Vikram Swarup
Mrs. Bindu Swarup
Mrs. Parul SwarupEnterprises over which individuals having significant
influence over the reporting enterprise exercise significant
influence
The Industrial & Prudential Investment Co. Ltd.
New Holding and Trading Company Ltd.
Paharpur Cooling Towers Ltd.
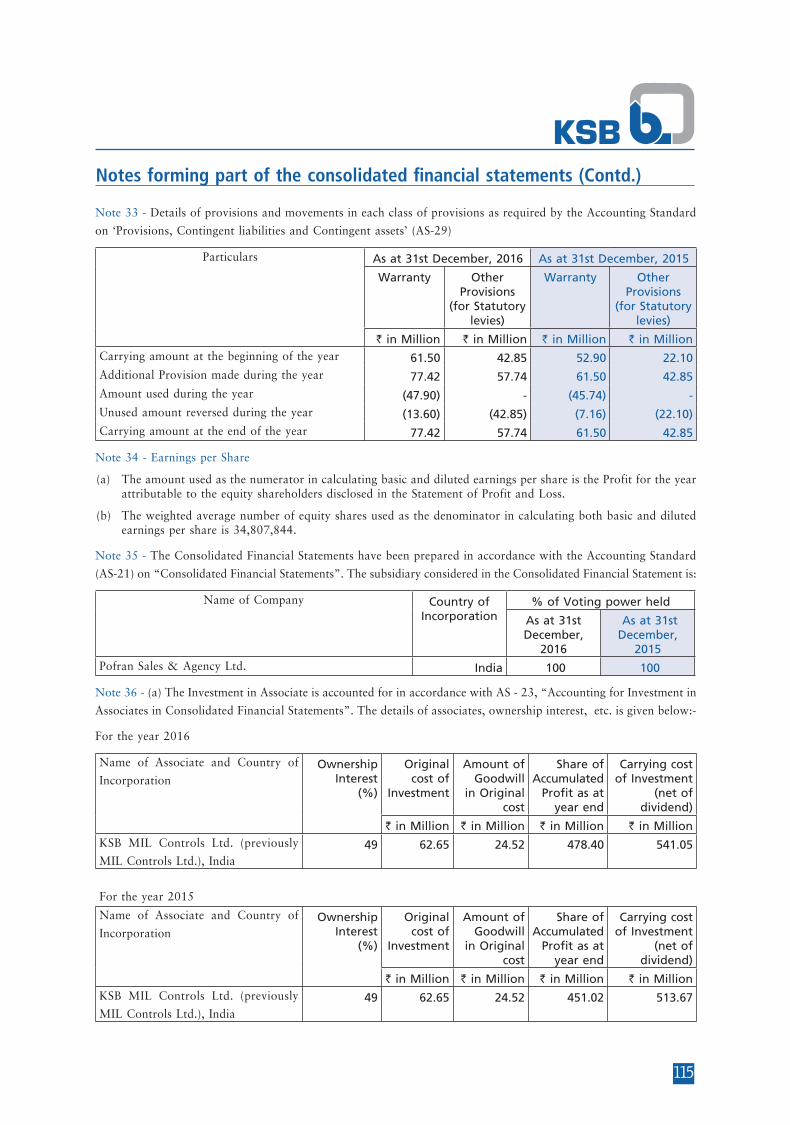
115
Notes forming part of the consolidated financial statements (Contd.)
Note 33 - Details of provisions and movements in each class of provisions as required by the Accounting Standard
on ‘Provisions, Contingent liabilities and Contingent assets’ (AS-29)
Particulars As at 31st December, 2016 As at 31st December, 2015
Warranty Other Provisions
(for Statutory levies)
Warranty Other Provisions
(for Statutory levies)
` in Million ` in Million ` in Million ` in MillionCarrying amount at the beginning of the year 61.50 42.85 52.90 22.10 Additional Provision made during the year 77.42 57.74 61.50 42.85 Amount used during the year (47.90) - (45.74) - Unused amount reversed during the year (13.60) (42.85) (7.16) (22.10)Carrying amount at the end of the year 77.42 57.74 61.50 42.85
Note 34 - Earnings per Share
(a) The amount used as the numerator in calculating basic and diluted earnings per share is the Profit for the year attributable to the equity shareholders disclosed in the Statement of Profit and Loss.
(b) The weighted average number of equity shares used as the denominator in calculating both basic and diluted earnings per share is 34,807,844.
Note 35 - The Consolidated Financial Statements have been prepared in accordance with the Accounting Standard
(AS-21) on “Consolidated Financial Statements”. The subsidiary considered in the Consolidated Financial Statement is:
Name of Company Country of Incorporation
% of Voting power held
As at 31st December,
2016
As at 31st December,
2015 Pofran Sales & Agency Ltd. India 100 100
Note 36 - (a) The Investment in Associate is accounted for in accordance with AS - 23, “Accounting for Investment in
Associates in Consolidated Financial Statements”. The details of associates, ownership interest, etc. is given below:-
For the year 2016
Name of Associate and Country of
IncorporationOwnership
Interest (%)
Original cost of
Investment
Amount of Goodwill
in Original cost
Share of Accumulated
Profit as at year end
Carrying cost of Investment
(net of dividend)
` in Million ` in Million ` in Million ` in MillionKSB MIL Controls Ltd. (previously
MIL Controls Ltd.), India49 62.65 24.52 478.40 541.05
For the year 2015
Name of Associate and Country of
IncorporationOwnership
Interest (%)
Original cost of
Investment
Amount of Goodwill
in Original cost
Share of Accumulated
Profit as at year end
Carrying cost of Investment
(net of dividend)
` in Million ` in Million ` in Million ` in MillionKSB MIL Controls Ltd. (previously
MIL Controls Ltd.), India49 62.65 24.52 451.02 513.67

116
Notes forming part of the consolidated financial statements (Contd.)
(b) - The Associate Company follows a different accounting policy in respect of fixed assets. All the fixed assets
are depreciated on straight line method by the associate company. No adjustments have been made for the said
differences in accounting policies to arrive at the share of profits of associate company, etc. as the said differences
are not expected to have material impact on the accounts of the Group.
Note 37 - Repairs to machinery include ` 37.92 Million (previous year - ` 36.06 Million) spares consumed.
Note 38 - Provision for taxation for the year is an aggregate of the provision made for the year ended
31st March, 2016 as reduced by the provision for 9 months up to 31st December, 2015 and the provision based
on the figures for the remaining 9 months up to 31st December, 2016. However, the ultimate tax liability for the
remaining 9 months up to 31st December, 2016 will be determined based on the results for the year 1st April, 2016 to
31st March, 2017.
Note 39 - Additional information as required under Schedule III to the Companies Act, 2013, of enterprises consolidated
as Subsidiary / Associates
Particulars Net Assets, i.e. total assets minus total liabilities
Share in profit or loss
As % of consolidated
net assets
Amount (` in Million)
As % of consolidated profit or loss
Amount (` in Million)
Parent 90.78 5,856.25 91.20 595.51KSB Pumps LimitedSubsidiary - Indian 0.83 53.74 1.23 8.05Pofran Sales and Agency LimitedAssociate - Indian (Investment as per equity method) 8.39 541.05 7.57 49.43KSB MIL Controls Ltd. (previously MIL Controls
Ltd.)Total 100.00 6,451.04 100.00 652.99
Note 40 - Previous year’s figures have been regrouped / reclassified wherever necessary to correspond with the
current year’s classification / disclosure.
Signature to Notes 1 to 40
G. Swarup ChairmanA. R. BroachaD. N. DamaniaN. N. Kampani
Verghese Oommen Pradip Shah Directors Cheif Financial Officer Dr. Stephan Bross
V. K. ViswanathanS. F. MotwaniW. Stegmuller
R. Narasimhan Rajeev Jain Managing Director Company Secretary
Mumbai, 20th February, 2017