WizNet: A ZigBee-based Sensor System for Distributed ...
9
WizNet: A ZigBee-based Sensor System for Distributed Wireless LAN Performance Monitoring Ruogu Zhou 1 , Guoliang Xing 1 , Xunteng Xu 2 , Jianping Wang 3 , Lin Gu 4 1 Michigan State University, 2 HP Lab, China 3 City University of Hong Kong, 4 Hong Kong University of Science and Technology Abstract—802.11-based wireless LANs (WLANs) have become an important communication infrastructure for today’s perva- sive computing applications. Nevertheless, WLAN users often experience various performance issues such as highly variable signal quality. To diagnose such transient service degradations and plan for future network upgrades, it is essential to closely monitor the performance of a WLAN and collect user statistics. This paper proposes a new WLAN performance monitoring approach motivated by the fact that many low-power wireless technologies such as ZigBee and Bluetooth co-exist with WLAN in the same open radio spectrum and are capable of sensing Received Signal Strength (RSS) of 802.11 transmissions. We have developed a ZigBee-based WLAN monitoring system called WizNet. Powered by batteries, ZigBee sensors of WizNet can be deployed in large quantities to monitor the spatial performance of a WLAN in long periods of time. By adopting digital signal processing techniques, WizNet automatically identifies 802.11 signals from ZigBee RSS measurements and associates them with wireless access points. To ensure the monitoring fidelity, WizNet accounts for the significant differences in ZigBee and WLAN radios, such as bandwidth and susceptibility to multipath and frequency-selective fading. A simple yet accurate linear estimator derived from a signal propagation model is used to infer the access points’ signal to noise ratio (SNR). Moreover, WizNet can measure the congestion level of the channel and detect rogue APs. WizNet can also collect WLAN client statistics and classify device models based on RSS signatures of 802.11 access point scans. We have implemented WizNet in TinyOS 2.x and extensively evaluated its performance on a wireless testbed. Our results over a period of 140 hours show that WizNet can accurately capture the spatial and temporal performance variability of a large-scale production WLAN. I. I NTRODUCTION In the last decade, Wireless Local Area Networks (WLAN- s) based on the 802.11 standards have enjoyed a phenomenal penetration rate, making them an important communication infrastructure for pervasive computing applications. However, compared with wired LANs, WLANs suffer significantly higher level of spatial and temporal performance variability. Due to the broadcast nature of wireless channel, signal propagation are susceptible to environmental conditions. As a result, end-users often experience highly variable signal quality. To diagnose such transient service degradation and plan for future network upgrades, it is essential to closely monitor the spatial and temporal performance of a WLAN as well as to collect the statistics of its users. The existing WLAN performance monitoring solutions [7] [8] [9] rely on 802.11-based listening devices. However, due to the high power consumption of 802.11 radios, the mon- itoring nodes must be connected to external power supplies (e.g., wall power or desktop computers). This constraint leads to high installation costs and poor spatiotemporal monitoring granularity. In this paper, we propose a new approach for WLAN monitoring by leveraging distributed cheap off-the- shelf wireless sensors. Our approach is motivated by the fact that an increasing number of low-power wireless technologies such as ZigBee and Bluetooth co-exist with WLAN in the unlicensed radio spectrum [11]. For instance, many low- power wireless sensor platforms adopt ZigBee-compliant radios that operate in the open 2.4 GHz band. These radios are capable of simple spectrum sensing, e.g., sampling the Received Signal Strength (RSS) indicator. When the RSS is measured in a frequency range overlapping with 802.11 channels, it indicates partial power of 802.11 signals and hence provides important hints of WLAN coverage. The power consumption of a ZigBee radio is typically an order of magnitude lower than that of WLAN radio. Fig. 1 shows the measurement of the power consumption of a TelosB mote and a USB WLAN NIC when they work in scanning and sleep modes. Based on these measurements, the expected lifetimes of ZigBee and WLAN nodes are 3 months and 3.3 days, respectively, if they are powered by 2 AA batteries and adopt a 10% duty cycle (i.e., active for 10% of the time). Due to their low power consumption, ZigBee nodes can be deployed in places like corridors and stairs in a large building where no power outlets are available. The capability of sustaining long lifetimes on small batteries makes low-power ZigBee networks an inexpensive solution for monitoring WLAN performance at large spatial and temporal scales. 0 10 20 30 40 50 60 70 80 0 50 100 150 200 250 300 Time (s) Current Consumption (mA) TelosB mote AR9170 WIFI NIC Scan Scan Scan Scan Sleep Scan Standby Standby Standby Standby Passive Scan (CH 1,6 and11) Sleep Sleep Sleep Sleep Sleep Figure 1. Current consumptions of a ZigBee mote and a USB WLAN NIC during scanning and sleeping. This paper describes the design and implementation of WizNet – a WLAN performance monitoring system built on 2.4 GHz off-the-shelf ZigBee sensors. By adopting digital signal processing techniques, WizNet automatically identifies 802.11 signals from ZigBee RSS measurements and asso- ciates them with wireless access points. To ensure the moni- 978-1-4673-4575-0/13/$31.00 ©2013 IEEE 2013 IEEE International Conference on Pervasive Computing and Communications (PerCom), San Diego (18--22 March 2013) 123
Transcript of WizNet: A ZigBee-based Sensor System for Distributed ...

WizNet: A ZigBee-based Sensor System for Distributed Wireless LAN PerformanceMonitoring
Ruogu Zhou1, Guoliang Xing1, Xunteng Xu2, Jianping Wang3, Lin Gu4
1Michigan State University, 2HP Lab, China3City University of Hong Kong, 4Hong Kong University of Science and Technology
Abstract—802.11-based wireless LANs (WLANs) have becomean important communication infrastructure for today’s perva-sive computing applications. Nevertheless, WLAN users oftenexperience various performance issues such as highly variablesignal quality. To diagnose such transient service degradationsand plan for future network upgrades, it is essential to closelymonitor the performance of a WLAN and collect user statistics.This paper proposes a new WLAN performance monitoringapproach motivated by the fact that many low-power wirelesstechnologies such as ZigBee and Bluetooth co-exist with WLANin the same open radio spectrum and are capable of sensingReceived Signal Strength (RSS) of 802.11 transmissions. Wehave developed a ZigBee-based WLAN monitoring system calledWizNet. Powered by batteries, ZigBee sensors of WizNet can bedeployed in large quantities to monitor the spatial performanceof a WLAN in long periods of time. By adopting digitalsignal processing techniques, WizNet automatically identifies802.11 signals from ZigBee RSS measurements and associatesthem with wireless access points. To ensure the monitoringfidelity, WizNet accounts for the significant differences in ZigBeeand WLAN radios, such as bandwidth and susceptibility tomultipath and frequency-selective fading. A simple yet accuratelinear estimator derived from a signal propagation model is usedto infer the access points’ signal to noise ratio (SNR). Moreover,WizNet can measure the congestion level of the channel anddetect rogue APs. WizNet can also collect WLAN client statisticsand classify device models based on RSS signatures of 802.11access point scans. We have implemented WizNet in TinyOS2.x and extensively evaluated its performance on a wirelesstestbed. Our results over a period of 140 hours show that WizNetcan accurately capture the spatial and temporal performancevariability of a large-scale production WLAN.
I. INTRODUCTION
In the last decade, Wireless Local Area Networks (WLAN-s) based on the 802.11 standards have enjoyed a phenomenalpenetration rate, making them an important communicationinfrastructure for pervasive computing applications. However,compared with wired LANs, WLANs suffer significantlyhigher level of spatial and temporal performance variability.Due to the broadcast nature of wireless channel, signalpropagation are susceptible to environmental conditions. Asa result, end-users often experience highly variable signalquality. To diagnose such transient service degradation andplan for future network upgrades, it is essential to closelymonitor the spatial and temporal performance of a WLANas well as to collect the statistics of its users.
The existing WLAN performance monitoring solutions [7][8] [9] rely on 802.11-based listening devices. However, dueto the high power consumption of 802.11 radios, the mon-itoring nodes must be connected to external power supplies(e.g., wall power or desktop computers). This constraint leads
to high installation costs and poor spatiotemporal monitoringgranularity. In this paper, we propose a new approach forWLAN monitoring by leveraging distributed cheap off-the-shelf wireless sensors. Our approach is motivated by the factthat an increasing number of low-power wireless technologiessuch as ZigBee and Bluetooth co-exist with WLAN in theunlicensed radio spectrum [11]. For instance, many low-power wireless sensor platforms adopt ZigBee-compliantradios that operate in the open 2.4 GHz band. These radiosare capable of simple spectrum sensing, e.g., sampling theReceived Signal Strength (RSS) indicator. When the RSSis measured in a frequency range overlapping with 802.11channels, it indicates partial power of 802.11 signals andhence provides important hints of WLAN coverage. Thepower consumption of a ZigBee radio is typically an order ofmagnitude lower than that of WLAN radio. Fig. 1 shows themeasurement of the power consumption of a TelosB mote anda USB WLAN NIC when they work in scanning and sleepmodes. Based on these measurements, the expected lifetimesof ZigBee and WLAN nodes are 3 months and 3.3 days,respectively, if they are powered by 2 AA batteries and adopta 10% duty cycle (i.e., active for 10% of the time). Due totheir low power consumption, ZigBee nodes can be deployedin places like corridors and stairs in a large building whereno power outlets are available. The capability of sustaininglong lifetimes on small batteries makes low-power ZigBeenetworks an inexpensive solution for monitoring WLANperformance at large spatial and temporal scales.
0 10 20 30 40 50 60 70 800
50
100
150
200
250
300
Time (s)
Cur
rent
Con
sum
ptio
n (m
A)
TelosB moteAR9170 WIFI NIC
Scan Scan Scan ScanSleep
Scan
Standby Standby Standby Standby
Passive Scan (CH 1,6 and11)
Sleep Sleep Sleep Sleep Sleep
Figure 1. Current consumptions of a ZigBee mote and a USBWLAN NIC during scanning and sleeping.
This paper describes the design and implementation ofWizNet – a WLAN performance monitoring system built on2.4 GHz off-the-shelf ZigBee sensors. By adopting digitalsignal processing techniques, WizNet automatically identifies802.11 signals from ZigBee RSS measurements and asso-ciates them with wireless access points. To ensure the moni-
978-1-4673-4575-0/13/$31.00 ©2013 IEEE
2013 IEEE International Conference on Pervasive Computing and Communications (PerCom), San Diego (18--22 March 2013)
123
toring fidelity, WizNet accounts for the significant bandwidthdifference between ZigBee and WLAN radios. Moreover,the impact of multipath and frequency-selective fading ismitigated by exploiting the wireless spatial diversity throughmulti-sensor fusion. WizNet adopts a simple yet accuratelinear estimator derived from a signal propagation model toinfer the access points’ signal to noise ratio (SNR). WizNetalso measures the channel utilization rate from RSS series,which faithfully indicates the congestion level of wirelesschannels. The measured SNR and channel utilization ratecan be used to predict the WLAN throughput. Moreover,WizNet detects unauthorized APs (rogue APs) by analyzingthe temporal signatures of 802.11 beacons. Lastly, WizNetis able to identify 802.11 AP scans and classify devicemodels based on their RSS signatures, hence can be deployedin the areas with little or no WLAN coverage to collectstatistics of potential users. We have implemented WizNet inTinyOS 2.x and extensively evaluated its performance on awireless testbed. Our results over a period of 140 hours showthat WizNet can accurately capture the spatial and temporalperformance variability of a large-scale production WLAN.
II. RELATED WORK
Performance measurement and monitoring are critical forWLAN infrastructure. The existing solutions can be classifiedinto three basic categories.
The first approach consists of various WLAN site-surveytools including Fluke Airmagnet [4], Berkeley VaritronicsSwarm [3], and Airtight Networks [2]. These commercialproducts are typically expensive. For example, a single FlukeAirmagnet Express field kit costs over $5,000 [4]. Moreover,they need to be carried by experienced engineers who roamabout the site to measure the network performance. Severalrecent efforts studied urban-scale WLAN coverage in war-driving experiments [15] [6]. The above site-surveying ap-proaches incur high labor costs and hence are not suitable forlong-term and real-time WLAN performance monitoring. Inthe Sybot system [12], mobile robots carrying 802.11 radioscan assess the WLANs in a building. Because of the intrusivenature and the challenge of motion planning in complexenvironments, the use of survey robots may not be feasiblefor large-scale enterprise WLAN deployments.
The second approach exploits the already available net-work infrastructure or installs dedicated 802.11 nodes fordistributed WLAN performance monitoring. The DAIR sys-tem [7] takes advantage of networked desktop computersequipped with WLAN measurement devices for long-termWLAN monitoring. Although these systems can assess thespatial performance of a network in real-time, their spatialgranularity is constrained to the locations where 802.11 com-puters are available. Moreover, installing monitoring devicesor software brings privacy concerns and may make desktopusers reluctant to participate. Several other systems [20][14] [9] deployed dedicated 802.11 nodes for indoor spatialnetwork performance monitoring. This approach is also em-ployed by the Argos system [16] to monitor urban-scale WiFinetworks in outdoor environment. However, due to the high
power consumption of 802.11 NICs, the monitoring nodesmust be plugged to wall power, which not only limits thecoverage but also incurs high installation costs.
The third approach utilizes non-802.11 nodes for WLANmonitoring. Similar to this work, WiBee [19] adopts ZigBeenodes to build real-time WLAN radio RSS maps. However,WiBee does not consider the significant bandwidth differenceof heterogeneous radios as well as the indoor frequency-selective fading. As a result, it suffers from large estimationerrors (as high as 15 dB) which limits its practical use.Moreover, WiBee only focuses on building coarse-grainedRSS map of WLAN while WizNet can monitor fine-grainedperformance characteristics including SNR, channel utiliza-tion rate, and client statistics.
III. BACKGROUND AND SYSTEM OVERVIEW
A. 802.11/802.15.4 Spectrum Sensing
Both 802.11 and 802.15.4 technologies work in the unli-censed radio spectrum. In particular, 802.11 standards define11 channels from 2.412 to 2.462 GHz and 802.15.4 defines16 channels from 2.410 to 2.480 GHz, which results in alarge overlap between the channels of 802.11 and 802.15.4.When operating in overlapping channels, 802.11 and 802.15.4radios can interfere with each other [11]. Using a built-inregister called the Received Signal Strength Indicator (RSSI),ZigBee radios can sense the power of signals emitted by near-by WLAN devices although they cannot demodulate WLANsignals. However, there exists a significant gap between thebandwidths of ZigBee and WLAN radios, which are 3 MHzand 22 MHz, respectively. As a result, the RSSI of ZigBeecan only sense the signal power distributed in a fraction ofWLAN bandwidth.
B. Design Objectives
Our goal is to use ZigBee radios as sensors to measure theSNR of 802.11 transmissions, estimate the channel utilizationrate, collect client statistics at a set of designated locations,and detect rogue APs. SNR indicates the quality of wirelesscoverage at a location and has been widely adopted as ametric to characterize the spatial performance of WLANdeployments [15] [12]. Channel utilization rate describes howbusy the wireless channel is. SNR and channel utilization canbe used to infer other important WLAN performance metricslike throughput. WizNet can also discover rogue APs that aredeployed without the authorization of network administrators.Rogue APs may lead to security breach since they can beexploited by third parties to access the secured networks.WLAN user statistics such as the number of potential usersand 802.11 device models provide important information forfuture network upgrades.
Powered by small batteries, WizNet sensors are inexpen-sive and easy to install. These features make WizNet idealfor monitoring WLAN performance at large spatiotemporalscales. However, as a signal-level monitoring tool, WizNetis not designed to diagnose packet-level performance andsecurity issues between AP and WLAN clients. Therefore,
124
WizNet is mainly targeted to complement, instead of com-peting with, existing performance assessment tools based on802.11 radios. In particular, WizNet sensors can be deployeddensely in an ad hoc manner to assist network operators inrapidly locating performance issues of large-scale enterpriseWLANs, and then integrating with 802.11-based networkanalysis tools for further packet-level diagnosis.
C. System Architecture
Sink
WizNet
Manager Access
Points
WizNet
Sensor Cluster
USB
Beacon Log
From APs
RSS Association
AP 1
RSS samples
SNR & Utilization
Estimation
AP N
RSS samples
Manager
RSS
Measurements
Beacon Logs
Ethernet
wireless
Sensor Fusion
Cluster Head
Comm. w/ Sink
Hop Sampling
FoldingAP Scan
Monitoring
Sensor
ZigBee Radio
wireless
SNR & Uitilization
Estimation
Rogue AP Det.
Throughput Est.
Rogue AP Det.
Throughput Est.
RSS measurements
From Sensors
Figure 2. System Architecture of WizNet
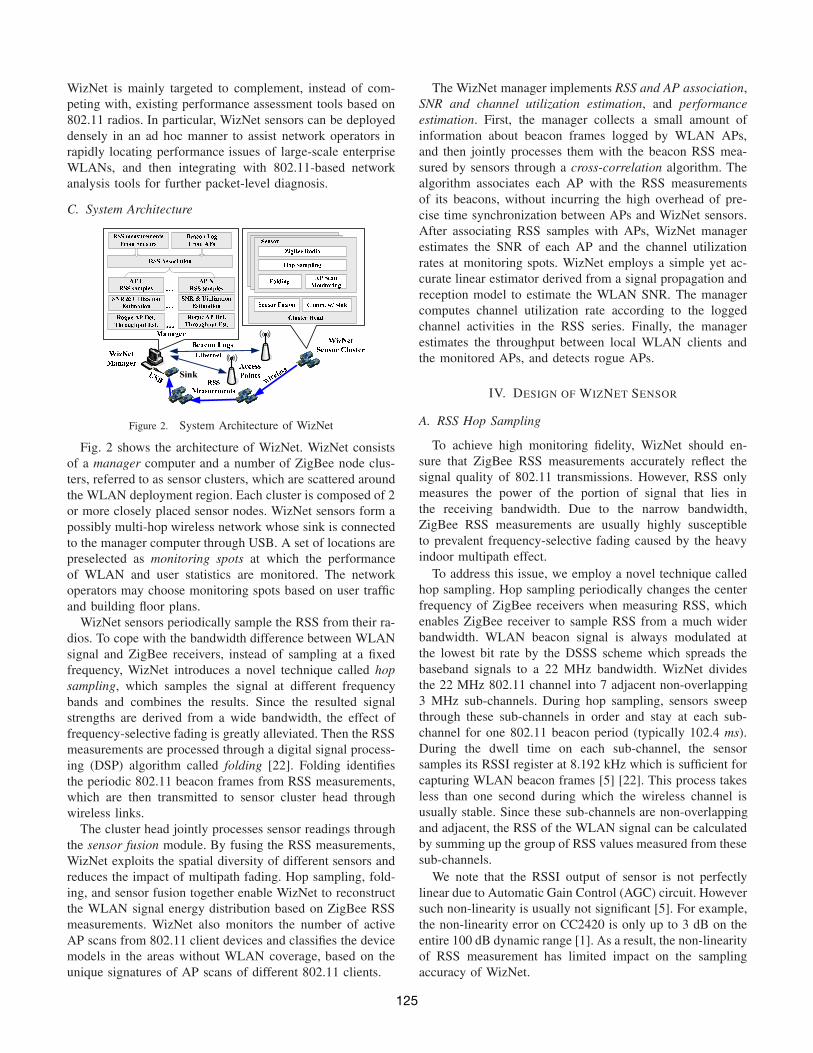
Fig. 2 shows the architecture of WizNet. WizNet consistsof a manager computer and a number of ZigBee node clus-ters, referred to as sensor clusters, which are scattered aroundthe WLAN deployment region. Each cluster is composed of 2or more closely placed sensor nodes. WizNet sensors form apossibly multi-hop wireless network whose sink is connectedto the manager computer through USB. A set of locations arepreselected as monitoring spots at which the performanceof WLAN and user statistics are monitored. The networkoperators may choose monitoring spots based on user trafficand building floor plans.
WizNet sensors periodically sample the RSS from their ra-dios. To cope with the bandwidth difference between WLANsignal and ZigBee receivers, instead of sampling at a fixedfrequency, WizNet introduces a novel technique called hopsampling, which samples the signal at different frequencybands and combines the results. Since the resulted signalstrengths are derived from a wide bandwidth, the effect offrequency-selective fading is greatly alleviated. Then the RSSmeasurements are processed through a digital signal process-ing (DSP) algorithm called folding [22]. Folding identifiesthe periodic 802.11 beacon frames from RSS measurements,which are then transmitted to sensor cluster head throughwireless links.
The cluster head jointly processes sensor readings throughthe sensor fusion module. By fusing the RSS measurements,WizNet exploits the spatial diversity of different sensors andreduces the impact of multipath fading. Hop sampling, fold-ing, and sensor fusion together enable WizNet to reconstructthe WLAN signal energy distribution based on ZigBee RSSmeasurements. WizNet also monitors the number of activeAP scans from 802.11 client devices and classifies the devicemodels in the areas without WLAN coverage, based on theunique signatures of AP scans of different 802.11 clients.
The WizNet manager implements RSS and AP association,SNR and channel utilization estimation, and performanceestimation. First, the manager collects a small amount ofinformation about beacon frames logged by WLAN APs,and then jointly processes them with the beacon RSS mea-sured by sensors through a cross-correlation algorithm. Thealgorithm associates each AP with the RSS measurementsof its beacons, without incurring the high overhead of pre-cise time synchronization between APs and WizNet sensors.After associating RSS samples with APs, WizNet managerestimates the SNR of each AP and the channel utilizationrates at monitoring spots. WizNet employs a simple yet ac-curate linear estimator derived from a signal propagation andreception model to estimate the WLAN SNR. The managercomputes channel utilization rate according to the loggedchannel activities in the RSS series. Finally, the managerestimates the throughput between local WLAN clients andthe monitored APs, and detects rogue APs.
IV. DESIGN OF WIZNET SENSOR
A. RSS Hop Sampling
To achieve high monitoring fidelity, WizNet should en-sure that ZigBee RSS measurements accurately reflect thesignal quality of 802.11 transmissions. However, RSS onlymeasures the power of the portion of signal that lies inthe receiving bandwidth. Due to the narrow bandwidth,ZigBee RSS measurements are usually highly susceptibleto prevalent frequency-selective fading caused by the heavyindoor multipath effect.
To address this issue, we employ a novel technique calledhop sampling. Hop sampling periodically changes the centerfrequency of ZigBee receivers when measuring RSS, whichenables ZigBee receiver to sample RSS from a much widerbandwidth. WLAN beacon signal is always modulated atthe lowest bit rate by the DSSS scheme which spreads thebaseband signals to a 22 MHz bandwidth. WizNet dividesthe 22 MHz 802.11 channel into 7 adjacent non-overlapping3 MHz sub-channels. During hop sampling, sensors sweepthrough these sub-channels in order and stay at each sub-channel for one 802.11 beacon period (typically 102.4 ms).During the dwell time on each sub-channel, the sensorsamples its RSSI register at 8.192 kHz which is sufficient forcapturing WLAN beacon frames [5] [22]. This process takesless than one second during which the wireless channel isusually stable. Since these sub-channels are non-overlappingand adjacent, the RSS of the WLAN signal can be calculatedby summing up the group of RSS values measured from thesesub-channels.
We note that the RSSI output of sensor is not perfectlylinear due to Automatic Gain Control (AGC) circuit. Howeversuch non-linearity is usually not significant [5]. For example,the non-linearity error on CC2420 is only up to 3 dB on theentire 100 dB dynamic range [1]. As a result, the non-linearityof RSS measurement has limited impact on the samplingaccuracy of WizNet.
125

B. RSS Folding
The RSS samples may contain signals of other 2.4 GHzwireless devices such as ZigBee, Bluetooth, or cordlessphones. WizNet needs to not only distinguish WLAN signalsfrom other signals, but also identify signals transmitted bydifferent WLAN APs as each AP may offer different networkperformance. Fig. 3(a) shows the RSS samples taken by aZigBee radio, which contain signals of 2 WLAN APs and 2ZigBee nodes.
Our recent study [22] showed the periodicity of 802.11beacons can be used as a distinctive feature to identifyWLAN signals. Specifically, ZiFi [22] applies a digital sig-nal processing (DSP) algorithm called folding to find theexistence of a periodic signal in the original RSS samples.WizNet also applies folding to search for periodic 802.11beacons in sensor RSS samples. To differentiate individualAPs in RSS samples, WizNet uses folding phase as thesignature of each AP [10]. Due to the contention-based natureof 802.11 MAC, different APs likely transmit their beaconsat different times, resulting in different folding phases. Fig.3(a) shows the RSS samples collected by a ZigBee radio.Fig. 3(b) shows the result after folding RSS samples. Thereare total two peaks in the result. It can be seen that the twopeaks have a phase difference, which allows us to distinguishbeacons transmitted from different APs.
0 2000 4000 6000 8000 10000−100
−90
−80
−70
−60
Index of Samples
RS
S (
dBm
)
(a) RSS series from ZigBee ra-dio.
0 200 400 600 800−100
−90
−80
−70
Index of Samples
RS
S (
dBm
)
Foldingpeaksof beacons
(b) RSS after folding.
Figure 3. ZigBee RSS samples and folding results. The samplescontain signals of 2 WLAN APs and 2 TelosB motes equippedwith CC2420 radio.
C. Sensor Fusion
Hop sampling deals with the frequency-selective fadingcaused by multipath fading by aggregating the RSS samplescollected in multiple ZigBee bandwidths. However, it is onlyable to handle up to to 6 dB fading while our experimentsshow that multipath effect sometimes can vary the RSS for asmuch as 20 dB at some locations and cause significant spatialvariations. Rician fading [13] is the most commonly adoptedstochastic model to characterize the in-door multipath fading.The total power in the dominant paths, denoted as Ω in theRician distribution, is the RSS value WizNet aims to measure.WizNet adopts a maximum likelihood Ω estimation methodproposed by [17]. Specifically, Ω can be estimated by:
Ω̂ =1
N
N∑
i=1
R2i (1)
where N is the number of samples measured at differentlocations, and, Ri is the signal amplitude (in mW). We cansee from Eqn. 1, the maximum likelihood estimate of Ω is
2422 2427 2432 2437 2442 2447 2452−100
−90
−80
−70
−60
Frequency (MHz)
Pow
er (
dBm
)
Position1Position2Averaged
Figure 4. Power Density Spectrum of 802.11b signal distorted bymultipath fading
essentially the spatial averaging of all the powers of thesamples. Fig. 4 shows the power density spectrum of an802.11b node measured by two closely located sensors, andthe average RSS computed according to Eqn. 1. It can be seenthat, the multipath fading can lead to increased (at Position2) or decreased (at Position 1) signal power depending onthe phases of radio waves propagated through different paths,while the sensor fusion effectively mitigates multipath fadingby exploiting the spatial diversity of different sensors.
D. Monitoring AP Scans
User statistics are crucial for WLAN operators to assesscurrent network usage and plan for future upgrades. Thestatistics of interest may include the number of users thatcarry active 802.11 devices and the models of devices indifferent areas of an enterprise campus. A widely adoptedmethod of collecting user statistics is to log AP data traces.However, this method cannot obtain statistics of potentialWLAN users in the areas with little or no WLAN coverage.
A WLAN client discovers APs through either passive oractive scanning. Our analysis of various WLAN drivers showsthat active scanning is triggered by the actions including:powering on the WLAN NIC, booting up OS, and refreshingthe status of available APs. However, 802.11 does not specifyhow a client should implement the scanning mode. Asa result, different 802.11 drivers may behave significantlydifferent in terms of how the scanning probes are transmitted.
Without being able to decode 802.11 frames, WizNetidentifies 802.11 AP scans by searching for the distinctivefingerprints in RSS measurements. Fig. 5(a) shows the RSSmeasurements of AP scanning probes transmitted by twodifferent WLAN clients. One client is an ASUS EeePCnetbook running Ubuntu Linux and the other one is SonyTZ27 laptop running Windows Vista. The RSS samples aretaken on a TelosB mote listening on 802.11 channel 6. Total11 peaks can be seen in the RSS measurements of Linuxclient, which correspond to 11 scanning probes transmittedon 11 different 802.11 channels. Due to channel overlappingand out-of-band emission of 802.11 signals, all probes arecaptured by the sensor listening on channel 6, althoughtheir power magnitudes drop with the increase of channelseparation [18]. Although similar phenomenon is observedfor the Windows client, a key difference is that two probesinstead of one are transmitted on each channel.
126
Algorithm 1 AP Scan Detection1: Retrieve an RSS series (denoted as trace0) through a sliding
window of 1, 200 ms from the RSS measurement.2: Remove samples whose duration does not fall within [366, 732
us], and pass the rest through a binary filter, using TH as thethreshold. The output binary array is trace1.
3: Auto-correlate trace1, and examine whether it is a periodicsignal with a period within [50, 100 ms]. If true, store trace1as a valid AP scan signature. Repeat from step 1.
We measured the scanning probes of 7 WLAN driversimplemented by 5 different systems: Windows (Vista, XP,7), Ubuntu Linux 9.1, Symbian 9.3, iOS 4.3.3, and Android2.2. Our results show that, although the scanning patternsof different WLAN drivers are substantially different, theyshare the following common characteristics: 1) Probes aresent on all 11 802.11 channels using the same transmissionpower, although the scanning order might differ; 2) Thedelay between two probes is constant, resulting in a periodicpattern. Moreover, the period falls within [50, 100 ms]. Asexpected, the period is always shorter than the default 802.11beacon period (102.4 ms) in order to discover APs faster thanthe passive mode. As a result, the total delay of an active scanprocedure lasts shorter than 1, 200 ms. 3) The duration of aprobe frame is short and typically lasts 366 to 732 us. Basedon these characteristics, we have developed an algorithm, asshown in Algorithm 1, to identify AP scans from sensor RSSsamples.
500 1000 1500 2000 2500 3000 3500 4000 4500 5000 5500−100
−80
−60
−40
−20
RSS Sample Index
RS
S (
dBm
)
(a) ASUS EeePC netbook running Ubuntu Linux
100 200 300 400 500 600 700 800−100
−80
−60
−40
RSS Sample Index
RS
S (
dBm
)
(b) Sony TZ27 laptop running Windows Vista
Figure 5. ZigBee RSS measurements of AP scanning probes transmittedby two different WLAN clients.
At step 2, the RSS samples are converted to a binaryarray by thresholding their magnitude. The auto-correlationoperation at step 3 can find the possible period of RSS series,which can accurately identify the model of WLAN client.It requires dot production of RSS samples and incurs highoverhead on sensors. In our implementation, the binary RSSarray output at step 2 is compressed and transmitted to thesink, which then executes the auto-correlation.
E. Impact of WLAN Interference
WizNet sensor cluster heads periodically transmit measure-ment results to WizNet manager, which is susceptible to theinterference of WLAN transmissions. Our experiments show
that WizNet may experience network delay when the WLANtraffic is very heavy (>15% channel utilization). WizNetcan usually tolerate certain amount of communication delay.Some techniques may be employed if the sensors must deliverdata within short deadlines in the presence of heavy WLANtraffic. First, sensors can run simple compressing algorithmsto reduce the amount of data, since the folding results areusually sparse. Second, sensor can buffer the data on-boardand delay the transfer in case of heavy WLAN interference.This is justified by the fact that WLAN traffic is often highlybursty and contains many idle slots [11].
V. DESIGN OF WIZNET MANAGER
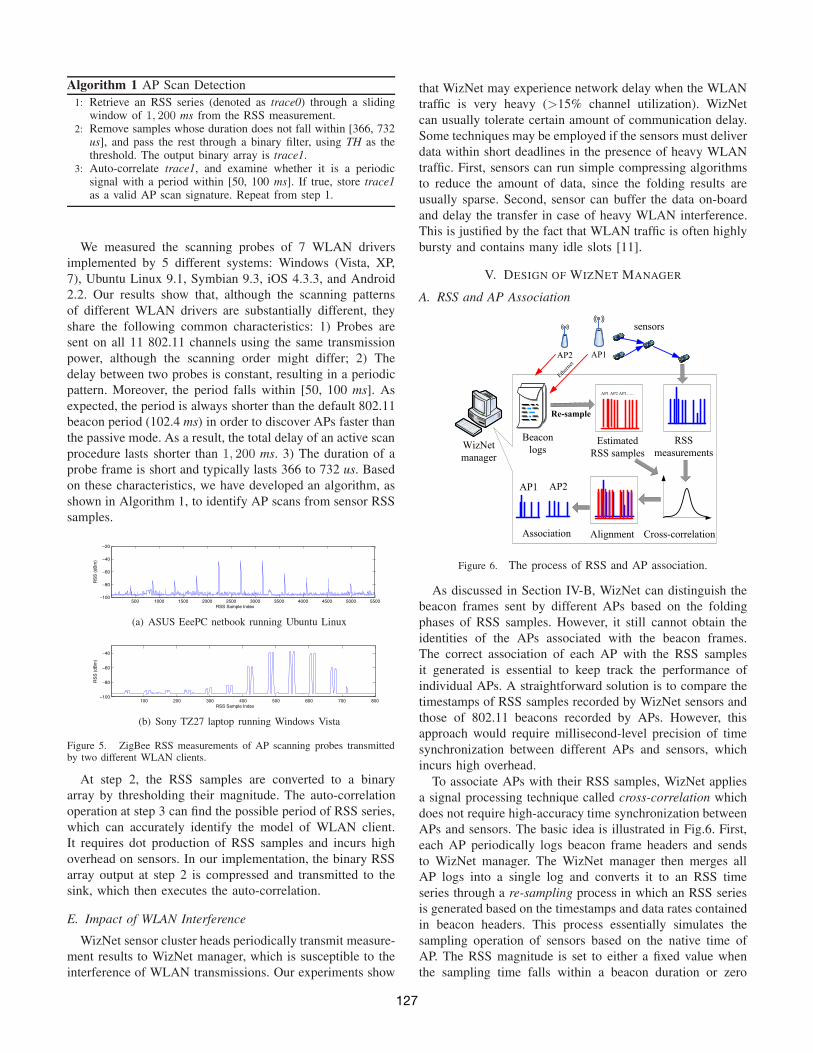
A. RSS and AP Association
AP2 AP1
WizNet manager
Beacon logs
Estimated RSS samples
sensors
RSS measurements
Cross-correlationAlignment
Re-sample
Association
AP1 AP2
Etherne
t
AP1 AP2 AP1…...
Figure 6. The process of RSS and AP association.
As discussed in Section IV-B, WizNet can distinguish thebeacon frames sent by different APs based on the foldingphases of RSS samples. However, it still cannot obtain theidentities of the APs associated with the beacon frames.The correct association of each AP with the RSS samplesit generated is essential to keep track the performance ofindividual APs. A straightforward solution is to compare thetimestamps of RSS samples recorded by WizNet sensors andthose of 802.11 beacons recorded by APs. However, thisapproach would require millisecond-level precision of timesynchronization between different APs and sensors, whichincurs high overhead.
To associate APs with their RSS samples, WizNet appliesa signal processing technique called cross-correlation whichdoes not require high-accuracy time synchronization betweenAPs and sensors. The basic idea is illustrated in Fig.6. First,each AP periodically logs beacon frame headers and sendsto WizNet manager. The WizNet manager then merges allAP logs into a single log and converts it to an RSS timeseries through a re-sampling process in which an RSS seriesis generated based on the timestamps and data rates containedin beacon headers. This process essentially simulates thesampling operation of sensors based on the native time ofAP. The RSS magnitude is set to either a fixed value whenthe sampling time falls within a beacon duration or zero
127

otherwise. Both the generated RSS series and the foldedRSS series from a sensor are then fed into a cross-correlatorthat computes the dot product of two series with differentoffsets. The maximum dot production corresponds to the mostlikely alignment offset between the two series. This offset isessentially the error between the system times of AP andsensor. Finally, the sensor RSS samples are shifted accordingto the offset found and then labeled by the BSSID of thematched AP.
We note that WizNet is not a standalone system due tothe need of AP logs. However, AP logs are typically easy toobtain on most off-the-shelf production APs. For example,many APs run Linux systems that provide various tools forextracting system logs. Moreover, as AP logs are usually veryshort (several KB per second), collecting them does not incurmuch overhead over the network infrastructure. If the systemneeds to be strictly standalone, WizNet can also obtain APlogs from dedicated 802.11 sniffers which capture beaconsfrom nearby APs.
B. SNR and Channel Utilization Estimation
After associating RSS samples with APs, WizNet managerfirst calculates the sensor SNR by subtracting the base noiseof the ZigBee sensors from the RSS samples. The base noiseis computed by applying exponential moving average overthe minimum values in the RSS series. Then the managerinfers the SNR of APs that a WLAN client would receive atevery monitoring spot.
Suppose a WLAN client and a WizNet cluster are locatedat the same location. The signal strength of an 802.11frame is ww and wz at the virtual antennas of WLAN andWizNet receivers, respectively. As WizNet fuses the RSSfrom multiple sensors, the virtual antenna comprises all theantenna of sensors in a cluster. Gw and Gz are the virtualantenna gains of WLAN and WizNet receivers, respectively.Then the signal to noise ratios of the receivers, denoted asSNRw and SNRz , can be expressed as:
SNRw = 10log(wwGwpw/Nw) (2)
SNRz = 10log(wzGzpz/Nz) (3)
where pw and pz are the ratio between the signal powermeasured by receiver RSSI and the total signal power, Nw
and Nz are the receiver noise floors. The sensor fusion ofWizNet mitigates the multipath fading in each cluster. Asa result, if the virtual antennas of WLAN and ZigBee aresufficiently close, ww ≈ wz . Gw and Gz are functions ofthe incoming signal bearing which can be considered samefor closely located virtual receivers. Subtracting Eqn. 3 fromEqn. 2 gives the difference between SNRw and SNRz:
SNRw = SNRz + C (4)
where C can be estimated from a simple and short trainingphase. A different model is estimated for each monitored APbecause C is a function of signal bearing which varies withthe location of source.
A key advantage of our SNR estimation approach is thatthe model training usually only needs to be performed once
before deployment, because of two reasons. First, the noise,multipath and frequency-selective fading that can significant-ly affect the mapping between ZigBee and WLAN SNRs areeffectively dealt with at run time by hop sampling, foldingand sensor fusion of WizNet. Second, the SNR mappingmodel in Eqn. 4 only characterizes the difference betweenZigBee and WLAN measurements after the impact of thesedynamics is accounted for. As a result, this model does notneed to be retrained frequently at run time. Our experimentsthat last more than six days show that WizNet can achievesatisfactory monitoring fidelity after a single offline trainingphase (see Section VI).
WizNet manager then estimates the utilization rates of theAPs’ working channels. Due to the sharing nature of wirelesschannels, only non-occupied time slots on a channel can beutilized by clients. WizNet manager computes the channelutilization rate as the ratio between the number of RSSsamples whose signal strengths are above the noise threshold,and the total number of RSS samples.
C. Throughput Estimation and Rogue AP Detection
The SNR and channel utilization rate can be used to inferthe throughput of WLAN. We now outline the basic ideaand leave the detailed design for future work. We build theempirical model in an offline training phase in which thethroughput of a reference 802.11 client is measured underdifferent SNR and channel utilization rate combinations. Dueto the rate adaptation of WiFi receivers, the throughputexperienced by the reference client is a range of values.WizNet manager then estimates the current throughput bysearching the best match of the measured {SNR, UtilizationRate} pair in the training data set.
WizNet is able to discover rogue APs that are deployedwithout the authorization of network administrators. RogueAPs may lead to security breach since they can be exploitedby third parties to access the secured networks. As discussedin Section V-A, the RSS measured by sensors are associatedwith the APs using cross-correlation between the two RSStraces obtained by sensors and APs, respectively. WizNetmanager labels each identified RSS in the series obtainedby sensors with BSSIDs of the APs. As a result, any APthat cannot be identified is potentially a rogue AP. In thisapproach, each AP is identified by the temporal phases ofits beacon transmissions. By leveraging such PHY layerinformation, WizNet can reliably detect rogue APs even ifthey can forge their SSIDs and MAC addresses.
VI. EXPERIMENTATION
A. System Deployment and Experimental Settings
We have implemented the sensor components of WizNet inTinyOS 2.x on Crossbow TelosB motes. The sensor code hasa footprint of 16 KB and uses 550 bytes of RAM. We are ableto achieve a sampling rate as high as 32.768 kHz on TelosBmotes. However we deliberately decreased the rate to 8.192kHz to conserve energy. The WizNet manager is written inC and Python. We implemented a single clustering protocol
128
0 20 40 60 80 100 120−85
−80
−75
−70
−65
Time (Hours)
RS
S (
dBm
)
RSS
(a) RSS evolution over time.
0 20 40 60 80 100 1200
0.2
0.4
0.6
0.8
1
Time (Hours)
PR
R
PRR
(b) PRR evolution over time.
6pm(d1) 6pm(d2) 6pm(d3) 6pm(d4) 6pm(d5) 6pm(d6)4pm(d7)0
5
10
15
20
25
30
Time
Tra
ffic
(Mbp
s)
Spot2, conference room
(c) Traffic evolution over time.
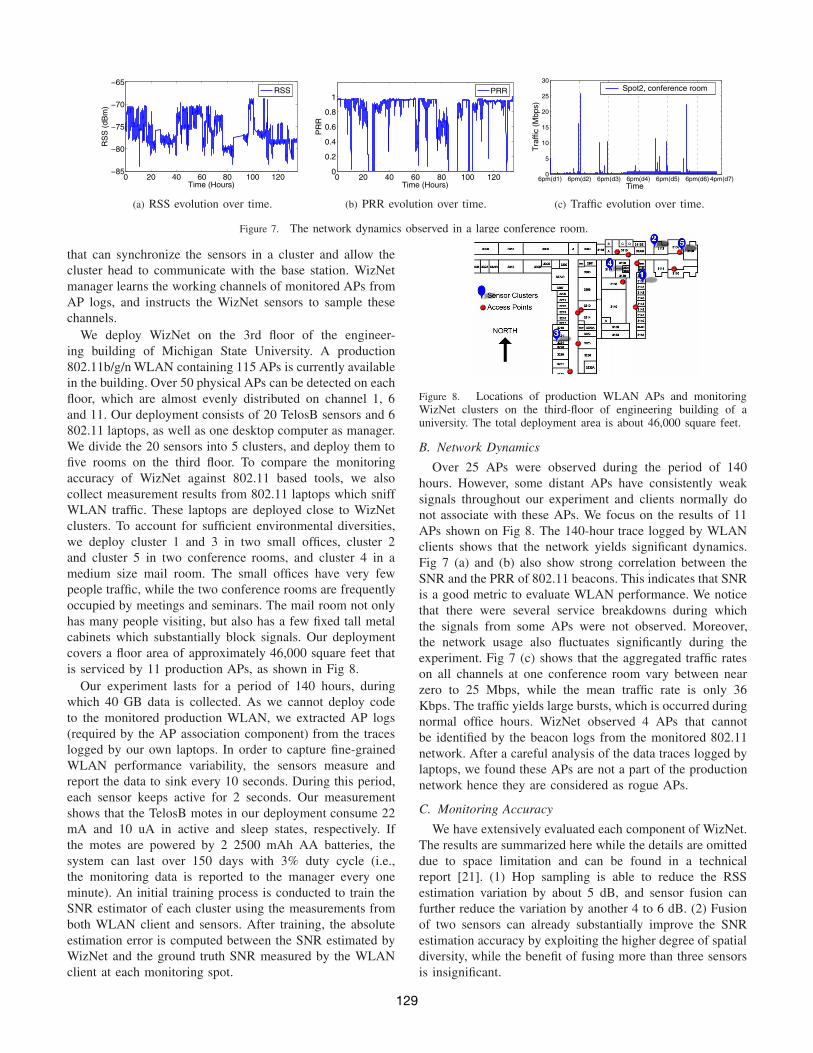
Figure 7. The network dynamics observed in a large conference room.
that can synchronize the sensors in a cluster and allow thecluster head to communicate with the base station. WizNetmanager learns the working channels of monitored APs fromAP logs, and instructs the WizNet sensors to sample thesechannels.
We deploy WizNet on the 3rd floor of the engineer-ing building of Michigan State University. A production802.11b/g/n WLAN containing 115 APs is currently availablein the building. Over 50 physical APs can be detected on eachfloor, which are almost evenly distributed on channel 1, 6and 11. Our deployment consists of 20 TelosB sensors and 6802.11 laptops, as well as one desktop computer as manager.We divide the 20 sensors into 5 clusters, and deploy them tofive rooms on the third floor. To compare the monitoringaccuracy of WizNet against 802.11 based tools, we alsocollect measurement results from 802.11 laptops which sniffWLAN traffic. These laptops are deployed close to WizNetclusters. To account for sufficient environmental diversities,we deploy cluster 1 and 3 in two small offices, cluster 2and cluster 5 in two conference rooms, and cluster 4 in amedium size mail room. The small offices have very fewpeople traffic, while the two conference rooms are frequentlyoccupied by meetings and seminars. The mail room not onlyhas many people visiting, but also has a few fixed tall metalcabinets which substantially block signals. Our deploymentcovers a floor area of approximately 46,000 square feet thatis serviced by 11 production APs, as shown in Fig 8.
Our experiment lasts for a period of 140 hours, duringwhich 40 GB data is collected. As we cannot deploy codeto the monitored production WLAN, we extracted AP logs(required by the AP association component) from the traceslogged by our own laptops. In order to capture fine-grainedWLAN performance variability, the sensors measure andreport the data to sink every 10 seconds. During this period,each sensor keeps active for 2 seconds. Our measurementshows that the TelosB motes in our deployment consume 22mA and 10 uA in active and sleep states, respectively. Ifthe motes are powered by 2 2500 mAh AA batteries, thesystem can last over 150 days with 3% duty cycle (i.e.,the monitoring data is reported to the manager every oneminute). An initial training process is conducted to train theSNR estimator of each cluster using the measurements fromboth WLAN client and sensors. After training, the absoluteestimation error is computed between the SNR estimated byWizNet and the ground truth SNR measured by the WLANclient at each monitoring spot.
Figure 8. Locations of production WLAN APs and monitoringWizNet clusters on the third-floor of engineering building of auniversity. The total deployment area is about 46,000 square feet.
B. Network Dynamics
Over 25 APs were observed during the period of 140hours. However, some distant APs have consistently weaksignals throughout our experiment and clients normally donot associate with these APs. We focus on the results of 11APs shown on Fig 8. The 140-hour trace logged by WLANclients shows that the network yields significant dynamics.Fig 7 (a) and (b) also show strong correlation between theSNR and the PRR of 802.11 beacons. This indicates that SNRis a good metric to evaluate WLAN performance. We noticethat there were several service breakdowns during whichthe signals from some APs were not observed. Moreover,the network usage also fluctuates significantly during theexperiment. Fig 7 (c) shows that the aggregated traffic rateson all channels at one conference room vary between nearzero to 25 Mbps, while the mean traffic rate is only 36Kbps. The traffic yields large bursts, which is occurred duringnormal office hours. WizNet observed 4 APs that cannotbe identified by the beacon logs from the monitored 802.11network. After a careful analysis of the data traces logged bylaptops, we found these APs are not a part of the productionnetwork hence they are considered as rogue APs.
C. Monitoring Accuracy
We have extensively evaluated each component of WizNet.The results are summarized here while the details are omitteddue to space limitation and can be found in a technicalreport [21]. (1) Hop sampling is able to reduce the RSSestimation variation by about 5 dB, and sensor fusion canfurther reduce the variation by another 4 to 6 dB. (2) Fusionof two sensors can already substantially improve the SNRestimation accuracy by exploiting the higher degree of spatialdiversity, while the benefit of fusing more than three sensorsis insignificant.
129

6pm(d1) 6pm(d2) 6pm(d3) 6pm(d4) 6pm(d5) 6pm(d6)
−70
−60
−50
Time
SN
R (
dB)
0 20 40 60 80 100 1200
1
2
3
4
5
Time (Hours)
Est
imat
ion
Err
or (
dB)
Estimation Error@ Cluster 5
WLAN client measurementWizNet estimation
Service Down
Intentionally created SNR variation
(a) Cluster 5 estimation error vs time.
6pm(d1) 6pm(d2) 6pm(d3) 6pm(d4) 6pm(d5) 6pm(d6) 4pm(d7)−70
−60
−50
Time
SN
R (
dB)
0 20 40 60 80 100 120 1400
1
2
3
4
5
Time (Hours)
Est
imat
ion
Err
or (
dB)
Estimation Error@ Cluster 1
WLAN client measurmentWizNet estimation
Service Down
(b) Cluster 1 estimation error vs time.
Figure 9. Estimation error vs time.
We now evaluate the impact of training time on theaccuracy of SNR estimator. The absolute estimation error iscomputed between the SNR estimated by WizNet and thereal SNR measured by the laptop. Each CDF in Fig. 12includes the errors of all four APs monitored at spot 2. Wecan see that the error decreases when a longer training periodis used. However, even when the system is only trained for200 seconds, 90% of errors over the period of 140 hoursfall below 3 dB. When the training time is prolonged to500 seconds, only slight performance gain is achieved. Weadopted a training period of 200 seconds in the followingexperiments.
Next we evaluate the impact of sensor fusion on estimationaccuracy at monitoring spot 2 by varying the number ofsensors. Fig. 10 shows that the absolute estimation errorsof all 4 monitored APs become smaller when the number ofsensor increases. When the number of sensors is sufficientlylarge (> 3), the error decrease becomes insignificant. Fig 11shows the RSS estimation of all clusters over the 140-hourperiod. We can see that clusters 2 and 4 perform slightlyworse than other clusters. This is because they are placedin the two conference rooms where passing pedestrians areconstantly present during normal work hours. Nevertheless,80% of errors fall below 2.5 dB.
D. Spatiotemporal Performance Analysis
The results in the previous section show that WizNetyields satisfactory monitoring accuracy during the 140-hourevaluation period. We now analyze the micro-scale spatiotem-poral performance of the system. We focus on the analysison 2 APs that experienced the highest dynamics in ourexperiment. Fig 9 shows the ground truth and estimatedSNR of the two APs (monitored by cluster 1 and cluster 5,respectively). It can be seen that both APs yield significantperformance variability. However, both clusters are able toaccurately track the dynamics of the APs and maintain SNRestimation errors within 4 dB. This result indicates that theSNR variation caused by environmental factors has littleimpact on WizNet monitoring fidelity. Instead, we observethat the estimation errors gradually increased over time afterthe initial training. We suspect that the increased inaccuracy
is largely attributed to the radio hardware drifts caused bytemperature and humidity changes. However, the overall errorincrease is within 1 dB during the period of 6 days. As shownin Fig 12, a longer training length (2 to 3 minutes) would givemore consistent estimation accuracy.
We also notice that, once WizNet is properly trained, itsperformance is resilient to dynamic obstacles in the envi-ronment. This is confirmed partially by the fact that peopletraffic is regularly present in our testing areas. Moreover,we deliberately rearranged some furniture, including chairsand tall metal shelves near cluster 5 after training duringthe experiment, and the time period is marked on 9 (a)by a rectangle. Although substantial variation was observedfrom SNR measurements, WizNet still maintains a smallestimation error compared with the measurement of 802.11laptop. This is due to the fact that the hop sampling andsensor fusion components effectively mitigated the dynamicsof multipath fading in the environment.
E. Client Classification
We evaluate the accuracy of monitoring AP scans using aWizNet senor placed in an office without WLAN coverage1.Users carrying different 802.11 client devices listed in Table Iroam about the testing area. In the first experiment, only oneuser appears in the area at a time. The results evaluate theperformance of AP scan recognition algorithm presented inSection IV-D. Each client device performs 100 active scans.A Ubuntu Linux laptop is used to record the sniffed APscans as ground truth. The WizNet sensor starts with noknowledge of any scan patterns. The overall accuracy ofthe system is shown in Table I (columns labeled as “single-client”). It can be seen that the classification accuracy variesfor different clients, due to the fact that AP scans of somesystems have more evident features than others. However,all the classification errors fall below 10%. In the secondexperiment, four users carrying different client devices appearin the testing area at the same time, and each client issues 100scans. Table I (columns labeled as “multi-client”) shows that
1WizNet obtains the user statistics directly from AP logs in the areas withWLAN coverage
130

0 1 2 3 4 50
0.2
0.4
0.6
0.8
1
Absolute Estimation Error (dB)
CD
F
2 sensors3 sensors4 sensors
Figure 10. CDF of estimation errors vssensor number.
0 1 2 3 4 50
0.2
0.4
0.6
0.8
1
Absolute Estimation Error (dB)
CD
F
cluster 5cluster 4cluster 3cluster 2cluster 1
Figure 11. Error of RSS estimation of allclusters.
0 1 2 3 4 50
0.2
0.4
0.6
0.8
1
Absolute Estimation Error (dB)
CD
F
20s50s200s500s1000s
Figure 12. CDF of estimation errors vstraining length.
Table IFALSE POSITIVE AND NEGATIVE RATES OF 802.11 CLIENT
CLASSIFICATION.
Client FN Rate FP Rate(single-/multi-client)
Nokia E52-Symbian 9.3 6% / 9% 3% / 5%Apple iPhone-iOS 4.3.3 6% / 11% 8% / 15%Lenovo X200-Win 7 10% / 19% 2% / 2%Sony S26C-Win XP 2% / 4% 7% / 13%ASUS EeePC-Ubuntu 9.1 2% 10%HTC Desire-Android 2.2 5% 5%
the AP scan probes transmitted by 802.11 driver of Windows7 are substantially shorter than other systems, making themeasier to be missed in RSS sampling. Moreover, the featuresof iOS AP scans are less distinctive. As a result, 15% ofthese scans are mistakenly classified as from other systems.
VII. CONCLUSION AND FUTURE WORK
This paper describes a ZigBee-based WLAN monitoringsystem called WizNet. Powered by batteries, WizNet nodescan be deployed in large quantities to monitor the spatialperformance of a WLAN in long periods of time. By adoptingdigital signal processing techniques, WizNet automaticallyidentifies 802.11 signals from ZigBee RSS measurements,associates them with wireless access points, and accuratelyestimate the SNR and channel utilization rate. WizNet canalso collect user statistics based on RSS signatures of 802.11access point scans and discover rogue APs. WizNet hasbeen implemented in TinyOS 2.x and extensively evaluatedon a wireless testbed consisting of 26 TelosB motes and802.11 nodes. Our results over a period of 140 hours showthat WizNet can accurately capture the spatial and temporalperformance variability of a large-scale production WLAN.
WizNet mainly focuses on accurate assessment of WLANsignal quality. We will integrate WizNet with existing 802.11radio based WLAN monitoring tools to achieve packet-level performance diagnosis. Moreover, we plan to design alocalization component that can infer the locations of WLANclients based on sensor RSS measurements.
ACKNOWLEDGMENT
This research was supported in part by the U.S. NSFunder grants CNS 0916576 and CNS-0954039 (CAREER),and NSF of China under grant 61170296.
REFERENCES
[1] Texas Instruments Inc., CC2420: Single-Chip 2.4 GHz IEEE802.15.4 Compliant RF Transceiver.
[2] Airtight netwoks. http://airtightnetworks.net.[3] Berkeley wifi products. http://www.bvsystems.com/Products/
WLAN/WLAN.htm.[4] Fluke airmagnet wifi measurement tools. http://www.
airmagnet.com/solutions/.[5] C. Boano, T. Voigt, C. Noda, K. Romer, and M. Zuniga.
Jamlab: Augmenting sensornet testbeds with realistic andcontrolled interference generation. In IPSN’11.
[6] V. Bychkovsky, B. Hull, A. Miu, H. Balakrishnan, and S. Mad-den. A measurement study of vehicular internet access usingin situ wi-fi networks. In MobiCom, 2006.
[7] R. Chandra, J. Padhye, A. Wolman, and B. Zill. A location-based management system for enterprise wireless lans. InNSDI, 2007.
[8] R. Chandra, V. Padmanabhan, and M. Zhang. Wifiprofiler:Cooperative diagnosis in wireless lans. In MobiSys, 2006.
[9] Y.-C. Cheng, M. Afanasyev, P. Verkaik, P. Benko, J. Chiang,A. C. Snoeren, S. Savage, and G. M. Voelker. Automatingcross-layer diagnosis of enterprise wireless networks. InSIGCOMM, 2007.
[10] T. Hao, R. Zhou, G. Xing, and M. Mutka. Wizsync: Exploitingwi-fi infrastructure for clock synchronization in wireless sensornetworks. In RTSS, 2011.
[11] J. Huang, G. Xing, G. Zhou, and R. Zhou. Beyond co-existence: Exploiting wifi white space for zigbee performanceassurance. In ICNP, 2010.
[12] K.-H. Kim, A. W. Min, and K. G. Shin. Sybot: An adaptiveand mobile spectrum survey system for wifi networks. InMOBICOM, 2010.
[13] J.-P. M. G. Linmartz. Wireless Communication, The InteractiveMultimedia CD-ROM. Baltzer Science Publishers, 1996.
[14] R. Mahajan, M. Rodrig, D. Wetherall, and J. Zahorjan. Ana-lyzing the mac-level behavior of wireless networks in the wild.In SIGCOMM, 2006.
[15] J. Robinson, R. Swaminathan, and E. W. Knightly. Assessmentof urban-scale wireless networks with a small number ofmeasurements. In MOBICOM, 2008.
[16] I. Rose and M. Welsh. Mapping the urban wireless landscapewith argos. SenSys ’10.
[17] K. K. Talukdar and W. D. Lawing. Estimation of the param-eters of the rice distribution. J. Acoust. Soc. Am., 89.
[18] F. Vanheel, J. Verhaevert, and I. Moerman. Study on distanceof interference sources on wireless sensor network. In EuMC2008.
[19] Y. Z. Wenxian Li and T. He. Wibee: Building wi-fi radiomap with zigbee sensor networks. In IEEE INFOCOM ’12Mini-Conference, 2012.
[20] J. Yeo, M. Youssef, T. Henderson, and A. Agrawala. Anaccurate technique for measuring the wireless side of wirelessnetworks. In Workshop on WiTMeMo, 2005.
[21] R. Zhou, G. Xing, X. Xu, J. Wang, and L. Gu. Wiznet: Azigbee-based sensor system for distributedwireless lan perfor-mance monitoring. Technical Report MSU-CSE-12-12, Michi-gan State University. http://www.cse.msu.edu/publications/tech/TR/MSU-CSE-12-12.pdf.
[22] R. Zhou, Y. Xiong, G. Xing, L. Sun, and J. Ma. Zifi: Wirelesslan discovery via zigbee interference signatures. In MobiCom,2010.
131