
Wiz and Fair Lending Wiz 7.3 Service Pack 1.0...CRA Wiz and Fair Lending Wiz 7.3 Service Pack 1.0:...
87
CRA Wiz and Fair Lending Wiz 7.3 Service Pack 1.0: CRA Tables Table Definitions May 2018
Transcript of Wiz and Fair Lending Wiz 7.3 Service Pack 1.0...CRA Wiz and Fair Lending Wiz 7.3 Service Pack 1.0:...
CRA Wiz and Fair Lending Wiz 7.3 Service Pack 1.0: CRA Tables Table Definitions
May 2018

Consumer Compliance Solutions
2
Table of Contents Table of Contents ........................................................................................................................................................................... 2
Demographic Data .............................................................................................................................................................................. 5
Table A - Demographic Information of the Assessment Area ........................................................................................................ 5
Table B - Median Family Income Ranges........................................................................................................................................ 7
Branch and ATM Distribution ............................................................................................................................................................. 9
Table C - Branch and ATM Distribution Level by Geography Income Level ................................................................................... 9
Inside/Outside Assessment Area Reports ........................................................................................................................................ 11
Table D - Lending Inside and Outside of the Assessment Area .................................................................................................... 11
Version 2 ................................................................................................................................................................................... 13
Home Mortgage Reports .................................................................................................................................................................. 16
Table E - Geographic Distribution of Home Mortgage Loans ...................................................................................................... 16
Version 2 ................................................................................................................................................................................... 20
Table I - Distribution of Home Mortgage Loans by Borrower Income Level ................................................................................ 22
Version 2 ................................................................................................................................................................................... 25
Table O - Assessment Area Distribution of Home Mortgage Loans by Category of the Geography ........................................... 27
Workpaper O - Assessment Area Distribution of Home Mortgage Loans by Category of Geography ........................................ 28
Table P - Assessment Area Distribution of Home Mortgage Loans by Income Category of Borrower ........................................ 29
Workpaper P - Assessment Area Distribution of Home Mort Loans by Income Category of Borrower ...................................... 30
Small Business Reports ..................................................................................................................................................................... 32
Table F - Geographic Distribution of Small Business Loans .......................................................................................................... 32
Version 2 ................................................................................................................................................................................... 35
Consumer Compliance Solutions
3
Table J - Distribution of Small Business Loans by Gross Annual Revenue Category .................................................................... 37
Version 2 ................................................................................................................................................................................... 40
Table M - Detailed Distribution of Small Business Loans by Gross Annual Revenues ................................................................. 41
Table Q - Assessment Area Distribution of Loans to Small Businesses by Income Category of Geography ................................ 43
Workpaper Q - Assessment Area Distribution of Loans to Small Businesses by Income Category of Geography ...................... 44
Table R - Assessment Area Distribution of Loans to Small Businesses by Gross Annual Revenues ............................................. 46
Workpaper R - Assessment Area Distribution of Loans to Small Businesses by Gross Annual Revenues ................................... 47
Small Farm Reports .......................................................................................................................................................................... 49
Table G - Geographic Distribution of Small Farm Loans .............................................................................................................. 49
Version 2 ................................................................................................................................................................................... 52
Table K - Distribution of Small Farm Loans by Gross Annual Revenue Category ......................................................................... 54
Version 2 ................................................................................................................................................................................... 57
Table N - Detailed Distribution of Small Farm Loans by Gross Annual Revenues ........................................................................ 58
Table S - Assessment Area Distribution of Loans to Farms by Income Category of Geography .................................................. 60
Workpaper S - Assessment Area Distribution of Loans to Farms by Income Category of Geography ........................................ 61
Table T - Assessment Area Distribution of Loans to Farms by Gross Annual Revenues .............................................................. 62
Workpaper T - Assessment Area Distribution of Loans to Farms by Gross Annual Revenues ..................................................... 63
Consumer Reports ............................................................................................................................................................................ 65
Table H - Geographic Distribution of Consumer Loans ................................................................................................................ 65
Version 2 ................................................................................................................................................................................... 69
Table L - Distribution of Consumer Loans by Borrower Income Level ......................................................................................... 71
Version 2 ................................................................................................................................................................................... 74
Table U - Assessment Area Distribution of Consumer Loans by Income Cateogory of Geography ............................................. 76
Consumer Compliance Solutions
4
Table V - Assessment Area Distribution of Consumer Loans by Income Category of Borrower ................................................. 77
Workpaper V - Assessment Area Distribution of Consumer Loans by Income Category of Borrower ........................................ 78
Other Reports ................................................................................................................................................................................... 79
Table W - Scoping Report ............................................................................................................................................................. 79
Table X - Community Development ............................................................................................................................................. 80
Table Y - Federal Report ............................................................................................................................................................... 83

Consumer Compliance Solutions
5
Demographic Data
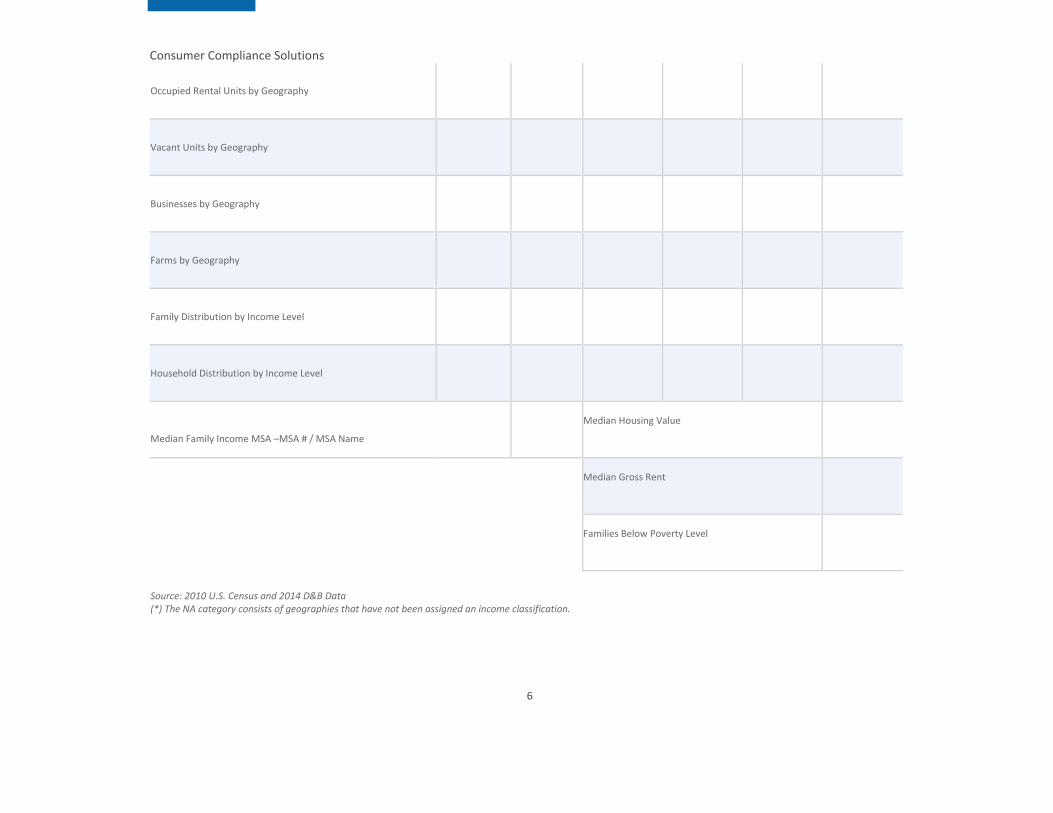
Table A - Demographic Information of the Assessment Area
Table A contains demographic data from the US Census and the last year of Business Demographic in the evaluation period (that is installed on the machine running the reports.) Median family income level of the MSA is generated for every MSA contained in the assessment areas selected, and is pulled from the US Census.
This report is generated for every assessment area and one of the combined assessment areas.
Table A – Demographic Information of the Assessment Area
Assessment Area: XXXX
Demographic Characteristics # Low % of #
Moderate % of #
Middle % of #
Upper % of #
NA* % of #
Geographies (Census Tracts)
Population by Geography
Housing Units by Geography
Owner-Occupied Units by Geography
Consumer Compliance Solutions
6
Occupied Rental Units by Geography
Vacant Units by Geography
Businesses by Geography
Farms by Geography
Family Distribution by Income Level
Household Distribution by Income Level
Median Family Income MSA –MSA # / MSA Name Median Housing Value
Median Gross Rent
Families Below Poverty Level
Source: 2010 U.S. Census and 2014 D&B Data (*) The NA category consists of geographies that have not been assigned an income classification.
Consumer Compliance Solutions
7
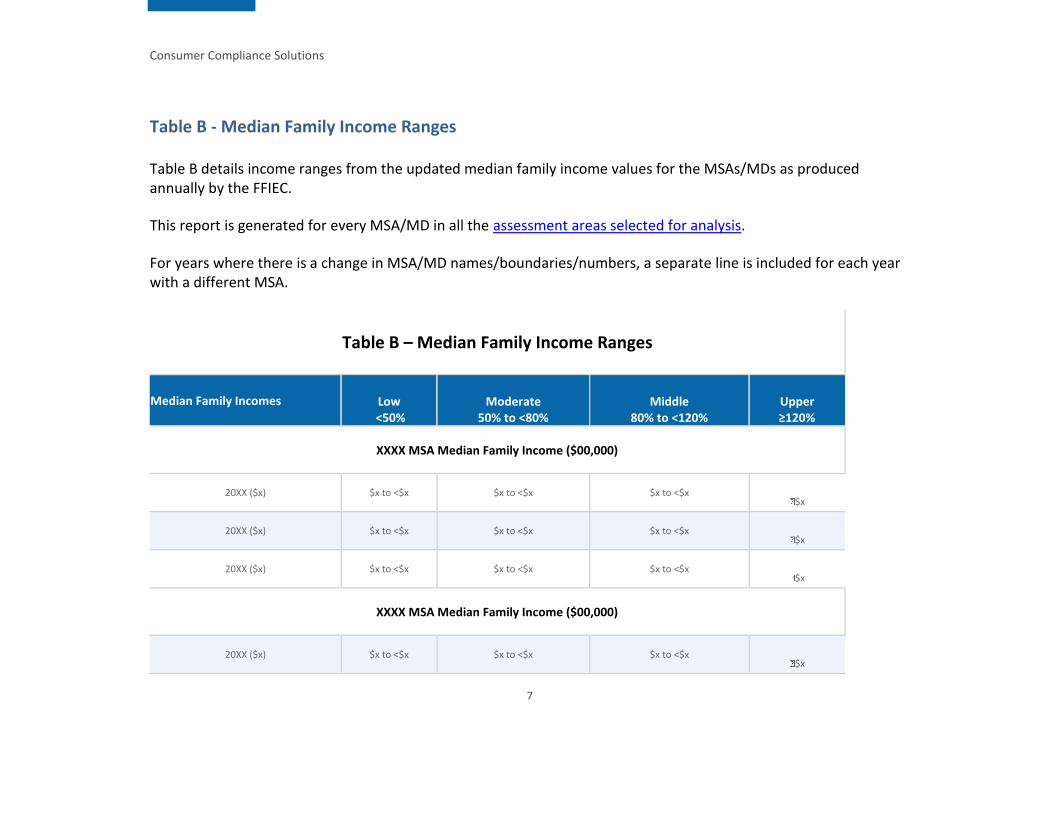
Table B - Median Family Income Ranges
Table B details income ranges from the updated median family income values for the MSAs/MDs as produced annually by the FFIEC.
This report is generated for every MSA/MD in all the assessment areas selected for analysis.
For years where there is a change in MSA/MD names/boundaries/numbers, a separate line is included for each year with a different MSA.
Table B – Median Family Income Ranges
Median Family Incomes Low <50%
Moderate 50% to <80%
Middle 80% to <120%
Upper ≥120%
XXXX MSA Median Family Income ($00,000)
20XX ($x) $x to <$x $x to <$x $x to <$x $x
20XX ($x) $x to <$x $x to <$x $x to <$x $x
20XX ($x) $x to <$x $x to <$x $x to <$x $x
XXXX MSA Median Family Income ($00,000)
20XX ($x) $x to <$x $x to <$x $x to <$x $x

Consumer Compliance Solutions
8
20XX ($x) $x to <$x $x to <$x $x to <$x $x
20XX ($x) $x to <$x $x to <$x $x to <$x $x

Consumer Compliance Solutions
9
Branch and ATM Distribution
Table C - Branch and ATM Distribution Level by Geography Income Level
Table C contains demographic data from the US Census for the number of Census tracts and the population in those tracts. The Branch & ATM data is entered using the Branch and ATM pane of the tables configuration screen.
Tip: You can generate this report even if you did not enter information in the Branch and ATM pane; the report will generate with the census tract and population information only.
This report is generated for every assessment area and one of the combined assessment areas.
Table C - Branch and ATM Distribution by Geography Income Level
Assessment Area: XXXX
Tract Income Level Census Tracts Population Branches ATMs
# % # % # % # %
Low
Moderate

Consumer Compliance Solutions
10
Middle
Upper
Not Available
Totals
Source: 2010 U.S. Census & Bank Data
Consumer Compliance Solutions
11
Inside/Outside Assessment Area Reports
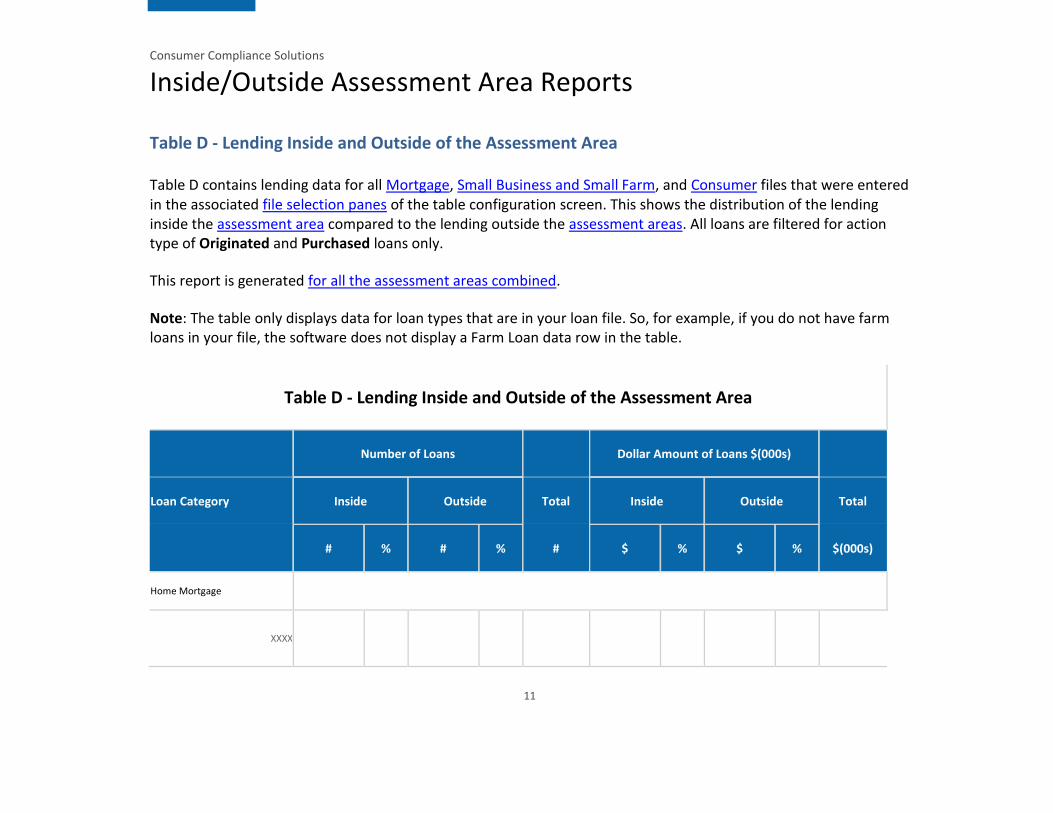
Table D - Lending Inside and Outside of the Assessment Area
Table D contains lending data for all Mortgage, Small Business and Small Farm, and Consumer files that were entered in the associated file selection panes of the table configuration screen. This shows the distribution of the lending inside the assessment area compared to the lending outside the assessment areas. All loans are filtered for action type of Originated and Purchased loans only.
This report is generated for all the assessment areas combined.
Note: The table only displays data for loan types that are in your loan file. So, for example, if you do not have farm loans in your file, the software does not display a Farm Loan data row in the table.
Table D - Lending Inside and Outside of the Assessment Area
Number of Loans Dollar Amount of Loans $(000s)
Loan Category Inside Outside Total Inside Outside Total
# % # % # $ % $ % $(000s)
Home Mortgage
XXXX

Consumer Compliance Solutions
12
XXXX
XXXX
Subtotal
Small Business
XXXX
XXXX
XXXX
Subtotal
Small Farm
XXXX
XXXX
Consumer Compliance Solutions
13
XXXX
Subtotal
Total
Source: MM/DD/YYYY-MM/DD/YYYY Bank Data
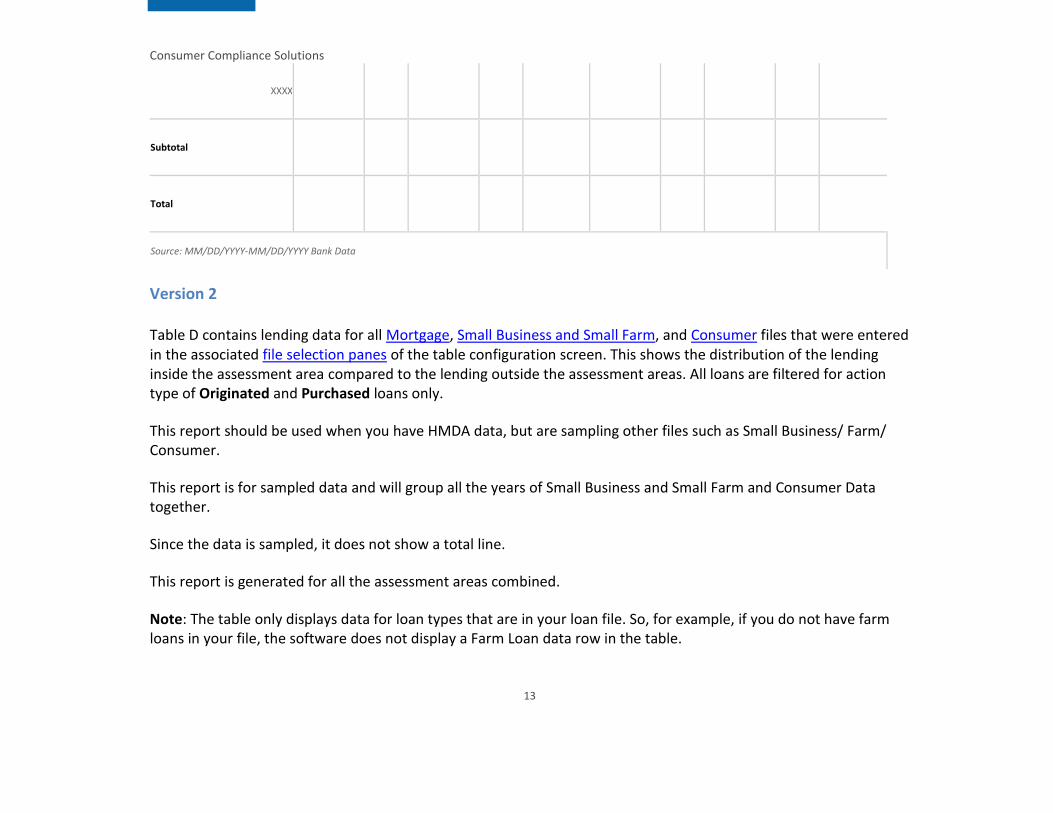
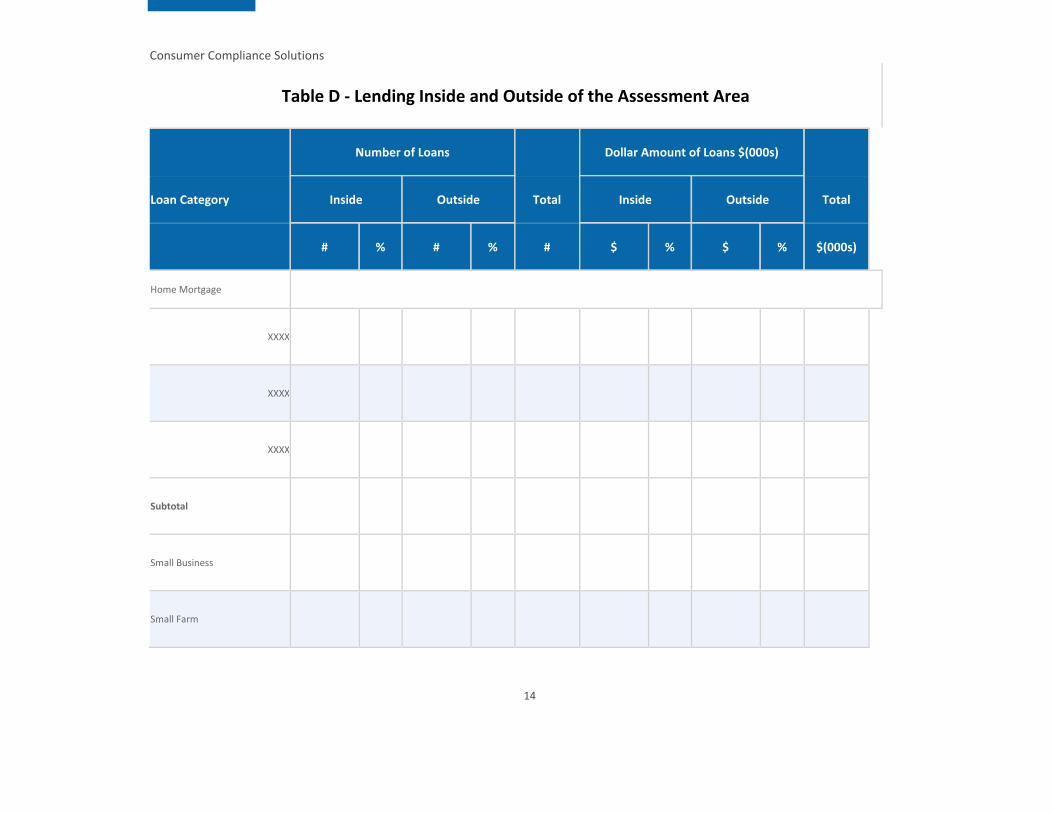
Version 2
Table D contains lending data for all Mortgage, Small Business and Small Farm, and Consumer files that were entered in the associated file selection panes of the table configuration screen. This shows the distribution of the lending inside the assessment area compared to the lending outside the assessment areas. All loans are filtered for action type of Originated and Purchased loans only.
This report should be used when you have HMDA data, but are sampling other files such as Small Business/ Farm/ Consumer.
This report is for sampled data and will group all the years of Small Business and Small Farm and Consumer Data together.
Since the data is sampled, it does not show a total line.
This report is generated for all the assessment areas combined.
Note: The table only displays data for loan types that are in your loan file. So, for example, if you do not have farm loans in your file, the software does not display a Farm Loan data row in the table.
Consumer Compliance Solutions
14
Table D - Lending Inside and Outside of the Assessment Area
Number of Loans Dollar Amount of Loans $(000s)
Loan Category Inside Outside Total Inside Outside Total
# % # % # $ % $ % $(000s)
Home Mortgage
XXXX
XXXX
XXXX
Subtotal
Small Business
Small Farm

Consumer Compliance Solutions
15
Consumer
Source: MM/DD/YYYY-MM/DD/YYYY Bank Data

Consumer Compliance Solutions
16
Home Mortgage Reports
Table E - Geographic Distribution of Home Mortgage Loans
Table E is based on the HMDA/Mortgage files that you select for analysis in the HMDA/Mortgage File Selection pane. Loans are filtered for action type of Originated and Purchased loans only. Table E contains the lending data and the corresponding demographic data from the US Census. If you select peer data in the HMDA/Mortgage file selection pane, the aggregate data fields will be populated for the years the data is available.
If you select a specific institution in the table configuration screen and that institution has a market share in the selected assessment areas, the software displays a market share percentage in the Market Share column. If no institution is selected, the software does not display the Market Share column.
Note: The software displays percent (%) of owner-occupied units and percent (%) of housing where owner or co-owner lives in the unit even if the property is mortgaged or not fully paid for.
Tables for HMDA/CRA Reporters:

Consumer Compliance Solutions
17
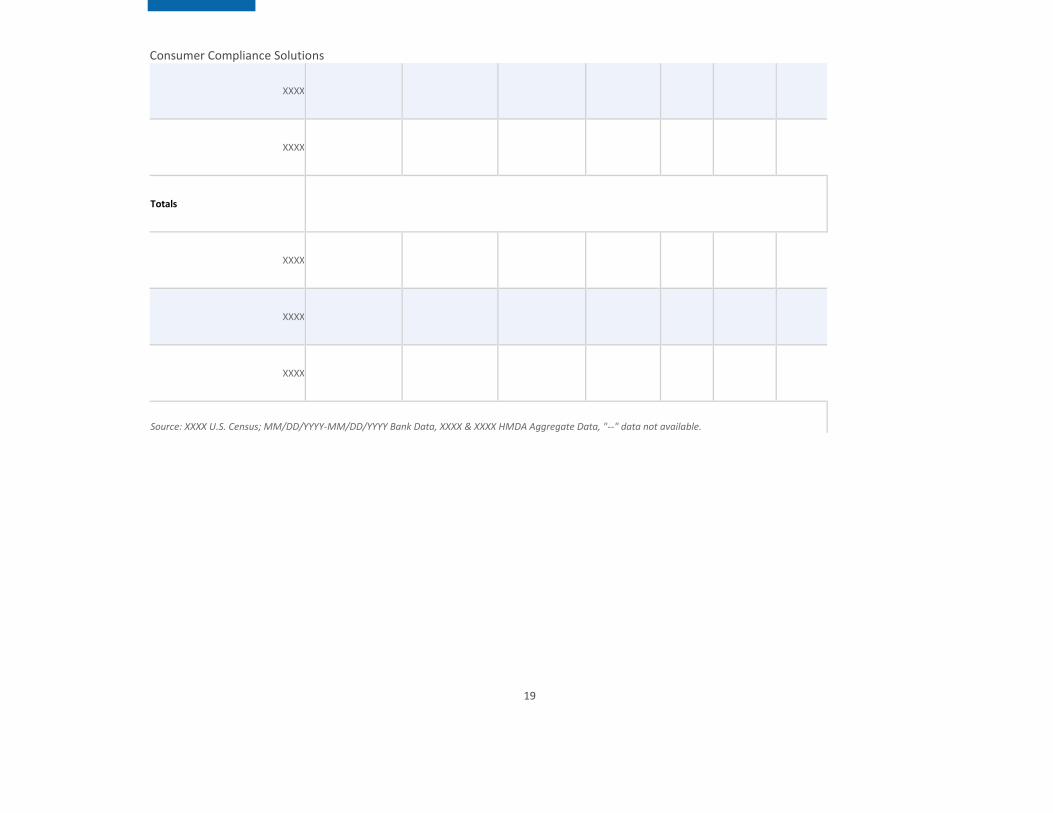
Table E – Geographic Distribution of Home Mortgage Loans
Assessment Area: XXXX
Tract Income Level % of Owner-
Occupied Housing Units
Aggregate Performance
% of #
Market Share % of #
# % $(000s) %
Low
XXXX
XXXX
XXXX
Moderate
XXXX
XXXX

Consumer Compliance Solutions
18
XXXX
Middle
XXXX
XXXX
XXXX
Upper
XXXX
XXXX
XXXX
Not Available
XXXX
Consumer Compliance Solutions
19
XXXX
XXXX
Totals
XXXX
XXXX
XXXX
Source: XXXX U.S. Census; MM/DD/YYYY-MM/DD/YYYY Bank Data, XXXX & XXXX HMDA Aggregate Data, "--" data not available.

Consumer Compliance Solutions
20
Version 2
Table E is based on the mortgage files that you select for analysis in the HMDA/Mortgage File Selection pane. The table contains the lending data and the corresponding demographic data from the US Census. Loans are filtered for action type of Originated and Purchased loans only. No peer data is included in this table.
If you select multiple HMDA/Mortgage files for analysis, those years of data are combined into one row for each of the income categories.
Note: The software displays percent (%) of owner-occupied units and percent (%) of housing where owner or co-owner lives in the unit even if the property is mortgaged or not fully paid for.
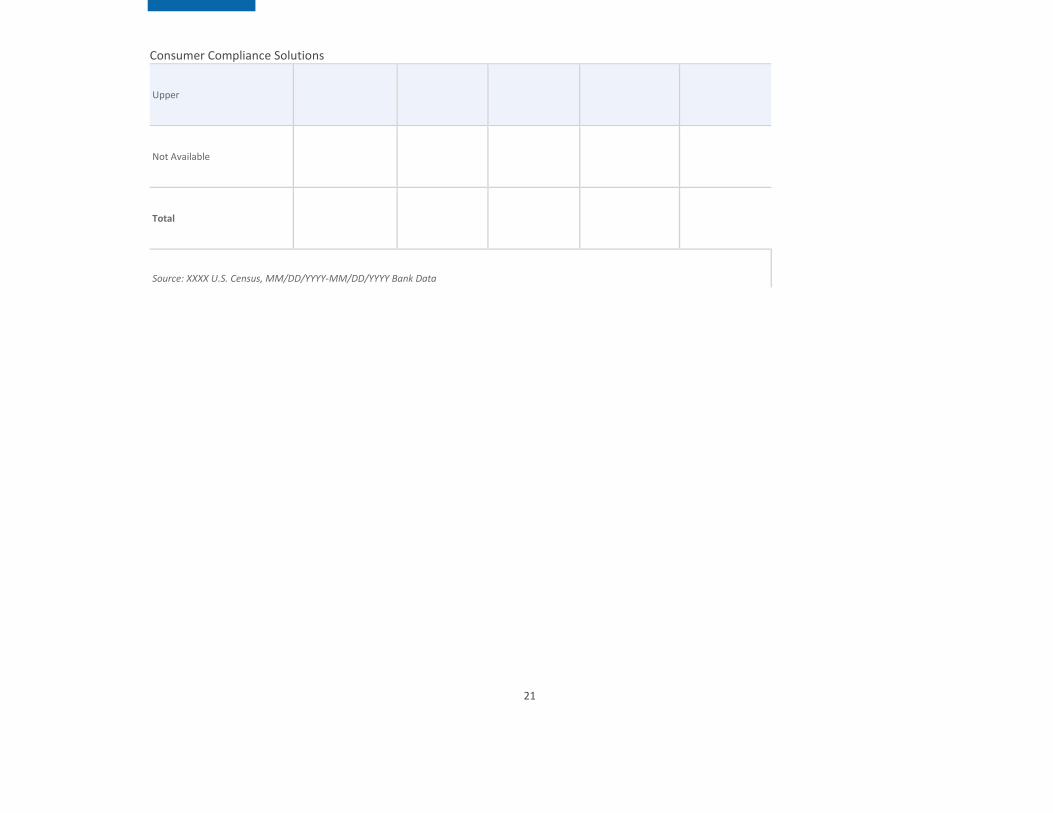
Table E - Geographic Distribution of Home Mortgage Loans
Assessment Area: XXXX
Tract Income Level % of Owner-
Occupied Housing Units
# % $(000s) %
Low
Moderate
Middle
Consumer Compliance Solutions
21
Upper
Not Available
Total
Source: XXXX U.S. Census, MM/DD/YYYY-MM/DD/YYYY Bank Data

Consumer Compliance Solutions
22
Table I - Distribution of Home Mortgage Loans by Borrower Income Level
Table I is based on the mortgage files you select in the HMDA/Mortgage file selection pane of the tables configuration screen. Table I contains the lending data and the corresponding demographic data from the US Census. Loans are filtered for action type of Originated and Purchased loans only. If you select peer data in the HMDA/Mortgage file selection pane, the aggregate data fields are populated for the years the data is available.
If you select a specific institution for market share analysis in the table configuration screen and that institution has a market share in the areas selected, the software displays a market share percentage in the Market Share column. If you do not select an institution, the software does not display the Market Share column.
The % of Families column displays the count and percentage of low, moderate, middle and upper income families.
Tables for HMDA/CRA Reporters:
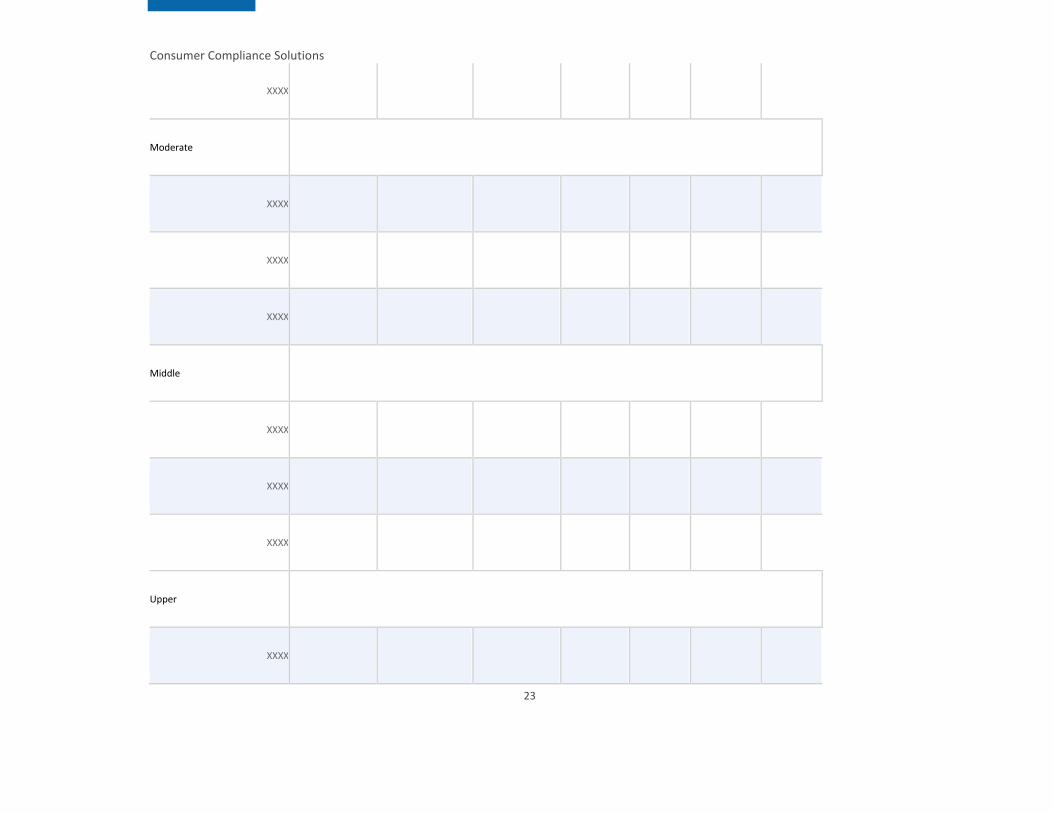
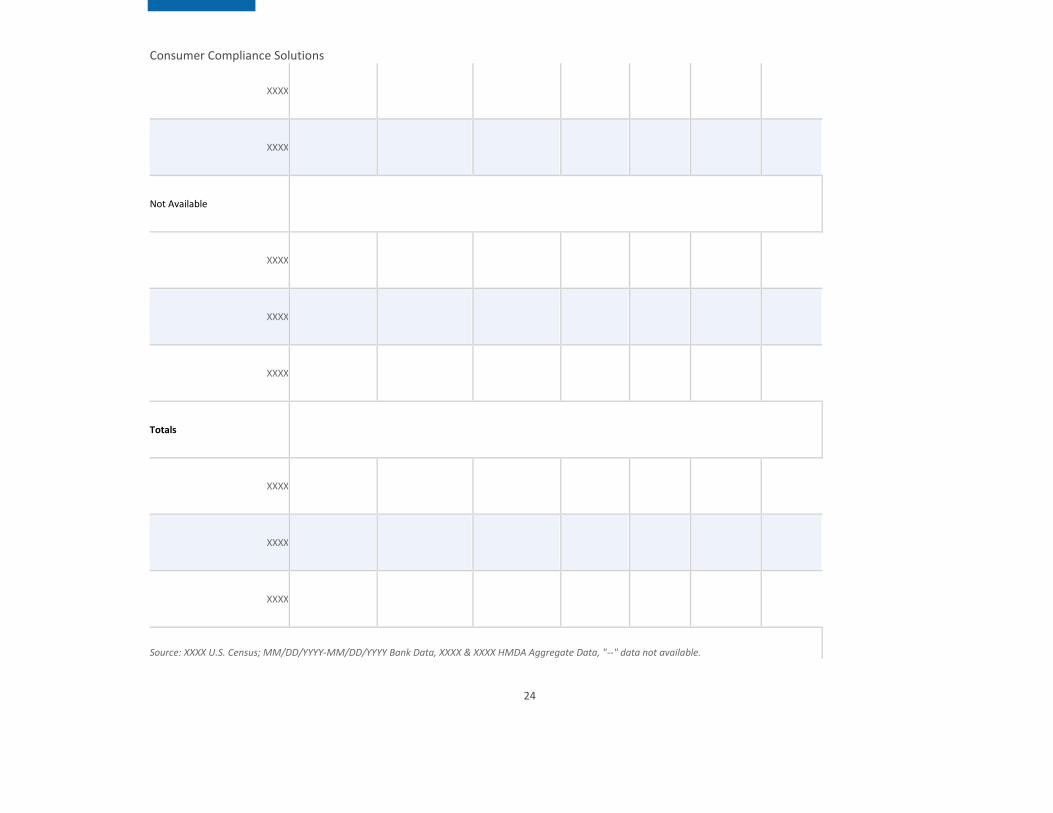
Table I – Distribution of Home Mortgage Loans by Borrower Income Level
Assessment Area: XXXX
Borrower Income Level % of Families Aggregate
Performance % of #
Market Share % of #
# % $(000s) %
Low
XXXX
XXXX
Consumer Compliance Solutions
23
XXXX
Moderate
XXXX
XXXX
XXXX
Middle
XXXX
XXXX
XXXX
Upper
XXXX
Consumer Compliance Solutions
24
XXXX
XXXX
Not Available
XXXX
XXXX
XXXX
Totals
XXXX
XXXX
XXXX
Source: XXXX U.S. Census; MM/DD/YYYY-MM/DD/YYYY Bank Data, XXXX & XXXX HMDA Aggregate Data, "--" data not available.
Consumer Compliance Solutions
25
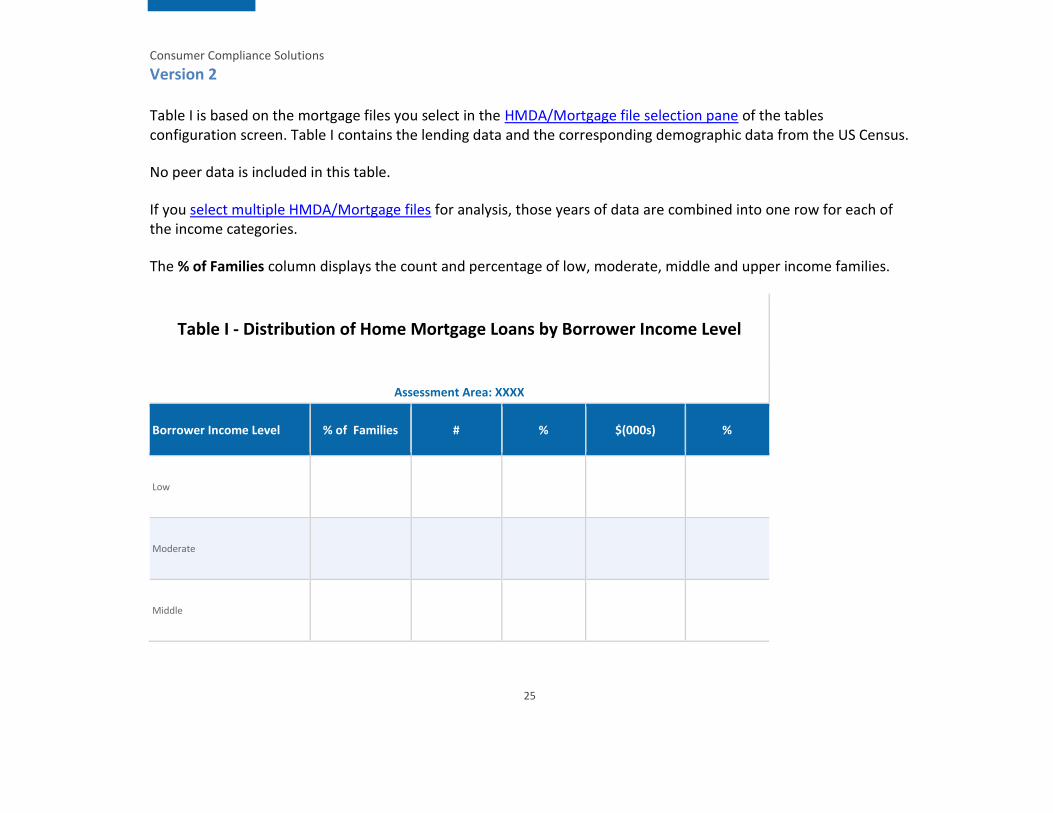
Version 2
Table I is based on the mortgage files you select in the HMDA/Mortgage file selection pane of the tables configuration screen. Table I contains the lending data and the corresponding demographic data from the US Census.
No peer data is included in this table.
If you select multiple HMDA/Mortgage files for analysis, those years of data are combined into one row for each of the income categories.
The % of Families column displays the count and percentage of low, moderate, middle and upper income families.
Table I - Distribution of Home Mortgage Loans by Borrower Income Level
Assessment Area: XXXX
Borrower Income Level % of Families # % $(000s) %
Low
Moderate
Middle

Consumer Compliance Solutions
26
Upper
Not Available
Total
Source: XXXXU.S. Census; MM/DD/YYYY-MM/DD/YYYY Bank Data

Consumer Compliance Solutions
27
Table O - Assessment Area Distribution of Home Mortgage Loans by Category of the Geography
Table O is based on the files that are entered into the wizard. It contains the lending data and the corresponding demographic data from the US Census. If the peer data is selected in the wizard, the aggregate data fields will be populated for the years the data is available.
% of Owner-Occupied units displays and percent of housing where owner or co-owner lives in the unit even if it is mortgaged or not fully paid for.
The report generates for each year individually.
Consumer Compliance Solutions
28
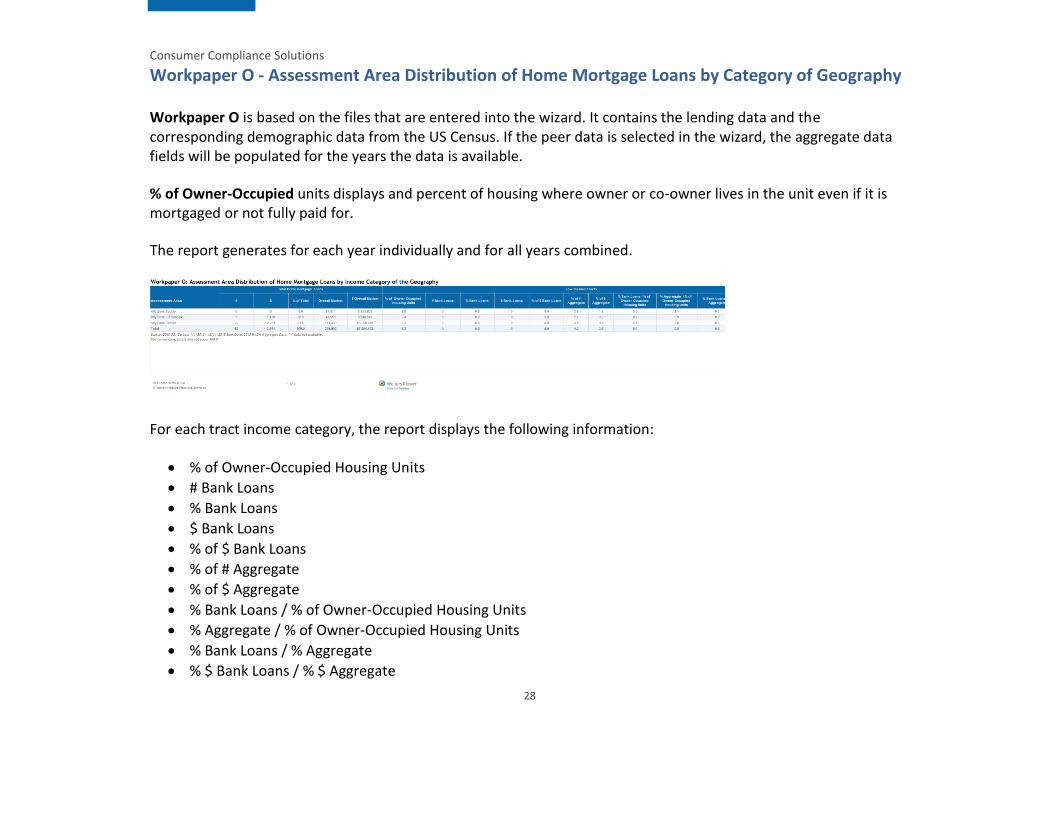
Workpaper O - Assessment Area Distribution of Home Mortgage Loans by Category of Geography
Workpaper O is based on the files that are entered into the wizard. It contains the lending data and the corresponding demographic data from the US Census. If the peer data is selected in the wizard, the aggregate data fields will be populated for the years the data is available.
% of Owner-Occupied units displays and percent of housing where owner or co-owner lives in the unit even if it is mortgaged or not fully paid for.
The report generates for each year individually and for all years combined.
For each tract income category, the report displays the following information:
% of Owner-Occupied Housing Units
# Bank Loans
% Bank Loans
$ Bank Loans
% of $ Bank Loans
% of # Aggregate
% of $ Aggregate
% Bank Loans / % of Owner-Occupied Housing Units
% Aggregate / % of Owner-Occupied Housing Units
% Bank Loans / % Aggregate
% $ Bank Loans / % $ Aggregate

Consumer Compliance Solutions
29
Table P - Assessment Area Distribution of Home Mortgage Loans by Income Category of Borrower
Table P is based on the mortgage files that are entered into the wizard. It contains the lending data and the corresponding demographic data from the US Census. If the peer data is selected in the wizard, the aggregate data fields will be populated for the years the data is available.
% of Families displays the count and percentage of low, moderate, middle and upper income families.
The report generates for each year individually.

Consumer Compliance Solutions
30
Workpaper P - Assessment Area Distribution of Home Mort Loans by Income Category of
Borrower
Workpaper P is based on the mortgage files that are entered into the wizard. It contains the lending data and the corresponding demographic data from the US Census. If the peer data is selected in the wizard, the aggregate data fields will be populated for the years the data is available.
% of Families displays the count and percentage of low, moderate, middle and upper income families. The report generates for each year individually and for all years combined.
For each borrower income category, the report displays the following information:
% of Families
# Bank Loans
% Bank Loans
$ Bank Loans
% of $ Bank Loans
% of # Aggregate
% of $ Aggregate
% Bank Loans / % of Families
% Aggregate / % of Families
% Bank Loans / % Aggregate
Consumer Compliance Solutions
31
% $ Bank Loans / % $ Aggregate

Consumer Compliance Solutions
32
Small Business Reports
Table F - Geographic Distribution of Small Business Loans
Table F is based on the Small Business and Farm files you select in the Small Business and Small Farm file selection pane of the tables configuration screen. Table F contains lending data of loan type 01 Business loans and the corresponding demographic data from the Business Demographic Data (D&B). If you select peer data in the Small Business and Small Farm file selection pane, the aggregate data fields are populated for the years the data is available.
If you select a specific institution for market share analysis in the table configuration screen and that institution has a market share in the areas selected, the software displays a market share percentage in the Market Share column. If you do not select an institution, the software does not display the Market Share column.
The % of Businesses column displays the percentage of non-farm businesses located in each tract category.
Table F - Geographic Distribution of Small Business Loans
Assessment Area: XXXX
Tract Income Level % of Businesses Aggregate
Performance % of #
Market Share % of #
# % $(000s) %
Low
XXXX

Consumer Compliance Solutions
33
XXXX
XXXX
Moderate
XXXX
XXXX
XXXX
Middle
XXXX
XXXX
XXXX
Upper

Consumer Compliance Solutions
34
XXXX
XXXX
XXXX
Not Available
XXXX
XXXX
XXXX
Totals
XXXX
XXXX
XXXX

Consumer Compliance Solutions
35
Source: XXXX U.S. Census; MM/DD/YYYY-MM/DD/YYYY Bank Data, XXXX & XXXX CRA Aggregate Data, "--" data not available.
Version 2
Table F is based on the Small Business and Farm files you select in the Small Business and Small Farm file selection pane of the tables configuration screen. Table F contains lending data of loan type 01 Business loans and the corresponding demographic data from the Business Demographic Data (D&B).
No peer data is included in this table.
If you select multiple Small Business and Small Far files for analysis, data from those years are combined into one row for each of the income categories.
The % of Businesses column displays the percentage of non-farm businesses located in each tract category.
Table F - Geographic Distribution of Small Business Loans
Assessment Area: XXXX
Tract Income Level % of Businesses # % $(000s) %
Low

Consumer Compliance Solutions
36
Moderate
Middle
Upper
Not Available
Totals
Source: XXXX D&B Data; MM/DD/YYYY-MM/DD/YYYY Bank Data
Consumer Compliance Solutions
37
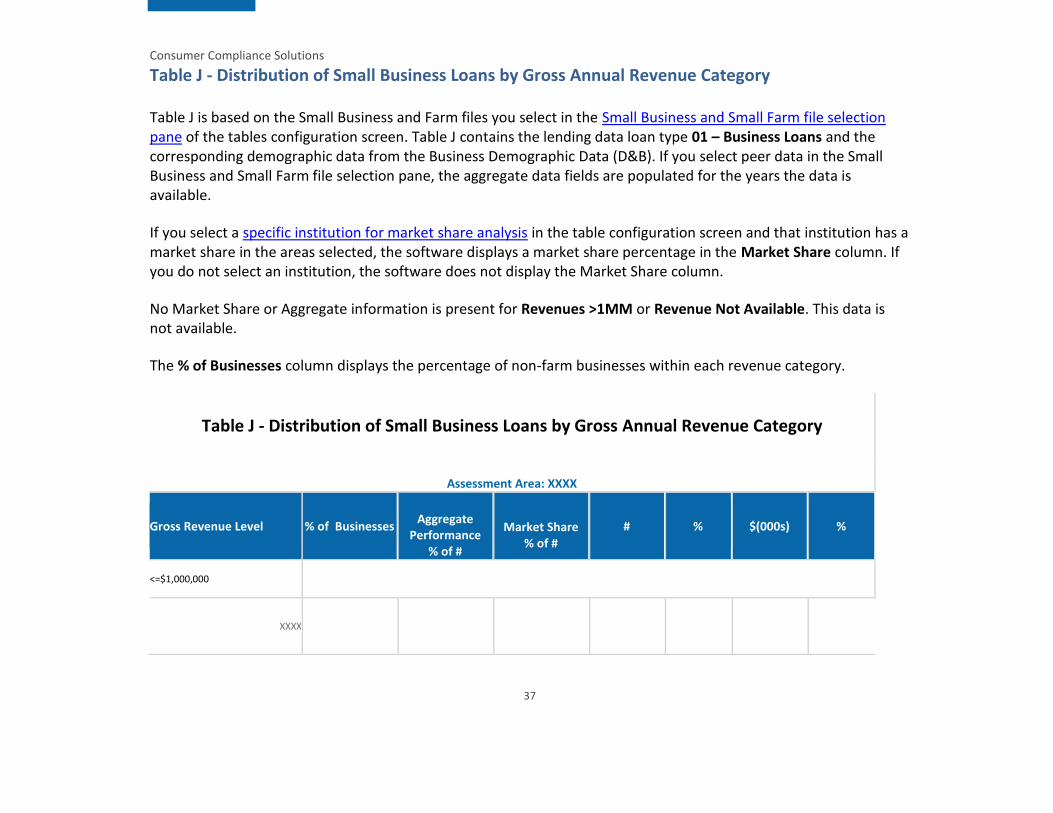
Table J - Distribution of Small Business Loans by Gross Annual Revenue Category
Table J is based on the Small Business and Farm files you select in the Small Business and Small Farm file selection pane of the tables configuration screen. Table J contains the lending data loan type 01 – Business Loans and the corresponding demographic data from the Business Demographic Data (D&B). If you select peer data in the Small Business and Small Farm file selection pane, the aggregate data fields are populated for the years the data is available.
If you select a specific institution for market share analysis in the table configuration screen and that institution has a market share in the areas selected, the software displays a market share percentage in the Market Share column. If you do not select an institution, the software does not display the Market Share column.
No Market Share or Aggregate information is present for Revenues >1MM or Revenue Not Available. This data is not available.
The % of Businesses column displays the percentage of non-farm businesses within each revenue category.
Table J - Distribution of Small Business Loans by Gross Annual Revenue Category
Assessment Area: XXXX
Gross Revenue Level % of Businesses Aggregate
Performance % of #
Market Share % of #
# % $(000s) %
<=$1,000,000
XXXX

Consumer Compliance Solutions
38
XXXX
XXXX
>1,000,000
XXXX
XXXX
XXXX
Revenue Not Available
XXXX
XXXX
XXXX
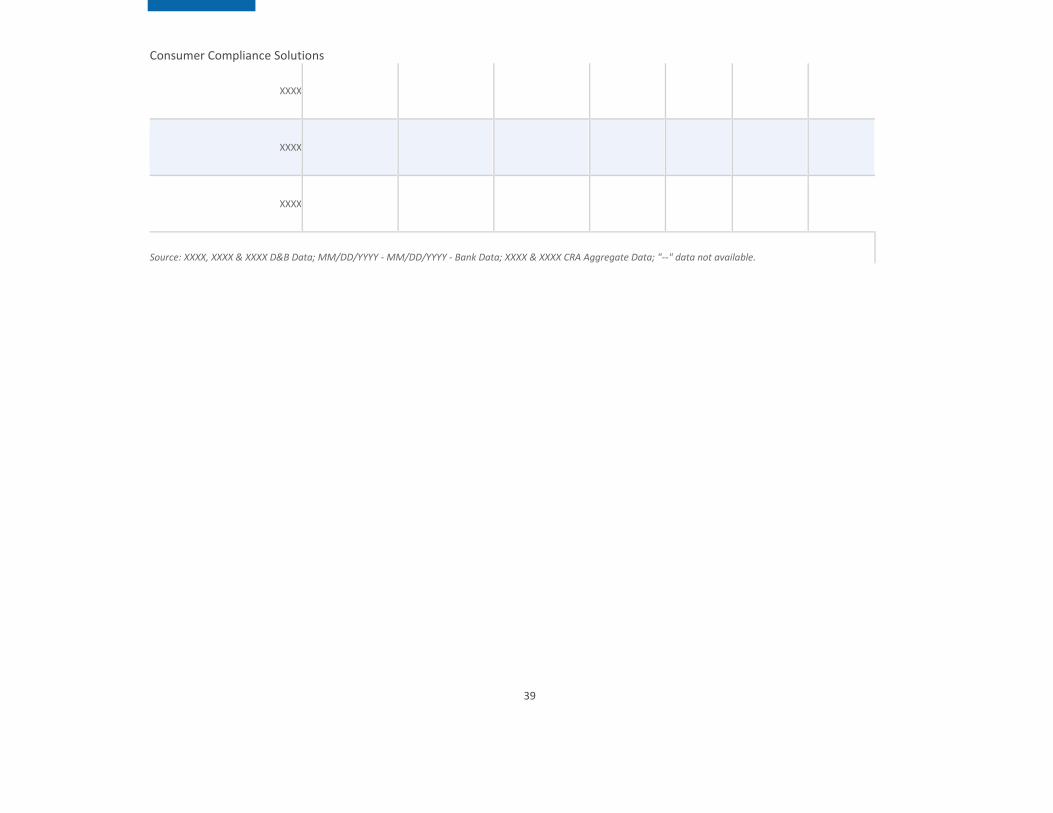
Totals
Consumer Compliance Solutions
39
XXXX
XXXX
XXXX
Source: XXXX, XXXX & XXXX D&B Data; MM/DD/YYYY - MM/DD/YYYY - Bank Data; XXXX & XXXX CRA Aggregate Data; "--" data not available.
Consumer Compliance Solutions
40
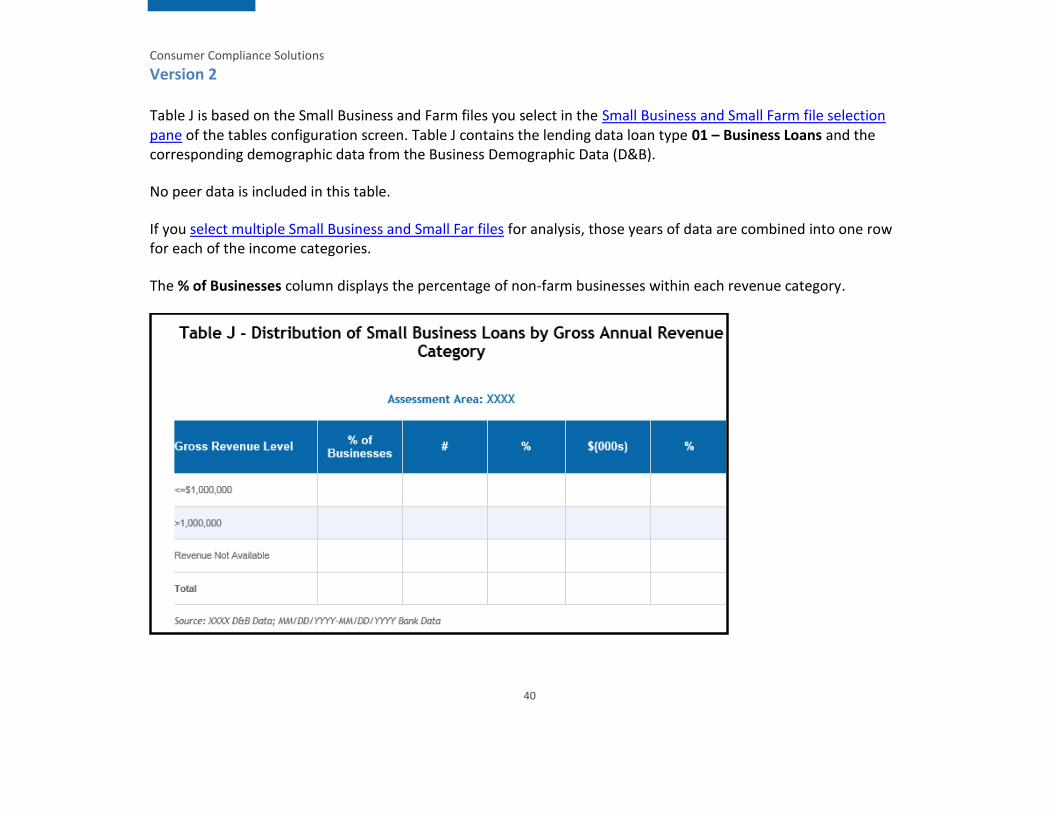
Version 2
Table J is based on the Small Business and Farm files you select in the Small Business and Small Farm file selection pane of the tables configuration screen. Table J contains the lending data loan type 01 – Business Loans and the corresponding demographic data from the Business Demographic Data (D&B).
No peer data is included in this table.
If you select multiple Small Business and Small Far files for analysis, those years of data are combined into one row for each of the income categories.
The % of Businesses column displays the percentage of non-farm businesses within each revenue category.
Consumer Compliance Solutions
41
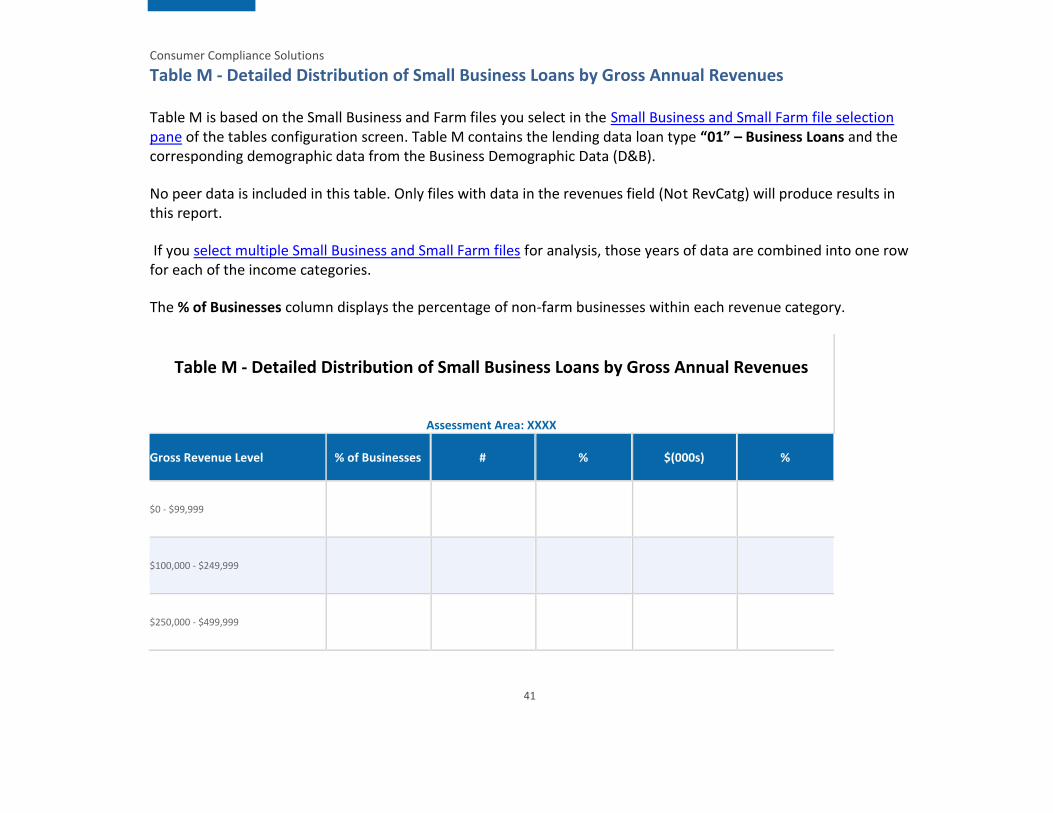
Table M - Detailed Distribution of Small Business Loans by Gross Annual Revenues
Table M is based on the Small Business and Farm files you select in the Small Business and Small Farm file selection pane of the tables configuration screen. Table M contains the lending data loan type “01” – Business Loans and the corresponding demographic data from the Business Demographic Data (D&B).
No peer data is included in this table. Only files with data in the revenues field (Not RevCatg) will produce results in this report.
If you select multiple Small Business and Small Farm files for analysis, those years of data are combined into one row for each of the income categories.
The % of Businesses column displays the percentage of non-farm businesses within each revenue category.
Table M - Detailed Distribution of Small Business Loans by Gross Annual Revenues
Assessment Area: XXXX
Gross Revenue Level % of Businesses # % $(000s) %
$0 - $99,999
$100,000 - $249,999
$250,000 - $499,999

Consumer Compliance Solutions
42
$500,000 - $1,000,000
Subtotal ≤ $1,000,000
>$1,000,000
Revenue Not Available
Total
Source: XXXX D&B Data, Bank Data
Consumer Compliance Solutions
43
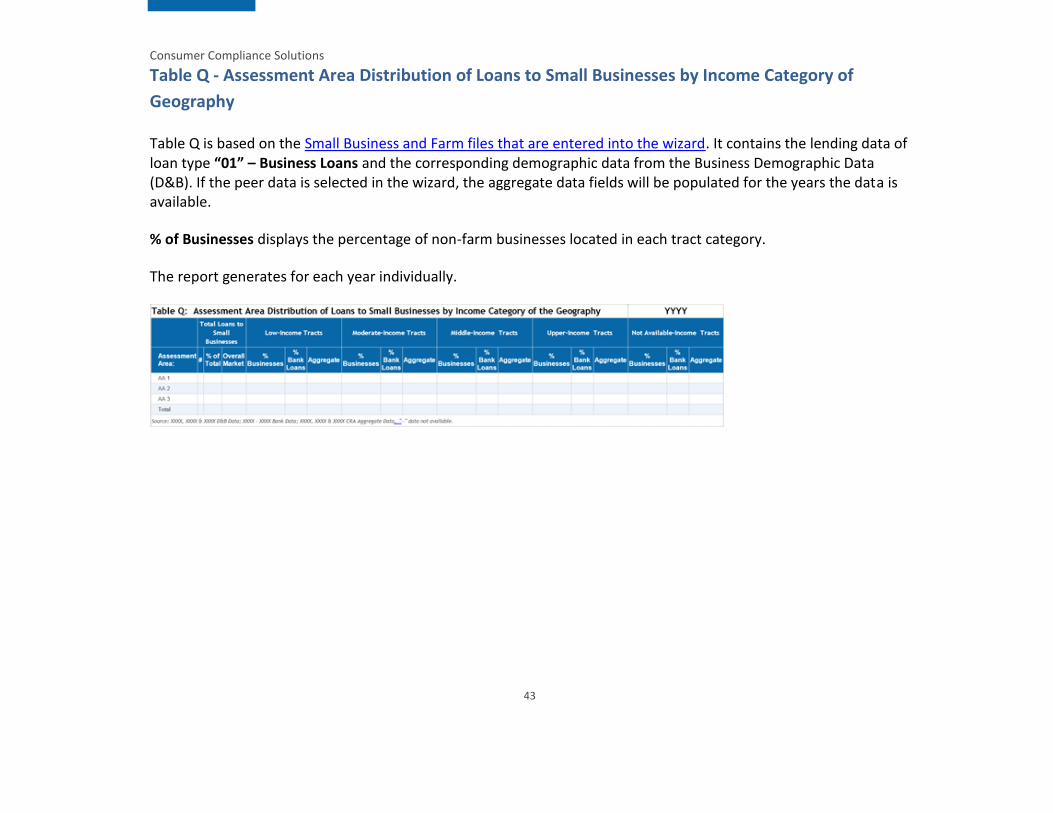
Table Q - Assessment Area Distribution of Loans to Small Businesses by Income Category of
Geography
Table Q is based on the Small Business and Farm files that are entered into the wizard. It contains the lending data of loan type “01” – Business Loans and the corresponding demographic data from the Business Demographic Data (D&B). If the peer data is selected in the wizard, the aggregate data fields will be populated for the years the data is available.
% of Businesses displays the percentage of non-farm businesses located in each tract category.
The report generates for each year individually.
Consumer Compliance Solutions
44
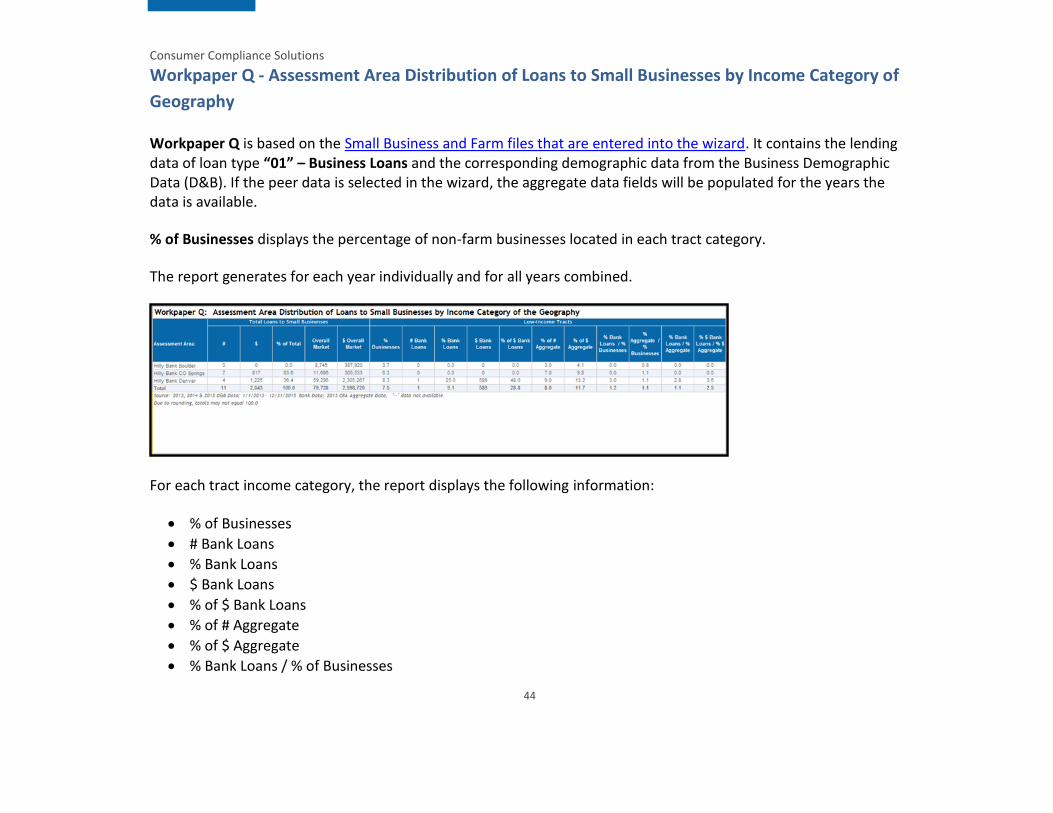
Workpaper Q - Assessment Area Distribution of Loans to Small Businesses by Income Category of
Geography
Workpaper Q is based on the Small Business and Farm files that are entered into the wizard. It contains the lending data of loan type “01” – Business Loans and the corresponding demographic data from the Business Demographic Data (D&B). If the peer data is selected in the wizard, the aggregate data fields will be populated for the years the data is available.
% of Businesses displays the percentage of non-farm businesses located in each tract category.
The report generates for each year individually and for all years combined.
For each tract income category, the report displays the following information:
% of Businesses
# Bank Loans
% Bank Loans
$ Bank Loans
% of $ Bank Loans
% of # Aggregate
% of $ Aggregate
% Bank Loans / % of Businesses

Consumer Compliance Solutions
45
% Aggregate / % of Businesses
% Bank Loans / % Aggregate
% $ Bank Loans / % $ Aggregate
Consumer Compliance Solutions
46
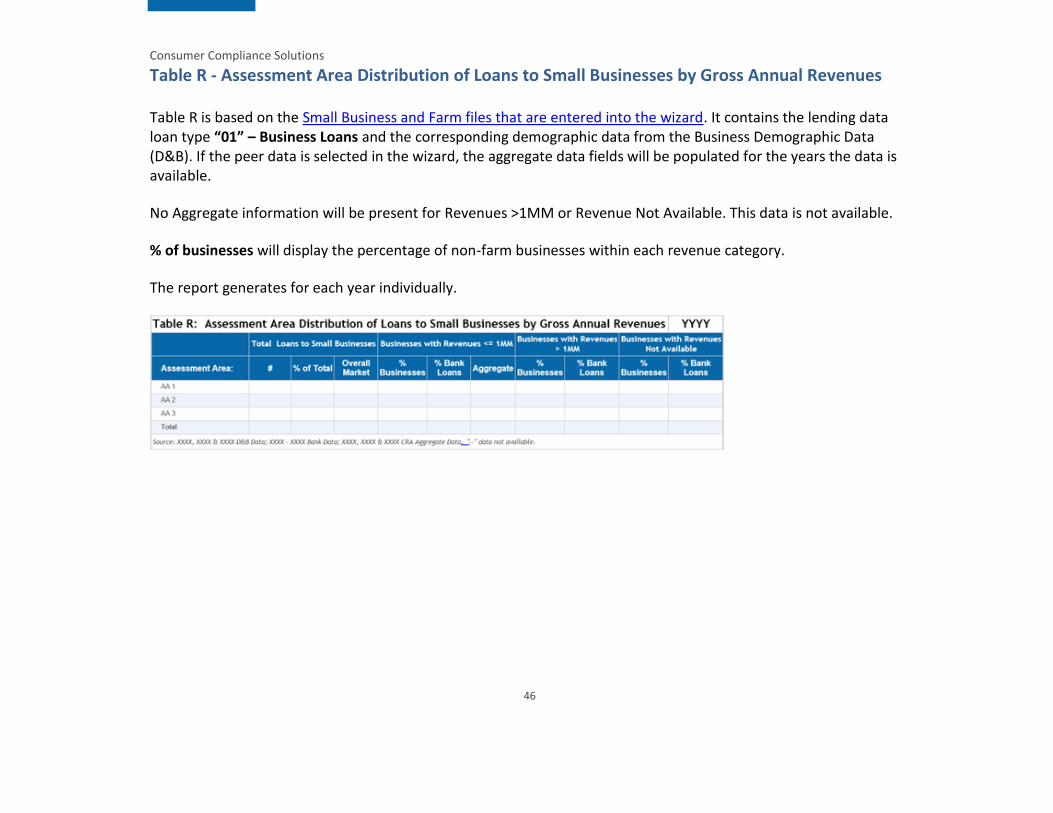
Table R - Assessment Area Distribution of Loans to Small Businesses by Gross Annual Revenues
Table R is based on the Small Business and Farm files that are entered into the wizard. It contains the lending data loan type “01” – Business Loans and the corresponding demographic data from the Business Demographic Data (D&B). If the peer data is selected in the wizard, the aggregate data fields will be populated for the years the data is available.
No Aggregate information will be present for Revenues >1MM or Revenue Not Available. This data is not available.
% of businesses will display the percentage of non-farm businesses within each revenue category.
The report generates for each year individually.

Consumer Compliance Solutions
47
Workpaper R - Assessment Area Distribution of Loans to Small Businesses by Gross Annual
Revenues
Workpaper R is based on the Small Business and Farm files that are entered into the wizard. It contains the lending data loan type “01” – Business Loans and the corresponding demographic data from the Business Demographic Data (D&B). If the peer data is selected in the wizard, the aggregate data fields will be populated for the years the data is available.
No Aggregate information will be present for Revenues >1MM or Revenue Not Available. This data is not available.
% of businesses will display the percentage of non-farm businesses within each revenue category.
The report generates for each year individually and for all years combined.
For each revenue category where the information is available, the report displays the following information:
% of Businesses
# Bank Loans
% Bank Loans
$ Bank Loans
% of $ Bank Loans
% of # Aggregate
% of $ Aggregate
Consumer Compliance Solutions
48
% Bank Loans / % of Businesses
% Aggregate / % of Businesses
% Bank Loans / % Aggregate
% $ Bank Loans / % $ Aggregate

Consumer Compliance Solutions
49
Small Farm Reports
Table G - Geographic Distribution of Small Farm Loans
Table G is based on the Small Business and Farm files you select in the Small Business and Small Farm file selection pane of the tables configuration screen. Table G contains the lending data loan type 02 – Farm Loans and the corresponding demographic data from the Business Demographic Data (D&B). If you select peer data in the Small Business and Small Farm file selection pane, the aggregate data fields are populated for the years the data is available.
If you select a specific institution for market share analysis in the table configuration screen and that institution has a market share in the areas selected, the software displays a market share percentage in the Market Share column. If you do not select an institution, the software does not display the Market Share column.
The % of Farms column displays the percentage of non-farm businesses located in each tract category.
Table G - Geographic Distribution of Small Farm Loans
Assessment Area: XXXX
Tract Income Level % of Farms Aggregate
Performance % of #
Market Share % of #
# % $(000s) %
Low
XXXX
Consumer Compliance Solutions
50
XXXX
XXXX
Moderate
XXXX
XXXX
XXXX
Middle
XXXX
XXXX
XXXX
Upper
Consumer Compliance Solutions
51
XXXX
XXXX
XXXX
Not Available
XXXX
XXXX
XXXX
Totals
XXXX
XXXX
XXXX
Consumer Compliance Solutions
52
Source: XXXX U.S. Census; MM/DD/YYYY-MM/DD/YYYY Bank Data, XXXX & XXXX CRA Aggregate Data, "--" data not available.
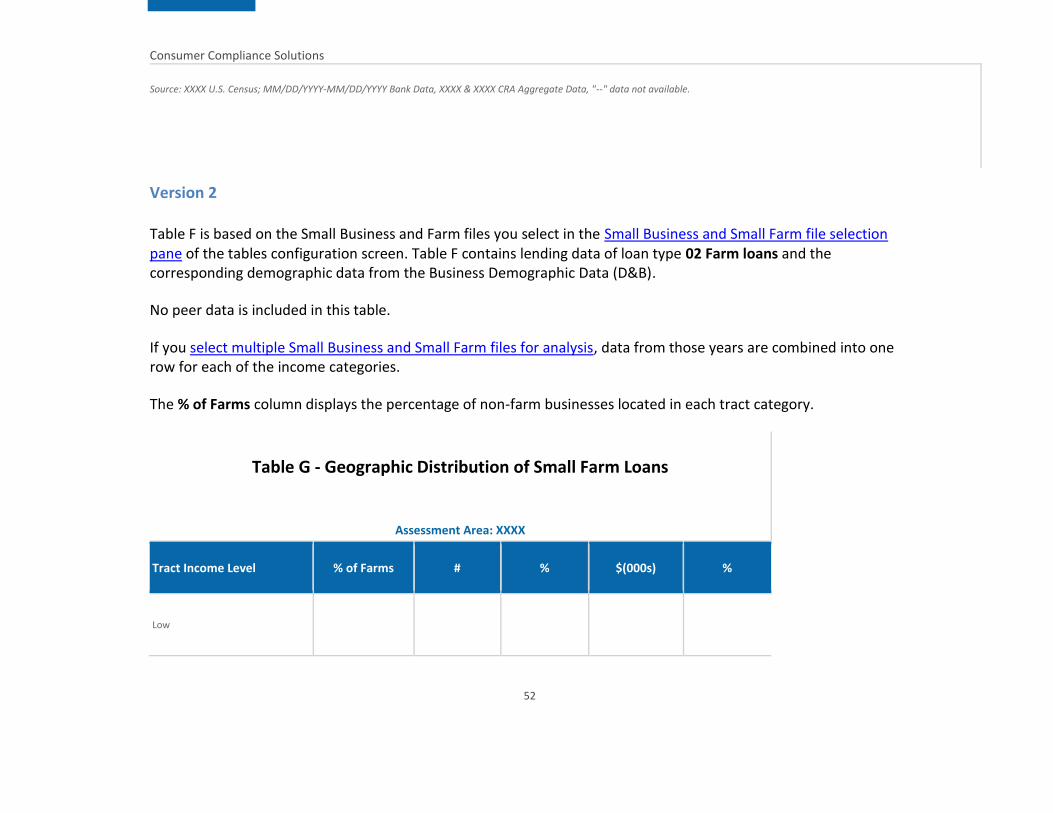
Version 2
Table F is based on the Small Business and Farm files you select in the Small Business and Small Farm file selection pane of the tables configuration screen. Table F contains lending data of loan type 02 Farm loans and the corresponding demographic data from the Business Demographic Data (D&B).
No peer data is included in this table.
If you select multiple Small Business and Small Farm files for analysis, data from those years are combined into one row for each of the income categories.
The % of Farms column displays the percentage of non-farm businesses located in each tract category.
Table G - Geographic Distribution of Small Farm Loans
Assessment Area: XXXX
Tract Income Level % of Farms # % $(000s) %
Low

Consumer Compliance Solutions
53
Moderate
Middle
Upper
Not Available
Totals
Source: XXXX D&B Data; MM/DD/YYYY-MM/DD/YYYY Bank Data
Consumer Compliance Solutions
54
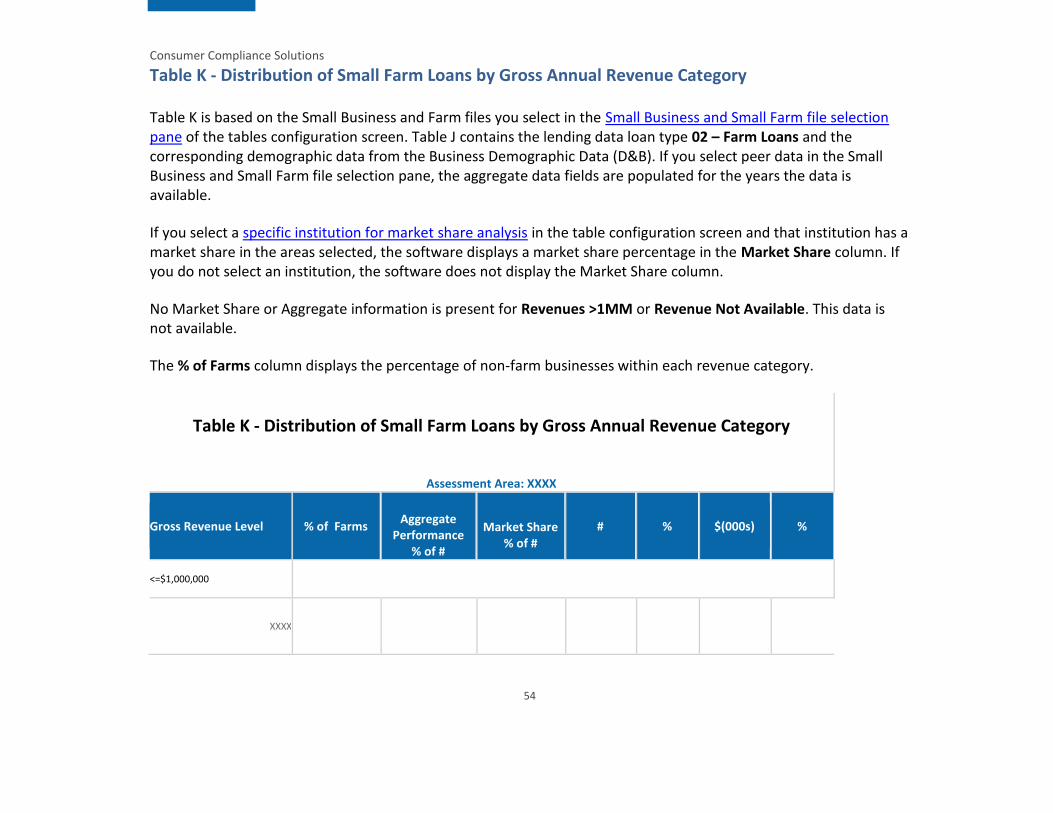
Table K - Distribution of Small Farm Loans by Gross Annual Revenue Category
Table K is based on the Small Business and Farm files you select in the Small Business and Small Farm file selection pane of the tables configuration screen. Table J contains the lending data loan type 02 – Farm Loans and the corresponding demographic data from the Business Demographic Data (D&B). If you select peer data in the Small Business and Small Farm file selection pane, the aggregate data fields are populated for the years the data is available.
If you select a specific institution for market share analysis in the table configuration screen and that institution has a market share in the areas selected, the software displays a market share percentage in the Market Share column. If you do not select an institution, the software does not display the Market Share column.
No Market Share or Aggregate information is present for Revenues >1MM or Revenue Not Available. This data is not available.
The % of Farms column displays the percentage of non-farm businesses within each revenue category.
Table K - Distribution of Small Farm Loans by Gross Annual Revenue Category
Assessment Area: XXXX
Gross Revenue Level % of Farms Aggregate
Performance % of #
Market Share % of #
# % $(000s) %
<=$1,000,000
XXXX

Consumer Compliance Solutions
55
XXXX
XXXX
>1,000,000
XXXX -- --
XXXX -- --
XXXX -- --
Revenue Not Available
XXXX -- --
XXXX -- --
XXXX -- --
Totals
Consumer Compliance Solutions
56
XXXX
XXXX
XXXX
Source: XXXX, XXXX & XXXX D&B Data; MM/DD/YYYY - MM/DD/YYYY - Bank Data; XXXX & XXXX CRA Aggregate Data; "--" data not available.

Consumer Compliance Solutions
57
Version 2
Table K is based on the Small Business and Farm files you select in the Small Business and Small Farm file selection pane of the tables configuration screen. Table J contains the lending data loan type 02 – Farm Loans and the corresponding demographic data from the Business Demographic Data (D&B).
No peer data is included in this table.
If you select multiple Small Business and Small Farm files for analysis, those years of data are combined into one row for each of the income categories.
The % of Farms column displays the percentage of non-farm businesses within each revenue category.

Consumer Compliance Solutions
58
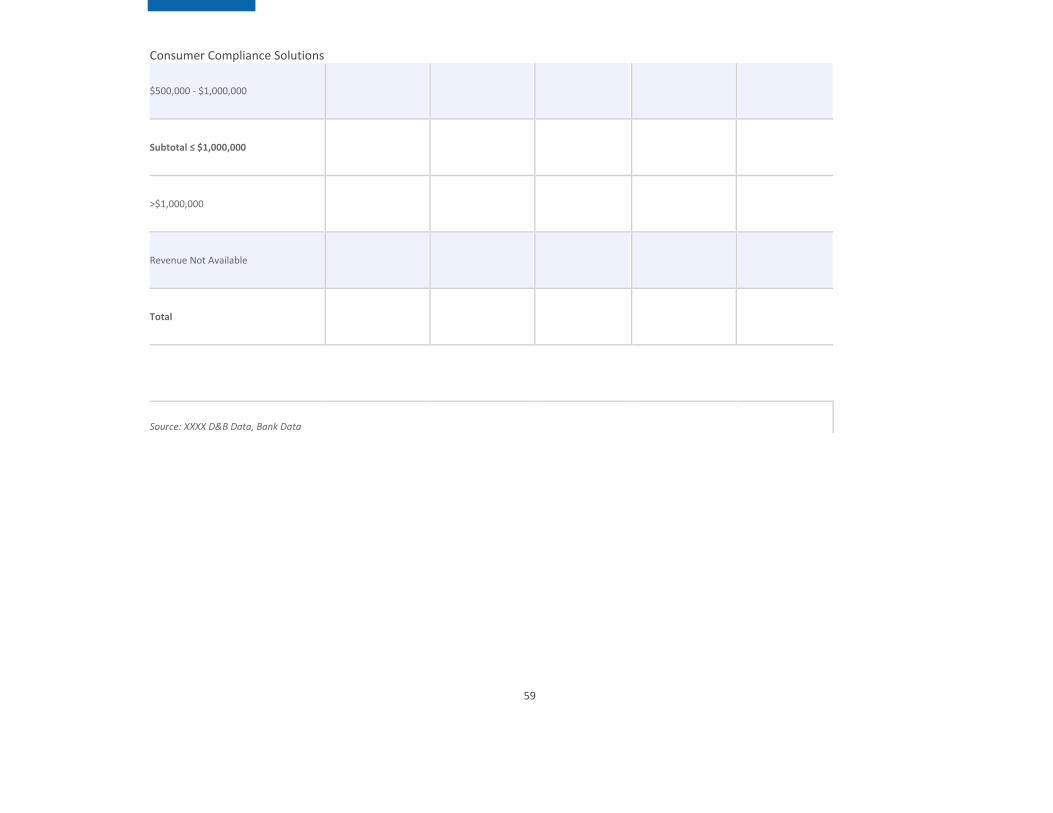
Table N - Detailed Distribution of Small Farm Loans by Gross Annual Revenues
Table N is based on the Small Business and Farm files you select in the Small Business and Small Farm file selection pane of the tables configuration screen. Table N contains the lending data loan type “02” – Farm Loans and the corresponding demographic data from the Business Demographic Data (D&B).
No peer data is included in this table. Only files with data in the revenues field (Not RevCatg) will produce results in this report.
If you select multiple Small Business and Small Farm files for analysis, those years of data are combined into one row for each of the income categories.
The % of Farms column displays the percentage of agriculture businesses within each revenue category.
Table N - Detailed Distribution of Small Farm Loans by Gross Annual Revenues
Assessment Area: XXXX
Gross Revenue Level % of Farms # % $(000s) %
$0 - $99,999
$100,000 - $249,999
$250,000 - $499,999
Consumer Compliance Solutions
59
$500,000 - $1,000,000
Subtotal ≤ $1,000,000
>$1,000,000
Revenue Not Available
Total
Source: XXXX D&B Data, Bank Data

Consumer Compliance Solutions
60
Table S - Assessment Area Distribution of Loans to Farms by Income Category of Geography
Table S is based on the Small Business and Farm files that are entered into the wizard. It contains the lending data loan type “02” – Farm Loans and the corresponding demographic data from the Business Demographic Data (D&B). If the peer data is selected in the wizard, the aggregate data fields will be populated for the years the data is available.
% of Farms displays the percentage of agriculture businesses located in each tract category.
The report generates for each year individually.
Consumer Compliance Solutions
61
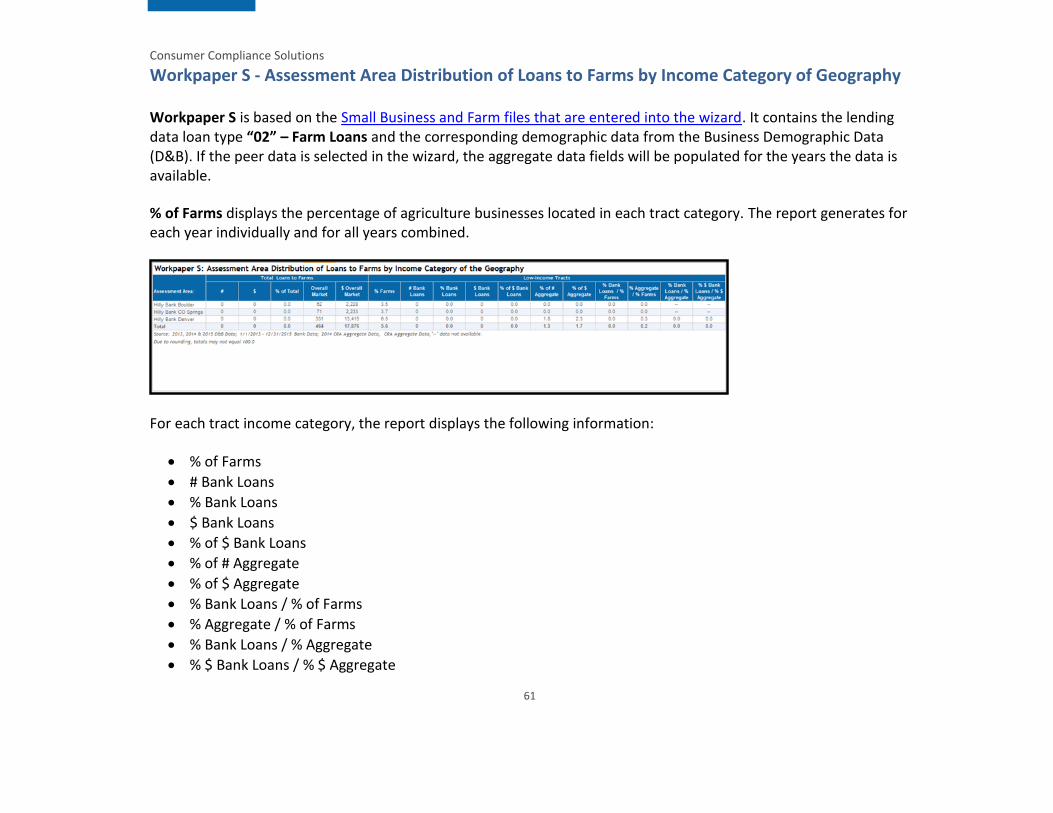
Workpaper S - Assessment Area Distribution of Loans to Farms by Income Category of Geography
Workpaper S is based on the Small Business and Farm files that are entered into the wizard. It contains the lending data loan type “02” – Farm Loans and the corresponding demographic data from the Business Demographic Data (D&B). If the peer data is selected in the wizard, the aggregate data fields will be populated for the years the data is available.
% of Farms displays the percentage of agriculture businesses located in each tract category. The report generates for each year individually and for all years combined.
For each tract income category, the report displays the following information:
% of Farms
# Bank Loans
% Bank Loans
$ Bank Loans
% of $ Bank Loans
% of # Aggregate
% of $ Aggregate
% Bank Loans / % of Farms
% Aggregate / % of Farms
% Bank Loans / % Aggregate
% $ Bank Loans / % $ Aggregate

Consumer Compliance Solutions
62
Table T - Assessment Area Distribution of Loans to Farms by Gross Annual Revenues
Table T is based on the Small Business and Farm files that are entered into the wizard. It contains the lending data loan type “02” – Farm Loans and the corresponding demographic data from the Business Demographic Data (D&B). If the peer data is selected in the wizard, the aggregate data fields will be populated for the years the data is available.
No Aggregate information will be present for Revenues >1MM or Revenue Not Available. This data is not available.
% of farms displays the percentage of agriculture businesses within each revenue category.
The report generates for each year individually.
Consumer Compliance Solutions
63
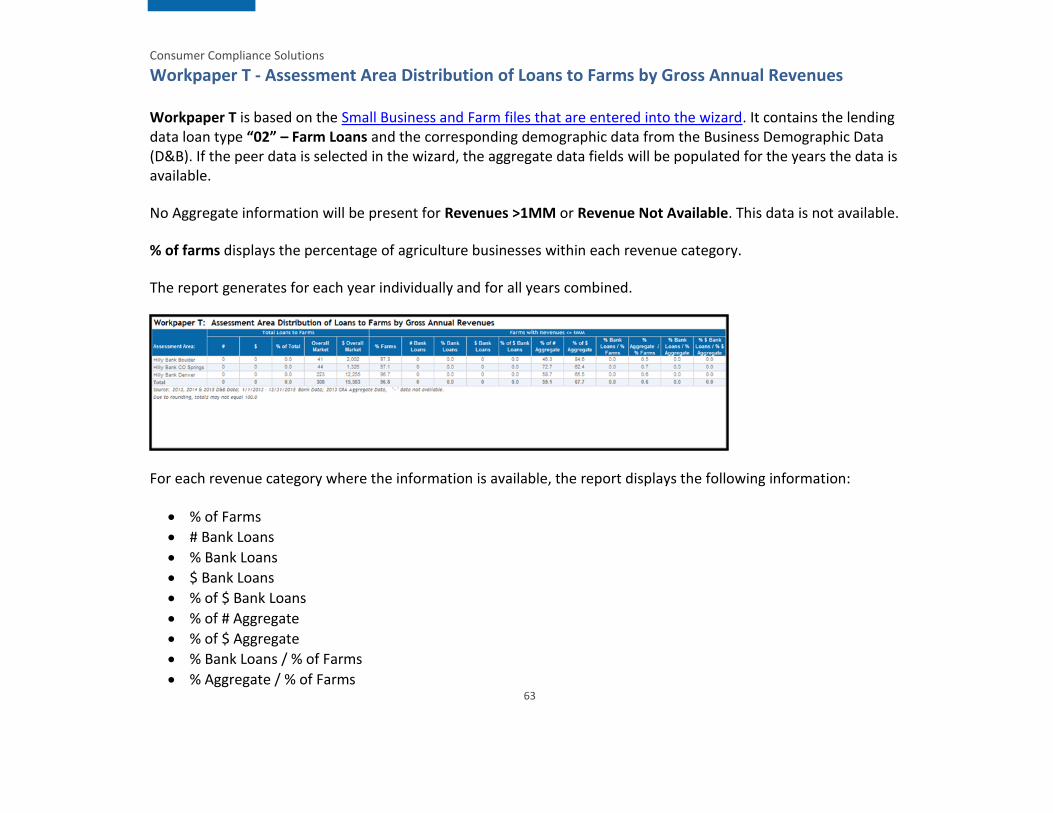
Workpaper T - Assessment Area Distribution of Loans to Farms by Gross Annual Revenues
Workpaper T is based on the Small Business and Farm files that are entered into the wizard. It contains the lending data loan type “02” – Farm Loans and the corresponding demographic data from the Business Demographic Data (D&B). If the peer data is selected in the wizard, the aggregate data fields will be populated for the years the data is available.
No Aggregate information will be present for Revenues >1MM or Revenue Not Available. This data is not available.
% of farms displays the percentage of agriculture businesses within each revenue category.
The report generates for each year individually and for all years combined.
For each revenue category where the information is available, the report displays the following information:
% of Farms
# Bank Loans
% Bank Loans
$ Bank Loans
% of $ Bank Loans
% of # Aggregate
% of $ Aggregate
% Bank Loans / % of Farms
% Aggregate / % of Farms
Consumer Compliance Solutions
64
% Bank Loans / % Aggregate
% $ Bank Loans / % $ Aggregate
Consumer Compliance Solutions
65
Consumer Reports
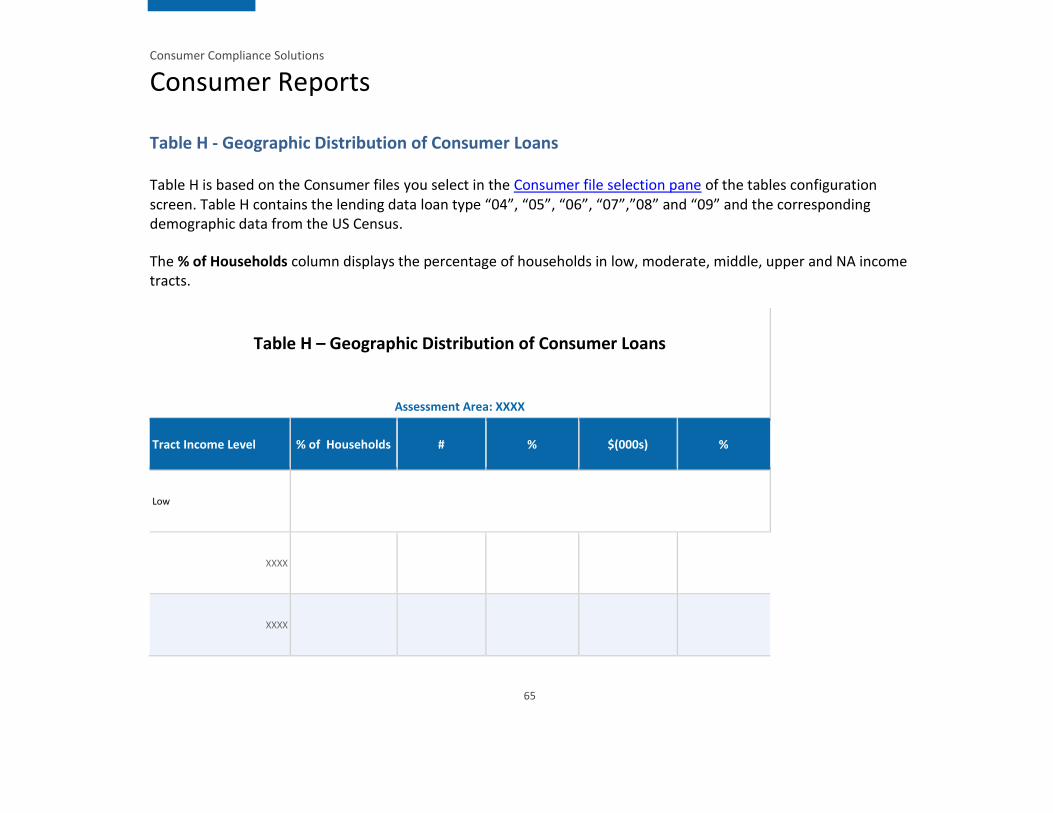
Table H - Geographic Distribution of Consumer Loans
Table H is based on the Consumer files you select in the Consumer file selection pane of the tables configuration screen. Table H contains the lending data loan type “04”, “05”, “06”, “07”,”08” and “09” and the corresponding demographic data from the US Census.
The % of Households column displays the percentage of households in low, moderate, middle, upper and NA income tracts.
Table H – Geographic Distribution of Consumer Loans
Assessment Area: XXXX
Tract Income Level % of Households # % $(000s) %
Low
XXXX
XXXX

Consumer Compliance Solutions
66
XXXX
Moderate
XXXX
XXXX
XXXX
Middle
XXXX
XXXX
XXXX
Upper

Consumer Compliance Solutions
67
XXXX
XXXX
XXXX
Not Available
XXXX
XXXX
XXXX
Totals
XXXX
XXXX
Consumer Compliance Solutions
68
XXXX
Source: 2010 U.S. Census; MM/DD/YYYY-MM/DD/YYYY Bank Data

Consumer Compliance Solutions
69
Version 2
Table H is based on the Consumer files you select in the Consumer file selection pane of the tables configuration screen. Table H contains the lending data loan type “04”, “05”, “06”, “07”,”08” and “09” and the corresponding demographic data from the US Census.
If you select multiple consumer files for analysis, data from those years are combined into one row for each of the income categories.
% of Households will display the displays the percentage of households in low, moderate, middle, upper and NA income tracts.
Table H – Geographic Distribution of Consumer Loans
Assessment Area: XXXX
Tract Income Level % of Households # % $(000s) %
Low
Moderate
Middle

Consumer Compliance Solutions
70
Upper
Not Available
Totals
Source: XXXX U.S. Census; MM/DD/YYYY-MM/DD/YYYY Bank Data

Consumer Compliance Solutions
71
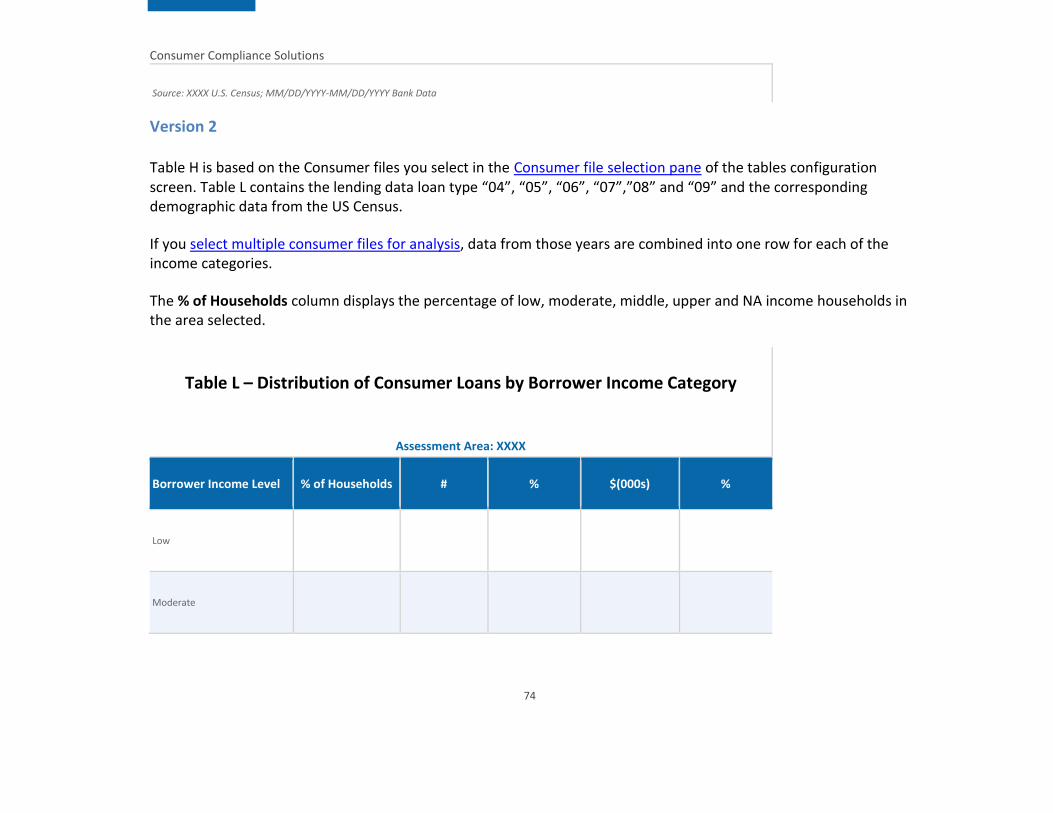
Table L - Distribution of Consumer Loans by Borrower Income Level
Table H is based on the Consumer files you select in the Consumer file selection pane of the tables configuration screen. Table L contains the lending data loan type “04”, “05”, “06”, “07”,”08” and “09” and the corresponding demographic data from the US Census.
The % of Households column displays the percentage of low, moderate, middle, upper and NA income households for the selected assessment area.
Table L – Distribution of Consumer Loans by Borrower Income Level
Assessment Area: XXXX
Borrower Income Level % of Households # % $(000s) %
Low
XXXX
XXXX
XXXX

Consumer Compliance Solutions
72
Moderate
XXXX
XXXX
XXXX
Middle
XXXX
XXXX
XXXX
Upper
XXXX

Consumer Compliance Solutions
73
XXXX
XXXX
Not Available
XXXX
XXXX
XXXX
Totals
XXXX
XXXX
XXXX
Consumer Compliance Solutions
74
Source: XXXX U.S. Census; MM/DD/YYYY-MM/DD/YYYY Bank Data
Version 2
Table H is based on the Consumer files you select in the Consumer file selection pane of the tables configuration screen. Table L contains the lending data loan type “04”, “05”, “06”, “07”,”08” and “09” and the corresponding demographic data from the US Census.
If you select multiple consumer files for analysis, data from those years are combined into one row for each of the income categories.
The % of Households column displays the percentage of low, moderate, middle, upper and NA income households in the area selected.
Table L – Distribution of Consumer Loans by Borrower Income Category
Assessment Area: XXXX
Borrower Income Level % of Households # % $(000s) %
Low
Moderate

Consumer Compliance Solutions
75
Middle
Upper
Not Available
Totals
Source: XXXX U.S. Census; MM/DD/YYYY-MM/DD/YYYY Bank Data

Consumer Compliance Solutions
76
Table U - Assessment Area Distribution of Consumer Loans by Income Category of Geography
Table U is based on the Consumer files that are entered into the wizard. It contains the lending data loan type “04”, “05”, “06”, “07”,”08” and “09” and the corresponding demographic data from the US Census.
% of Households the displays the percentage of households in low, moderate, middle, upper and NA income tracts.
The report generates for each year individually.

Consumer Compliance Solutions
77
Table V - Assessment Area Distribution of Consumer Loans by Income Category of Borrower
Table V is based on the Consumer files that are entered into the wizard. It contains the lending data loan type “04”, “05”, “06”, “07”,”08” and “09” and the corresponding demographic data from the US Census.
% of Households displays the percentage of households in low, moderate, middle, upper and NA income tracts.
The report generates for each year individually.
Consumer Compliance Solutions
78
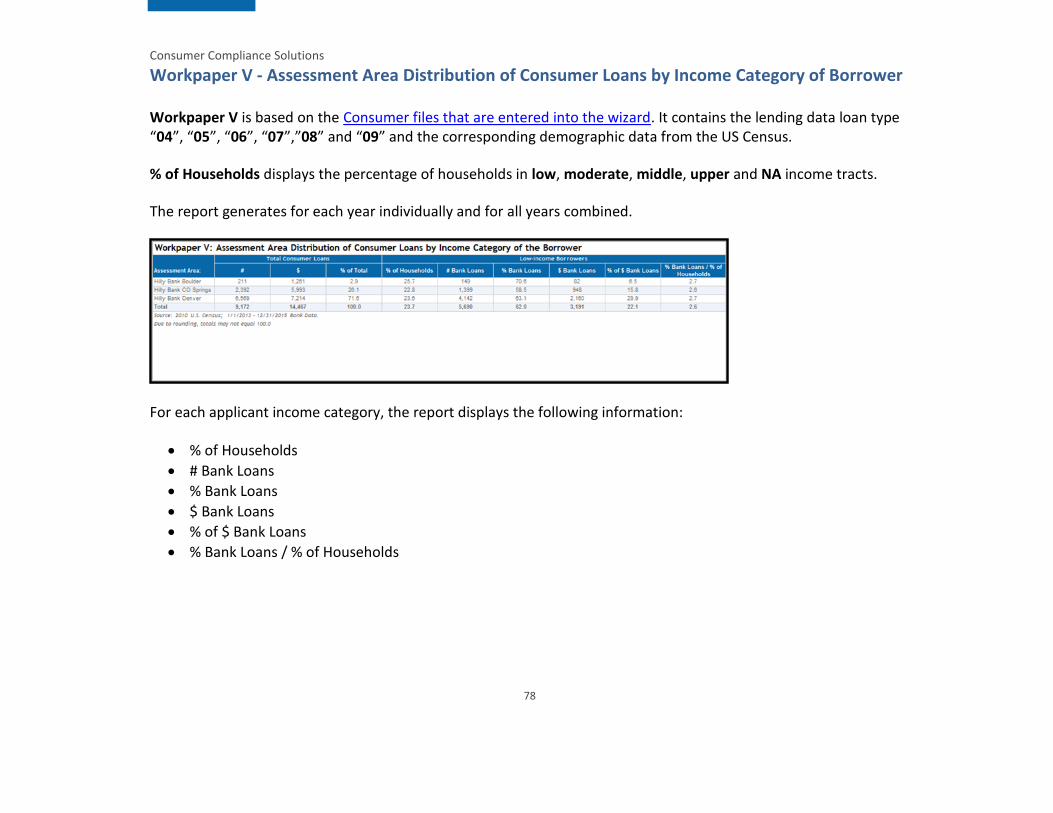
Workpaper V - Assessment Area Distribution of Consumer Loans by Income Category of Borrower
Workpaper V is based on the Consumer files that are entered into the wizard. It contains the lending data loan type “04”, “05”, “06”, “07”,”08” and “09” and the corresponding demographic data from the US Census.
% of Households displays the percentage of households in low, moderate, middle, upper and NA income tracts.
The report generates for each year individually and for all years combined.
For each applicant income category, the report displays the following information:
% of Households
# Bank Loans
% Bank Loans
$ Bank Loans
% of $ Bank Loans
% Bank Loans / % of Households

Consumer Compliance Solutions
79
Other Reports
Table W - Scoping Report
The Scoping report takes Peer Branch & Deposit Data, Peer HMDA Data and Peer Small Business & Farm data and combines into one report. This report shows the data at an assessment area level for each year and combined for all years analyzed. The Branch & Deposit Data is for only one year and is consistent across the report. If an institution(s) is selected, the market share information for that institution will also display on the report. This report allows examiners to view all assessment areas and identify the areas where lending is concentrated, where the bank holds a share of the market and the number of branches.
Consumer Compliance Solutions
80
Table X - Community Development
This report creates a standardized report template for representing the Services, Investments and Community Development Data a bank is reporting. If a file is used, the data will populate for this report from the file selected. If no file is selected, the report will be generated blank. The report breaks down the community development purposes by Affordable Housing, Services targeted at LMI Individuals, Economic Development to Small Business and Revitalizing and Stabilizing LMI Geographies. For the investments, they are broken out by Investments and Grants and for the Service, it is displayed in hours.
The data is displayed by Assessment area, Statewide Activities, and Regional Activities. To display the file data by statewide, only include the State code in the geocoding fields. To display the file data by regional activities, only populate the State and MSA or State, MSA & County fields.
The data is also displayed by the year of the files.

Consumer Compliance Solutions
81

Consumer Compliance Solutions
82

Consumer Compliance Solutions
83
Table Y - Federal Report
The Federal (Fed) Report is a two-page comprehensive report that displays data for the institutions lending data (LAR), Peer Data & demographic data for each year and each assessment area. The format is similar to reports generated by the Federal Reserve and displays in two pages for each year. The first page is a Geographic Distribution Report and shows the Low/Mod/Mid/Upp/NA tract lending distribution for the HMDA, Small Business and Small Farm data. The HMDA data is broken out by loan purpose and property type. The second page of the report is a Borrower Distribution and displays the Low/Mod/Mid/Upp/NA borrower distribution and revenue breakdowns for small business and small farm lending.

Consumer Compliance Solutions
84

Consumer Compliance Solutions
85
Consumer Compliance Solutions
86
Consumer Compliance Solutions
About Wolters Kluwer - Wolters Kluwer provides audit, risk and compliance solutions that help financial organizations improve efficiency and effectiveness across their enterprise. Whether complying with regulatory requirements, addressing a single key risk, or working toward a holistic risk management strategy, more than 15,000 customers worldwide count on Wolters Kluwer for a comprehensive and dynamic view of risk management and compliance. With more than 30 offices in over 20 countries, the company’s prominent brands include: FRSGlobal, ARC Logics for Financial Services, PCi, Bankers Systems, VMP® Mortgage Solutions, AppOne®, GainsKeeper®, Capital Changes, NILS, AuthenticWeb™ and Uniform Forms™. Wolters Kluwer is a leading global information services and publishing company with annual revenues of (2011) €3.4 billion ($4.7 billion) and approximately 19,000 employees worldwide. Please visit our website for more information.
Wolters Kluwer 130 Turner Street Building 3, 4th Floor Waltham, MA 02453
800.261.3111
© 2018 Wolters Kluwer