with Tailorable Functionalities Construction of Integrated ... · Electronic Supplementary...
20
Electronic Supplementary Information Chelation Competition Induced Polymerization (CCIP): Construction of Integrated Hollow Polydopamine Nanocontainers with Tailorable Functionalities Siyuan Xiang, a Dandan Wang, b Kai Zhang, a, * Wendong Liu, a Ce Wu, a Qingnan Meng, c Hongchen Sun, b and Bai Yang a a. State Key Laboratory of Supramolecular Structure and Materials, College of Chemistry, Jilin University, Changchun 130012, P. R. China. E-mail: [email protected] b. Department of Oral Pathology, School and Hospital of Stomatology, Jilin University, Changchun 130021, P. R. China c. School of Material Science & Engineering, Xi’an University of Technology, Xi’an 710048, P. R. China. Contents 1. Experimental Section 1.1 Materials 1.2 Preparation of Gold Nanorods 1.3 Synthesis of Au NRs@ZIF-8 1.4 Generation of Au NRs@PDA Nanocontainers 1.5 Characterization of Photothermal Effect 1.6 Drug Loading and Release Performance of Au NRs@PDA Nanocontainers 1.7 Evaluation of Cytotoxicity and Cells Uptake 1.8 Apoptosis performance in vitro 1.9 Characterization 2. Supplementary Figures From Figure S1- Figure S12 Electronic Supplementary Material (ESI) for ChemComm. This journal is © The Royal Society of Chemistry 2016
Transcript of with Tailorable Functionalities Construction of Integrated ... · Electronic Supplementary...

Electronic Supplementary Information
Chelation Competition Induced Polymerization (CCIP):
Construction of Integrated Hollow Polydopamine Nanocontainers
with Tailorable FunctionalitiesSiyuan Xiang,a Dandan Wang,b Kai Zhang,a,* Wendong Liu,a Ce Wu,a Qingnan Meng,c Hongchen Sun,b and Bai Yanga
a. State Key Laboratory of Supramolecular Structure and Materials, College of Chemistry, Jilin University, Changchun 130012, P. R. China. E-mail: [email protected]. Department of Oral Pathology, School and Hospital of Stomatology, Jilin University, Changchun 130021, P. R. Chinac. School of Material Science & Engineering, Xi’an University of Technology, Xi’an 710048, P. R. China.
Contents
1. Experimental Section
1.1 Materials
1.2 Preparation of Gold Nanorods
1.3 Synthesis of Au NRs@ZIF-8
1.4 Generation of Au NRs@PDA Nanocontainers
1.5 Characterization of Photothermal Effect
1.6 Drug Loading and Release Performance of Au NRs@PDA Nanocontainers
1.7 Evaluation of Cytotoxicity and Cells Uptake
1.8 Apoptosis performance in vitro
1.9 Characterization
2. Supplementary Figures
From Figure S1- Figure S12
Electronic Supplementary Material (ESI) for ChemComm.This journal is © The Royal Society of Chemistry 2016

1. Experimental Section
1.1 Materials: Sodium borohydride (NaBH4, ≥98.5%), cetyltrimethylammonium
bromide (CTAB), gold (III) chloride trihydrate (HAuCl4·3H2O, 99.9+%), silver
nitrate (AgNO3, 99%), L-ascorbic acid, 2-Methylimidazole (99%), zinc nitrate
hexahydrate (Zn(NO3)2·6H2O), dopamine hydrochloride were purchased from
Sigma-Aldrich.
1.2 Preparation of Gold Nanorods: Gold nanorods were synthesized using the
seed-mediated method1,2. Briefly, the seed solution was prepared by injecting 500
μL fresh NaBH4 (0.01 M) into 2.5g CTAB solution (0.2 M) mixed with 1g H2O
and 120 μL HAuCl4·3H2O (0.015 M) at 25.5 °C under vigorous stirring (1000 rpm)
for 120 s. Then the obtained seed solution was kept undisturbed at 25.5 °C for 1 h
before use. To prepare growth solution, 10 mL of CTAB (0.1 M) mixed with 500
μL of HAuCl4·3H2O (0.015 M), 400 μL of AgNO3 (0.004 M) and 124 μL of L-
ascorbic acid (0.0788 M). Then the seed solution (100 μL) was injected into the
growth solution. The resultant solution was kept in water bath at 27 °C overnight
without disturbing for Au NRs growth.
1.3 Synthesis of Au NRs@ZIF-8: Before the preparation of Au NRs@ZIF-8
nanostructure, the Au NRs was firstly modified with surfactant PVP3. In brief, 1.0
ml of the obtained Au nanorods were centrifuged under 10000 rpm for 15 min and
then dispersed in 1 ml PVP (Mn = 40000, 20 mg/ml) aqueous solution. The mixture
was stirring at room temperature for 24 hours. 10 ml PVP-stabilized Au nanorods
were collected by centrifugation at 10000 rpm for 15 minutes to remove excess

PVP and finally dispersed in 1 ml methanol.
In the encapsulation procedure, methanol was used as solvent. 10 ml solution
of 2-methylimidazole (25 mM) and 10 ml 25 mM Zn(NO3)2⋅6H2O (containing 1ml
PVP-stabilized Au nanorods methanol solution) were mixed and then allowed to
react at room temperature for 1 hour without stirring. The product was collected by
centrifugation at 5000 rpm for 10 min, washed several times with methanol, and
final dispersed in 3.0 mL methanol.
1.4 Generation of Au NRs@PDA NCTs: 3.0 mL Au NRs@ZIF-8 methanol
solution was added into 4.5 ml methanol, mixing with 1.5 ml dopamine solution
(20 mM in methanol). The mixture was stirring and refluxing at 60 °C for 7 h, the
color of which turned gradually from purple to black. The resultant was collected
by centrifugation at 5000 rpm for 10 min, washed with methanol for three times,
and freeze-drying overnight.
1.5 Characterization of Photothermal Effect: In order to assess the temperature
increment by photothermal conversion, 2 mL of Au NRs@PDA NCTs solution
with different concentrations (50, 100, 150, 200 μg/mL) were placed in the cuvette.
Each solution was irradiated by an 808 nm NIR laser with the intensity of 2 W/cm2
for 10 min, and the temperature increase was measured by a digital thermometer
every 30 s.
1.6 Drug Loading and Release Performance of Au NRs@PDA NCTs: In a
typical experiment, loading DOX into Au NRs@PDA NCTs was accomplished by
mixing DOX hydrochloride together in phosphate buffer (PBS, pH 7.4) with a mass

ratio of 1:2 (DOX: Au NRs@PDA = 1: 2). The mixture was placed in the dark
under ambient temperature overnight. After loading, the nanostructure was rinsed
by centrifugation (4000 rpm, 10 min) and washed with PBS buffer for several
times. All the supernatant was collected and measured with UV-vis spectrum to
calculate the loading efficiency. Then the obtained Au NRs@PDA-DOX was
stored at 4 °C in the dark for future use.
The release of DOX from Au NRs@PDA-DOX was studied by dialyzing Au
NRs@PDA-DOX under room temperature in different buffers with pH of 3.0, 5.4,
and 7.4 for 24 h. The released DOX was collected at different time and determined
by fluorescence spectrum.
The laser-triggered drug release experiments were performed at different pH
of 3.0, 5.4, and 7.4. An optical-fiber-coupled power-tunable diode laser
(continuous wave) with wavelengths of 808 nm (maximal power = 10 W) was
employed in this work. Au NRs@PDA-DOX nanostructure was dispersed in 10
mL of PBS buffer with different pH (3.0, 5.5, 7.4). The nanocontainers were
irradiated by an 808 nm NIR laser (2 W/cm2, 5 min for each pulse) with a time
interval of 30 min. The released DOX before and after irradiation were collected.
For each measurement, 1 mL of solution was centrifuged at 10000 rpm for 5 min.
The amount of released DOX in the supernatant was determined using fluorescence
spectrum.
1.7 Evaluation of Cytotoxicity and Cells Uptake: To access the cytotoxicity of
Au NRs@PDA NCTs, the human oral epithelial carcinoma (KB) cells and Human

Embryonic Kidney 293 (293) cells were cultured in standard cell media, and then
incubated with different concentrations of Au NRs@PDA nanostructures for 24 h.
The cell viability was measured by using a standard methyl thiazolyltetrazolium
(MTT, Sigma Aldrich) assay on 96-well plates. For the MTT assay, KB and 293
cells were seeded at 3000/well until adherent and then incubated with various
concentrations of Au NRs@PDA nanostructures for 24 h. The standard MTT assay
was carried out to determine the cell viabilities relative to the untreated cells.
Cell uptake and internalization experiments were conducted as following:
Firstly, Au NRs@PDA NCTs were modified with Rhodamine B by EDC-NHS
method. Then KB cells were incubated with Au NRs@PDA-Rhodamine B for 24
h, rinsed with PBS to remove the dead cells and fixed with 4% polyoxymethylene
(PBS buffer) for 20 min. After that, 0.1% Triton X-100 was added to permeat the
cytomembrane for 10 min and then the cells were incubated in a 3% bovine serum
albumin (blocking agent) for 2 h at room temperature and washed with PBS buffer
twice. The fixed KB cells were incubated by FITC-phalloidin (38 ng/mL) and DPI
(2 μg/mL) to stain the cytoskeleton and nucleus, respectively4. The stained cells
were washed by PBS buffer for several times and characterized by laser scanning
confocal microscope.
1.8 Apoptosis performance in vitro: To evaluate the cancer cells eradication
effect of the nanocontainers in vitro, KB cells were incubated with Au NRs PDA
NCTs (100 μg/mL), Au NRs@PDA-DOX (150 μg/mL) and free DOX (50 μg/mL)
for 4 h. Then free KB cells as control and incubated KB cells were irradiated by an

808 nm NIR laser at a power density of 2 W/cm2 for 10 min, respectively. As for
the control group, free KB cells and incubated KB cells without irradiation were
presented. At last, MTT solution was added into the plates, and the cell viability
was assumed by MTT assay. Each experiment was repeated for five times.
In order to provide a visual characterization of the apoptosis performance of
the nanocontainers, ethidium bromide (EB) stain assay was performed by
incubating KB cells (50000 cells per well on a 6-well plates) with Au NRs PDA
NCTs (100 μg/mL), Au NRs@PDA-DOX (150 μg/mL) and free DOX (50 μg/mL)
for 4 h. Then the free KB cells and incubated KB cells were irradiated by an 808
nm NIR laser at 2 W/cm2 for 10 min. After that, the dead cells were stained by
adding 2.0 μg/mL of EB in to the cell culture and incubated for 15 min and finally
characterized by fluorescence microscope.
1.9 Characterization: Transmission electron microscopy (TEM) images were
collected on a Hitachi H-800 electron microscope operated at 200 kV with a CCD
camera. High-resolution TEM images and mapping images were recorded using a
JEM-2100F electron microscope at an acceleration voltage of 200 kV with a CCD
camera. SEM images were taken with a JEOL FESEM 6700F electron microscope
with primary electron energy of 3 kV. The samples were sputtered with a thin layer
of Pt prior to imaging. Thermogravimetric (TGA) curve was obtained on a STA
499 C Jupiter (NETZSCH) thermogravimetry analyzer. Elemental analysis was
performed on an Vario EL cube elementar. Inductively Coupled Plasma (ICP)
results were conducted by OPTIMA 3300DV spectrometer. Fourier transform

infrared (FT-IR) spectra were collected on Nicolet AVATAR 360 FT-IR
spectrophotometer. UV-visible absorption spectra were obtained using a Shimadzu
3100 UV-vis spectrophotometer. X-Ray diffraction (XRD) analysis was performed
by X-ray diffractometer, Model Rigaku Ru-200b, using a nickel-filtered Cu Kα
radiation and the data were collected from 10° to 80°. To study the photothermal
effect of our nanocontainers, an 808 nm diode laser (LEO photonics Co. Ltd.) was
employed with the output power tunable from 0 to 10 W/cm2. The temperature
increment under laser irradiation was determined by an electric thermometer
(Traceable Callbraion, 0.1 °C). Bright field and fluorescent images of KB cells
were obtained by an Olympus IX71 inverted fluorescence microscope. The
confocal fluorescent images of KB cells treated with Au NRs@PDA NCTs and Au
NRs@PDA-DOX were taken by using a laser scanning confocal microscope
OLYMPUS BX81 (FluoView FV1000).

2. Supplementary Figures
Figure S1. TEM images of A) Au NRs. B) SEM image of Au NRs@PDA NCTs. Inset:
SEM image of a broken Au NRs@PDA NCTs with high magnification.

Figure S2. TGA curve of Au NRs@PDA NCTs. The weight loss is 62.3%

Table S1. Elemental analysis of Au NRs@PDA NCTs
Elements The weight percentage /%
C 38.0
N 6.0
H 3.8
Table S2. ICP results of Au NRs@PDA NCTs
Elements Concentration /ppm The weight percentage /%
Zn 13.6 13.6
Au 4.2 4.2

Figure S3. Optical photograph of (A) Supernatant of Au NRs@ZIF-8, (B) Supernatant
of Au NRs@PDA, (C) Supernatant of Au NRs@ZIF-8 + DA, (D) Zn2++ DA, (E)
Supernatant of Au NRs@PDA + DA, (F) 2-methylimidazole + DA
In our work, the 2-methylimidazole was firstly fixed in ZIF-8 crystals, chelating to Zn2+. After adding dopamine, the stronger chelation of which grabbed Zn2+ away, causing the release of 2-methylimidazole. The released 2-methylimidazole was dispersed into the solution, which could be proved by Figure S3. When pure colorless 2-methylimidazole mixed with colorless DA, the solution became black (Figure S3F, PDA is black), so we believed 2-methylimidazole could induce the polymerization of DA (Figure S3F), due to its weak alkaline in the solution, while only Zn2+ could not induce the polymerization of DA (Figure S3D). After the formation of Au NRs@ZIF-8, the solution was centrifuged and the supernatant shows colorless (Figure S3A) and no change by mixing with DA (Figure S3C), suggesting no dissociative 2-methylimidazole could be left in the solution. After the formation of Au NRs@PDA NCTs, the solution was centrifuged and the supernatant was also colorless, as shown in Figure S3B. However, the color of solution changed to black by mixing with DA (Figure S3E), suggesting there was dissociative 2-methylimidazole in the solution during the decomposition of ZIF-8 and the formation of PDA NCTs. Therefore, it can be clearly proved that the 2-methylimidazole removed from the inside of the capsule, and released into the solution, which could induce the polymerization of DA.

Figure S4. TEM images of Au NRs@PDA NCTs prepared under different solvent ratio
(H2O: MeOH) at room temperature: (a) H2O, (b) 2: 1, (c) 1: 1, (d) 1: 2, (e) 0.5: 2.5, (f)
MeOH.

Figure S5. A, C, E) TEM images of Au NRs@ZIF-8, and B, D, F) TEM images of
Au NRs@PDA NCTs with average sizes of 76 nm, 161 nm and 290 nm.

Figure S6. TEM images of Au NRs@PDA NCTs obtained with different concentration
of DA after 48 hours: A) 0.5 mM, B) 1.0 mM, C) 2.5 mM, and D) 5.0 mM.

Figure S7. TEM images of A) ZIF-8, B) PDA NCTs intermediate, C) hollow PDA
NCTs, D) Fe3O4, E) Fe3O4@ZIF-8 and F) Fe3O4@PDA NCTs. Inset in F):
Fe3O4@PDA NCTs with large magnification.

Figure S8. Confocal fluorescence images of KB cells incubated with Au NRs@PDA-
Rhodamine B for 24 h: blue-nucleus; green-cytoskeleton; red-Au NRs@PDA-Rhodamine B.

Figure S9. UV-vis spectrum of Au NRs (black), Au NRs@ZIF-8 (red), Au
NRs@PDA (blue), ZIF-8 (green), PDA (pink).
The LSPR band of the Au NRs red-shifted from ca. 780 nm (black line) to about 810 nm (red line), suggesting the occurrence of encapsulation that alters the dielectric constant of the local environment of the Au NRs and the growth of hybrid spheres that scatter light in the UV-vis range because of their larger size than Au NRs, which corresponded to Lu’s paper3. After forming the Au NRs@PDA NCTs, the surface of Au NRs is encapsulated with a layer of PDA, which will maintain the changing of the dielectric constant, causing similar absorption in 810 nm (blue line).

Figure S10. A) Release of DOX from Au NRs@PDA-DOX NCTs under pH 3.0 (grey
line), pH 5.5 (pink line), pH 7.4 (orange line). B) NIR-triggered release of DOX from
Au NRs@PDA-DOX NCTs. The samples at different pH values were irradiated with
an NIR laser (2 W·cm-2) for 5 min at different time points.

Figure S11. TEM images of A) Au NRs@PDA NCTs. B) Au NRs@PDA NCTs
dispersed in pH 5.5 buffer for 24 h. C) Au NRs@PDA NCTs dispersed in pH 3 buffer
for 24 h.
Au NRs@PDA NCTs were partially broken after 24 h dispersing in pH 3 and 5.5, and the etching degree in pH 3 buffer is more serious than that in pH 5 buffer. Such broken can further enhance the drug release, which is shown in Figure S10. The reason of the structure broken under acid environment is under investigation. And the Au NRs remain the original morphology, suggesting their stability in faintly acid environment and no influence on their PTT performance.
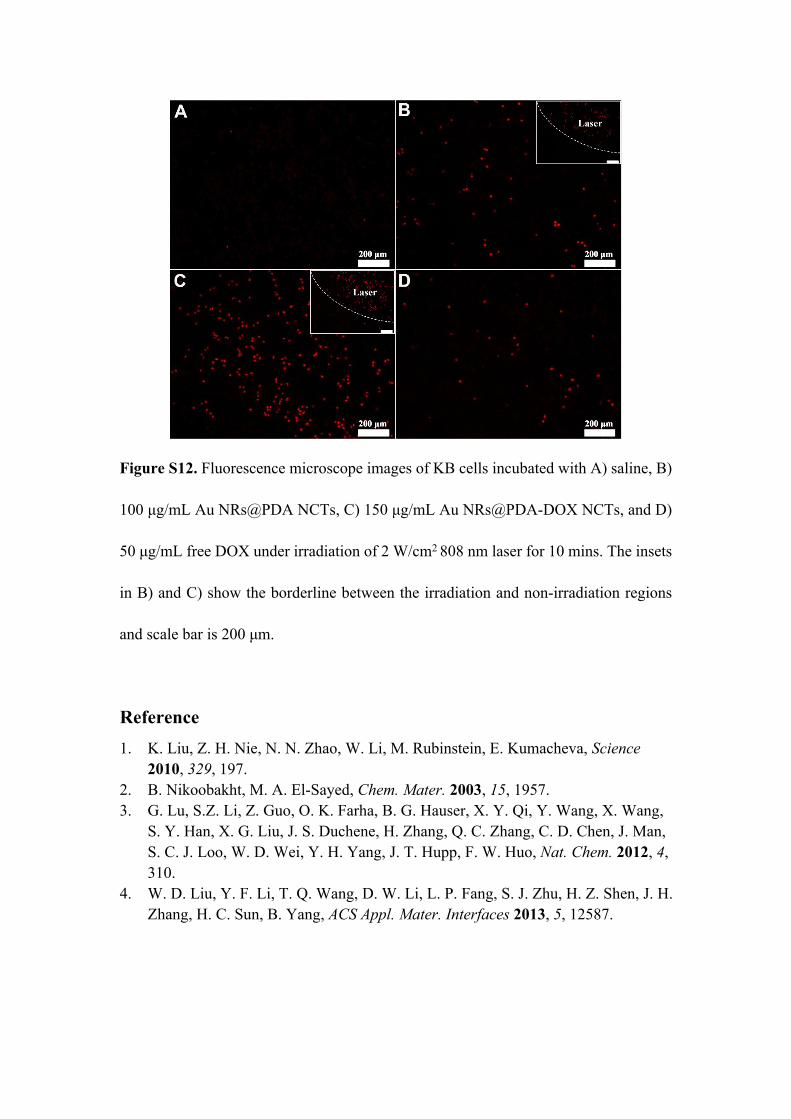
Figure S12. Fluorescence microscope images of KB cells incubated with A) saline, B)
100 μg/mL Au NRs@PDA NCTs, C) 150 μg/mL Au NRs@PDA-DOX NCTs, and D)
50 μg/mL free DOX under irradiation of 2 W/cm2 808 nm laser for 10 mins. The insets
in B) and C) show the borderline between the irradiation and non-irradiation regions
and scale bar is 200 μm.
Reference1. K. Liu, Z. H. Nie, N. N. Zhao, W. Li, M. Rubinstein, E. Kumacheva, Science
2010, 329, 197.2. B. Nikoobakht, M. A. El-Sayed, Chem. Mater. 2003, 15, 1957.3. G. Lu, S.Z. Li, Z. Guo, O. K. Farha, B. G. Hauser, X. Y. Qi, Y. Wang, X. Wang,
S. Y. Han, X. G. Liu, J. S. Duchene, H. Zhang, Q. C. Zhang, C. D. Chen, J. Man, S. C. J. Loo, W. D. Wei, Y. H. Yang, J. T. Hupp, F. W. Huo, Nat. Chem. 2012, 4, 310.
4. W. D. Liu, Y. F. Li, T. Q. Wang, D. W. Li, L. P. Fang, S. J. Zhu, H. Z. Shen, J. H. Zhang, H. C. Sun, B. Yang, ACS Appl. Mater. Interfaces 2013, 5, 12587.