With Steve Nison, CMT President: · PDF fileopen close open Real Body high low Real Bodies /...
69
With Steve Nison, CMT President: Candlecharts.com Legal Notice: This recording is © Candlecharts.com and may not be copied, retransmitted, nor distributed in any manner whatsoever, including, but not limited to, video or audio file sharing sites, online auction and classified sites, discussion forums nor any other means. Illegal redistribution of this content may result in criminal and/or civil fines, pursuant to applicable international copyright law. All rights reserved worldwide.
Transcript of With Steve Nison, CMT President: · PDF fileopen close open Real Body high low Real Bodies /...
With
Steve Nison, CMTPresident: Candlecharts.com
Legal Notice: This recording is © Candlecharts.com and may not be copied, retransmitted, nor distributed in any mannerwhatsoever, including, but not limited to, video or audio file sharing sites, online auction and classified sites, discussionforums nor any other means. Illegal redistribution of this content may result in criminal and/or civil fines, pursuant toapplicable international copyright law. All rights reserved worldwide.
CandlestickCharting
Techniques
Candlesticks +Western
Indicators
Candlesticks + Trade Management
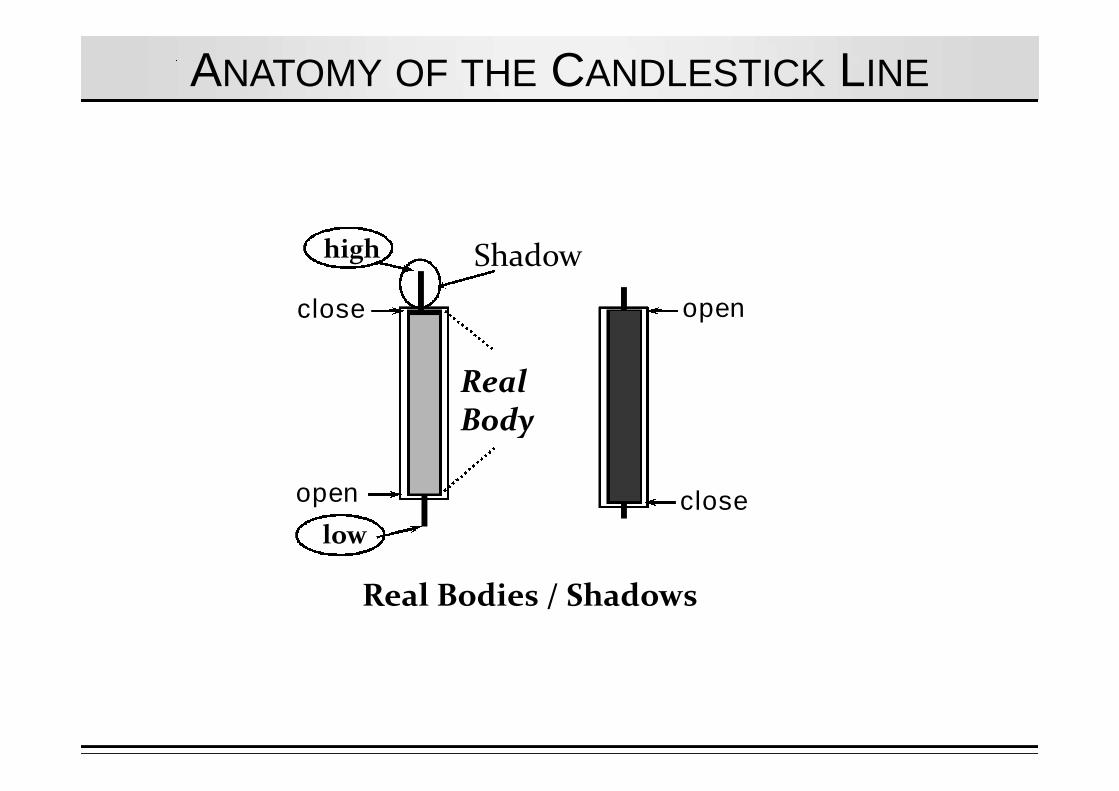
open close
open
RealBody
high
low
Real Bodies / Shadows
ANATOMY OF THE CANDLESTICK LINE
close
Shadow
Foundation ofEast + West:
Nison Candlessticksand Trend Lines
Foundation ofEast + West:
Nison Candlessticksand Trend Lines
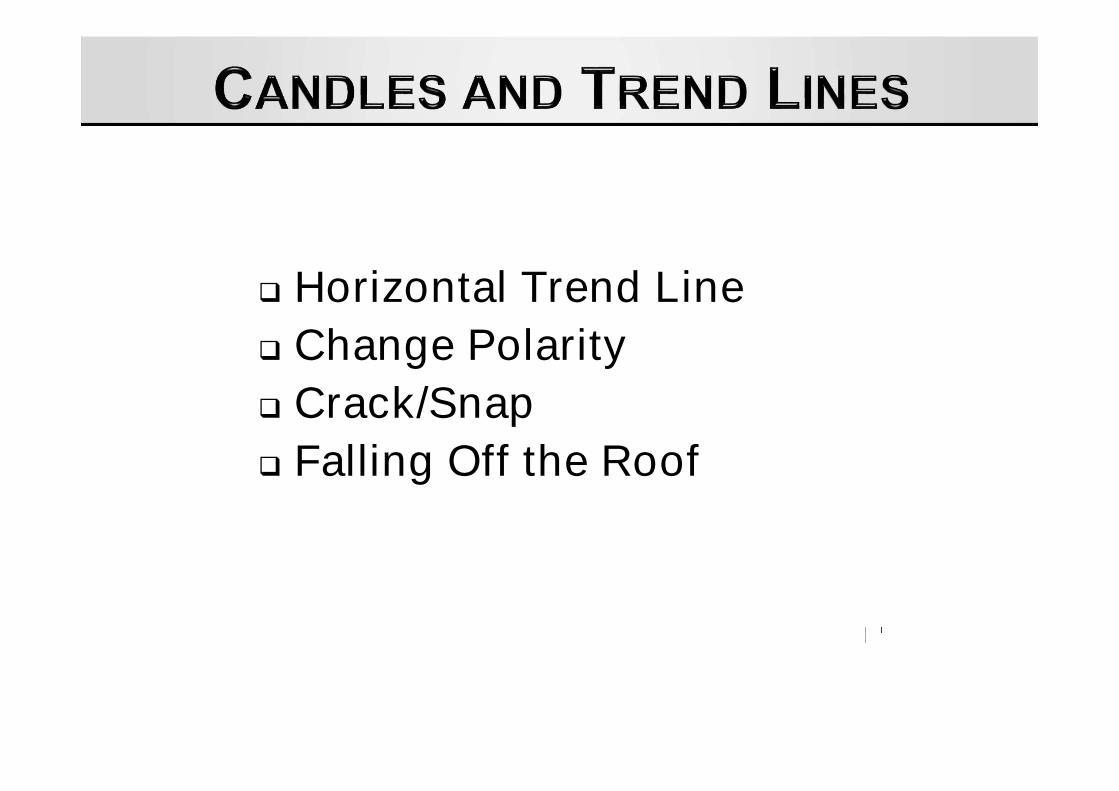
Horizontal Trend Line
Change Polarity
Crack/Snap
Falling Off the Roof

Who’s in control?
Who’s in control?
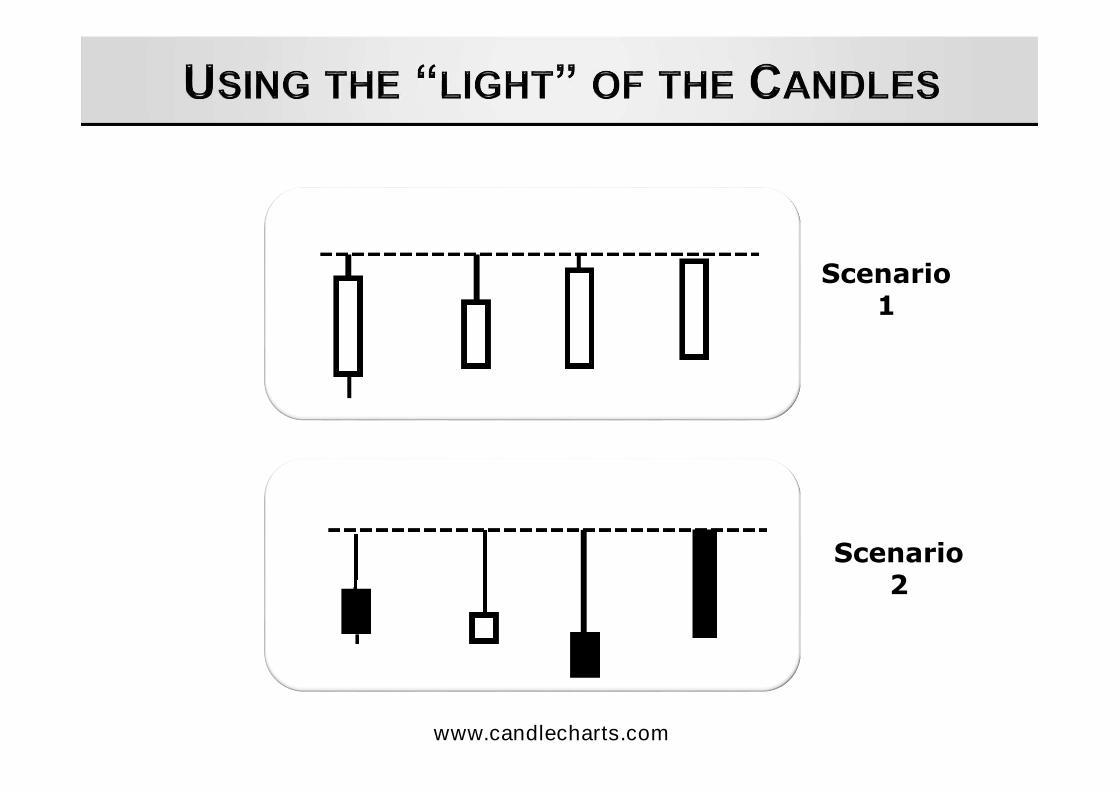
Scenario1
Scenario2
www.candlecharts.com
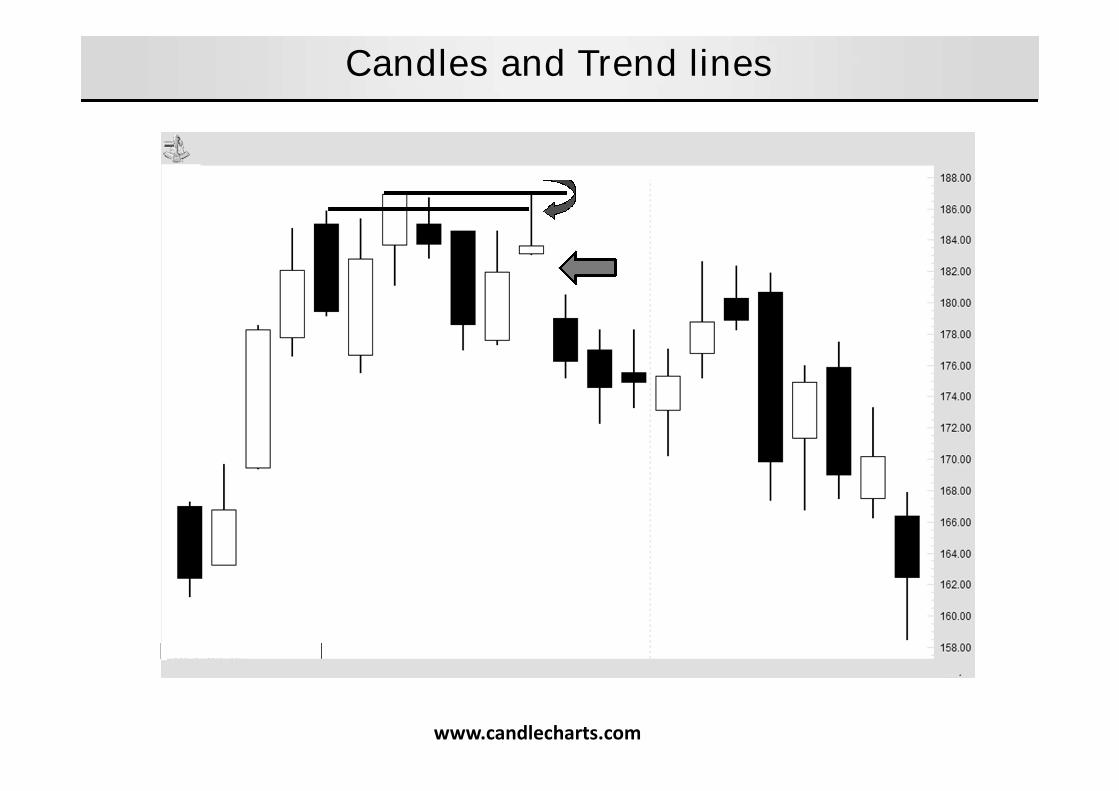
Candles and Trend lines
www.candlecharts.com
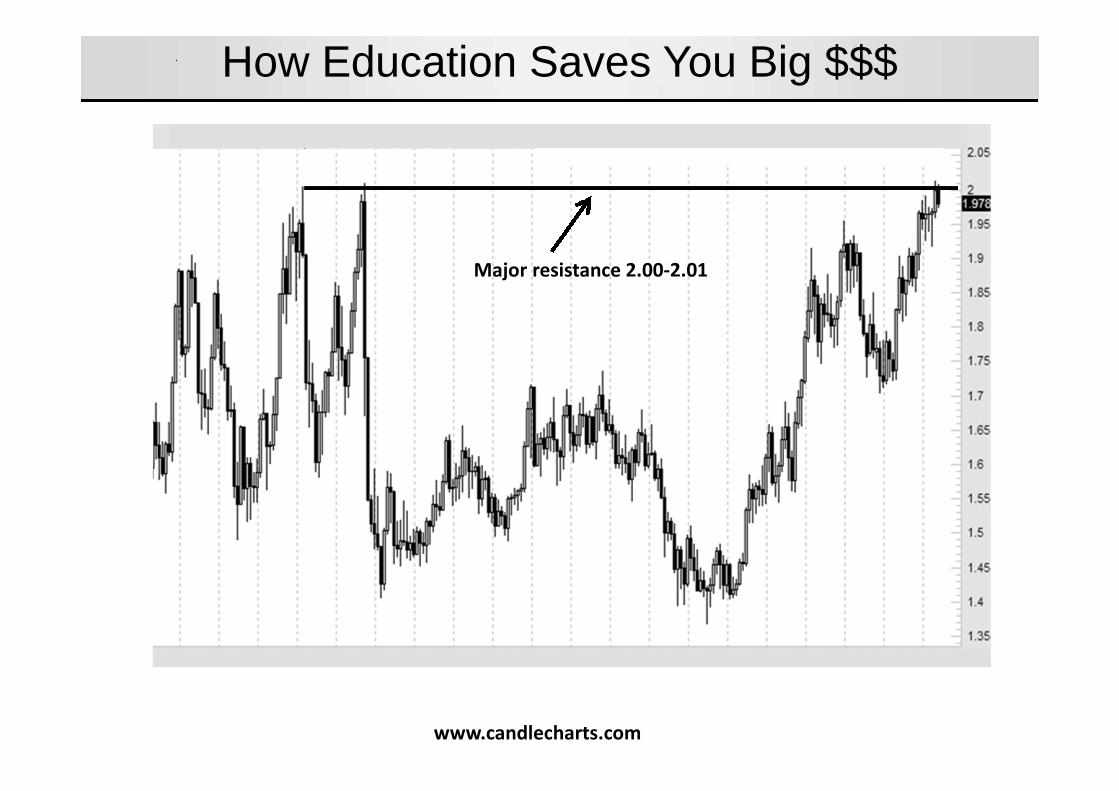
How Education Saves You Big $$$
Major resistance 2.00-2.01
www.candlecharts.com
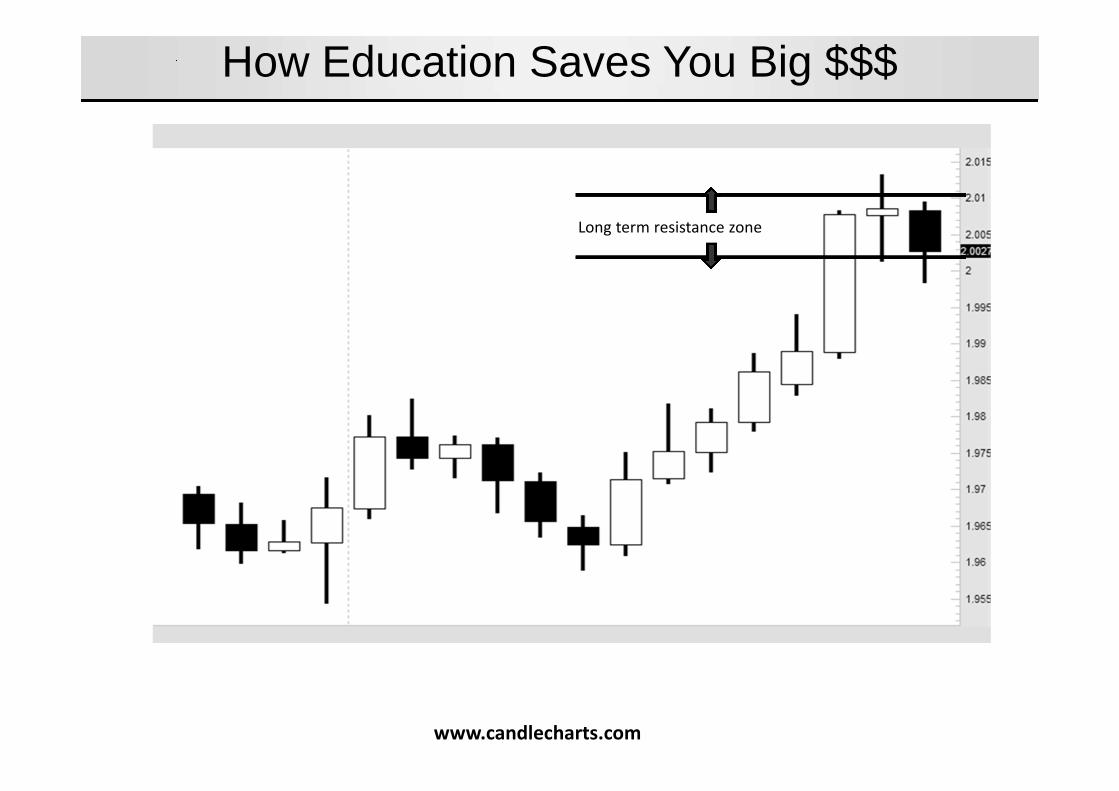
Long term resistance zone
How Education Saves You Big $$$
www.candlecharts.com
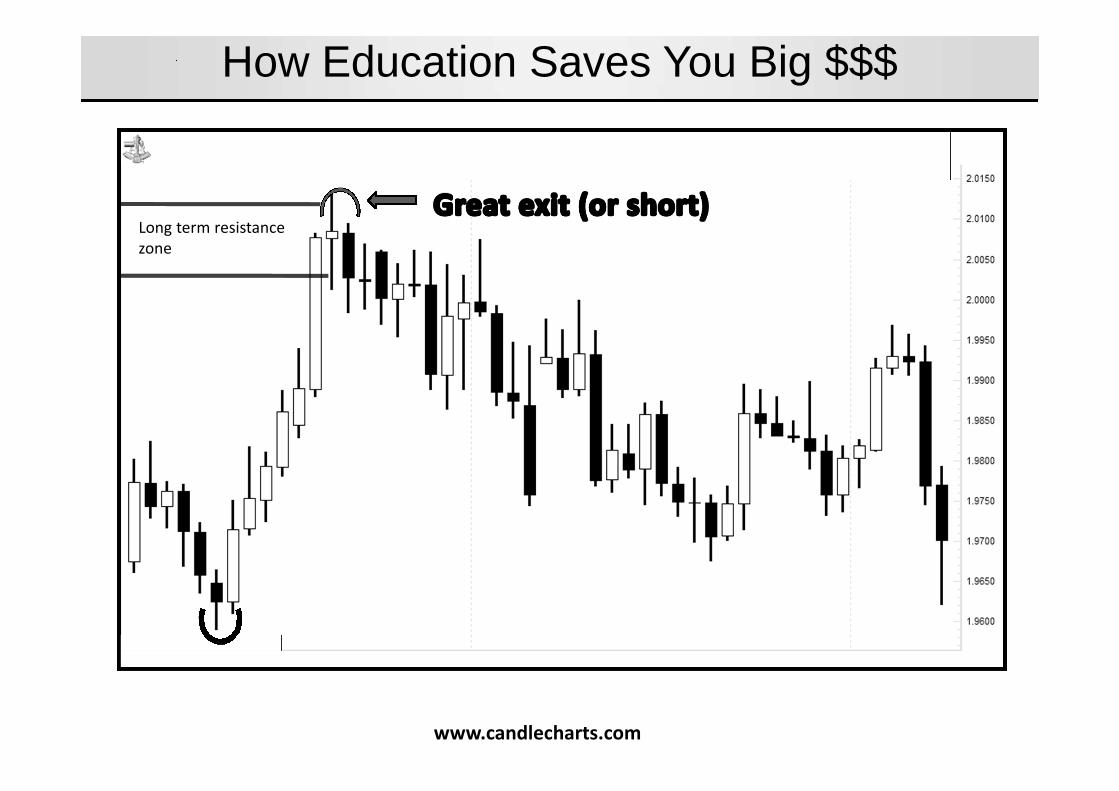
Long term resistancezone
How Education Saves You Big $$$
www.candlecharts.com
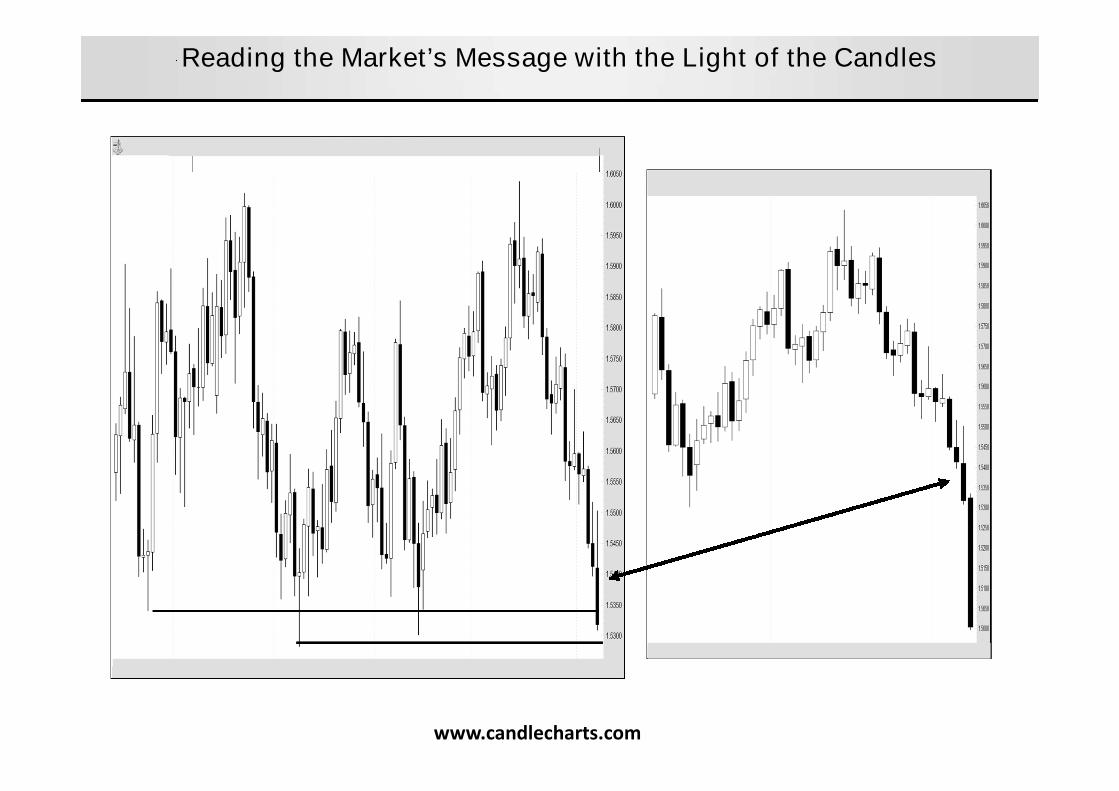
Reading the Market’s Message with the Light of the Candles
www.candlecharts.com
www.candlecharts.com
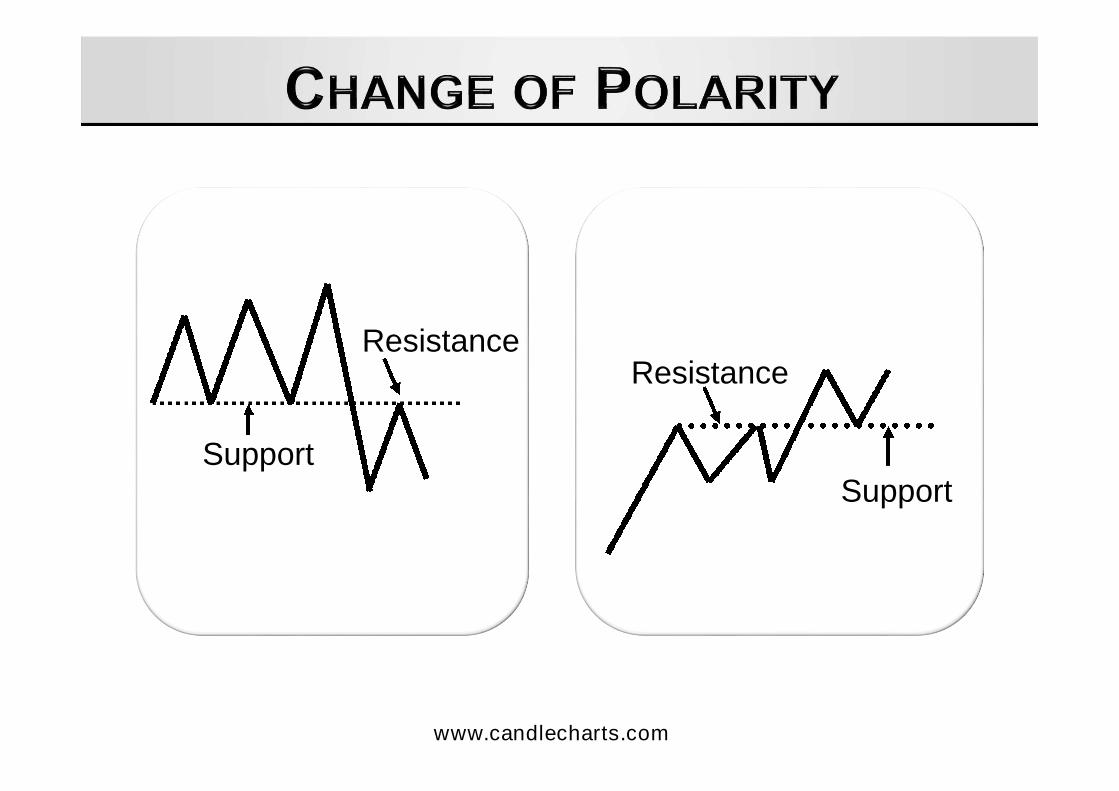
SupportSupport
ResistanceResistance
www.candlecharts.com
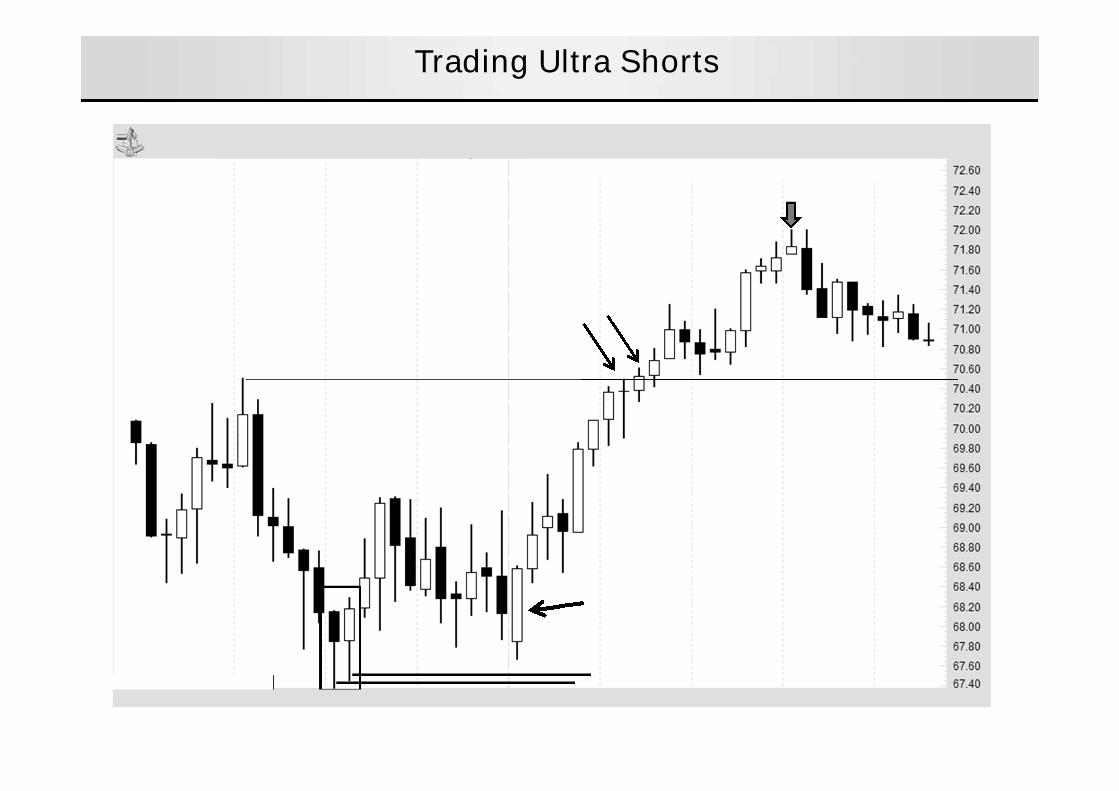
Trading Ultra Shorts
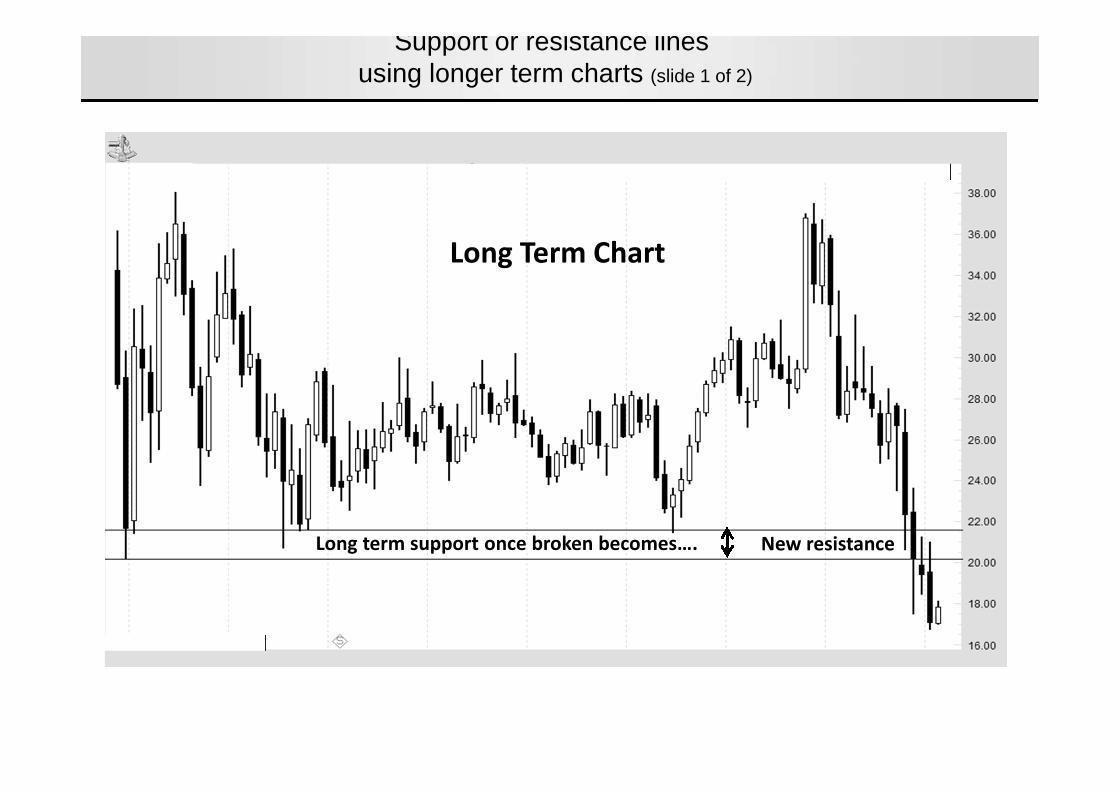
Support or resistance linesusing longer term charts (slide 1 of 2)
Long Term Chart
Long term support once broken becomes…. New resistance
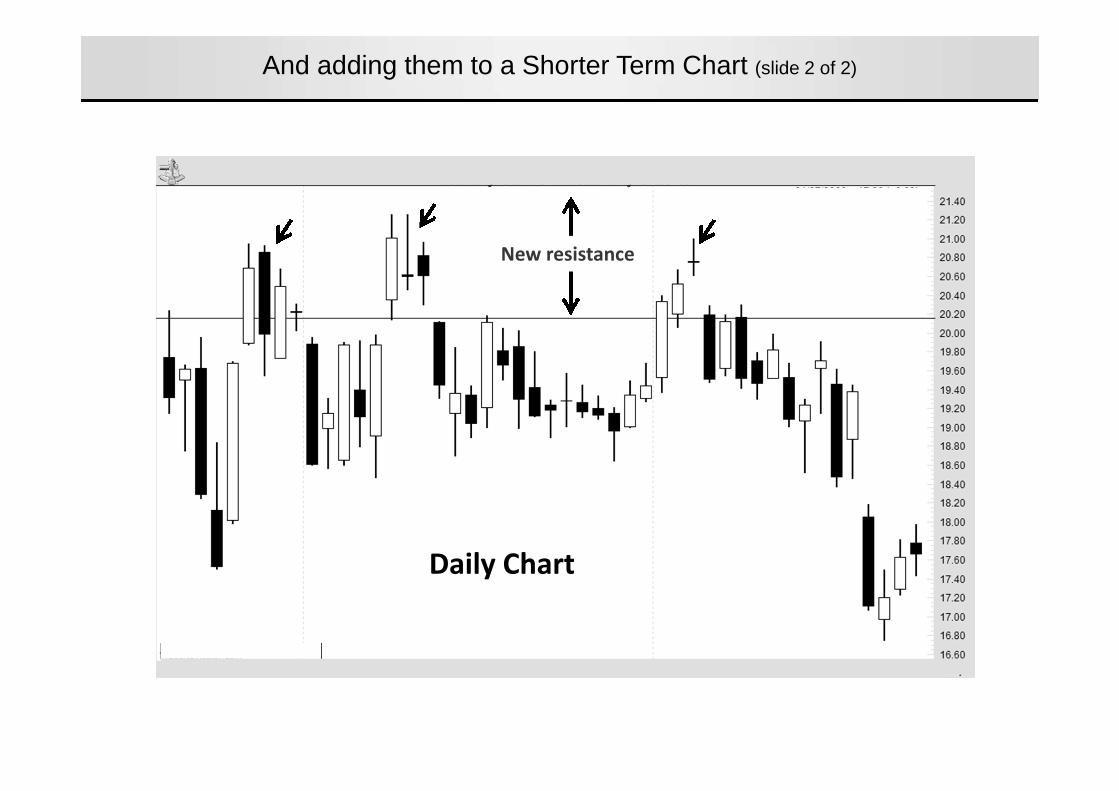
And adding them to a Shorter Term Chart (slide 2 of 2)
Daily Chart
New resistance
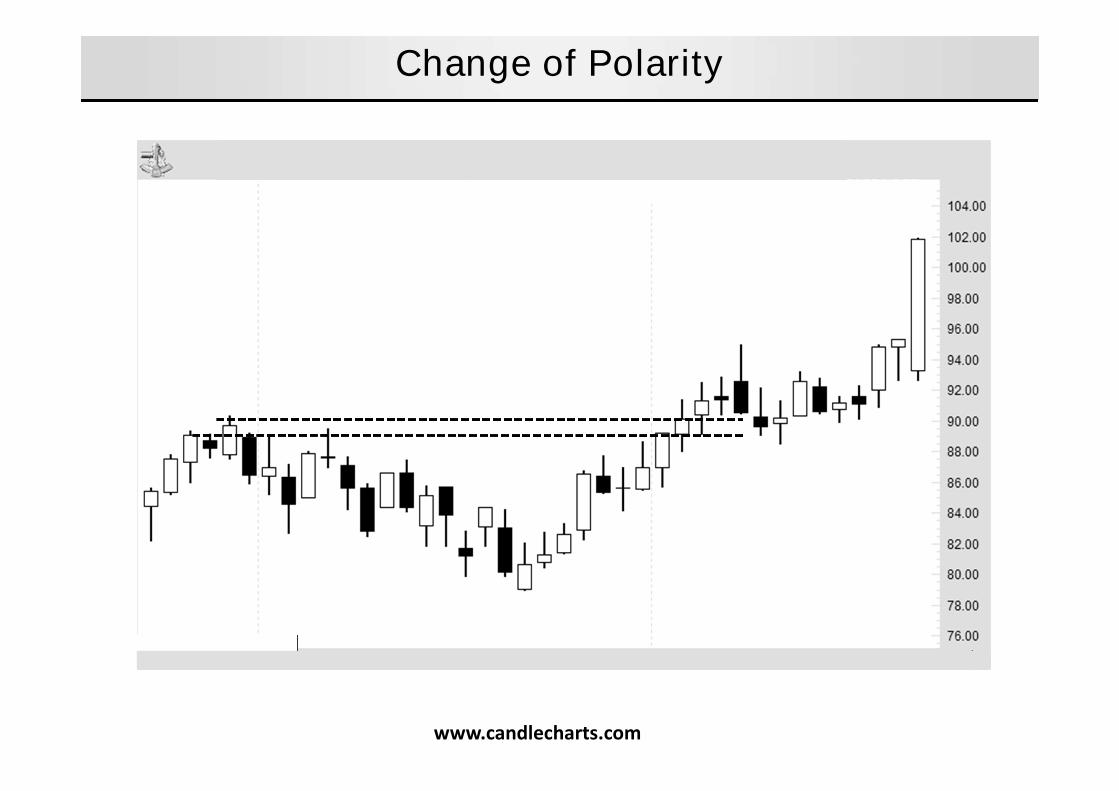
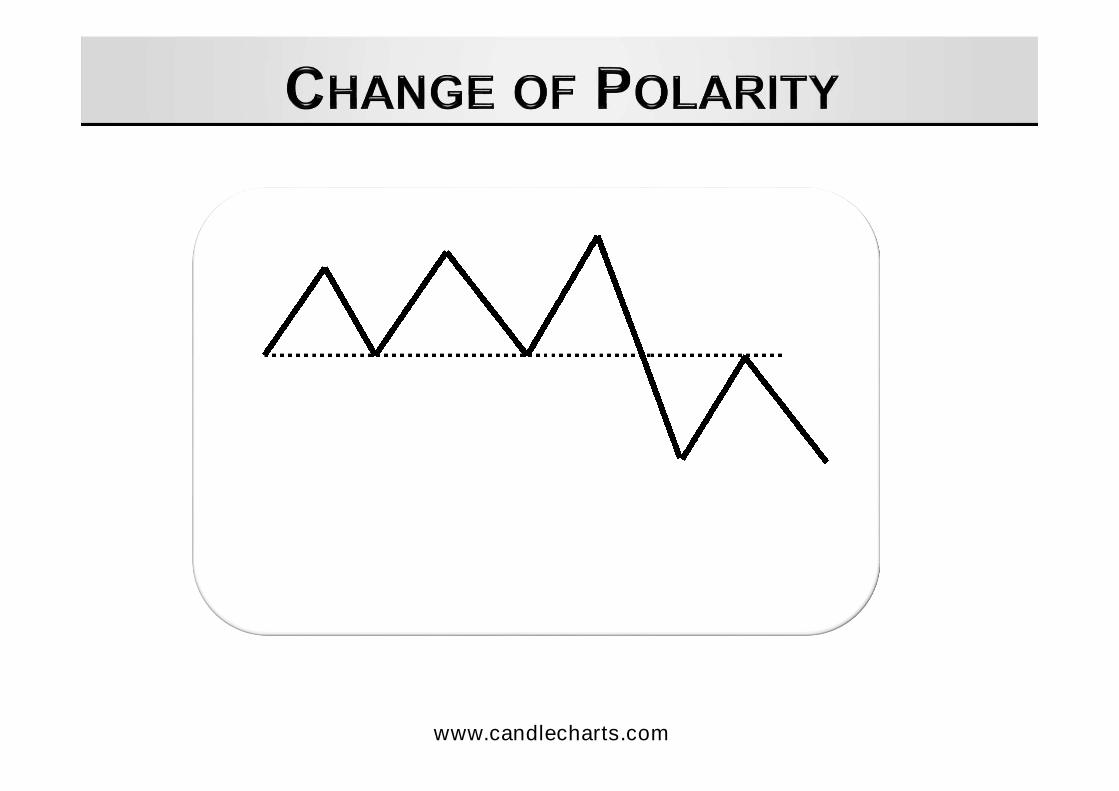
Change of Polarity
www.candlecharts.com
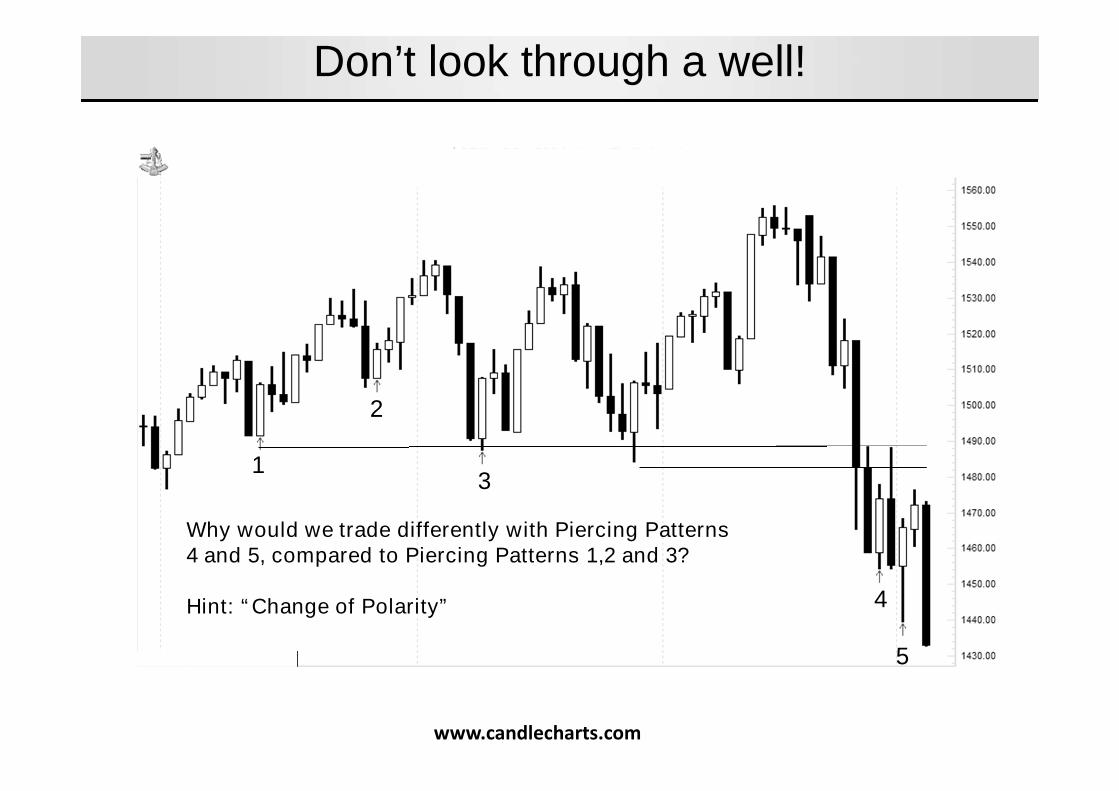
Don’t look through a well!
1
2
3
4
5
Why would we trade differently with Piercing Patterns4 and 5, compared to Piercing Patterns 1,2 and 3?
Hint: “Change of Polarity”
www.candlecharts.com
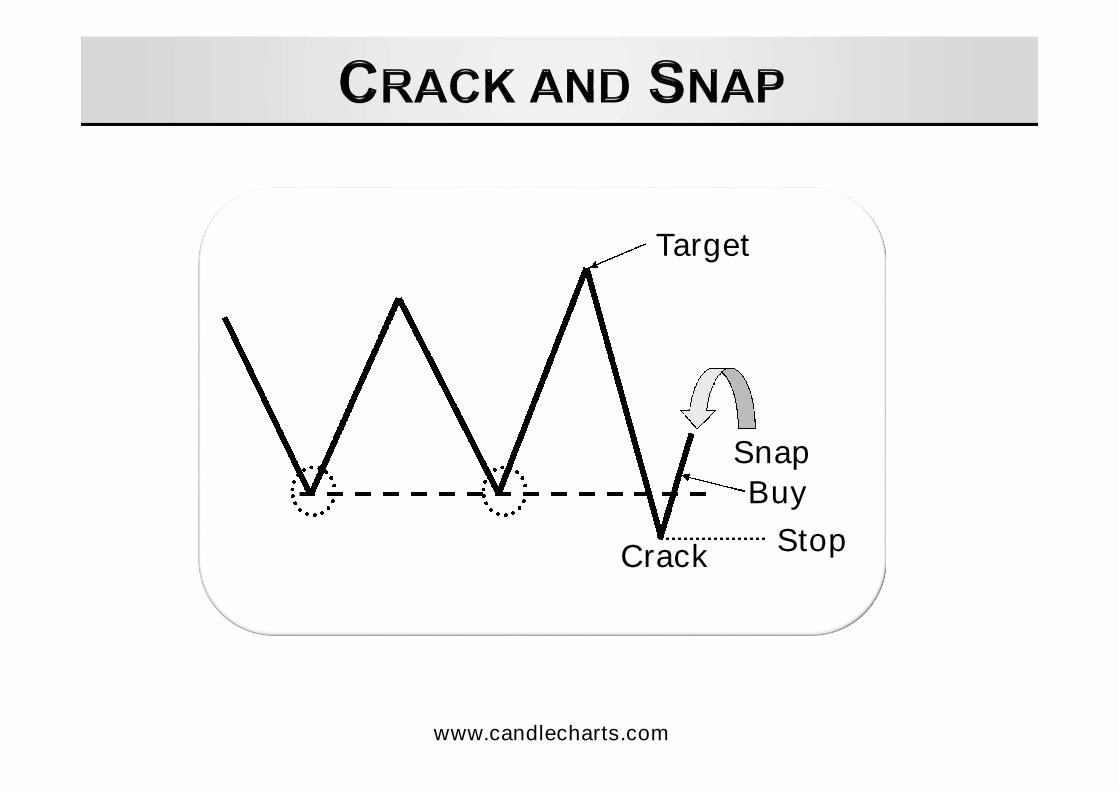
Snap
Crack
Target
Stop
Buy
www.candlecharts.com
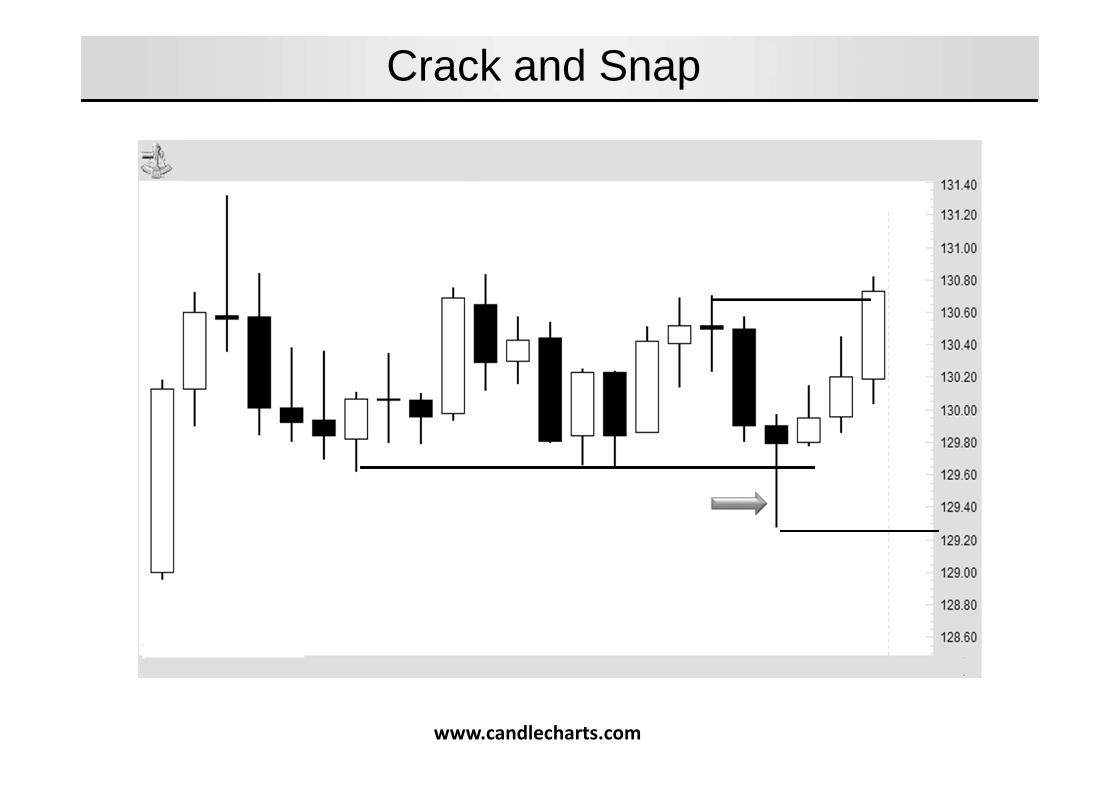
Crack and Snap
www.candlecharts.com
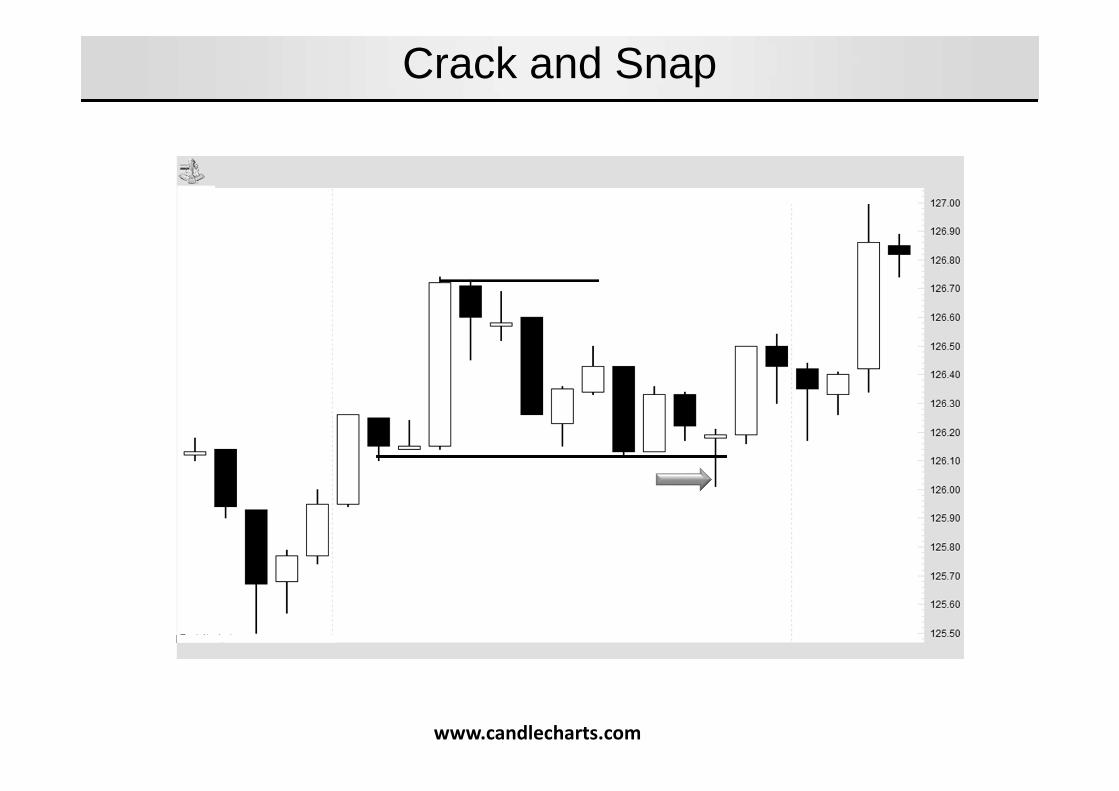
Crack and Snap
www.candlecharts.com

Sell
Target
Stop
www.candlecharts.com
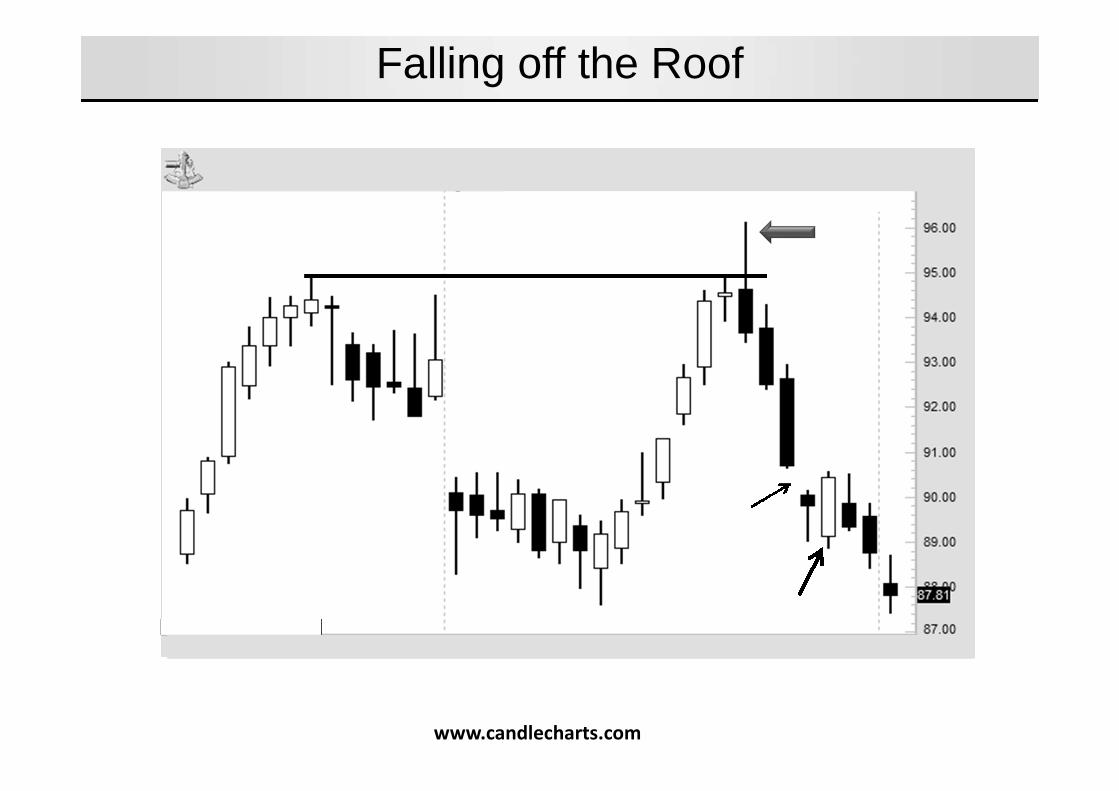
Falling off the Roof
www.candlecharts.com

www.candlecharts.com
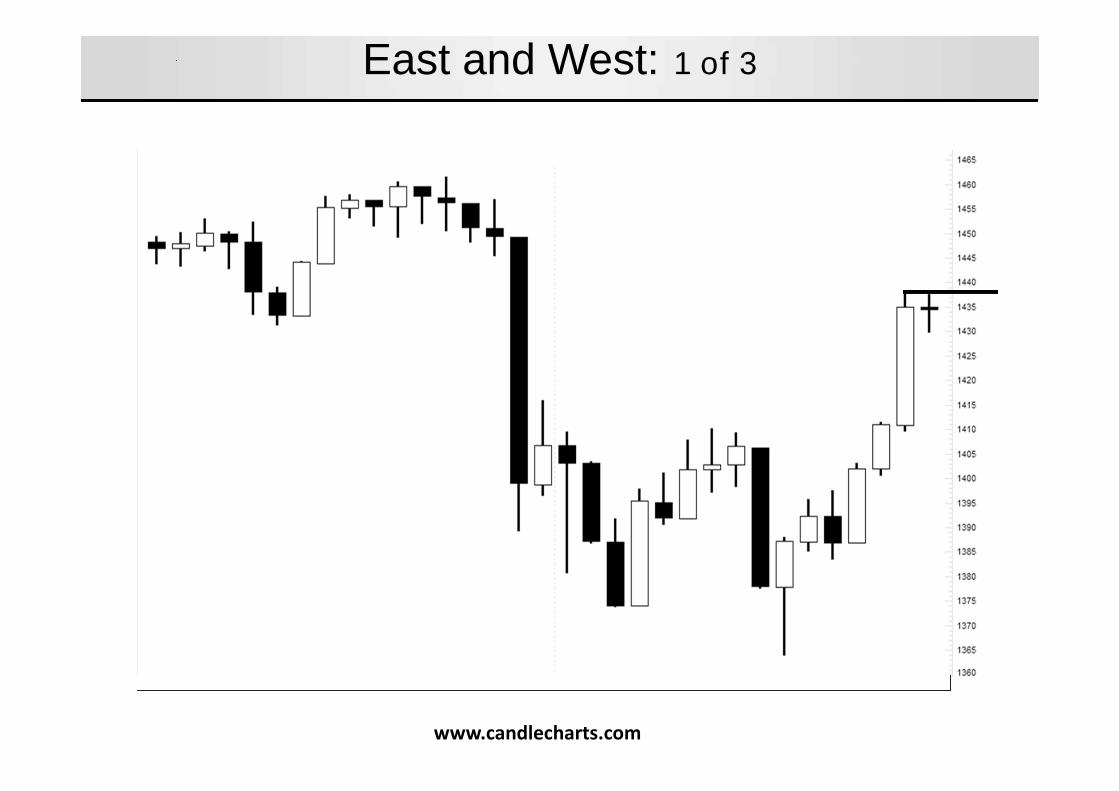
East and West: 1 of 3
www.candlecharts.com
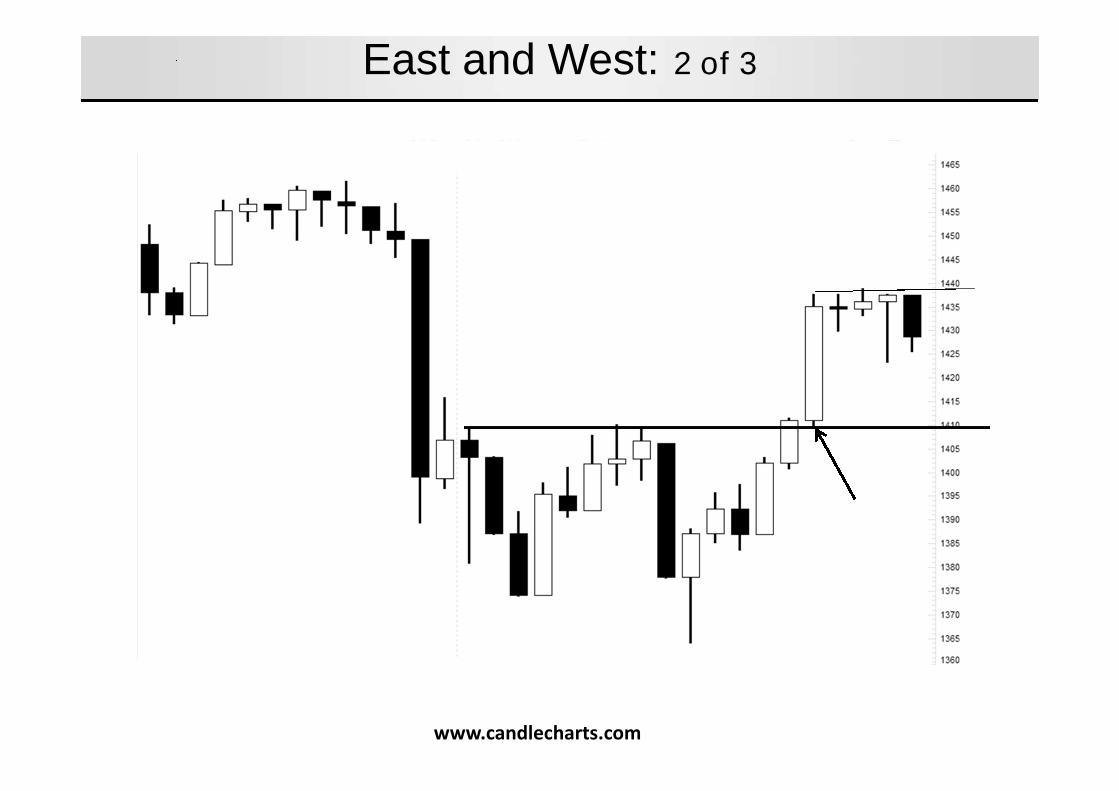
East and West: 2 of 3
www.candlecharts.com
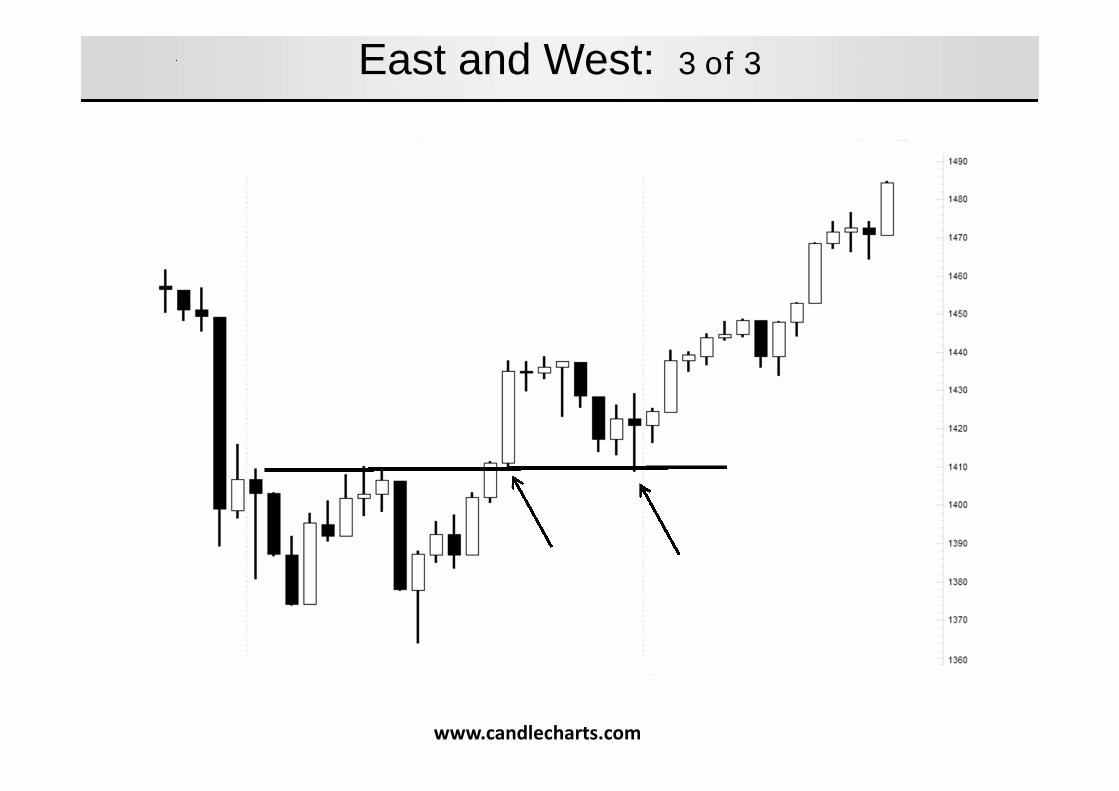
East and West: 3 of 3
www.candlecharts.com
Foundation ofEast + West:
Nison Candlesticksand Volume
Foundation ofEast + West:
Nison Candlesticksand Volume
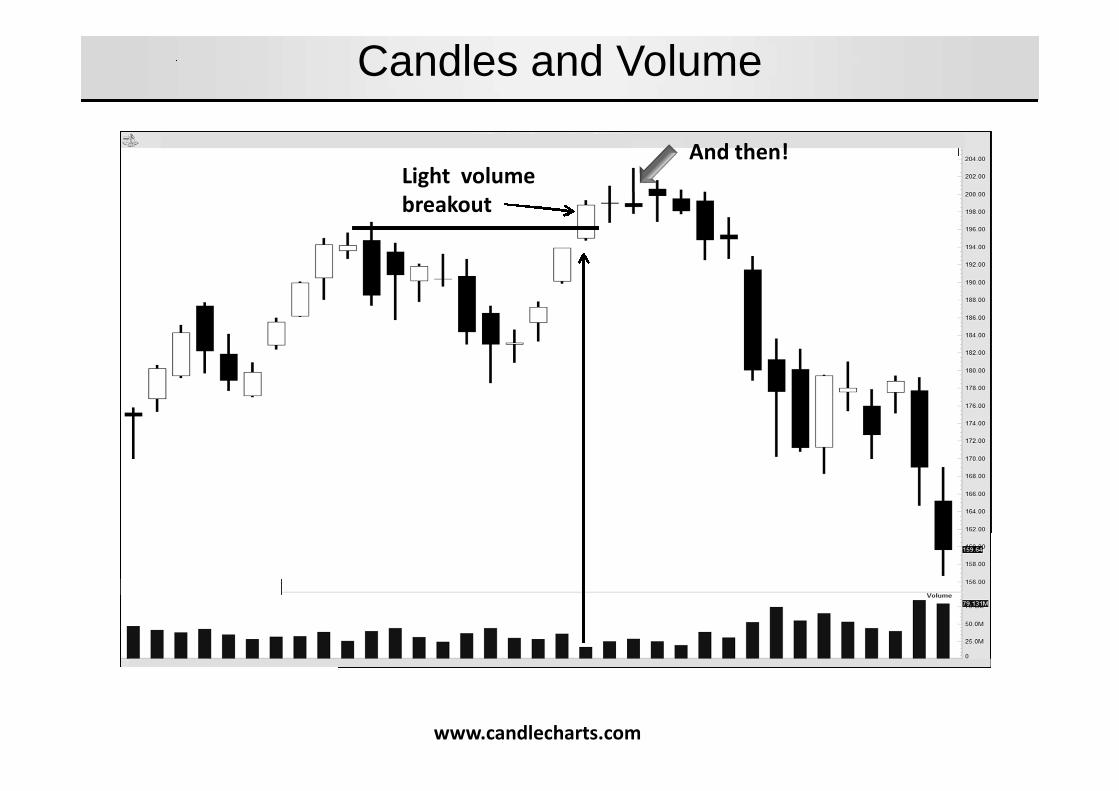
Candles and Volume
Light volumebreakout
www.candlecharts.com
And then!
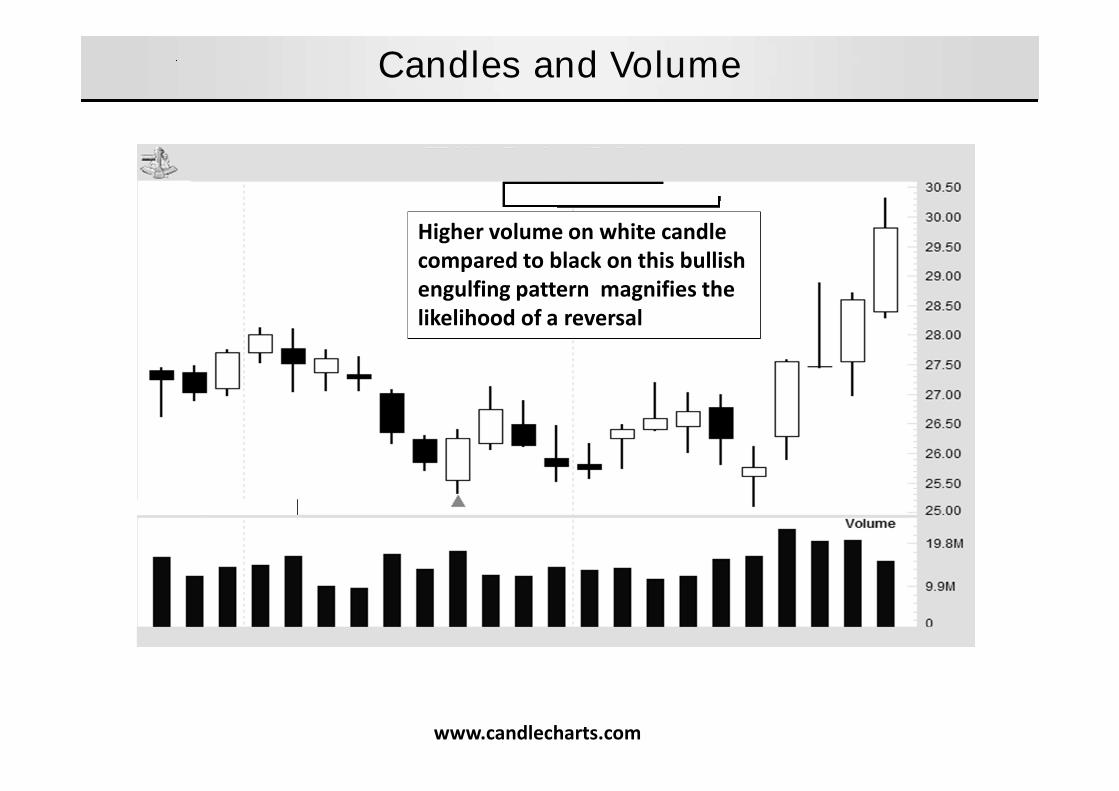
Candles and Volume
Higher volume on white candlecompared to black on this bullishengulfing pattern magnifies thelikelihood of a reversal
www.candlecharts.com
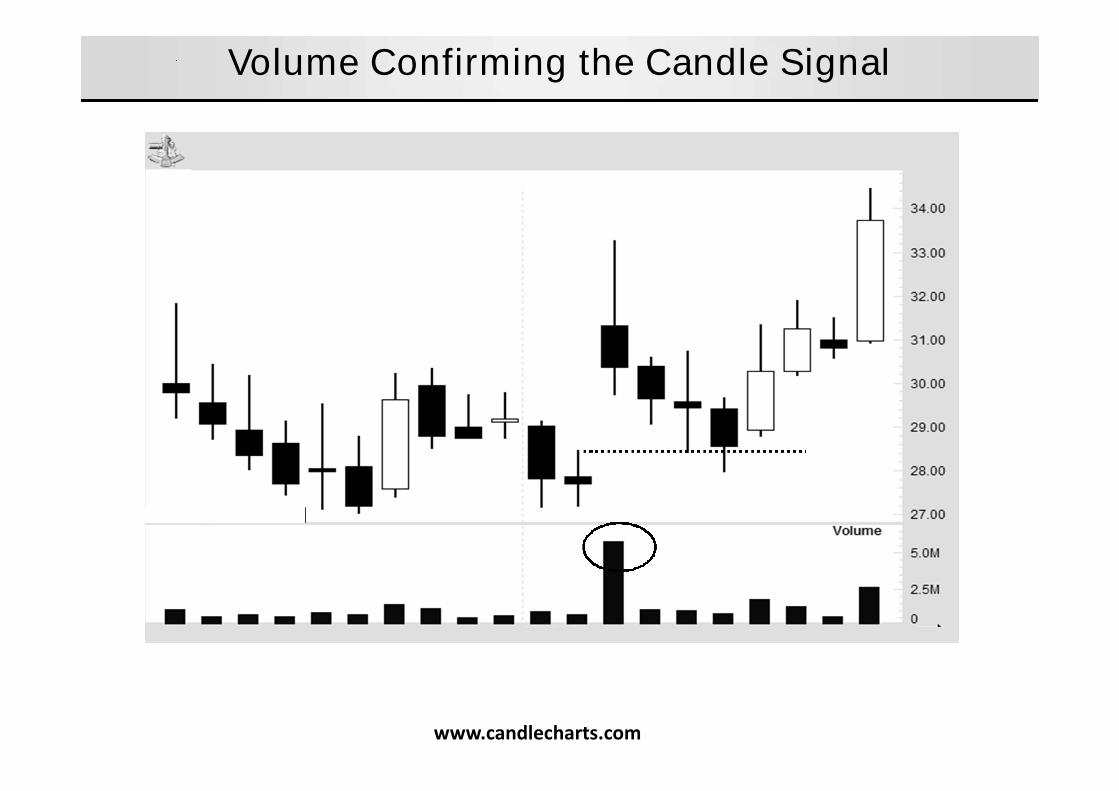
Volume Confirming the Candle Signal
www.candlecharts.com

Candles And Volume: High Volume Doji
www.candlecharts.com
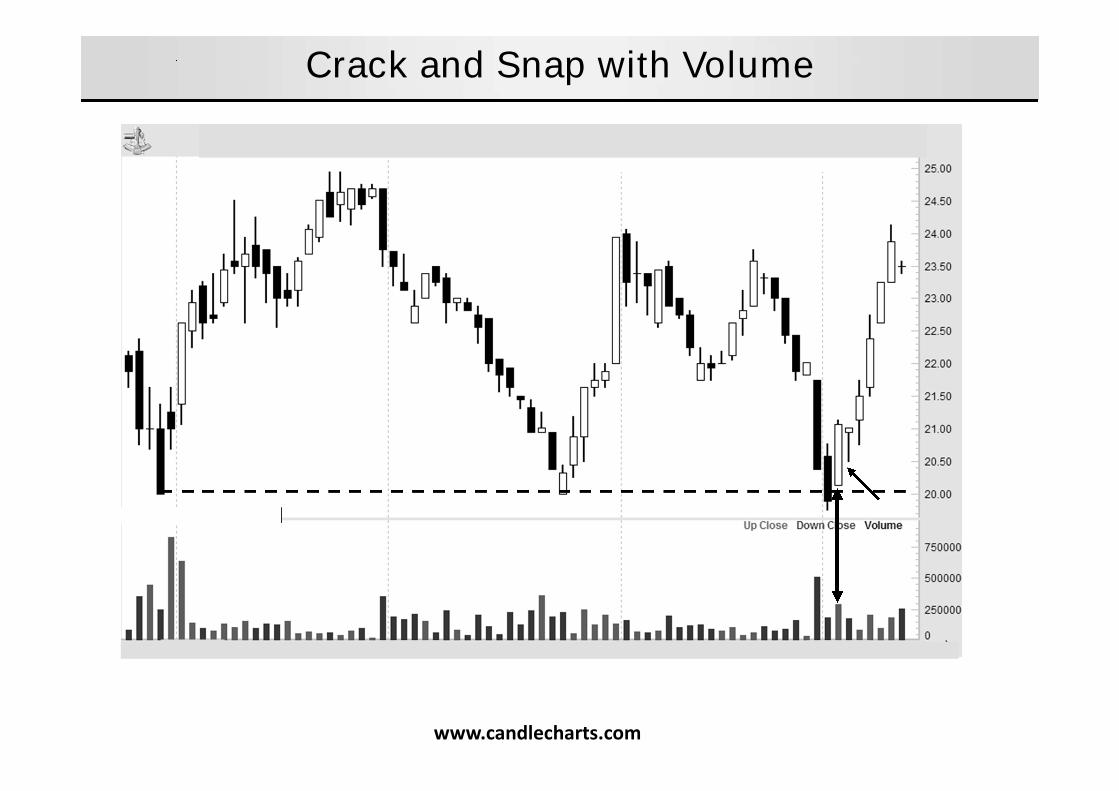
Crack and Snap with Volume
www.candlecharts.com
Foundation ofEast + West:
Nison Candlesticksand
Bollinger Bands
Foundation ofEast + West:
Nison Candlesticksand
Bollinger Bands
www.candlecharts.com
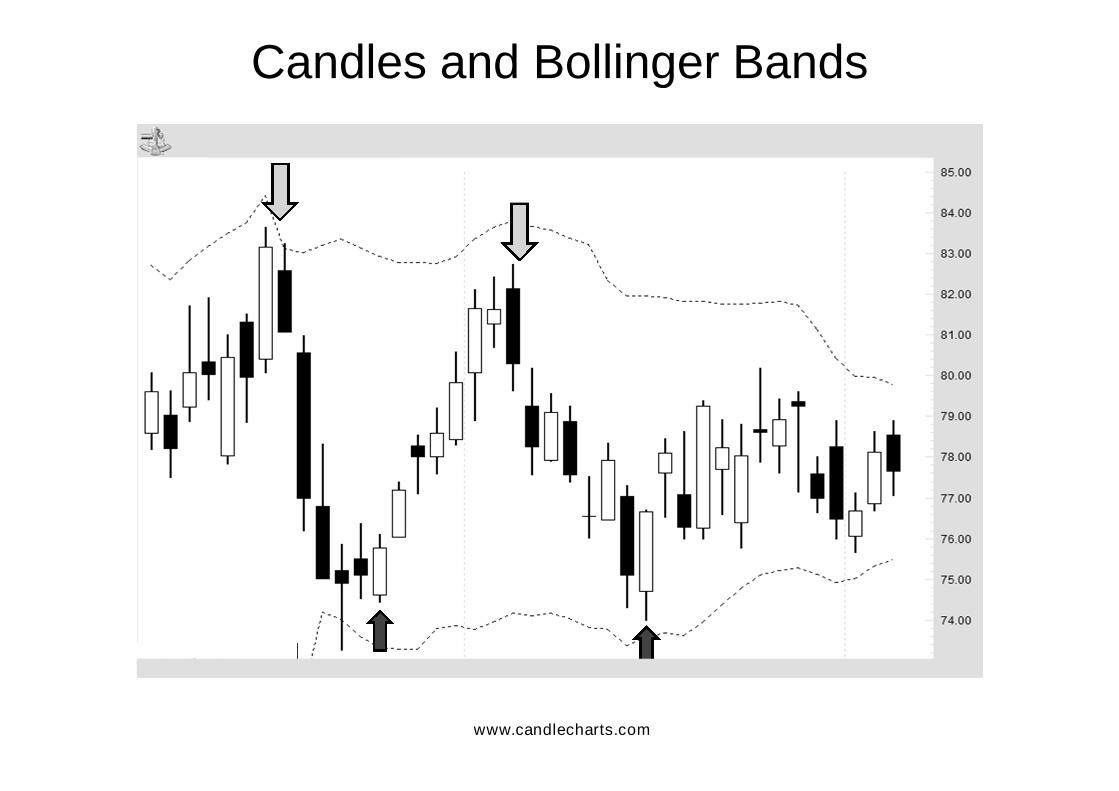
Candles and Bollinger Bands
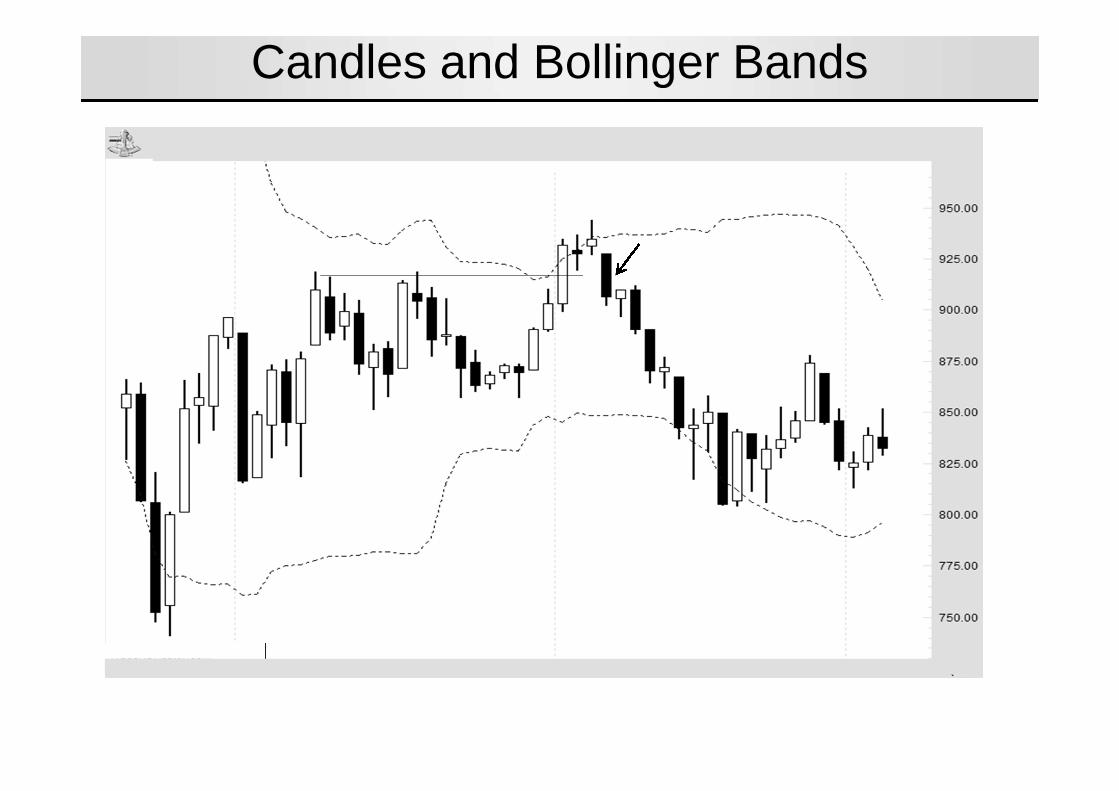
Candles and Bollinger Bands
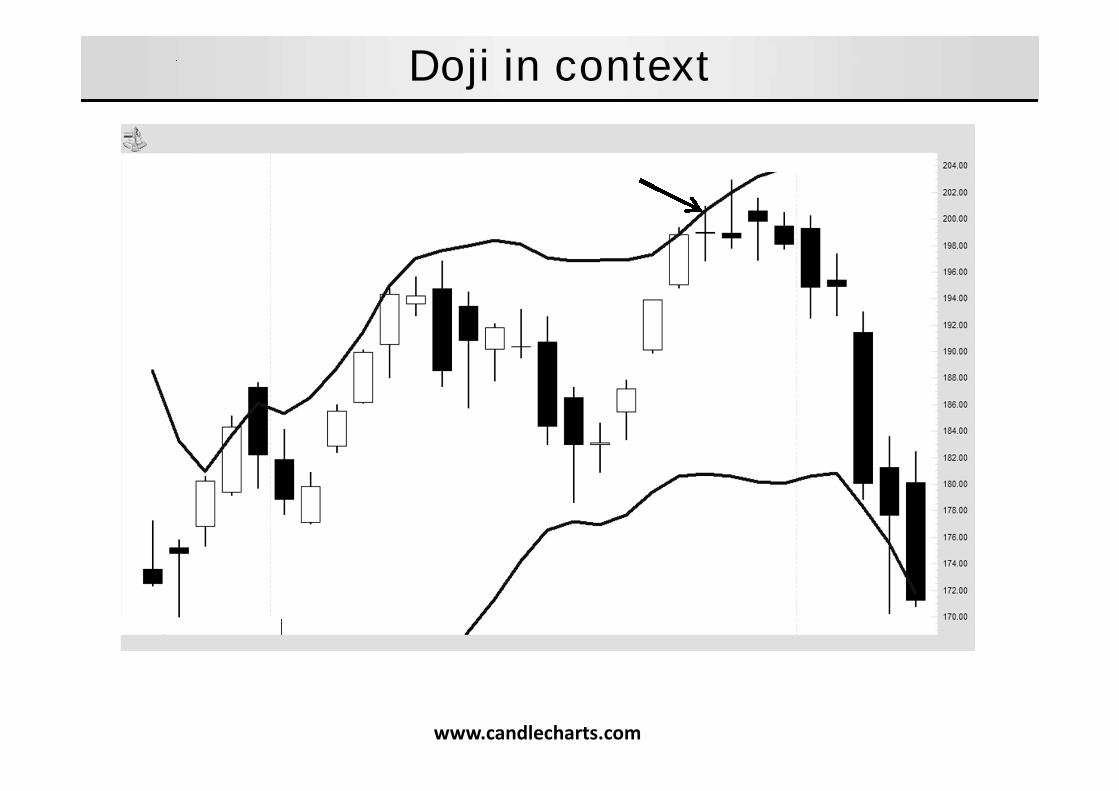
Doji in context
www.candlecharts.com
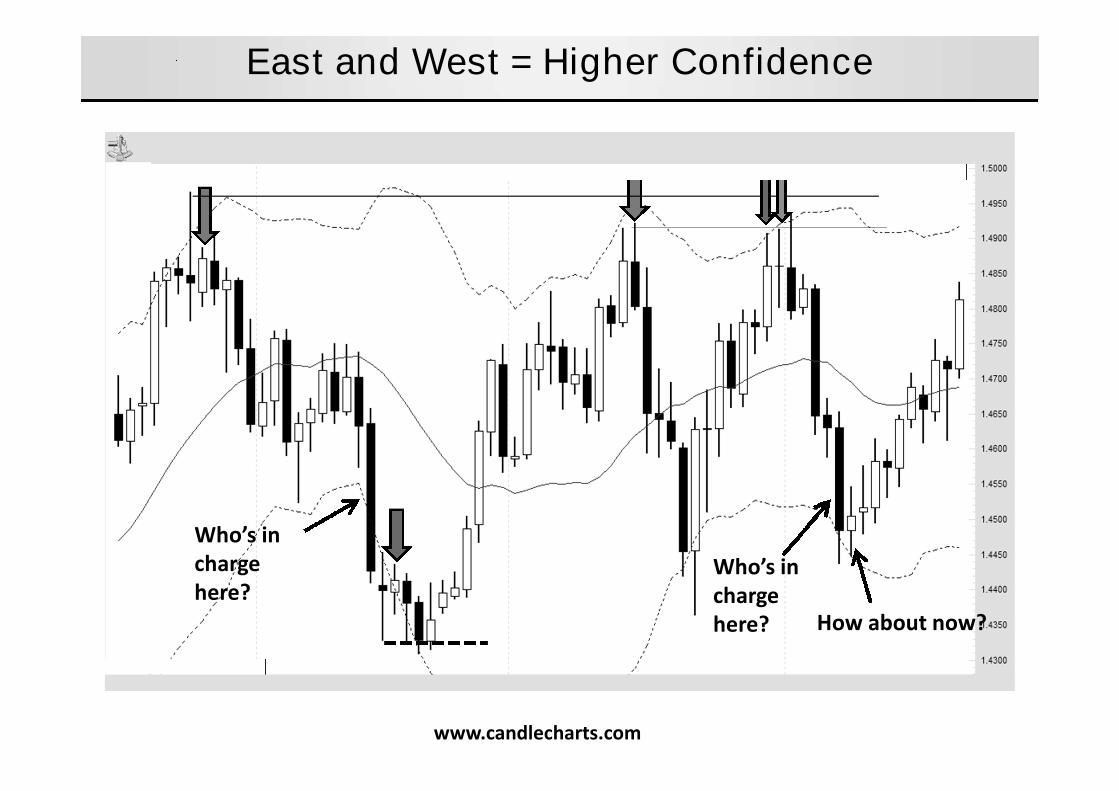
East and West = Higher Confidence
Who’s inchargehere?
Who’s inchargehere?
How about now?
www.candlecharts.com

Foundation ofEast + West:
Nison Candlesticksand Oscillators
Foundation ofEast + West:
Nison Candlesticksand Oscillators
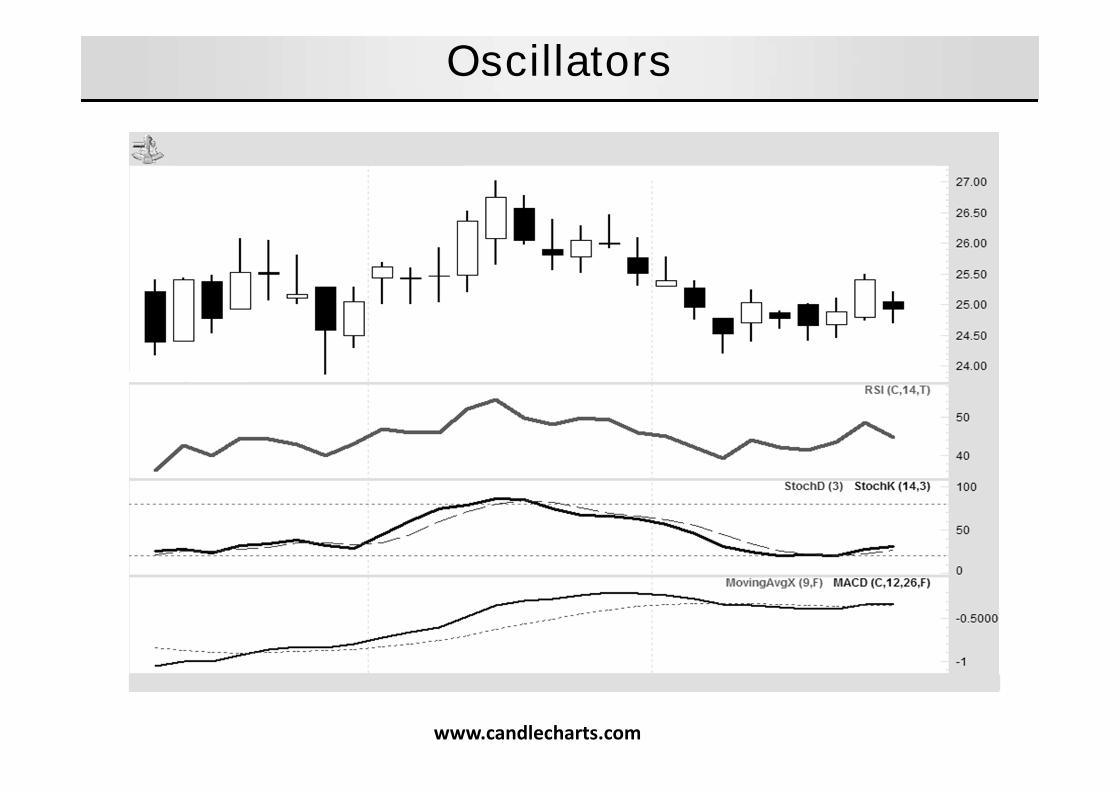
Oscillators
www.candlecharts.com
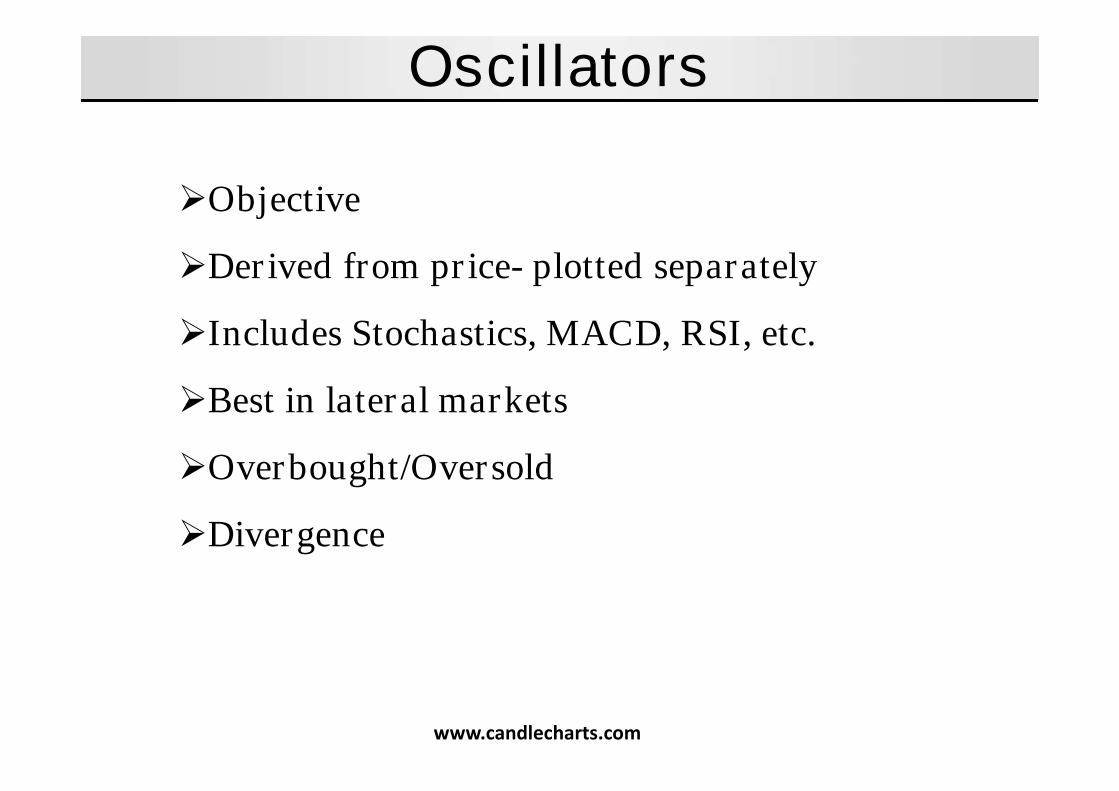
Oscillators
Objective
Derived from price- plotted separately
Includes Stochastics, MACD, RSI, etc.
Best in lateral markets
Overbought/Oversold
Divergence
www.candlecharts.com
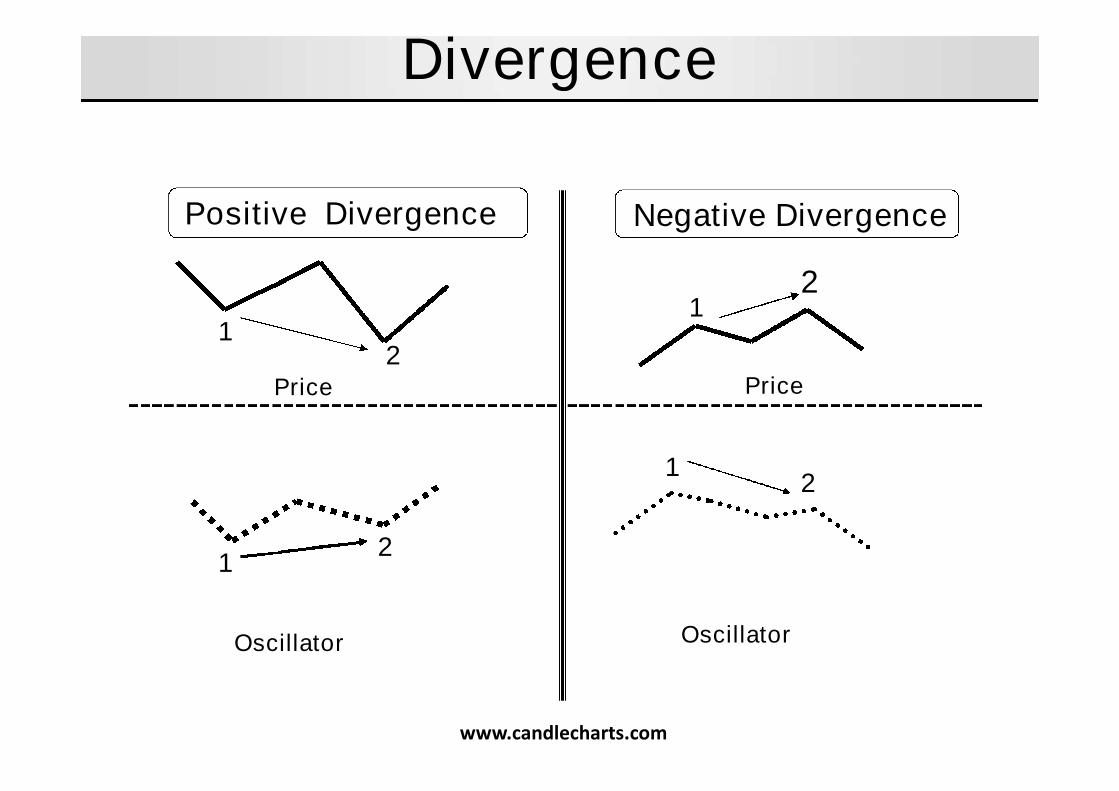
Positive Divergence Negative Divergence
Price
Oscillator
2
12
1
Oscillator
Price
12
12
Divergence
www.candlecharts.com
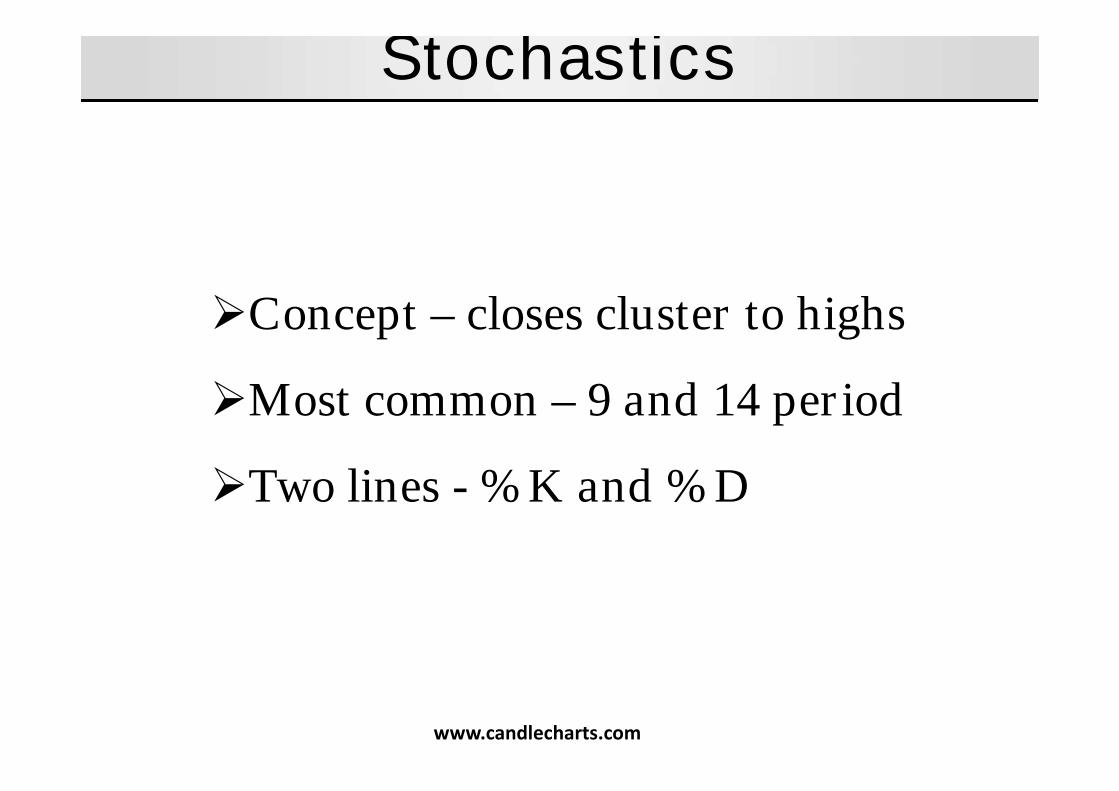
Concept – closes cluster to highs
Most common – 9 and 14 period
Two lines - %K and %D
Stochastics
www.candlecharts.com
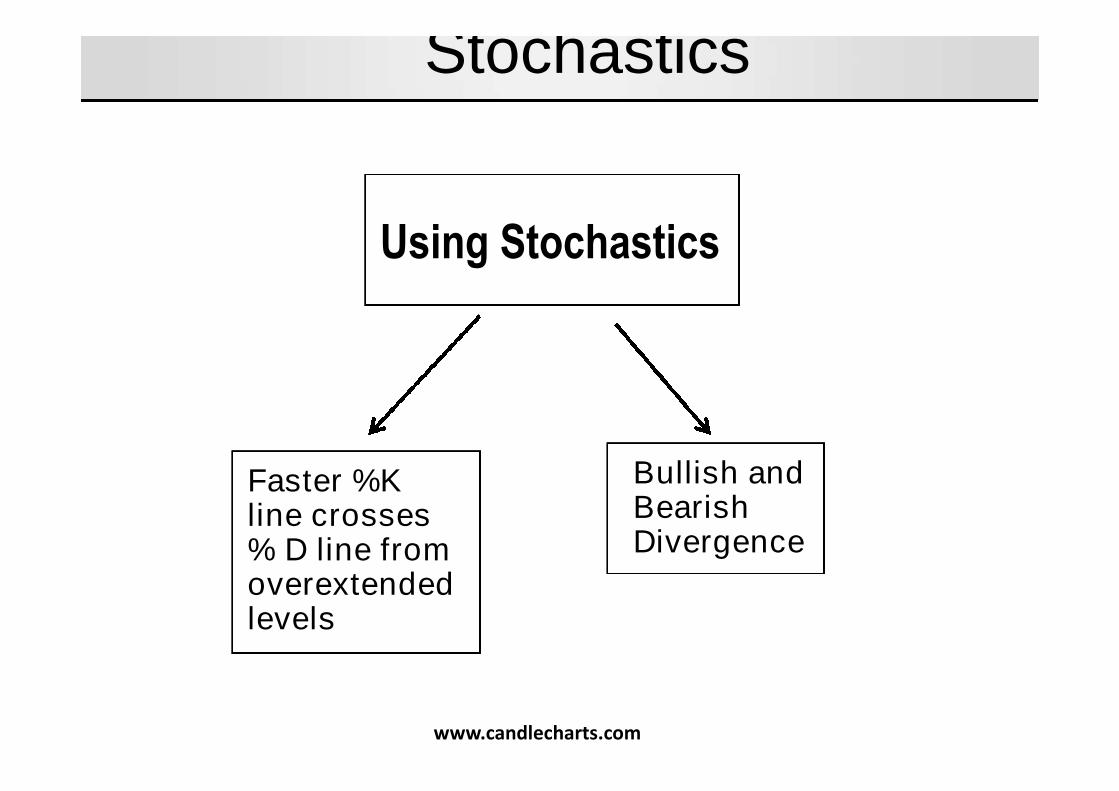
Faster %Kline crosses% D line fromoverextendedlevels
Using Stochastics
Bullish andBearishDivergence
Stochastics
www.candlecharts.com
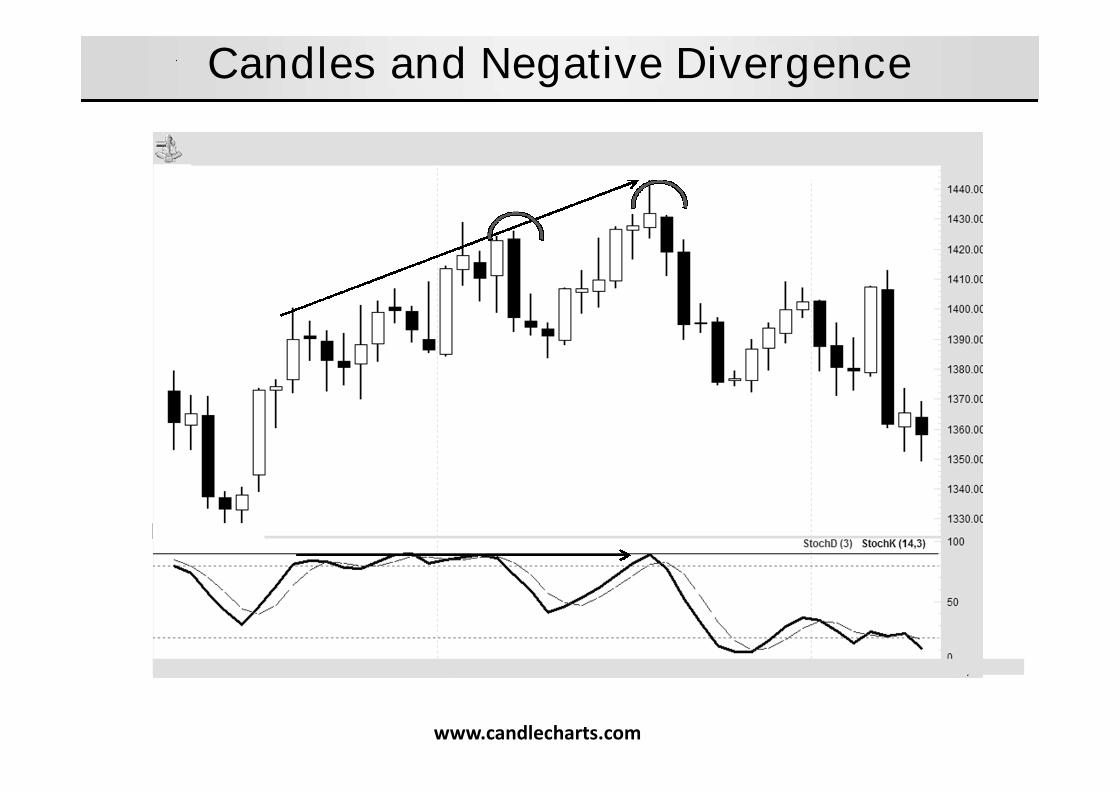
Candles and Negative Divergence
www.candlecharts.com
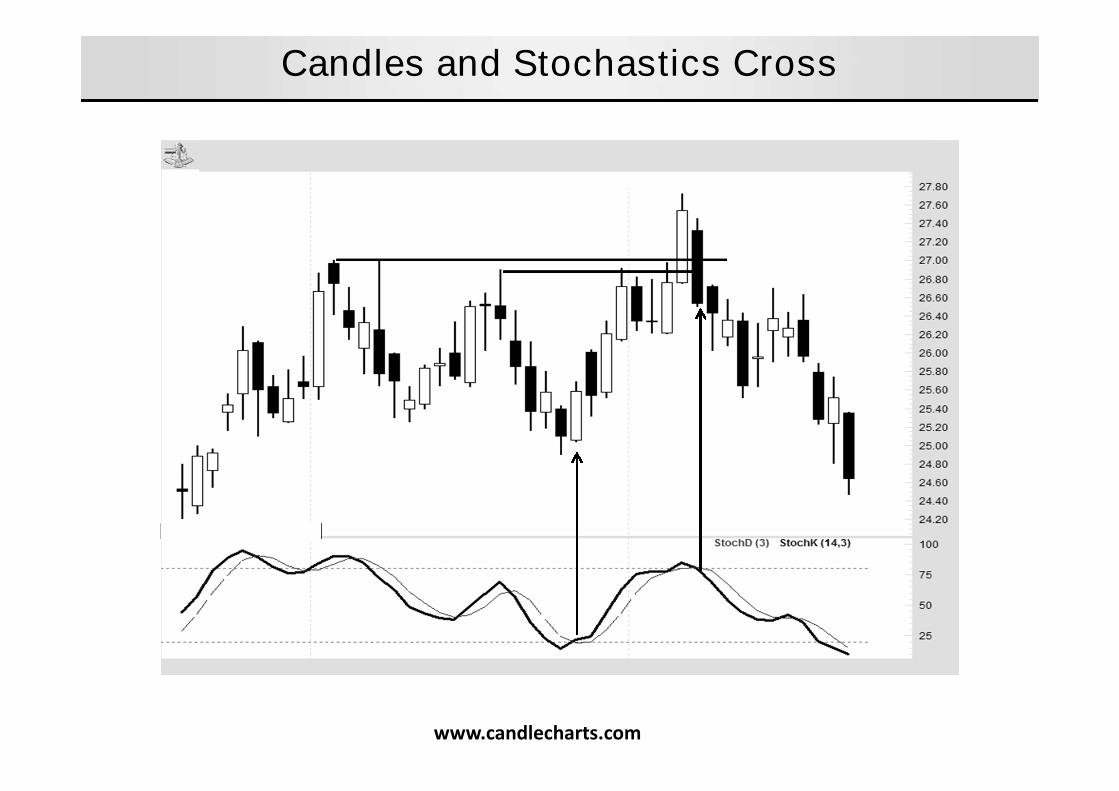
Candles and Stochastics Cross
www.candlecharts.com

Candles and Stochastics Cross
www.candlecharts.com
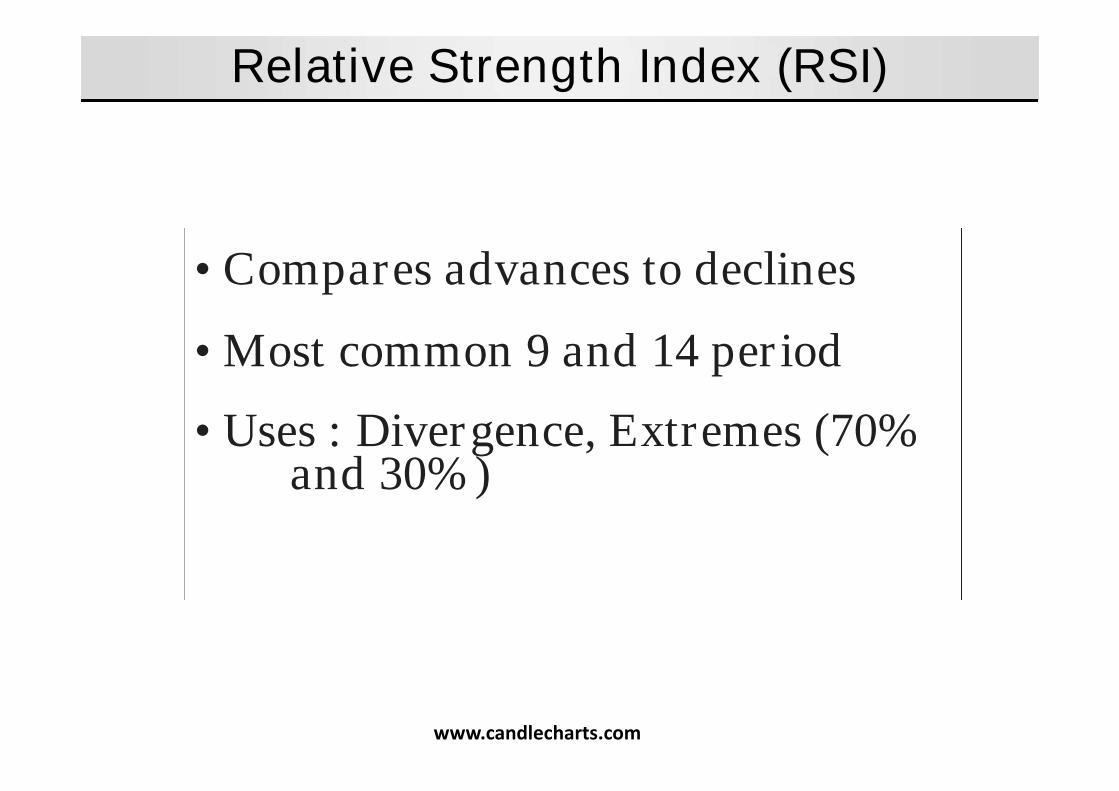
• Compares advances to declines
• Most common 9 and 14 period
• Uses : Divergence, Extremes (70%and 30%)
Relative Strength Index (RSI)
www.candlecharts.com
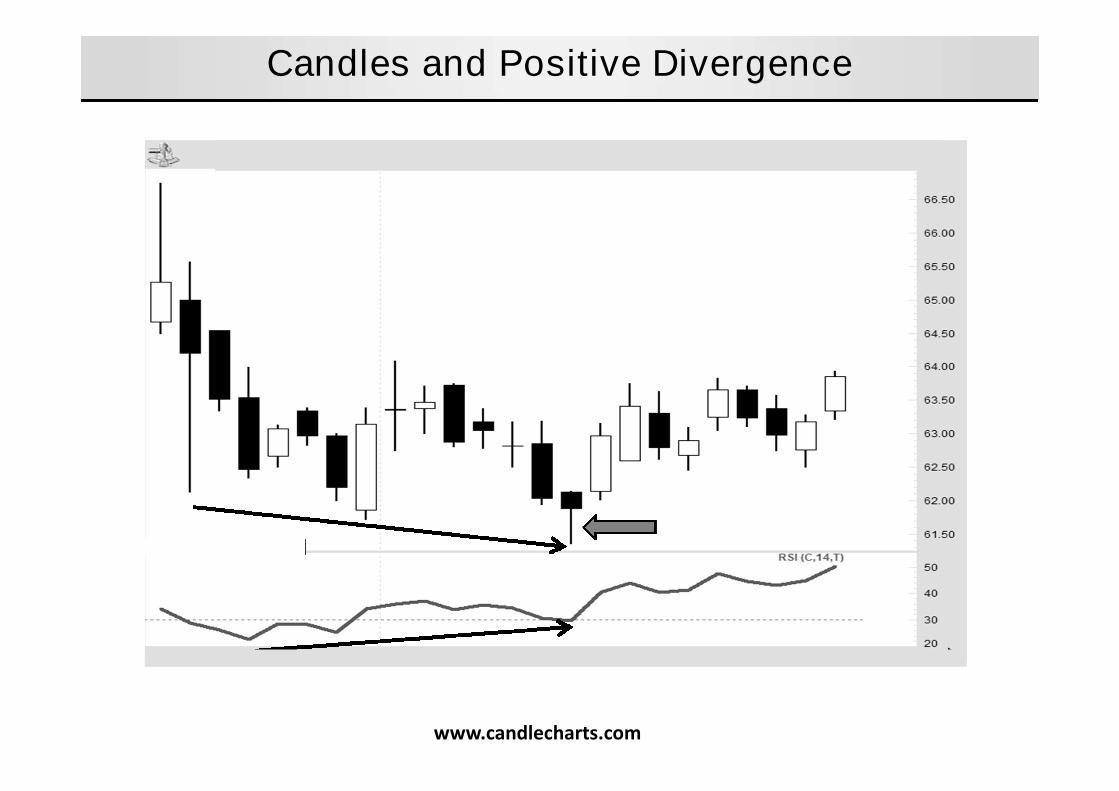
Candles and Positive Divergence
www.candlecharts.com
MACD line and Signal line
MACD Line – spread of two exponential
moving averages
Signal Line – Exponential moving average
of MACD line
Moving Average Convergence/Divergence (MACD)
www.candlecharts.com

MACD linesCrossesSignal line
OverboughtandOversold
Using the MACD
Bullish andBearishDivergence
Moving Average Convergence/Divergence (MACD)
www.candlecharts.com
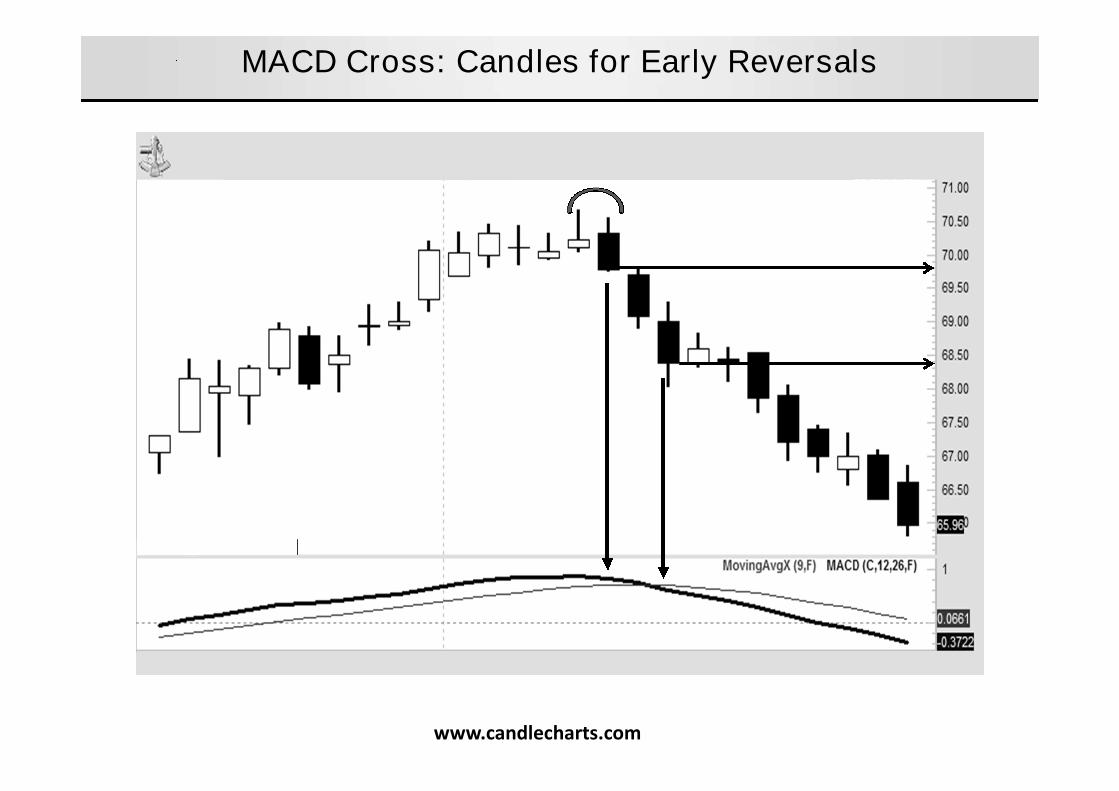
MACD Cross: Candles for Early Reversals
www.candlecharts.com

doji
MACD Cross: Candles for Early Reversals
www.candlecharts.com
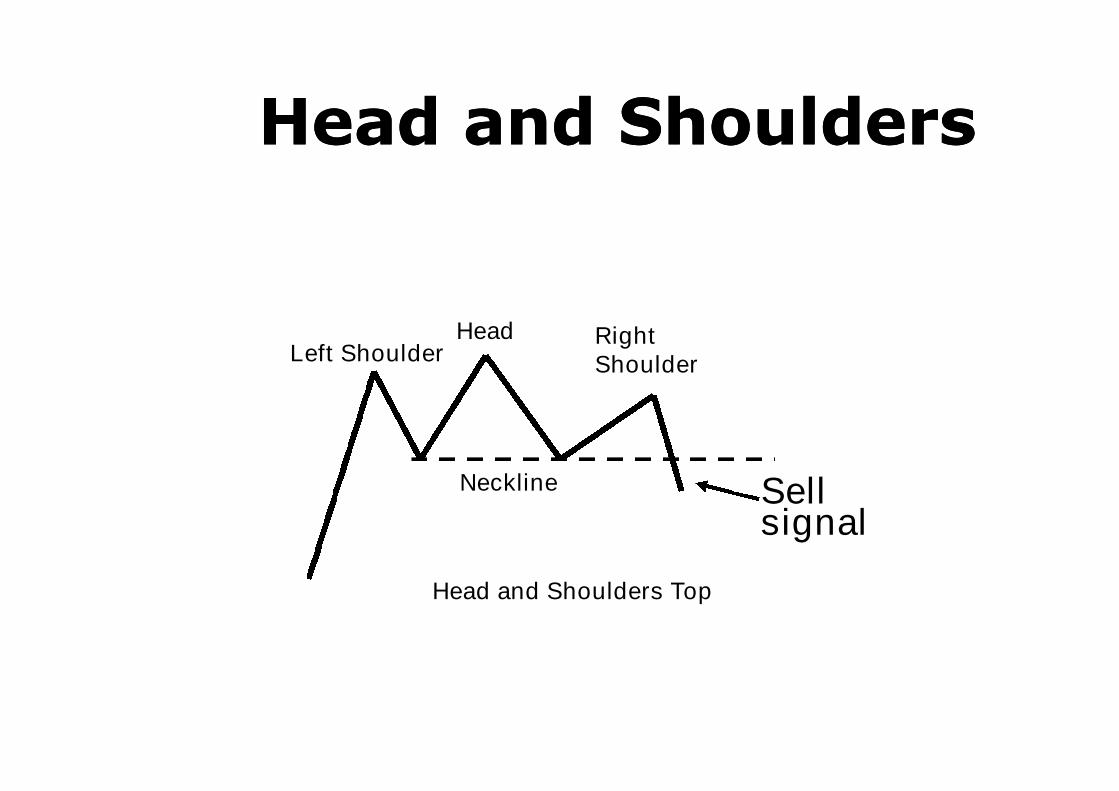
Head and ShouldersHead and Shoulders
Neckline
Left ShoulderRightShoulder
Head
Head and Shoulders Top
Sellsignal
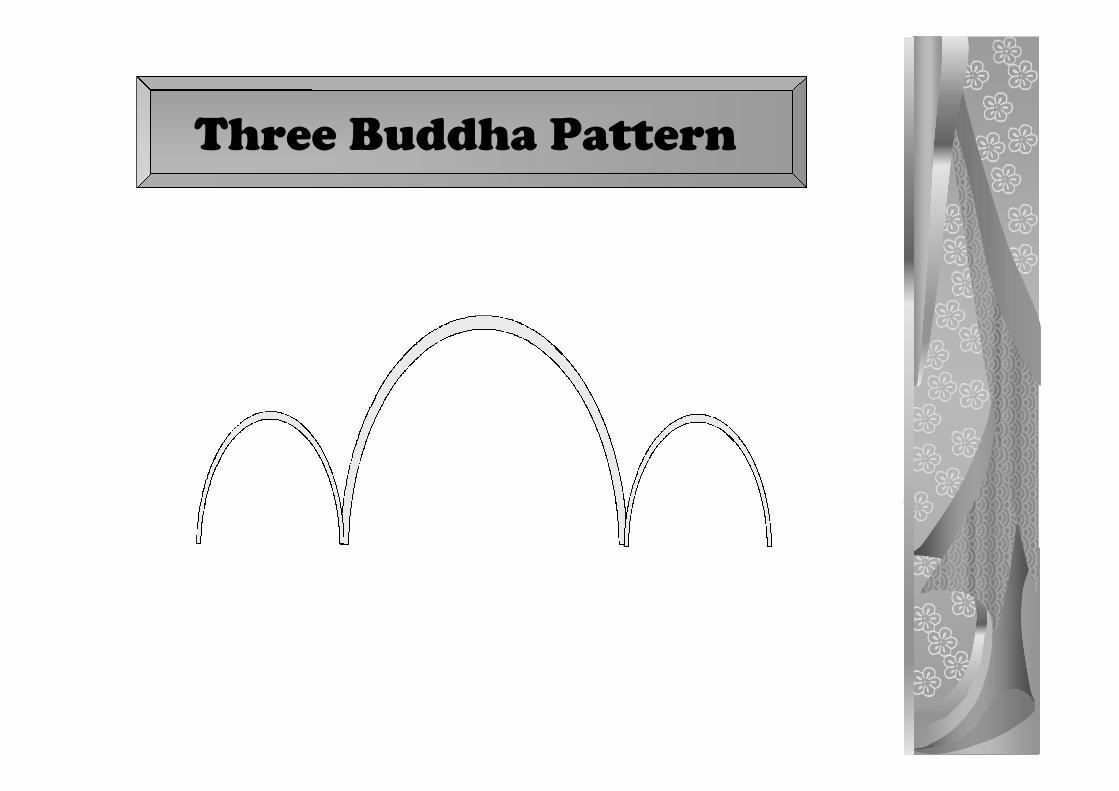
Three Buddha Pattern
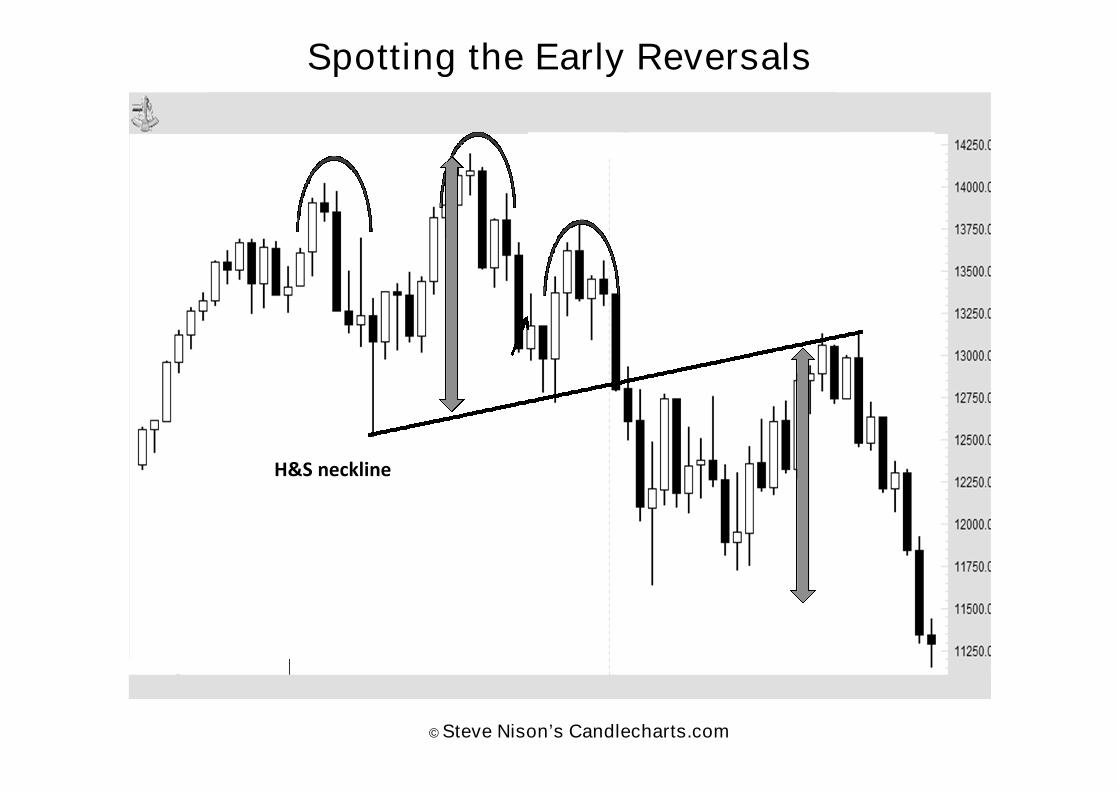
© Steve Nison’s Candlecharts.com
H&S neckline
Spotting the Early Reversals
www.candlecharts.com

West for price Targets
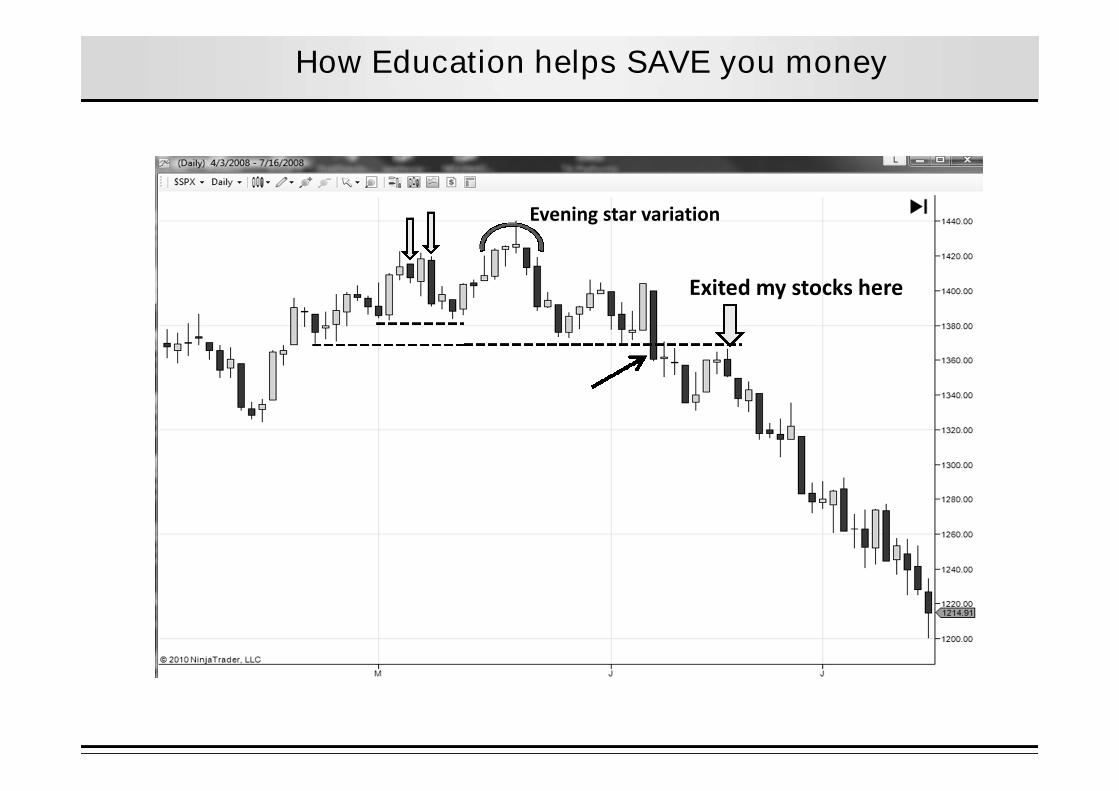
How Education helps SAVE you money
Exited my stocks here
Evening star variation
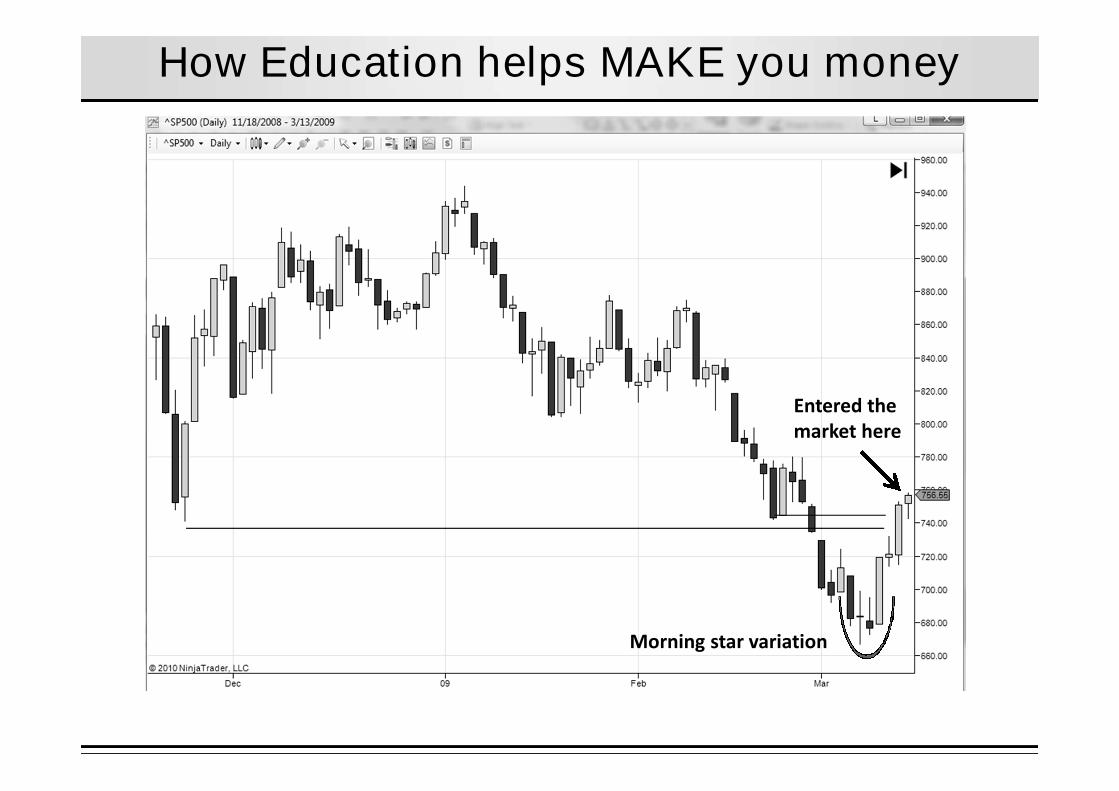
How Education helps MAKE you money
Morning star variation
Entered themarket here
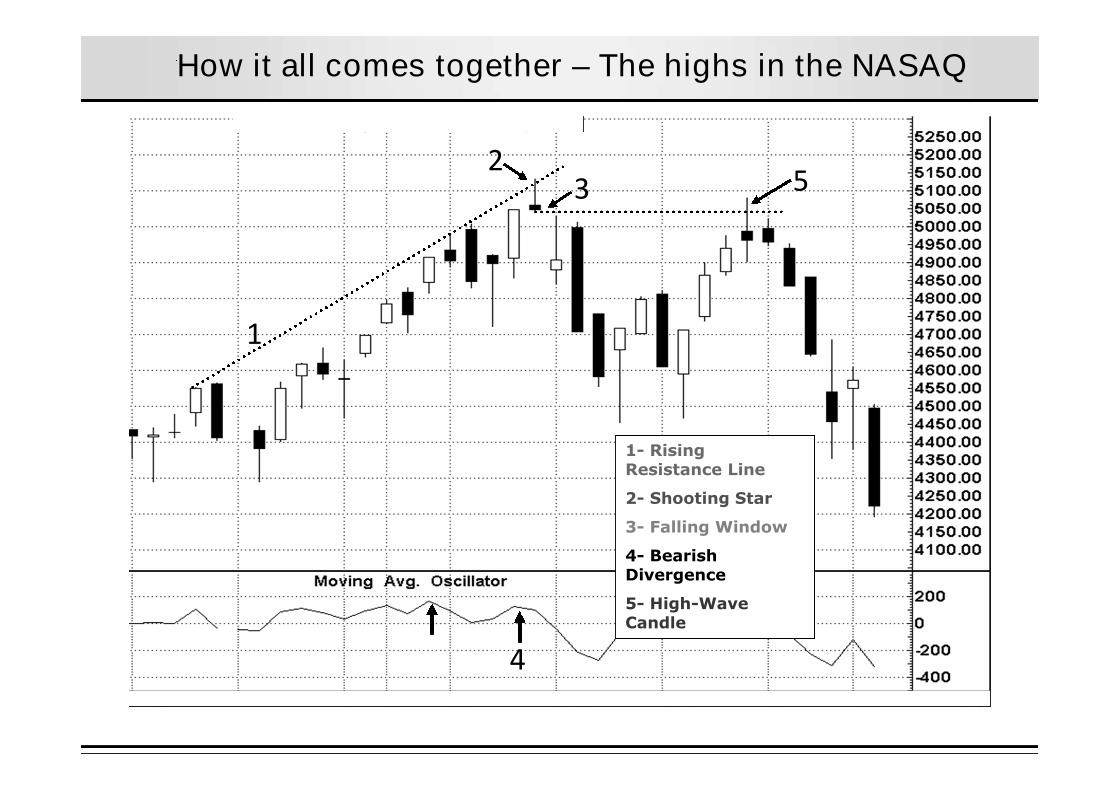
How it all comes together – The highs in the NASAQ
1
5
4
32
1- RisingResistance Line
2- Shooting Star
3- Falling Window
4- BearishDivergence
5- High-WaveCandle
www.candlecharts.com
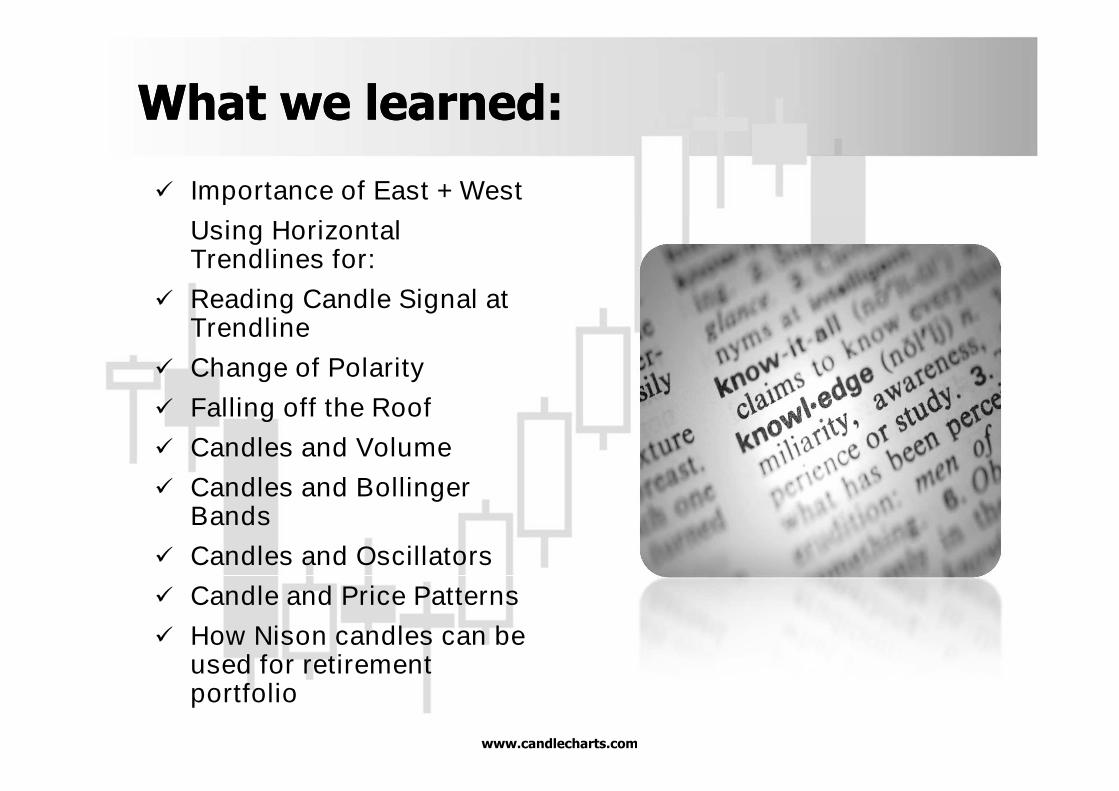
What we learned:What we learned:
Importance of East + West
Using HorizontalTrendlines for:
Reading Candle Signal atTrendline
Change of Polarity
Falling off the Roof
Candles and Volume
Candles and BollingerBands
Candles and Oscillators
Candle and Price Patterns
How Nison candles can beused for retirementportfolio
“Step after step theladder is ascended”
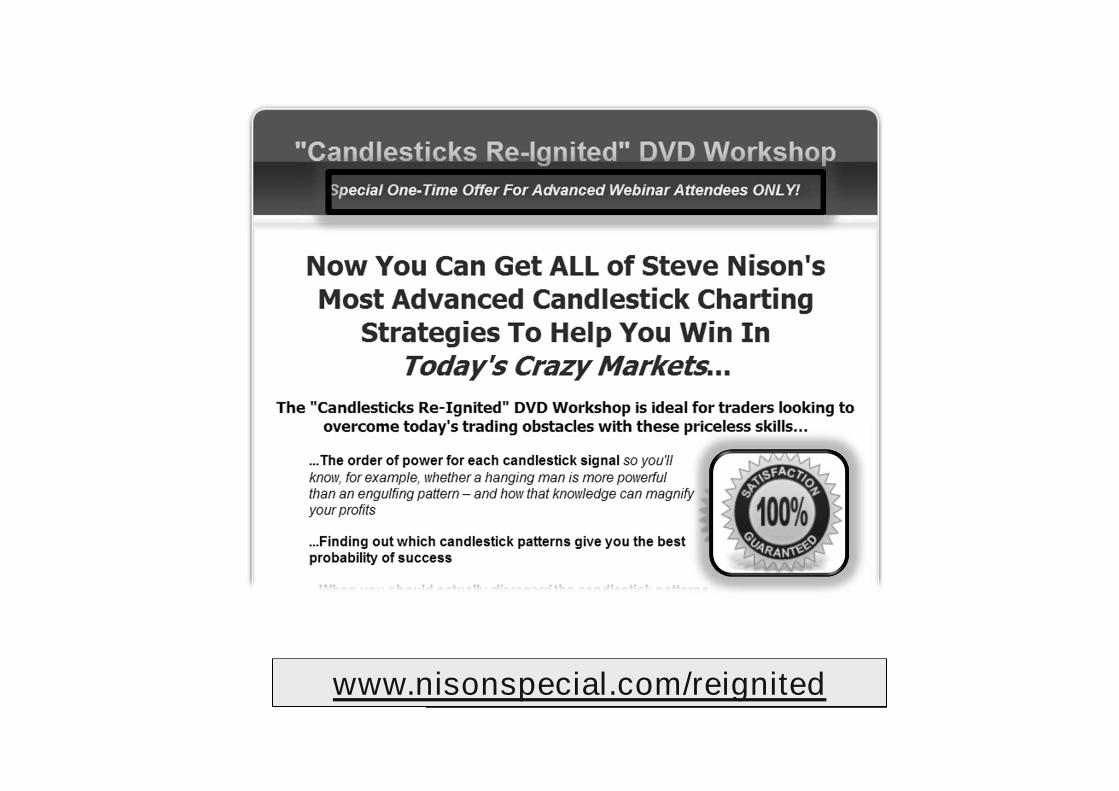
www.nisonspecial.com/reignited
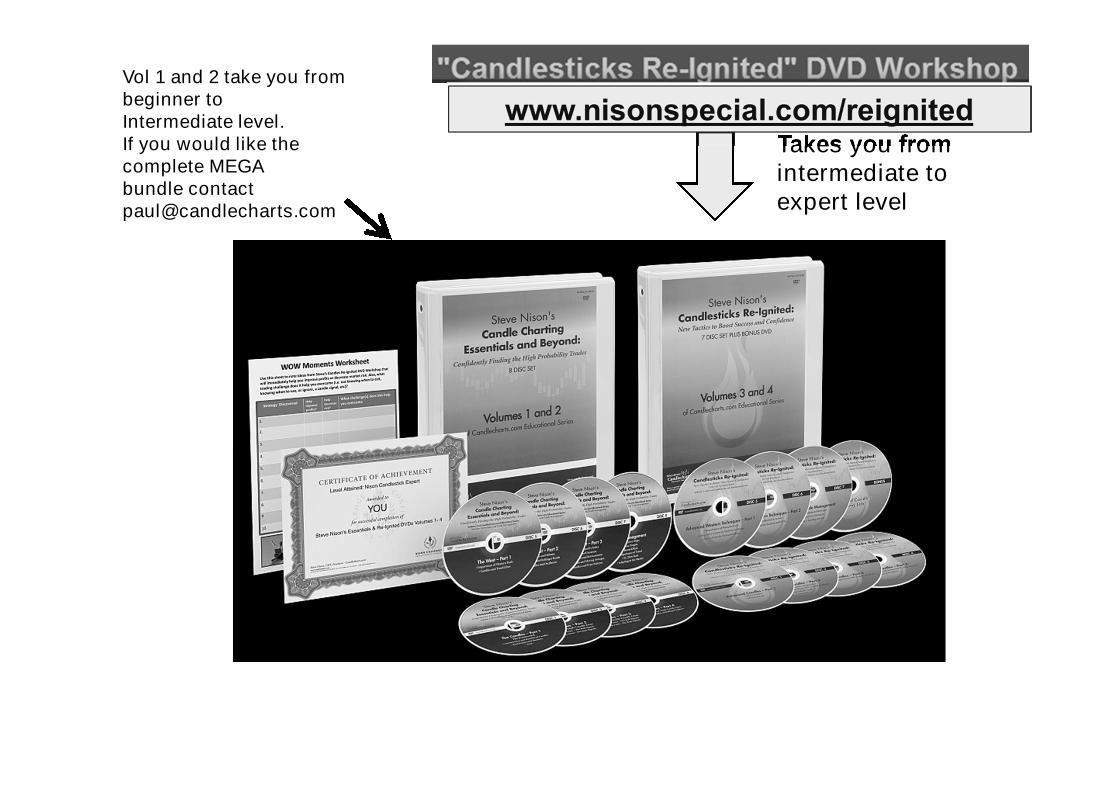
Takes you fromintermediate toexpert level
Vol 1 and 2 take you frombeginner toIntermediate level.If you would like thecomplete MEGAbundle [email protected]