
with research distinction in Alexis Niekamp Project ...
63
A Comparative Spatial Analysis of Neolithic and Copper Age Sites in Southeastern Europe Research Thesis Presented in partial fulfillment of the requirements for graduation with research distinction in Anthropological sciences in the Undergraduate College of The Ohio State University Alexis Niekamp The Ohio State University July 2013 Project Advisor: Professor Richard Yerkes, Department of Anthropology
Transcript of with research distinction in Alexis Niekamp Project ...

A Comparative Spatial Analysis of Neolithic and Copper Age Sites in Southeastern Europe
Research Thesis
Presented in partial fulfillment of the requirements for graduation with research distinction in
Anthropological sciences in the Undergraduate College of The Ohio State University
Alexis Niekamp
The Ohio State University
July 2013
Project Advisor: Professor Richard Yerkes, Department of Anthropology

Abstract: On the Great Hungarian Plain and surrounding region, archaeological research on the
Late Neolithic period has focused mainly on the excavation of tell settlements, while adjacent
flat-lying settlements were either unrecognized or ignored. With the increasing use of geophysics
in archaeological projects, more and more archaeologists are surveying the areas surrounding
tells with the hope that geophysics and spatial analysis can aid them in unraveling the
circumstances that accompanied major settlement reorganization during the Late Neolithic to
Early Copper Age transition. The goal of this study is to examine attributes of settlement
organization, measurable from magnetic survey data, and compare the degree of variation across
six Late Neolithic and Early Copper Age sites from Southeastern Europe. To accomplish this,
maps of the mainly flat-lying settlements generated through either magnetic prospection or
excavation were digitized and analyzed with ArcGIS, and intra-site settlement characteristics
such as house orientation, size, and distribution were determined for six sites in Southeastern
Europe. These analyses indicate that there is a large amount of variation within and between
most sites in the sample. Because of this, no general patterns of settlement organization can be
conclusively delineated. In some cases, even large nucleated Neolithic settlements with tells
surrounded by flat sites were autonomous villages with little social differentiation or ranking,
even though some sites exhibited clear signs of coordination and planning.

Table of Contents: List of Tables and Figures …………………………………………………………………….4 Chapter 1: Introduction………………………………………………………………………...5 Chapter 2: Background………………………………………………………………………...7
European Neolithic Societies………………………………………………………......7 The Tell Phenomenon………………………………………………………….8 Transition to the Early Copper Age……………………………………………………8 Tell and Single-Layer Settlements in Research………………………………………..9 Utilizing Magnetometry………………………………………………………………11 Examining Settlement Organization………………………………………………….11 Chapter 3: Methodology……………………………………………………………………...13 Chapter 4: Intra-site Analysis………………………………………………………………...21 Iclod…………………………………………………………………………………..21
Okolište……………………………………………………………………………….26 Pietrele………………………………………………………………………………..32
Polgár-Csőszhalom…………………………………………………………………...38
Szeghalom-Kovácshalom……………………………………………………………..43
Turdaş-Luncă………………………………………………………………………....48 Chapter 5: Comparative Inter-site Analysis………………………………………………..…53 Chapter 6: Discussion & Conclusions………………………………………………………..57 Acknowledgements…………………………………………………………………………...59 References Cited…………………………………………………………………………......60

List of Tables and Figures: Figure 1. Example of linear magnetic anomaly in magnetogram…………………………………………...……11
Figure 2. Index map displaying the location of sites examined during this project……………………………....14
Figure 3. Visual representation of analyses run on house features at Iclod………………………………………25
Figure 4. Average Nearest Neighbor Summary for Iclod………………………………………………………...26
Figure 5. Image of Okolište location from Google Earth…………………………………………………………27
Figure 6. Visual representation of analyses run on house features at Okolište…………………………………...31
Figure 7. Average Nearest Neighbor Summary for Okolište……………………………………………………..32
Figure 8. Visual representation of analyses run on house features at Pietrele……………………………………37
Figure 9. Average Nearest Neighbor Summary for Pietrele……………………………………………………...38
Figure 10. Visual representation of analyses run on house features at Polgár-Csőszhalom……………………...41
Figure 11. Average Nearest Neighbor Summary for Polgár-Csőszhalom………………………………………..42
Figure 12. Visual representation of analyses run on house features at Szeghalom-Kovácshalom……………….46
Figure 13. Average Nearest Neighbor Summary for Szeghalom-Kovácshalom…………………………………47
Figure 14. Image of Turdaş-Luncă location from Google Maps…………………………………………………49
Figure 15. Visual representation of analyses run on house features at Turdaş-Luncă……………………………51
Figure 16. Average Nearest Neighbor Summary for Turdaş-Luncă……………………………………………...52
Figure 17. Boxplots displaying orientation angle distributions across sites……………………………………...54
Figure 18. Boxplots displaying feature area distributions across sites……………………………………………55
Figure 19. Boxplots displaying thiessen polygon area distributions across sites…………………………………56
Table 1. Statistics for Iclod sample……………………………………………………………………………….24
Table 2. Statistics for Okolište sample……………………………………………………………………………30
Table 3. Statistics for Pietrele sample…………………………………………………………………………….36
Table 4. Statistics for Polgár-Csőszhalom sample………………………………………………………………..42
Table 5. Statistics for Szeghalom-Kovácshalom sample………………………………………………………...47
Table 6. Statistics for Turdaş-Luncă sample……………………………………………………………………...52

Chapter 1: Introduction
The transition from Late Neolithic to Early Copper Age in Southeastern Europe occurred
around 4500 BC (cal.) and is characterized by a major “reorganization of the settlement system”
(Gyucha and Parkinson 2013: 523; Parkinson 2006; Parkinson et al. 2010; Yerkes et al. 2009).
Unlike in most other regions of the Old World where tells1 were occupied continuously for
several millennia during the Neolithic and later cultural periods, the nucleation and firmly
developed cultural boundaries of the Late Neolithic in several areas of Southeastern Europe
resulted in a fissioning of long term, densely occupied settlements into smaller, more dispersed
settlements during the Early Copper Age (Parkinson and Gyucha 2012; Parkinson et al. 2010).
Why did this particular cultural trajectory result in fissioning rather than continued settlement
nucleation, and the development of social-stratification and inequality, as seen in Bronze Age
Hungary or more contemporary periods in other regions, such as in Thessaly? (Parkinson and
Gyucha 2012)
Historically, Neolithic research in Southeastern Europe has focused on the “impressive”
stratigraphy of the tells, with much less research being done on their horizontal-layer
counterparts (Bailey et al. 1998; Draşovean 2009; Horváth 1989; Kalicz and Raczky 1987;
Whittle 1996; Kienlin 2012:259). More recently, there has been a push to understand the nature
of the relationship between these settlement types and suddenly archaeologists who have spent
decades working in tell trenches examining meters and meters of stratigraphy are faced with
determining general trends in settlement layout and organization for immense flat-layer
settlements. It is much more time intensive to discover the same amount of information about a 1 Tells are artificial mounds which emerged in several parts of Eurasia during the mid-Holocene. In Hungary, tells were occupied for several centuries and consist of layers of leveled wattle-and-daub structures, filled-in features and burials (Chapman 1997, 1998; Duffy et al. 2013; Goldberg and Macphail 2006: 225-230; Kalicz and Raczky 1987)

horizontally extensive flat-layer settlement. Methodologies that have been employed which are
useful in examining these types of settlements include systematic survey, soil coring, and
geophysical prospection; some of these methods, such as the geophysical and geochemical
methods are only now gaining in popularity (Kienlin 2012). For a short summary of geophysical
work done on Late Neolithic and Early Copper Age sites in Southeastern Europe, see Sarris and
Monahan (2012).
Magnetic survey has been proven to be successful in accurately detecting subsurface
features on the Great Hungarian Plain, such as long houses, ditches, pits, burials, etc. (Sarris et
al. 2004; Yerkes et al. 2007 ). Although the information gained through magnetic survey has no
temporal component, it is able to provide an unprecedented view of settlement layout and
organization if conducted at a large scale (Sarris et al. 2004). By analyzing data on house
structures derived from magnetic survey, general intra-site organizational trends can be
ascertained and compared in a settlement type that has been explored very little in this region.
Chapter 2: Background
European Neolithic Communities
The Neolithic period in Southeastern Europe began in approximately 6000 B.C.,
calibrated, when farmers migrating from north Greece (and the Near East before that) settled in
the Balkans and the Carpathian Basin. These early agricultural communities relied on animal and
plant species domesticated in the Near East, such as sheep, cattle, peas, barley and einkorn
wheat. The earliest communities were founded in the middle Danube valley and belong to the
Early Neolithic Starčevo and Körös-Criş cultures (Anthony 2010; Parkinson 2006; Parkinson et
al. 2010). From there, settlers moved east along the Danube into Romania and Bulgaria, and
northeast into Transylvania, developing their own “distinct regional cultures… once established”
(Anthony 2010:34). The settlement of Southeastern Europe by farming communities during the
Early Neolithic is considered part of the second wave of agricultural expansion out of the Near
East. A third wave took place in Europe around 5600 B.C., cal. when settlers from Southeastern
Europe migrated into Central Europe, bringing with them agriculture and stockbreeding
(Anthony 2010)
The Middle Neolithic in Southeastern Europe (roughly, 5400-5000 B.C., cal.) witnessed
the origins of the region’s first tell settlements, which are a physical result of settlement
nucleation and permanence that first developed in the Near East. On the Great Hungarian Plain,
this development occurred during the Szakálhát phase (ca. 5200 B.C., cal.). Long houses
constructed of wattle-and-daub were the norm, while evidence for two story houses and
longhouses divided into multiple rooms is noted at various sites. Multiple hearths and multiple
rooms within the houses are interpreted as being utilized by an extended family, rather than a
nuclear family (Kienlin 2012; Parkinson 2002; Parkinson 2006). As Parkinson and Gyucha note,

this was a period of “extreme settlement nucleation” in which settlements became increasingly
larger, more permanent and often fortified, a pattern which carried on until the decline of tell
settlements near the end of the Late Neolithic, ca. 4500 B.C., cal. (Parkinson and Gyucha
2012:106).
The Tell Phenomenon
Tells are often associated with agriculture, sedentism, population aggregation and a sense
of time and continuity; however, significant variety exists in their location, size, continuity,
fortification, function, internal organization, architecture, and placement in relation to other
settlements (Bailey et al. 1998; Duffy et al. 2013). For example, tells in southeastern Europe tend
to be smaller and occupied for shorter periods of time than the tell settlements in the Near East,
northern Africa, and western Asia (Parkinson and Gyucha 2012; Parkinson et al. 2010). A
variety of “social and environmental circumstances” affected the ways that tells developed and
because of this, the definition of a tell has become somewhat fluid depending on whose using it;
terminology commonly used to describe Neolithic settlements in this region ranges from “tell” to
“tell-like” to “flat”, “single-layer”, “horizontal-layer”, or “single occupation” (Parkinson and
Gyucha 2012: 105, Kienlin 2012:260).
Transition to the Early Copper Age
As mentioned above, tell settlements were abandoned at the end of the Late Neolithic
period and only some were reoccupied a few thousand years later during the Bronze Age
(Parkinson and Gyucha 2012; Parkinson et al. 2010). The settlement pattern adopted during the
Early Copper Age (4500-4000 B.C., cal.), the period after the Late Neolithic, was characterized
by smaller more dispersed settlements which were relocated more frequently. Compared to the
62 Late Neolithic sites found on the Great Hungarian Plain, 394 significantly smaller sites were

present in the Early Copper Age (Gyucha and Parkinson 2013; Parkinson et al. 2010). Along
with the settlement dispersion that occurred on the Great Hungarian Plain, the very actively
maintained cultural boundaries of the Late Neolithic, the Tisza, Herpaly, and Csőszhalom
groups, gave way to a more wide-spread homogenous culture, the Tiszapolgár culture (Gyucha
and Parkinson 2013:524). Recent work done by the Körös Regional Archaeological Project at
the Early Copper Age sites, Vésztő-Bikeri and Körösladány-Bikeri, indicates there may have
been more continuity in other aspects of settlement organization, such as house construction,
fortification systems and site location, than previously thought (Gyucha and Parkinson 2012;
Yerkes et al. 2009).
Tells and Single-Layer Settlements in Research
Much Neolithic research in southeastern Europe has been spent studying tells and trying
to explain their variation, their function and their implications for social and religious behavior.
Research on tell settlements has important implications for the emergence of inequality because
of their concurrence with sedentism and population aggregation. In the Near East and parts of
Greece, tell settlements were much less volatile and rather than undergoing a period of
dispersion, these settlements continued to be centers of nucleation while social stratification and
inequality increased over time (Parkinson and Gyucha 2012). According to Dr. Tobias Kienlin,
there is a distinct difference in how tells of Southeastern Europe’s Neolithic are viewed versus
the tells of Southeastern Europe’s Bronze Age (2012). The farming communities described
above are considered tribal because there is little evidence in the archaeological record of
institutionalized social inequality (Duffy et al. 2013). The tells of the Neolithic are interpreted as
places where people “negotiated social relations or developed a sense of community and
identity” (Kienlin 2012:54). In Bronze Age research, tells are interpreted as “(proto-) urban

settlements… home, supposedly, to some kind of functionally and politically differentiated
population…” (Kienlin 2012:254).
Oftentimes tells in both periods occur as part of a larger settlement complex, of which a
flat or single-layer settlement is also a part, but tells and flat sites can appear isolated as well
(Kalicz and Raczky 1987; Horvath 1989). Single-layer settlements are different from tell
settlements in that they expand horizontally in space rather than vertically; the same level of
settlement continuity in tells is not common for “flat” settlements where households moved to
new locations when older houses were abandoned (Gyucha et al. 2009; Parkinson et al. 2010).
Only recently has research expanded to incorporate the organization and development of single-
layer settlements, which requires a distinctly different methodological approach than the research
of tells (Kienlin 2012; Parkinson et al. 2010). Since Neolithic flat settlements extend a much
great horizontal distance than tells, ascertaining general organizational trends through excavation
for an extensive single-layer settlement is much more time consuming.
Systematic survey has been employed in the past, such as the county-by-county survey
employed by the Archaeological Topography of Hungary program (Visy 2003); however the use
of geophysical prospection to aid in locating, delineating, and examining single-layer settlements
is a relatively recent development (Kienlin 2012; Sarris et al. 2002; Sherrat 1982; Visy 2003).
Unfortunately, without excavation, chronological information and details of structure function
and organization, are incomplete or lacking, and geophysical anomalies must be investigated to
learn how tells relate to nearby flat settlements.

Figure1 .Example of linear magnetic anomaly in magnetogram. Green lines are diagrammatic interpretations. Adapted from Sarris and Popadopoulos Technical Report for Szeghalom Kovacshalom 2010, figure 4.22.
Utilizing Magnetometry Geophysical prospection uses active or passive remote-
sensing devices to measure physical properties of the soil and
generate high resolution imagery that describes features below the
surface (Sarris 2008). Magnetometry, specifically, deals with
detecting anomalies, or “subsurface targets with magnetic
properties different from those of the surrounding soil matrix”, of
the earth’s geomagnetic field (Sarris et al. 2004). This type of
prospection has been successful in detecting subsurface remains
of longhouses, ditches, enclosures, pits, burials and other types of
features in a manner that is non-destructive and in a relatively
small amount of time (Sarris et al. 2004). When Neolithic house
structures are burned, a layer of daub rubble with magnetic
properties that contrast with the surrounding soil is created,
allowing the house to be detected as a series of linear
magnetic anomalies (Figure 1).
Examining Settlement Organization
The relatively high incidence of house burning during the Neolithic and Early Copper
Age allows for the anomalies detected through magnetic survey to compose a sample large
enough that it can be examined to draw inferences on intra-site settlement organization such as,
amount of variation and ultimately, degree of planning. This statement is based on the underlying
assumption that the organization of settlements will tell us something about the human processes

that shaped them, such as social relations, communal identity, religious ideology, or central
authority (Flannery 2002a; Parkinson et al. 2010).
In research done on ancient cities, much theorizing has been done on the structural,
organizational and architectural indications of city planning. City planning is one such human
behavior that shapes our physical environment; it is a self-conscious, deliberate manifestation of
an individual or group’s view of how the world should look, mainly associated with cultures that
have some degree of central authority (Smith 2007). In Dr. Michael Smith’s approach to
analyzing urban planning, planning is something that occurs on a spectrum and is measured by
two components: 1) the degree of “coordination among the buildings and spaces in a city” and 2)
“standardization among cities” (2007:7).
In theory, this type of analysis should have little use for autonomous villages and tribal,
Neolithic communities (Flannery 2002b); however the Late Neolithic period witnessed
increasing nucleation and population aggregation up until a certain point when a transition
occurred to smaller, more dispersed, and more nuclear households in the Early Copper Age
(Gyucha et al. 2009; Parkinson et al. 2010; Visy 2003). Archaeologists studying Late Neolithic
sites have noted great variation in settlement structure at some sites and very little variation in
house size, placement, and orientation at others. This holds true for both tell and single-layer
sites that have been examined. It is possible that a very low degree of variation in settlement
feature size, or a coordination among structure placement is due to some early forms of city
planning, or also that there are other variables influencing settlement organization, such as
amount of available space, wind direction, topography, ritual belief, or expression of a shared
identity.

Chapter 3: Methodology The goal of this study stems from research being done at the Late Neolithic site complex
of Szeghalom-Kovácshalom by the Körös Regional Archaeological Project; extensive
geophysical prospection, excavation, and systematic surface collection of the settlement
complex, over the last four years has identified an extremely large settlement complex housing a
wide range of variation in terms of house size, orientation, and distribution (Duffy et al. 2013;
Parkinson and Gyucha 2012). The variety in settlement organization seen at the Szeghalom-
Kovácshalom complex is, theoretically, what one would expect for an autonomous, tribal
community (Flannery 1972, 2002b). The goal of this study, then, is to examine these attributes at
other sites in Southeastern Europe, of roughly the same time period, to help determine whether
this high degree of variation and its behavioral implications occur elsewhere. To investigate
these attributes, a set of ArcGIS tools were run on the samples of house features, digitized from
anomalies detected during magnetic survey, to generate a database with information pertaining to
house size, orientation, and distribution.
Almost all the site plans used have been generated through interpretation of large scale
magnetic surveys; some of these sites are extremely large and the detailed type of information
and chronologies provided through excavation can only feasibly cover a small portion of the site.
This study is somewhat exploratory in that there is almost no precedent for using site plans
derived from large scale magnetic survey to examine trends across space within sites and
between sites, and magnetic survey comes with its own unique set of limitations. Ideally, all of
the sites examined in this study would be Late Neolithic to Early Copper Age sites from the
Great Hungarian Plain, so as to limit the effect that different cultural trajectories might have on
settlement organization; however, the use of geophysical prospection for this type of research is

relatively recent, and too few researchers have incorporated it at a scale large enough for the
study to be based solely on sites from the Great Hungarian Plain. Because of this, the study area
has been expanded to include sites in Romania and central Bosnia and each site is associated
with a different culture (Figure 2).
Geographic Information Systems (GIS) has become an invaluable tool in archaeology;
through its different components, it offers archaeologists a way to manage, visualize, edit, and
analyze their data. Data generated through geophysical prospection especially lends itself to
management through GIS because it is, inherently, spatial data. Magnetic survey has been
utilized at all the sites in the study sample to varying degrees: Iclod, Turdaş-Luncă, Okolište,
Pietrele, Polgár-Csőszhalom and Szeghalom-Kovácshalom.
Figure 2. Index map displaying the location of sites examined during this project. 1)Iclod 2)Pietrele 3) Polgár-Csőszhalom 4)Okolište 5)Szeghalom-Kovácshalom 6)Turdaş-Luncă

After collecting the magnetograms, magnetogram interpretations, and in one case an
excavation site plan, for these sites, the raster images were imported into ArcMap version 10.1.
The site plans or magnetograms for all but one site, Szeghalom-Kovácshalom, had its extent
defined relative to distance between features using the grid system in meters provided by the
archaeologists publishing the material. These rasters were then projected in the appropriate UTM
zone so that the information they contained could be viewed in meter units, digitized and
analyzed. Information used for Szeghalom-Kovácshalom was obtained in GIS files from the
Körös Regional Archaeological Project which contained the appropriate spatial reference
information.
In most cases, I used author provided interpretations of the magnetic survey, in which the
authors drew polygons around what they identified as house features, to digitize the house
features. In some cases I only had access to interpretation plans, and in some other cases, only
uninterpreted magnetograms. For those sites, I consulted with geophysicist Dr. Apostolos Sarris
and used my own knowledge gained through working with Dr. Sarris (in Hungary and Crete
during field work in 2012 and 2013) to interpret and digitize clearly delineated house features
from the magnetogram. For one site, there were houses that were not located fully within the
survey area and were not included in the sample so as not to skew the dataset.
Once the sample of house features had been digitized into its own polygon shapefile, I
began to generate data and run analyses that could be used to describe the internal organization
of each site and compare settlement organization between sites. The analyses run were somewhat
exploratory and selected based on the different types of information that could be derived solely
from magnetic survey, because in some cases, very little supplementary information was
available. The different analyses conducted include: 1) calculating feature area, 2) determining

feature orientation by finding the dominant angle of the polygon, 3) running a hot spot analysis
to determine whether significant clusters of features are present based on house size 4)
determining whether house distribution exhibits clustering, dispersion, or a random layout, 5)
generating a voronoi diagram to approximate an “area of control” or amount of space surround
each house.
Feature orientation is an attribute of settlement organization that archaeologists have
noted to be extremely regular at some sites and more variable at others. There has been little or
no research done on the causes of very regular feature orientation within and across sites in
Neolithic Southeastern Europe. According to concepts used in examining city planning, a low
degree of variation in feature orientation may suggest a certain degree of coordinated
arrangement, that buildings were “constructed with reference to one another”; it may also be due
to geographical factors, “such as topography or location with respect to a river or shoreline”
(Smith 2007:8). Features that are oriented with respect to large man-made features are
considered more likely candidates for planned coordination, but with a lack of any other
indicators of centralized authority, it is most likely a physical example of a shared communal
identity (Smith 2007). To determine the angle of feature orientation for all features at a site, the
Calculate Polygon Main Angle tool from the Cartography tool set in ArcMap was used, which
calculates the dominant angle of the feature using graphic rotation method in this instance.
Graphic is the default rotation method for ArcMap10.1 and it calculates the angle of orientation
in decimal degrees from true North, with North being zero and rotation moving
counterclockwise.
The size of house features, as expressed in area in square meters, is another feature
attribute that has been noted to be very regular at some sites and highly varied at others.

Clustering of houses with like sizes within a settlement may indicate neighborhood-like social
clustering within the community that may be related to kinship groups (Link 2006). House size
can also be an important indicator of the types of families that live within them when viewed in
conjunction with information about the internal features of the homes. Larger homes with
multiple hearths are associated with extended families while small homes with a single hearth are
often associated with nuclear households (Kienlin 2012; Parkinson 2002; Parkinson 2006).
Smaller house size may also be related to more realistic spatial constraints, if the settlement is
located in a more restricted area, such as within fortifications or on a river terrace. Large houses
that are outside the normal range of variation may be interpreted in conjunction with other lines
of evidence as large communal buildings or early evidence of individuals asserting rank. To
calculate areas for the house polygons in square meters, the Calculate Areas tool from the Spatial
Statistics toolbox was used. Because of the ability of magnetometry to very accurately delineate
long house features, it can be assumed that feature area is fairly precise, granted the signal of the
anomaly itself is not hard to define.
In order to determine whether significant clusters of large house sizes or small house
sizes were present within the settlement, a Hot Spot analysis was run using the Getis-Ord Gi*
statistic, a tool located in the Spatial Statistics toolbox. This tool utilizes a weighted set of data,
in this case, house area in square meters, to detect geographic clusters of high values and low
values within a dataset. The Getis-Ord Gi* statistic is a distance-based measure of spatial
association which examines each feature within the context of a neighborhood of features; the
feature is assigned a statistically significant z-score result when values for the feature and its
neighborhood deviate enough from the values that would be expected if the values were a result
of random chance. The information provided may be useful in determining whether social units

are present at the neighborhood level, or whether high or low house sizes tend to be located
relative to topography or settlement architecture, which could indicate a low degree of planning,
functional benefit, or a shared communal identity. Use of this tool is most reliable with a
sufficient sized sample, 30 features, however, not all sites in the study meet this criteria, so
caution must be exercised in these cases.
The next analysis, run using the Average Nearest Neighbor tool from the Spatial
Statistics tool box, produces a nearest neighbor index which indicates whether the sample
exhibits a clustered, random, or dispersed distribution. Similar to the hot spot analysis tool, the
average nearest neighbor tool can identify whether clusters exist within the settlement, in this
case determined only by spatial proximity. The Average Nearest Neighbor Statistic uses the null
hypothesis that states the features are randomly distributed. The z-score and p-values generated
with this tool are measures of statistical significance which indicate whether or not to reject the
null hypothesis. The nearest neighbor index is expressed as the ratio of the Observed Mean
Distance to the Expected Mean Distance; if the index value is less than one, the sample exhibits
clustering. If the index value is greater than 1, the sample exhibits dispersion. The study area
used for each is the minimum enclosing rectangle around the house features. In the case of some
sites, like Szeghalom-Kovácshalom, the survey boundaries are complex and the study area used
for the average nearest neighbor statistic may not correspond well. Results in these cases should
be interpreted with caution.
The voronoi diagram part of the analysis is more exploratory than the first three and
potentially more problematic. A voronoi diagram, also called a voronoi tessellation or thiessen
polygons, is created using a series of points and consists of polygons, whose edges are exactly
half the distance to the nearest feature in which all space within the polygon is closer to the

polygon’s associated point than any other point (Kvamme 1999). Voronoi diagrams have been
used in the past in site catchment analyses, or to theoretically divide an area into zones of control
to model social boundaries at an inter-site scale, using spatial weight matrices.
For this study, thiessen polygons are used to provide an indication of spacing between
houses. Each feature has an associated open area surrounding it, whose area is calculated and
used in examining the overall distribution. The problematic aspect of this analysis is in the lack
of temporal data associated with the features; ideally, all houses would be contemporary, or at
least houses would be divided into separate shapefiles based on contemporary occupation.
Unfortunately, this information is just not available. In this sense the use of this analysis is
somewhat exploratory and its accuracy is dependent on the degree to which the houses are
contemporary.
This study used the Create Thiessen Polygons tool from the Analysis toolbox. The tool
requires a point shapefile for input so a point shapefile was generated by finding the centroid of
each house polygon through the use of the Feature to Point tool which is part of the Data
Management toolbox. Because the magnetic survey boundaries sometimes extend beyond what
could reasonably be considered part of the settlement neighborhood, buffers were created around
each individual feature and dissolved into one large buffer zone. The radius of the buffer zone
depends upon the site and set as the Expected Mean Distance derived from the Average Nearest
Neighbor calculates. This helps eliminate skew in the data, however, it also imposes a limit to
the polygons which may not have any realistic value; by defining this buffer using the Expected
Mean Distance value, then at least the effect of the imposed restrictions for each site are
consistent.

All of the data generated through these analyses were exported and manually imported
into IBM’s SPSS Statistics software, version 20. Using SPSS, descriptive statistics were
compiled for each feature attribute of each site, while histograms and boxplots were created to
examine intra- and inter-site trends for each variable. All images included in this paper that
pertain to the GIS analyses run for the project were created using ArcGIS 10.1. In the case of the
feature area and thiessen polygon area images for each site, the natural break classification
scheme with 5 classes was utilized. The default classification for the hotspot analysis tool was
used in the hotspot analysis images.

Chapter 4: Intra-site Analysis
Iclod
Iclod is a Late Neolithic site of the Zau culture which is located on a low terrace near the
Someşul Mic river in Cluj county, Transylvania (see Figure 2). The Zau culture spanned from
the Early Neolithic to the beginning of the Early Copper Age and was present throughout most of
Transylvania (Colesniuc 2008).The Zau culture is divided into four phases: Zau I (5300-5200
B.C., cal.), Zau II (5200-5100 B.C., cal.), Zau III (5100-4900 B.C. cal.), Zau IV (4800-4700 B.C.
cal.) (Merlini 2009). Iclod was occupied by groups of the Iclod phase, which is part of the late
Zau culture, and later on the newer Petreşti culture. The site is located just outside of the modern
day village Iclod, with hills to the north of it and the river to the south. There is modern
settlement very near to and possibly overlapping the site in the southwest and northeast, as well
as a modern railroad and roadway running through the site. Iclod is broken up into four zones:
Iclod A, Iclod B, Iclod C and Iclod D. Iclod B is considered the site center while Iclod C is just
to the south and is comprised of a graveyard stretching from the settlement to river. Excavations
have been going on since the 1970’s but have focused mainly on the graveyard and site center;
however a German team led by Carsten Mischka explored other areas of the site in 2008 and
2011 with magnetic survey and test excavations (Mischka 2012). The geophysical prospection
has surveyed nearly the entire site which covers more than 11 hectares (Mischka 2012).
The site includes a three-part ditch system surrounding the inner part of the site; the outer
two ditches are linked in the south, forming what Mischka interprets to be a gate construction
(2012). The ditches range in diameter from 140-240 meter, enclosing between 1.7 and 4.7
hectares (Mischka 2012). It is possible another system of smaller ringed ditches occur
surrounding the entire Neolithic settlement, with traces found in the north, however the

magnetogram is not definitive and further excavation is required (Mischka 2012). Using a
diagrammatic interpretation of the magnetogram published by Mischka in 2012, 37 house
features were digitized for this project. House features overlap with the ditch system in the west
and the possible most outer ditch system in the north, indicating that not all of these features are
contemporary. Not much is known about the chronology of the site, but it is likely that the most
inner ditch is one of the oldest features as it was already refilled during Iclod I (Mischka 2012).
Excavations in the past have discovered sections of the next outermost ditch system to be over 2
meters deep (Mischka 2012). According to Mischka, the inner houses likely date to Iclod I but
the outer ditch system, possible palisades and house structures in north and west cannot be dated
conclusively (2012).
Two test excavations were done in 2010 in the southeast, the area containing rows of
rectangular anomalies, to verify the existence of house structures interpreted from the
magnetogram (Mischka 2012). The team found by excavating “House 1” that the anomaly very
accurately represented a house and that the house was associated with artifacts dating to the Iclod
II phase (Mischka 2012). Unexpectedly, a burial was discovered 20 cm below the daub layer
and was found with a “pre-Cucuteni style import to the Iclod I-phase”(Mischka 2012:157).
Mischka postulates that due to similar size and orientation, the magnetic anomalies surrounding
House I are Iclod II phase houses as well (2012).
The orientation angles of this sample of features range from -85.24 to -12.62 in a bimodal
distribution. Negative 12 to -30 degrees is observed in house structures in the western portion of
the site, in which the houses lay perpendicular and to the outside of the two-part ditch system
that forms a gate construction in the south. Houses located in the southwest portion of the site
have orientation angle values between -40 and -50 degrees and lie parallel with the inner ditch

structure. In the eastern section of the survey area, angle values range from -60 to -80 and also lie
parallel with the inner ditch system. Here, the houses appear in two small rows perpendicular to
the ditch. The two westernmost houses of these rows, which likely date to the Iclod II phase and
have a high likelihood of being contemporary to the two part ditch system, are located directly
adjacent to it. In the north, where the houses again lay perpendicular with respect to the ditch
system, the angle values range from -80 to -86. Both house structures in the north and east fall in
the range of the first mode in the distribution, while the second mode covers all the rest. It is
difficult to make interpretations about the houses that overlap with the two different ditch
systems, however they do exhibit continuity in orientation with houses in the west, which
indicates continuity in perceptions about how houses should be oriented over time. Interestingly,
the range between -60 and -50 degrees is not represented and there were no houses detected in
the southern portion of the survey. This is concurrent with what might be expected of the
settlement organization for two reasons; there is an entrance to the gate system in the southern
portion of the survey and a graveyard lying to the south of that. Both the graveyard and entrance
are located closest to the river. Overall, the range of orientation angle values all fall within
WNW to ESE, NW to SE, or NNW to SSE orientation.
The feature areas of the 37 included houses range from 27.44 and 164.76 square meters.
The distribution is not significantly skewed and includes no outliers. The mean area for this
sample is 83.43 meters squared. According to the hot spot analysis conducted, there is a cluster
of smaller house sizes in the north and significantly larger house areas in the east. Both of these
groupings are located outside of the inner ditch system. The Average Nearest Neighbor analysis
concluded the sample of houses exhibited a clustering pattern that has a less than one percent
likelihood of being due to random chance. This seems especially evident in the west; this

clustering may be the result of changing locations of occupation over time; however the way the
houses outside of the ditch system appear to have coordinated orientation, makes it seem likely
that they are contemporary. In this case, any clustering outside of the ditch system may be due to
organization based on kinship groups within the settlement (see Figures 3 and 4).
For generation of the voronoi diagram, a buffer was created using the Expected Mean
Distance for the sample, 22.7 meters, calculated during the Average Nearest Neighbor analysis.
This buffer and the survey boundary were then used to clip the diagram. The area of the resulting
thiessen polygons ranges from 136.24 to 1,507.82 square meters. The sample has a mean of
746.43 square meters, a standard deviation of 327.28 square meters and a distribution that is
skewed to the right (Table 1). When examining the thiessen polygon area distribution in image
D, it becomes apparent that the largest thiessen polygons are located on the edges of c lusters, or
rows, next to empty spaces in the survey area. These empty spaces mark a distinct separation
between the houses that are oriented parallel to the ditch and houses that are oriented
perpendicular to the ditch.
Table 1. Statistics for Iclod sample.

Figure3. Visual representation of analyses run on house features at Iclod. A.) Digitized features B.) Houses classified by area. C.) Hotspot analysis according to house area. D.) Thiessen polygons classified by area with houses outlined inside. Use scale on bottom right for images B, C, D.

Figure 4. Average Nearest Neighbor Summary for Iclod.
Okolište
Okolište is a Late Neolithic site located in the northern part of the Visoko basin in Central
Bosnia (Figure 2) and is possibly the central settlement of a network of settlements in the Visoko
Basin (Hofmann et al. 2008). Okolište is located between the modern villages Okolište and
Radinovići to the north and South, and the Bosna river to the east and north (Figure 5).

Mountains are located farther north of the settlement which circle the Visoko Basin and have
elevations of up to 1,000 meters in some places. Okolište is located on a river terrace adjacent to
the Bosna river and measures approximately 7.5 ha, much larger than all other Visoko basin
settlements (Hofmann et al. 2008).
Figure 5. Image of site location from Google Earth.
Beginning in 2002, a Bosnian-German research team has been studying the settlement; as
of 2007, “nine survey and excavation campaigns” had taken place (Hofmann et al. 2008).
Magnetic survey was carried out by Tim Schüler in 2003. The survey detected a complex system
of overlapping ditches as well as several long house features within the ditch system. The ditch
system begins as one strand in the east, nearest the Bosna river, and gradually separates into
three strands in the north, and then into five or six strands in the northwest and west. Hofmann

and his team believe that at least two of these strands in the north were contemporary and
according to excavation, were 3.5 and 4.5 meters wide, and 1.3 m deep. Ramparts and a palisade
were also discovered (Hofmann et al. 2008).
Okolište is thought to be occupied from approximately 5200 to 4500 BC and to have
begun declining fairly early on (Hofmann et al. 2008). According to the radiocarbon dating and
stratigraphy the outer strands are the oldest fortifications, built between 5200 and 5100 BC and
filled and renewed multiple times, gradually moving inward in the west until about 4900 BC
(Hofmann et al. 2008). Beginning around 4900 BC, the ditches ceased being renewed, which is
long before the site’s end around 4500 BC (Hofmann et al. 2008). The process of decline visible
at Okolište is found throughout the Visoko Basin, as the number of settlements during the
transition from the late Kakanj period to early Butmir period (Butmir I, Middle Neolithic, 5300-
5100 B.C. cal.) suggest nucleation and then at the end of the Butmir period, long inhabited sites
were abandoned and new smaller settlements founded, similar to the transition undergone on the
Great Hungarian Plain (Hofmann et al. 2008; Merlini 2009).
Stratigraphy of the site core has proven through excavation to be complex and house
features discovered by the magnetic survey are from various phases as well as interspersed with
unburnt houses not detected by the magnetometer (Hofmann et al. 2008). Three of the
magnetogram’s linear anomalies were excavated and found to be house structures from the
classical Butmir period (5100-5000 B.C. cal.) (Hofmann et al. 2008; Merlini 2009). Hofmann
and his team also discovered several more unburnt houses “beside and underneath” these three
which formed rows of parallel houses (Hofmann et al. 2008). From this evidence, Hofmann
expects that the area was inhabited for at least two generations and that the density of houses is
greater than that shown on the magnetogram (2008). Also during excavation, it was discovered

that one of the Classic Butmir houses in area 3 was likely divided into three rooms and similar
patterns were found in the northeast of the site, although the structures date to Butmir III
(Hofmann et al. 2008).
Twenty-eight house features were detected by the magnetic survey as well as the ditch
systems described above. The magnetogram was published in several different articles by
Hofmann and was used to interpret and digitize the 28 features. All houses are located within or
just barely overlapping the innermost ditch system and all are generally oriented from the
northeast to the Southwest. There are more features in the northern and eastern portion of the
site, the same general direction the houses orient towards. In that direction, the Bosna curves
towards the north of the site, and there is a nearby incline of elevation by about 250 to 300
meters, which is the nearest of the surrounding hills.
The angle of orientation for features ranges between 31.83 and 73.81 degrees with a
mean of 52.76 degrees and standard deviation of 12.48 degrees. As mentioned above, this
corresponds with a general northeast to southwest orientation that points toward the curve of the
river from the site’s east to the site’s north and a rise of hills just beyond that. The size of houses
ranges from 32.01 to 101.39 square meters. The sample has a mean area of 64.13 square meters,
which according to the distribution appears to be a fairly good indicator of centrality, and a
standard deviation of 16.14 square meters. According to the hotspot analysis, a cluster of smaller
houses appears in the southwest, the same houses excavated in Area 3 which date to the classic
Butmir period. Also, two of the more dispersed structures in the east are considered a significant
clustering of higher values. This does not seem to correspond with anything locationally
significant and may be due to difference in occupation period.

The Average Nearest Neighbor analysis indicates that sample of houses exhibits a
dispersed pattern which has a less than 5% likelihood of being due to random chance and an
observed mean distance of 13.55 meters. It must be kept in mind when interpreting this analysis
that excavation done in certain areas discovered several houses undetected by the magnetic
survey which increases feature density and alters the distribution. Theoretically, a more random
or dispersed distribution makes more sense than evidence of kinship based clusters because the
settlement is smaller, completely located within the ditch system, and shrinking over time.* The
voronoi diagram was created using a buffer of 11.33 meters, the Expected Mean Distance
derived from the Average Nearest Neighbor analysis, which was also clipped with the survey
boundaries. The thiessen polygons ranged in size from 195.42 to 983.89 square meters. The
mean polygon area is 486.38 square meters and standard deviation is 174.57 square meters. The
two thiessen polygons with the largest area, or most space surrounding them, are located at what
appears to be the center of the ditch systems (see Figures 6 and 7 and Table 2).
Table 2. Statistics for Okolište sample.

Figure 6. Visual representation of analyses run on house features at Okolište. A.) Digitized features B.) Houses
classified by area. C.) Hotspot analysis according to house area. D.) Thiessen polygons classified by area with houses outlined inside. Use scale on bottom right for images B, C, D.
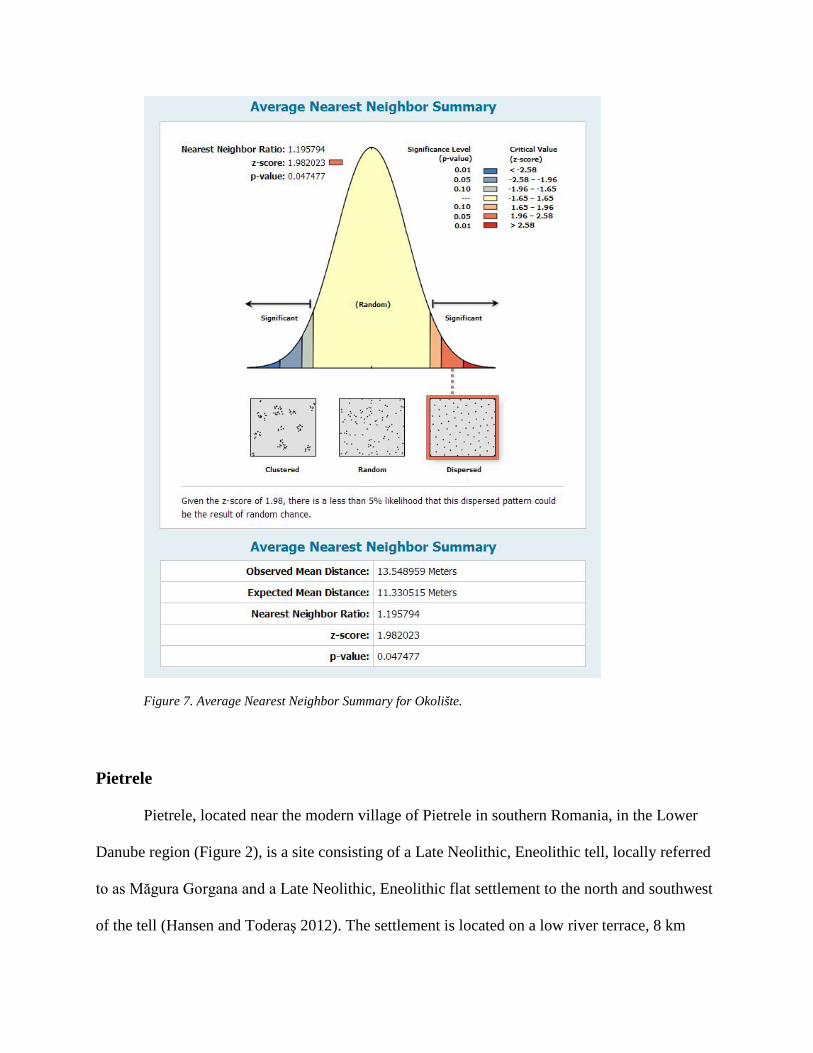
Figure 7. Average Nearest Neighbor Summary for Okolište.
Pietrele
Pietrele, located near the modern village of Pietrele in southern Romania, in the Lower
Danube region (Figure 2), is a site consisting of a Late Neolithic, Eneolithic tell, locally referred
to as Măgura Gorgana and a Late Neolithic, Eneolithic flat settlement to the north and southwest
of the tell (Hansen and Toderaş 2012). The settlement is located on a low river terrace, 8 km

from the Danube in an area that was previously meadow (Hansen and Toderaş 2012). Since
prehistoric times, this area has changed dramatically with the meadow area gaining
approximately 6 meters in elevation (Hansen and Toderaş 2012)
Pietrele belongs to the south Romanian Gumelniţa culture (Early/Middle Copper Age,
4500-4150 B.C. cal.), however, whether large adjacent flat settlements appear at other Gumelniţa
settlements is unknown (Hansen and Toderaş 2012; Merlini 2009). Dates for the beginning of the
Pietrele settlement have not yet bet determined, however, Hansen and Toderaş suspect the tell’s
beginning dates to around 4600 BC, when most other tells in Southeastern Europe were already
abandoned, and the oldest of the flat settlement to the late Late Neolithic (2012). In present
times, the tell is about 9 meters high with a 255 meter circumference (Hansen et al. 2009).
Results from soil coring indicate that the first occupation of the tell site rests on a natural
elevation (Reingruber et al. 2010). The surrounding flat settlement begins immediately outside of
the ditch system and is organized similarly to the structures on the tell, in parallel rows. Artifact
finds in the northeastern part of the flat settlement are associated with the early Boian culture and
in other areas, all Boian phases are present (Hansen and Toderaş 2012). According to Hansen
and Toderaş, the settlement was likely occupied for around 750 years (2012).
Magnetic survey was conducted on the tell in 2004 by B. Song and detected four parallel
rows of houses with the rows having a northeast to southwest orientation (Hansen et al. 2009).
The site plan generated from interpretations of the magnetogram indicates a disturbed area
between the two sections of rows. Areas surrounding the tell were the focus of magnetic survey
in 2005, which detected flat settlements surrounding the tell as well as a graveyard to the tell’s
southwest (Hansen et al. 2009). Boundaries of the site have not yet been reached, although
distinct spaces of dense occupation and culturally sterile areas were noted in the magnetogram

(Hansen et al. 2009). Through remote sensing, the team was able to detect a system of ditches on
the highest terrace a short distance from the tell, not pictured in the images below (Hansen et al.
2009).
Radiocarbon dating and relative dating methods have lead the team to believe the house
features depicted in the magnetogram are not all contemporary. Hansen and Toderaş suspect this
may be due to different time spans of occupation and abandonment and erosion (2012). The
team has discovered evidence of superimposed house structures in trench J in the flat settlement
and radiocarbon dates suggest a difference of one hundred years for the two occupations of the
two structures (Hansen and Toderaş 2012). Excavation of some of adjacent and underlying
unburnt structures of the magnetically detected features showed that floor plans and lanes
between houses remained generally the same over time (Hansen et al. 2009). One of the burnt
structures excavated in trench F was discovered to contain nine individuals who apparently died
during the house fire indicating that a ritual burning of this particular house is unlikely (Hansen
and Toderaş 2012).
One hundred features located in three distinct groupings were digitized according to the
magnetogram interpretations published by Hansen, Toderaş and Reingruber in several articles.
Twenty-three of these features were located on the tell, forty-three were located north of the tell,
and thirty-three were located southwest of the tell. One outlying structure was detected in the
west, north of the graveyard. On the tell, the houses are aligned in very distinct rows; some of
that regularity is present in the north and less of it in the southwest.
Because the dimensions of the house structures are so square-like, for the most part, it is
difficult to say whether they orient from northwest to southeast or the reverse; however, some
more rectangular structures appear in the southeast that have a clear northwest to southeast

orientation. The orientation angles range from -51.89 to 46.77 degrees with a large gap in the
middle of the distribution. This is concurrent with the difficulty in determining which angle is
dominant and should be used to determine orientation. The houses on the tell appear to be the
most regular in terms of alignment and orientation. The houses to the north of the tell are slightly
less regular in orientation, as are the houses to the south of the tell which vary more in shape and
much more in alignment. Topographic plans of the site indicate that the terrace the settlement is
located slopes gradually from the northwest to the southeast with a few distinct ridges, or sharper
changes in elevation that run along a northeast to southwest axis. One of these ridges is located
directly to the east of the tell. Because the elevation changes most from northwest to southeast,
the most level ground would occur along the opposite axis, which may explain the general
orientation of houses.
Area for the house features ranges from 38.81 to 185.23 square meters, with a mean of
60.46 and standard deviation of 18.34 square meters. Two major outliers appear in this
distribution with 185.23 and 133.17 square meters, which are both located to the southwest of the
tell. The next highest area after these two values is 81.73 square meters. According to the hot
spot analysis, the highest area values are clustered in the southwest while the smallest area values
are clustered on the tell and slightly north of the tell.
According to the Average Nearest Neighbor analysis, Pietrele’s sample of house
structures exhibits no significant degree of clustering or dispersion, and has an observed average
distance of 10.24 meters. This observation appears to be more accurate for the section of houses
south of the tell, while houses on the tell appear in four discrete, very regular rows. Houses north
of the tell are also coordinated in a very regular pattern, however there is more variation and no
significant clustering in this section. A 9.74 meter buffer was created, based on the Expected

Mean Distance calculated in the Average Nearest Neighbor analysis, for use with the voronoi
diagram to account for the distinct difference in occupied and non-occupied space in the
magnetogram. The buffer did well in including all houses in the clusters and only overlapped the
ditch slightly in the north. When taking the buffer and survey boundaries into account, the
thiessen polygons range from 75.04 to 605.82 square meters, with a mean of 208.61 and a
standard deviation of 99.52 square meters. There is a peak in the distribution towards the
minimum end of the area values which gradually decreases as area values increase. According to
the thiessen polygon area distribution image, the largest sizes appears to be on the edges of
settlement sections and smallest inside the sections (see Figures 8 and 9 and Table 3).
When comparing the three different housing sections, it becomes evident that values
calculated from these different analyses vary together. When there is little variation in
orientation, there is also little variation in house size and deviation from a set alignment. When
more variation appears in the southern section in house size, there also appears to be more
variation in spacing and alignment. It may be that the very regular patterning occurring on the
tell and to the north of it are due to an early form of city planning, or at the very least some type
of ritual belief, as excavations indicated that lanes and house plans varied little over time
(Hansen et al. 2009).
Table 3. Statistics for Pietrele sample.

Figure 8. Visual representation of analyses run on house features at Pietrele. A.) Digitized features B.) Houses classified by area. C.) Hotspot analysis according to house area. D.) Thiessen polygons classified by area with houses outlined inside. Use scale on bottom right for images A, B, C, D.

Figure 9. Average Nearest Neighbor Summary for Pietrele.
Polgár-Csőszhalom
The Late Neolithic site Polgár-Csőszhalom is “the northernmost tell in the Carpathian
Basin” (see Figure 2) and is located next to a former meander of the Tisza River (Raczky and
Anders 2008). The site is comprised of a Tisza-Herpály type tell, Lengyel type five-ring
concentric ditch and an associated flat settlement discovered approximately 500 meters from the

tell during rescue excavations (Raczky et al. 2007). Based on excavation, geophysical
prospection and soil coring, the entire site is estimated to cover 28 ha, with the flat settlement
accounting for 24 ha (Raczky and Anders 2010). In dimensions, the tell site is most similar to
Lengyel culture settlements (Raczky and Anders 2010). The tell itself has an elevation of 3 to 3.5
meters and is thought to have been occupied from 4820 to 4530 BC (Raczky and Anders 2010).
The associated flat settlement is thought to have been occupied between 4830 and 4600 BC
(Raczky and Anders 2010).
The results of the excavation done prior to the building of the M3 motorway were
combined with prior excavation and 1989’s geophysical prospection of the tell and ditches to
form a site plan. This site is unique in being the only site included in the project with data on
house features derived from large-scale excavation rather than magnetometry. Because of this,
more information is available about the chronology of the horizontal settlement area excavated.
Using this site plan, 73 house structures were digitized, which compares well with the excavation
results in which 79 houses were excavated (Raczky and Anders 2010). Some interpretations had
to be made as house structures were not always clearly delineated in the image. At least thirteen
houses were detected on the tell through magnetometry and excavation with an artifact
assemblage that suggested a ritual function, and additional buildings, wells, and pits were
discovered in both sections but are not included in this analysis (Raczky and Anders 2010).
The orientation angle of this sample had a mean of -3.61 degrees; however, the sample
has a bimodal distribution that severely skews the mean. The angle values range from -42.69 to
87.51 degrees with almost no values ranging between 0 and 40 degrees. The standard deviation
is 38.44 while the median, which may be a better indicator of central tendency, is -17.42. With a
few exceptions, the structure orientation generally appears to be west to east or very slightly
northwest to southeast. According to the site plan, the tell is some 500 meters away from this
excavated part of the settlement and situated just south of the old meander. It may be that the
houses are orienting towards the tell settlement, out of a ritual, communal identity; however,
there is some significant variation in orientation which may mean the trends in orientation are
due to a completely different unknown variable.
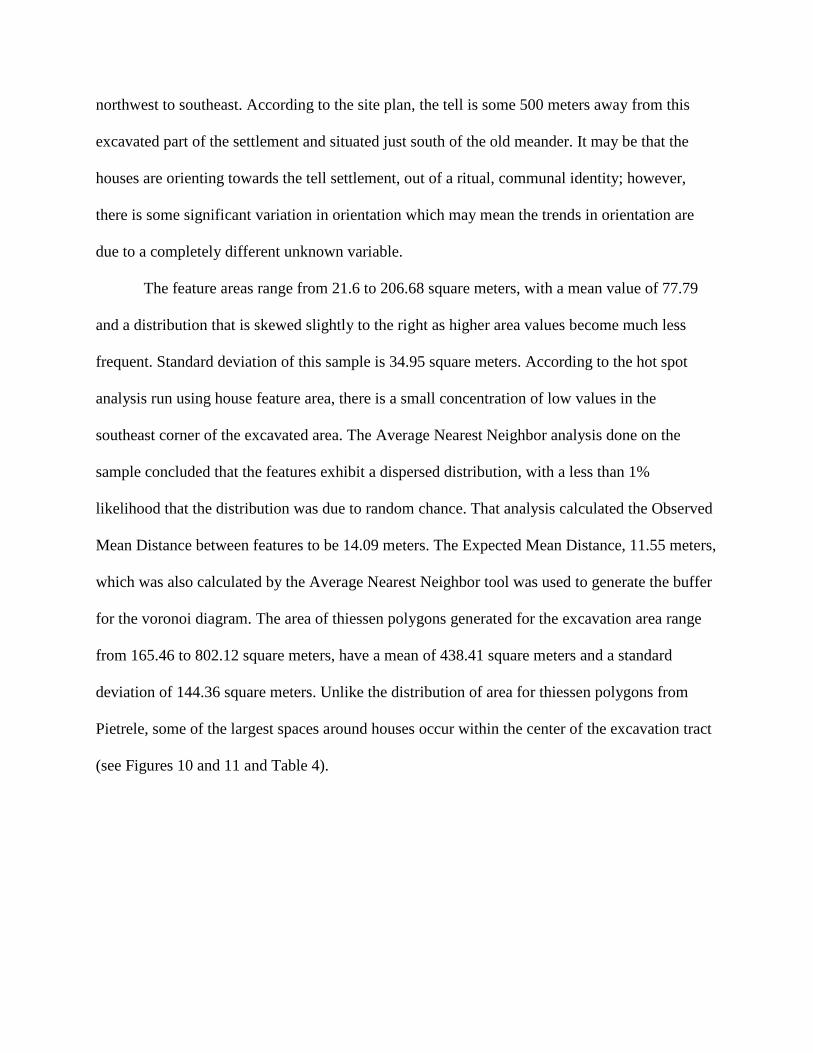
The feature areas range from 21.6 to 206.68 square meters, with a mean value of 77.79
and a distribution that is skewed slightly to the right as higher area values become much less
frequent. Standard deviation of this sample is 34.95 square meters. According to the hot spot
analysis run using house feature area, there is a small concentration of low values in the
southeast corner of the excavated area. The Average Nearest Neighbor analysis done on the
sample concluded that the features exhibit a dispersed distribution, with a less than 1%
likelihood that the distribution was due to random chance. That analysis calculated the Observed
Mean Distance between features to be 14.09 meters. The Expected Mean Distance, 11.55 meters,
which was also calculated by the Average Nearest Neighbor tool was used to generate the buffer
for the voronoi diagram. The area of thiessen polygons generated for the excavation area range
from 165.46 to 802.12 square meters, have a mean of 438.41 square meters and a standard
deviation of 144.36 square meters. Unlike the distribution of area for thiessen polygons from
Pietrele, some of the largest spaces around houses occur within the center of the excavation tract
(see Figures 10 and 11 and Table 4).

Figure 10. Visual representation of analyses run on house features at Polgár-Csőszhalom. A.) Digitized features B.) Houses classified by area. C.) Hotspot analysis according to house area. D.) Thiessen polygons classified by area with houses outlined inside. Use scale on bottom right for images B, C, D. Base image of A adapted from Raczky and Anders2008:40 Figure 2.

Table 4. Statistics for Polgár-Csőszhalom sample.
Figure 11. Average Nearest Neighbor Summary for Polgár-Csőszhalom.

Szeghalom-Kovácshalom
Szeghalom-Kovácshalom is a settlement complex covering nearly 60 hectares; the
complex is comprised of a relatively small tell surrounded by an extensive flat site and isolated
clusters of houses. The tell and some parts of the surrounding flat site have origins during the
Szakálhát phase of the Middle Neolithic (5200-5000 B.C., cal.) and underwent expansion during
the Late Neolithic Tisza phase (5000-4500 B.C., cal.). Small-scale reoccupation of the tell
occurred after a hiatus, during the Early Copper Age, as well as minor occupation episodes of the
flat settlement during the Early Neolithic, Copper Age and Bronze Age. The Szeghalom-
Kovácshalom site is located near the modern village of Szeghalom and just north of the modern
Sebes-Körös River channel (Figure 2).
The multi-disciplinary Hungarian-American-Greek Körös Regional Archaeological
Project has been systematically investigating the Szeghalom-Kovácshalom complex since 2010.
This project has included reconnaissance, systematic survey, systematic topographic study,
geochemical analysis, magnetic susceptibility, geophysical prospection, and test excavations on
the tell and surrounding flat settlement and isolated houses.
The geophysical prospection component of the research directed by Dr. Sarris and Dr.
Nikos Papadopoulos included utilizing magnetometry, ground penetrating radar (GPR), magnetic
susceptibility, soil conductivity, and electrical resistivity tomography (ERT) in various parts of
the site. To date, over 25 hectares have been surveyed through magnetometry (Sarris 2013).
According to Sarris, the tell’s dimensions are roughly 120x75m with an area of 9,000 square
meters and 3.5 meters in height (2013). Unlike at previous sites studied by the Körös Regional
Archaeological Project, the magnetic survey did not detect any traces of a large surrounding
ditch system, although it is likely that the old river channel that encircles the tell provided natural

defense (Sarris 2013). When examining the magnetic survey data, it becomes apparent that a
sort of buffer zone of approximately 100-200 meters is left unoccupied around the tell,
separating the tell occupation and the surrounding flat occupation (Sarris 2013).
Features were digitized according to a line shapefile interpreting the magnetogram
provided by Dr. Sarris and the KRAP team. Eighty-seven house features total were digitized. In
the northern portion of the site, forty structures were digitized. Nine were digitized in the east,
five in the Southeast, 15 in the south, 15 in the west and far west field, and three on the tell. The
amount of features digitized on the tell is misleading, indicating a lower density than reality, due
to the difficulty of delineating anomalies in an area with so much occupational overlap. The
same problem with distinguishing features occurs in the south but to a lesser degree.
In general, the features tend to be oriented from northwest to southeast, however,
orientation varies here more than it has at other sites and varies even within clusters present
within the settlement. Also, houses do not appear to orient towards any specific geographical or
cultural feature. This may be related to a high degree of autonomy among households. The
houses detected range in area from 37.7 to 812.56 square meters with a mean of 140.43 and
standard deviation of 100.97 square meters. The sample contains major outliers at 812.56 and
495.33 square meters, both of which occur in the southern section. Otherwise the next highest
value is 309.78 square meters. According to the hot spot analysis of feature area, a cluster of high
values is located in the southern portion of the site, where the two main feature area outliers are
located. This southern portion is a significant dense cluster of houses in the site, occupied for a
longer period of time than the other areas as evidenced by the feature overlap. According to the
digital elevation model (DEM) provided by the KRAP team, elevation does not appear to make a
difference in area clustering.

The Average Nearest Neighbor analysis done on the sample concluded that the settlement
exhibits a clustered distribution that has less than 1% likelihood of being due to random chance.
This analysis calculated the Observed Mean Distance between features to be 32.85 meters. These
results should be interpreted with caution. The magnetic survey was done in several pieces with
open area left unsurveyed; however, the average nearest neighbor index is calculated by looking
at the smallest possible rectangle that fits all features. In this sense, the houses certainly reflect
clustering, however this may not be the reality. A visual interpretation of the site would suggest
that clusters are present as well as areas of dispersed and isolated features. Again, the variation in
house distribution may indicate a high degree of autonomy. The buffer used to delimit the
voronoi diagram was generated using a 46.19 meter radius, the Expected Mean Distance for the
sample. Using this buffer and the magnetic survey boundaries, the thiessen polygons ranged in
size from 637.83 to 8,295.80 square meters. The average thiessen polygon area is 3,196.72
square meters and the standard deviation is 1,540.77 square meters. The thiessen polygon areas
appear to be largest in the center of survey areas which is a trend opposite to that seen at some of
the other sites, such as Poduri and Pietrele (see Figures 12 and 13 and Table 5).

Figure 12. Visual representation of analyses run on house features at. Szeghalom-Kovácshalom A.) Digitized features B.) Houses classified by area. C.) Hotspot analysis according to house area. D.) Thiessen polygons classified by area with houses outlined inside. Use scale on bottom left for images B, C, D.

Table 5. Statistics for Szeghalom-Kovácshalom sample.
Figure 13. Average Nearest Neighbor Summary for Szeghalom-Kovácshalom.

Turdaş-Luncă
Turdaş-Luncă is a site with occupations dating to the Neolithic, Eneolithic and Bronze
Age in southern Transylvania (see Figure 2) and is the eponymous site for the Turdaş culture
(5000-4800 B.C. cal.) (Mischka 2012; Merlini 2009). It is another site in the sample for which
finding information in English was very difficult. It site is located on a low terrace pinned
between the Mureş River in the north and a small hill in the south, a setting which is typical for
Transylvanian Late Neolithic settlements (Mischka 2012). The site encompasses the entire
terrace which is 14 ha and has been subjected to severe erosion in the north, as much as 80
meters, due to its proximity to the river (Mischka 2012). A large motorway was constructed to
the south of the site and prompted rescue excavation in 2011 (see Figure 14) (Mischka 2012).
The site is referred to as a tell site, however, in this case it means a multi-layered site that grew
over time by repeated fluvial deposits (Mischka 2012). No significant ditch system was detected
through magnetometry; however, Mischka interpreted traces of an enclosure in the south end of

the terrace from the magnetic survey (2012).
Figure 14. Image of Turdaş-Luncă location from Google Maps.
In the past, research done by Sophia von Thorma in the late 1800’s and Sabin Adrian
Luca in the 1990’s has had a northern focus because of the continuing erosion. In 2007, Carsten
Mischka led a geomagnetic survey of the site center as a part of a larger research project. Survey
was conducted in narrow strips with unsurveyed space left in between. The survey detected what
appeared to be two clusters of houses and a larger isolated structure in the northern part of the
survey (Mischka 2012). According to Mischka, it is possible theses clusters belonged to different
periods or that the clusters are contemporary and connected by unburned houses (2012). A
rescue excavation was led by Sabin Adrian Luca in 2011; however, only reports on information
unrelated to this topic have been published from that campaign.
Mischka was able to detect 27 houses structures through magnetic survey, however, three
structures were partial and left out of digitization for this project so as not to skew the results.

Another change made in digitization to Mischka’s interpretations concerned the central
anomalous building. After consulting A. Sarris on the original magnetogram, the structure was
broken down into three northeast to southwest oriented adjacent features. This interpretation is
more congruent with orientation and dimensions of all other structures in the sample.
With a sample of 26 features, the angle of orientation ranges from -90.00 to 89.12
degrees. The range of values is misleading because of how the angles have been calculated. The
general trend is for houses to be oriented north to south, with some variation in tilting slightly to
the west or slightly to the east, which appears in degrees as -90 or 89, causing a very large range.
Because the distribution is so strongly bimodal, neither the mean nor median are useful. The area
of these structures ranges from 54.14 to 141.71 square meters with the majority of structures
falling between 54 and 100 square meters. There are a handful of structures falling between 100
and 141.71 square meters. According to the hot spot analysis, a cluster of low values occurs
close to the center of the site along the edge of terrace nearest the hill.
The Average Nearest Neighbor analysis run on the sample concluded that the house
distribution is clustered, with a less than 1% likelihood that the pattern is due to random chance.
The analysis calculated the Observed Mean distance between houses to be 16.06 meters. The
Expected Mean Distance between houses is 22.61 meters and this value was used to create the
buffer for the voronoi diagram. Using this buffer and the survey boundaries, the thiessen polygon
areas range from 187.37 to 1,851.54 square meters with a mean of 851.19 square meters and a
standard deviation of 476.59 square meters (see Figures 15 and 16 and Table 6).

Figure 15. Visual representation of analyses run on house features at. Turdaş-Luncă A.) Digitized features B.) Houses classified by area. C.) Hotspot analysis according to house area. D.) Thiessen polygons classified by area with houses outlined inside. Use scale on bottom right for images A, B, C, D.

Table 6. Statistics for Turdaş-Luncă sample.
Figure 16. Average Nearest Neighbor Summary for Turdaş-Luncă.

Chapter 5: Comparative Inter-site Analysis
When examining feature orientation trends across sites, it becomes apparent that all
possible orientations are represented within the sites examined (Figure 17). This includes north
to south at Turdaş-Luncă, west to east at Polgár-Csőszhalom, northeast to southwest at Okolište,
and variations of northwest to southeast for Iclod, Pietrele, and Szeghalom-Kovácshalom. There
are also differences in how strictly houses conform to a particular orientation. Pietrele has the
smallest range of observed orientation angles with a couple significant outliers. The site with the
largest range in variation is Iclod, due to its interesting semi-radial orientation. Otherwise, sites
are not significantly different in range of variation and outliers. As mentioned above, the range
of values for Turdaş-Luncă is misleading because of how the statistic is calculated. Interestingly,
the site that has the most variation in house orientation, Iclod, is the site where features are
oriented in relation to a cultural landmark, the fortification system and site center. Because of
this, the variation is systematic and an indicator of planning, not necessarily due to any central
authority, however. The houses at Okolište appeared to be oriented based on geography, towards
the river bend and rise of hills. The houses at Pietrele seemed to be aligned along the same axis
as the contour lines for site elevation, which run perpendicular to the slope of the terrace; this
two may have a functional purpose. The houses at Polgár-Csőszhalom, Turdaş-Luncă ,and
Szeghalom-Kovácshalom all display a significant amount of variation in house orientation, but
they do not seem to be oriented to a particular landscape feature

Figure 17. Boxplots displaying orientation angle distributions across sites.
When examining and comparing site distributions for house areas, Szeghalom-
Kovácshalom has not only the largest range, largest mean and largest maximum value of all the
sites. Iclod has the next largest range of values that does not include outliers, but has a mean that
is relatively consistent with feature area means for Okolište, Polgár-Csőszhalom, and Turdaş-
Luncă. Pietrele has the smallest range of house sizes with a few significant outliers and a mean
that is slightly lower than that of the other sites (Figure 18).

Figure 18. Boxplots displaying feature area distributions across sites.
For thiessen polygon area, Szeghalom-Kovácshalom, again, has the largest range, largest
mean and largest maximum values (Figure 19). This could be interpreted by saying that
Szeghalom-Kovácshalom ranges the most in amount of spacing between houses and houses tend
to be spaced apart more on average. This is caused by the presence of both dense clusters of
houses and dispersed isolated structures within the site and the very large geophysical survey
area, relative to other sites examined. Pietrele, again, has the smallest range in variation, but this
time no significant outliers. Iclod and Turdaş-Luncă appear to have similar distributions and
were both calculated to exhibit clustered distributions; in both of these sites, the largest thiessen
polygon areas are located on the edge of clusters. Okolište and Polgár-Csőszhalom also have

very similar distributions with very little variation and exhibit dispersed distributions according
to the Average Nearest Neighbor analysis.
Figure 19. Boxplots displaying thiessen polygon area distributions across sites.

Chapter 6: Discussion & Conclusions The main goal of this study was to compare trends in settlement organization expressed
as house orientation, size and distribution at various sites to determine whether the large amount
of variability present at Szeghalom-Kovácshalom, which reflected the autonomy in household
organization found in tribal societies, is a trend characterizing other sites of roughly the same
time period and geography as well. Magnetometry was chosen as the primary source of initial
data because it can provide it can provide a glimpse of larger portions of the settlement in a
shorter span of time than excavation, allowing us to generate statistics for a large sample of
house features at sites that have employed it.
The data collected through magnetometry has drawbacks that may have major
implications for the analyses utilized in this study, the main one being the lack of temporal or
chronological information. This mostly affects the analyses that deal with distance based
associations, such as the hot spot analysis, average nearest neighbor analysis and the generation
of the voronoi diagram. Another issue, which must be kept in mind, is that not all house features
are detected through magnetic survey. Houses that were not burnt or that lay below other
anomalies may not be detected; excavations at Okolište and Pietrele documented houses that
were not detected through magnetic survey. Other methodological issues that were brought up
earlier need to be kept in mind as well and interpretations made with caution.
In examining the results of this study, it can confidently be said that no other site
included in the study exhibited the degree of variation that Szeghalom-Kovácshalom did in terms
of the aspects of settlement organization that were examined. Instead, the sites examined
exhibited varying degrees of variation for different attributes. Two of the sites displayed limited

forms of settlement planning, which could be interpreted as less autonomy at the household
level. Iclod exhibited clear coordination among houses in orientation towards a communal
landmark, the fortification system and site center. Pietrele exhibited very little variation in terms
of house size and orientation, while in parts of the sites, houses were arranged in regularly
aligned rows, which was a trend that excavation proved to be continuous over more than one
phase of occupation. In the case of Iclod, it is likely that this coordination in orientation is related
to some type of communal ritual belief. In the case of Pietrele, it could be that the rows of houses
were the best solution to a topographical problem; however the clearest example of regularly
aligned rows is located on the tell, which points to more social or ideological causes. At the sites
Okolište, Turdaş-Luncă, and Polgár-Csőszhalom, variation is not exhibited at quite the same
level as Szeghalom-Kovácshalom; however, there are no conclusive signs of settlement planning
either besides very general trends in orientations.

Acknowledgments Funding for this research was provided by the National Science Foundation International Research Experiences for Students (NSF IRES) grant, the Ohio State Social and Behavioral Sciences Undergraduate Research Grant and the Ohio State College of Arts and Sciences Research Scholarship. Guidance throughout this study was provided by Prof. Richard Yerkes, The Ohio State University; Dr. Apostolos Sarris, IMS – FORTH; William A. Parkinson, Field Museum of Natural History; Attila Gyucha, Hungarian National Museum; Dr. Ningchaun Xiao, The Ohio State University.

References
Anthony, David W. 2010 The Rise and Fall of Old Europe. In The Lost World of Old Europe: The Danube Valley, 5000-3500 BC. David W. Anthony and Jennifer Y. Chi, eds. Pp. 28-58. Princeton, New Jersey: Princeton University Press.
Bailey, Douglas W., Ruth Tringham, Jason Bass, Mirjana Stevanovic, Mike Hamilton, Heike Neumann, Ilke Angelova, and Ana Raduncheva
1998 Expanding the Dimensions of Early Agricultural Tells: the Podgoritsa Archaeological Project, Bulgaria. Journal of Field Archaeology 25:373-396.
Bălăsescu, Adrian 2009 Ritual Depositions of Sus Domesticus from Poduri – Dealul Ghindaru (Cucuteni Culture, Bacău County, Romania). Annales d’Université „Valahia” Târgoviste, Section d’Archéologie Et d’Histoire XI(1):69-78.
Bejenaru, Luminita, Dan Monah, and George Bodi 2010 A Deposit of Astragali at the Copper Age Tell of Poduri-Dealul Ghindaru, Romania. Antiquity 084(323).
Chapman, John 1981 The Vinča Culture of South-East Europe. Studies in Chronology, Economy and Society. British
Archaeological Reports International Series 117. B.A.R., Oxford.
Colesniuc, Sorin Marcel 2008 The Zau Culture. Ph.D. dissertation, Universitatea Lucian Blaga Sibiu.
Draşovean, Florin (editor)
2009 Ten Years After: the Neolithic of the Balkans as Uncovered by the last decade of Research. Editura Marineasa, Timişoara.
Duffy, Paul R., William A. Parkinson, Attila Gyucha, and Richard W. Yerkes 2013 Coming Together, Falling Apart: A Multiscalar Approach to Prehistoric Aggregation and Interaction on the Great Hungarian Plain. In From Prehistoric Villages to Cities: Settlement Aggregation and Community Transformation. Jennifer Birch, ed. Pp. 44-62. Routledge.
Flannery, Kent V. 1972 The Origins of the Village as a Settlement Type in Mesoamerica and the Near East: A comparative study. In Man, Settlement and Urbanism, edited by P. J. Ucko, R. Tringham and Dimbleby, pp. 23-53. London: Duckworth.
Flannery, Kent V.
2002a Prehistoric Social Evolution. In Archaeology: Original Readings in Method and Practice, edited by Peter N. Peregrine, Carol R. Ember, and Melvin Ember, pp. 225-244. Prentice-Hall.
Flannery, Kent V.
2002b. The Origins of the Village Revisited: From Nuclear to Extended Households.American Antiquity 67(3):417-433.
Gyucha, Attila, and William A. Parkinson 2013 Archaeological “Cultures” and the Study of Social Interaction: The Emergence of the Early Copper Age Tiszapolgár Culture. Moments in Time: Papers Present to Pál Raczky on His 60th Birthday:521-538.

Gyucha, Attila, William A. Parkinson, and Richard W. Yerkes 2009 A Multi-Scalar Approach to Settlement Pattern Analysis: The Transition from the Late Neolithic to the Early
Copper Age on the Great Hungarian Plain. In Reimagining Regional Analysis: The Archaeology of Spatial and Social Dynamics, edited by TinaThurston and Roderick Salisbury, pp. 100-129. Cambridge Scholars Publishing, Newcastle upon Tyne.
Hansen, Svend, and Meda Toderas 2012 The Copper Age Settlement Pietrele on the Lower Danube River (Romania). Landscapes and Human Development: The Contribution of European Archaeology. Socio-Environmental Dynamics over the Last 12,000 Years: The Creation of Landscapes (1st - 4th April 2009):127-138.
Hansen, Svend, Meda Toderas, and Agathe Reingruber 2009 Pietrele. A Chalcolithic Settlement on the Lower Danube River. Ten Years After: The Neolithic of the Balkans, as Uncovered by the Last Decade of Research:289-310.
Hofmann, Robert 2012 Style and Function of Pottery in Relation to the Development of Late Neolithic Settlement Patterns in Central Bosnia. Socio-Environmental Dynamics Over the Last 12,000 Years: The Creation of Landscapes II (14th-18th March 2011) 3(Tells: Social and Environmental Space)::181-201.
Hofmann, Robert, Zilka Kujundzic-Vejzagic, Johannes Mueller, Nils Mueller-Scheessel, and Knut Rassmann 11 Apr 2008 Excavations in Okolište and the Reconstruction of Late Neolithic Settlement Processes in the Visoko Basin in Central Bosnia (5200-4500 B.C.). Electronic documnt, http://www.aegeobalkanprehistory.net/article.php?id_art=12.
Horváth, Ferenc 1989 A Survey on the Development of Neolithic Settlement Patterns and House Types in the Tisza region. In
Neolithic of Southeastern Europe and its Near Eastern Connections, edited by Sándor Bökönyi, pp. 85-101. Institute of Archaeology of the Hungarian Academy of Sciences, Budapest.
Kalicz, Nador., and Pál Raczky 1987 The Late Neolithic of the Tisza Region: A Survey of Recent Archaeological Research. In The Late
Neolithic of the Tisza Region: A Survey of Recent Excavations and Their Findings, edited by László Tálas and Pál Raczky, pp. 11-30. Kossuth Press-Szolnok County Museums, Budapest-Szolnok.
Kienlin, Tobias L. 2012 Patterns of Change, Or: Perceptions Deceived? Comments on the Interpretation of Late Neolithic and Bronze Age Tell Settlement in the Carpathian Basin. Beyond Elites: Alternatives to Hierarchical Systems in Modeling Social Formations 1(215):251-310.
Kvamme, Kenneth L. 1999 Recent Directions and Developments in Geographical Information Systems. Journal of Archaeological Research 7(2):153-201.
Link, Thomas, 2006 Th. Link, Das Ende der neolithischen Tellsiedlungen. Einkulturgeschichtliches Phänomen des 5. Jahrtausendsv. Chr. im Karpatenbecken. Universitätsforschungen zurprähistorischen Archäologie 134. Bonn: Habelt 2006.
Merlini, Marco 2009 An Inquiri into the Danube Script. Sibiu: Alba Iulia – Editura Altip.
Mischka, Carsten 2012 Late Neolithic Multiphased Settlements in Central and Southern Transilvania: A Geophysical Survey and

Test Excavation. Socio-Environmental Dynamics Over the Last 12,000 Years: The Creation of Landscapes II (14th-18th March 2011) 3(Tells: Social and Environmental Space):153-166.
Mischka, Carsten 2010 Beispiele für Änlichkeit Und Diversität Neolithischer Und Kupferzeitlicher Regionaler Siedlungsmuster in Rumänien Anhand Von Geomagnetischen Prospektionen. Kolloquien Zur Vor- Und Frühgeschichte 14(Leben auf dem Tell als soziale Praxis):71-84.
Mueller-Scheessel, Nils, Robert Hofmann, Johannes Mueller, and Knut Rassmann 2010 The Socio-Political Development of the Late Neolithic Settlement of Okoliste/Bosnia-Hercegowina: Devolution by Transhumance? Landscapes and Human Development: The Contribution of European Archaeology Socio-Environmental Dynamics over the Last 12,000 Years: The Creation of Landscapes (1st - 4th April 2009):181-191.
Parkinson, William A. 2006 The Social Organization of Early Copper Age Tribes on the Great Hungarian Plain. British Archaeological Reports B.A.R. International Series 1573. B.A.R., Archaeopress, Oxford.
Parkinson, William A. 2006 Tribal Boundaries: Stylistic Variability and Social Boundary Maintenance during the Transition to the Copper Age on the Great Hungarian Plain. Journal of Anthropological Archaeology 25(1):33-58.
Parkinson, William A., and Attila Gyucha 2012 Tells in Perspective: Long-Term Patterns of Settlement Nucleation and Dispersal in Central and Southeast Europe. Tells: Social and Environmental Space 3(Socio-Environmental Dynamics over the Last 12,000 Years: The Creation of Landscapes II):105-116.
Parkinson, William A., Richard W. Yerkes, Attila Gyucha, Apostolos Sarris, Margaret Morris, and Roderick Salisbury
2010 Early Copper Age Settlements in the Körös Region of the Great Hungarian Plain. Journal of Field Archaeology 35:164-183.
Raczky, Pál, and Alexandra Anders 2010 Activity Loci and Data for Spatial Division at a Late Neolthic Site-Complex (Polgár-Csöszhalom: A Case Study). Kolloquien Zur Vor- Und Frühgeschichte 14(Leben auf dem Tell als soziale Praxis):143-164.
Raczky, Pál, and Alexandra Anders 2008 Late Neolithic Spatial Differentiation at Polgár-Csöszhalom, Eastern Hungary. Living Well Together? Settlement and Materiality in the Neolithic of South-East and Central Europe:35-53.
Raczky, Pál, Lázló Domboróczki, and Zsigmond Hajdú 2007 The Site of Polgár-Csöszhalom and its Cultural and Chronological Connections with the Lengyel Culture. The Lengyel, Polgár and Related Cultures in the Middle/Late Neolithic in Central Europe:49-70.
Reingruber, Agathe, Svend Hansen, and Meda Toderas 2010 Monumental Living: Pietrele Near the Lower Danube River in the 5th Millenium BC. Landscapes and Human Development: The Contribution of European Archaeology Socio-Environmental Dynamics over the Last 12,000 Years: The Creation of Landscapes (1st-4th April 2009):171-180.
Sherratt, Andrew 1982 The Development of Neolithic and Copper Age Settlement in the Great Hungarian Plain. Oxford Journal of Archaeology 1(3):287-316.

Visy, Zsolt (editor) 2003 Hungarian Archaeology at the Turn of the Millennium. Ministry of National Cultural Heritage, Teleki László Foundation, Budapest.
Whittle, Alasdair 1996 Europe in the Neolithic. The Creation of New Worlds. Cambridge University Press, Cambridge. Yerkes, Richard W., Attila Gyucha, and William A. Parkinson
2009 A Multi-Scalar Approach to Modeling the End of the Neolithic on the Great Hungarian Plain Using Calibrated Radiocarbon Dates. Radiocarbon 51: 890-932.
Yerkes, Richard W., Apostolos Sarris, Tod Frolking, William A. Parkinson, Attila Gyucha, Meredith Hardy, and Luigi Catanoso 2007 Geophysical and Chemical Investigations at Two Early Copper Age Settlements in the Körös River Valley, Southeastern Hungary. Geoarchaeology: An International Journal 22(8):845-871.