With flying colours Pilot performance with colour-coded ...
12
Contents lists available at ScienceDirect Displays journal homepage: www.elsevier.com/locate/displa With flying colours: Pilot performance with colour-coded head-up flight symbology ☆ James Blundell ⁎ , Steve Scott, Don Harris, John Huddlestone, Dale Richards Centre for Mobility and Transport, Coventry University, Conventry, UK ARTICLE INFO Keywords: Head-up-displays Head-mounted-displays Colour Aviation Performance ABSTRACT The manipulation of colour in display symbology design has long been recognised as a method to improve operator experience and performance. Recent developments in colour head-up display (HUD) and helmet- mounted display (HMD) technology underline the necessity to understand the human factors considerations of symbology colour coding against conventional monochrome symbology formats. In this low-fidelity desktop human-in-the-loop experiment, the colour of flight symbology on an overlaid symbology set was coded as a redundant cue to indicate the accuracy of professional and non-professional pilots’ flight profile across a range of simulated flight manoeuvres. The main finding of this study was that colour coding flight symbology supported the manual flying performance of both professional and non-professional pilots. Notably, colour-coding of the bank indicator and airspeed tape minimised performance error during turning and altitude change manoeuvres, respectively. The usability of colour coded symbology was also rated higher than the monochrome symbology. We conclude that colour coded HUD/HMD symbology is preferred by the user and may improve performance during low workload manual flying tasks. A fuller understanding of performance and workload effects will require future studies to employ higher workload flying tasks and examine the utility of colour coding within higher fidelity environments. 1. Introduction The conscious attentional effort required to locate and scrutinise target information in a busy visual scene can be minimised by pre-at- tentive processing when the target stimuli differs from noncritical in- formation on a single dimension [1–5]. When pre-attentive processing is successful in this manner the target should “pop-out” of the display [6]. An example would be the search of a single red item among a set of green distractor items. In this case, the red target pops out and sum- mons attention with minimal interference from the green distractors. When symbology varies along multiple dimensions (e.g. colour and shape), pre-attentive processing may be able to isolate a group of likely target candidates based on one dimension (e.g. colour), but then ex- plicit attentional resources are required to guide attention over the reduced symbology set (e.g. shapes of a specific colour). Evidently, performance will be much slower in this instance since explicit atten- tion is required to scrutinise individual items within the reduced sym- bology set in serial fashion until the target is located [7–9]. Never- theless, performance is still superior to the case where there is no colour coding. Because it is so effective, selection by colour is a common di- mension of symbology that has been manipulated in the design of visual displays to improve operator experience and performance [10–12]. The above principles have been successful applied to the design of cockpit displays to improve the communication of safety critical in- formation for more than 75 years [13]. The Federal Aviation Admin- istration (FAA) advises that in addition to utilising visually distinct colour sets, colours in electronic flight displays must be employed only as a redundant cue and be semantically standardised (FAA Advisory circular: 25-11B [14]). For example, the progression from green to red is commonly used to semantically convey increasing degrees of threat, a potential hazard, safety criticality, or the need for flight crew awareness and/or response. There is strong body evidence that has highlighted that colour can be used to support cognitive functions, improve pilot spatial orientation, enhance accuracy, decision time and workload [13,15–17]. In the military domain, colour has been used to support the identification of targets, smoke, flags, signal and navigation lights, and terrain differences [18]. In the commercial world, colour coding has been employed within TCAS modes of head-down navigational displays https://doi.org/10.1016/j.displa.2019.101932 Received 8 April 2019; Received in revised form 11 November 2019; Accepted 18 November 2019 ☆ This paper was recommended for publication by Richard H.Y. So. ⁎ Corresponding author. E-mail addresses: [email protected] (J. Blundell), [email protected] (S. Scott), [email protected] (D. Harris), [email protected] (J. Huddlestone), [email protected] (D. Richards). Displays 61 (2020) 101932 Available online 25 November 2019 0141-9382/ © 2019 Elsevier B.V. All rights reserved. T
Transcript of With flying colours Pilot performance with colour-coded ...
Contents lists available at ScienceDirect
Displays
journal homepage: www.elsevier.com/locate/displa
With flying colours: Pilot performance with colour-coded head-up flightsymbology☆
James Blundell⁎, Steve Scott, Don Harris, John Huddlestone, Dale RichardsCentre for Mobility and Transport, Coventry University, Conventry, UK
A R T I C L E I N F O
Keywords:Head-up-displaysHead-mounted-displaysColourAviationPerformance
A B S T R A C T
The manipulation of colour in display symbology design has long been recognised as a method to improveoperator experience and performance. Recent developments in colour head-up display (HUD) and helmet-mounted display (HMD) technology underline the necessity to understand the human factors considerations ofsymbology colour coding against conventional monochrome symbology formats. In this low-fidelity desktophuman-in-the-loop experiment, the colour of flight symbology on an overlaid symbology set was coded as aredundant cue to indicate the accuracy of professional and non-professional pilots’ flight profile across a range ofsimulated flight manoeuvres. The main finding of this study was that colour coding flight symbology supportedthe manual flying performance of both professional and non-professional pilots. Notably, colour-coding of thebank indicator and airspeed tape minimised performance error during turning and altitude change manoeuvres,respectively. The usability of colour coded symbology was also rated higher than the monochrome symbology.We conclude that colour coded HUD/HMD symbology is preferred by the user and may improve performanceduring low workload manual flying tasks. A fuller understanding of performance and workload effects willrequire future studies to employ higher workload flying tasks and examine the utility of colour coding withinhigher fidelity environments.
1. Introduction
The conscious attentional effort required to locate and scrutinisetarget information in a busy visual scene can be minimised by pre-at-tentive processing when the target stimuli differs from noncritical in-formation on a single dimension [1–5]. When pre-attentive processingis successful in this manner the target should “pop-out” of the display[6]. An example would be the search of a single red item among a set ofgreen distractor items. In this case, the red target pops out and sum-mons attention with minimal interference from the green distractors.When symbology varies along multiple dimensions (e.g. colour andshape), pre-attentive processing may be able to isolate a group of likelytarget candidates based on one dimension (e.g. colour), but then ex-plicit attentional resources are required to guide attention over thereduced symbology set (e.g. shapes of a specific colour). Evidently,performance will be much slower in this instance since explicit atten-tion is required to scrutinise individual items within the reduced sym-bology set in serial fashion until the target is located [7–9]. Never-theless, performance is still superior to the case where there is no colour
coding. Because it is so effective, selection by colour is a common di-mension of symbology that has been manipulated in the design of visualdisplays to improve operator experience and performance [10–12].
The above principles have been successful applied to the design ofcockpit displays to improve the communication of safety critical in-formation for more than 75 years [13]. The Federal Aviation Admin-istration (FAA) advises that in addition to utilising visually distinctcolour sets, colours in electronic flight displays must be employed onlyas a redundant cue and be semantically standardised (FAA Advisorycircular: 25-11B [14]). For example, the progression from green to redis commonly used to semantically convey increasing degrees of threat, apotential hazard, safety criticality, or the need for flight crew awarenessand/or response. There is strong body evidence that has highlightedthat colour can be used to support cognitive functions, improve pilotspatial orientation, enhance accuracy, decision time and workload[13,15–17]. In the military domain, colour has been used to support theidentification of targets, smoke, flags, signal and navigation lights, andterrain differences [18]. In the commercial world, colour coding hasbeen employed within TCAS modes of head-down navigational displays
https://doi.org/10.1016/j.displa.2019.101932Received 8 April 2019; Received in revised form 11 November 2019; Accepted 18 November 2019
☆ This paper was recommended for publication by Richard H.Y. So.⁎ Corresponding author.E-mail addresses: [email protected] (J. Blundell), [email protected] (S. Scott), [email protected] (D. Harris),
[email protected] (J. Huddlestone), [email protected] (D. Richards).
Displays 61 (2020) 101932
Available online 25 November 20190141-9382/ © 2019 Elsevier B.V. All rights reserved.
T
(ND) to support discrimination between TCAS proximity cautions andalerts. Future avionic applications such as the Airborne SeparationAssurance System (ASAS) will utilise colour within head-down PrimaryFlight Displays (PFD) and ND to support pilots maintain self-assuredseparation during free-routing operations [19,20]. Specifically, yellowor orange coloured “no-go” bands placed on the vertical speed tape andheading rose would represent potential conflicts between 3 and 6 minaway, respectively.
Head-up displays (HUDs) and Helmet-Mounted Displays (HMDs)allow pilots to see key flight instrumentation on a transparent displaywhilst maintaining their view of the outside world. To achieve this bothtechnologies optimally superimposed the symbology of the transparentdisplay onto the user’s field of view. This collation of near and far flightinformation removes the need to look down at the flight instruments,resulting in increased situational awareness and greater precision inaircraft control [21]. HUD and HMD imagery is often restricted tomonochrome (green) as a consequence of the single P-53 phosphor thatis used to generate the imagery [22]. This results in the omission ofinformation normally provided, or organised, by colour coding. How-ever, recent advancements in waveguide optical technology means thatthe development of colour HUDs could be viable in the near future [23].The display technology in HMDs is different and the development anddesign of colour displays has matured further in comparison to HUDs.For example, the United Force Airforce (USAF) has addressed severalrelevant HMD visual processing issues such as the appropriate lumi-nance contrasts ratios for a colour HMD [24,25]. Nonetheless, due totheir complexity and high cost, colour HUDs and HMDs have been latein development [26]. Consequently, the related human factors con-siderations of colour have been largely ignored. This is reflected in theabsence of specific colour guidance from the FAA regarding the pre-sentation of information on HUDs (FAA Advisory circular: 25-11B(Federal Aviation Administration, 2014)). However, these factors havenot decreased their desirability to the user [16]. With the possibility todevelop more visually distinct and complex head-up and head-mounteddisplay systems in the near future an understanding of relevant humanfactors has become more urgent.
Several studies have confirmed the positive impact of colour onflight performance and operations. DeMars (1975) concluded that, forcertain applications, colour enhanced accuracy, decision time, andworkload capability. In a study by Derefeldt et al. [27], an upgradedmilitary colour coded head-down display was discovered to providemore target search and tracking advantages than the earlier mono-chrome display. Furthermore, the colour displays reduced reactiontimes and helped pilots to see the grouping of information on the dis-play. Similarly, colour-coding weapon symbology of military pilotHMDs can reduce missile release time without sacrificing probability ofkill [28]. Conversely, Dudfield [29,36] found that the performancebenefits of colour-coded flight symbology on a HUD far outweighed itsperceived importance. However, the pilots in Dudfield’s study notedthat the difficultly of the employed task, maintenance of a straight-levelprofile, was not sufficiently challenging.
The intention of the current study is to evaluate the performanceand workload benefits of a colour coded head-up flight symbology set.Rather than creating a physical HUD or HMD platform we decided topresent an artificial overlay on a computer screen that would in essencecreate an “artificial HUD”. This of course creates an offset in terms ofvisual acuity and human performance, but the primary focus of thisstudy was to examine the cognitive effects of colour (and not assess thefocal demands of the display). Manual flying performance and sub-jective workload of professional commercial pilots and non-professionalpilots was examined in response to flying with a redundantly colourcoded flight symbology set across a range of low-fidelity simulatedflight trials. Similar to Dudfield (1991), symbology colour coding cueswere based on economy so that colour was used only when participantsflew outside pre-determined boundaries, e.g. flying off course, pro-viding the subject with immediate feedback on the accuracy of their
performance. However, we expanded on Dudfield’s study by evaluatingthe use of colour feedback across several flight manoeuvre types (ran-ging in complexity), not just straight-and-level flight. The use of colourin display design has been used frequently to facilitate learning [30],the inclusion of inexperienced participants in the current study was todetermine whether the availability of the colour-coded redundant in-formation served a cognitive purpose beyond facilitating the learningprocess in a novice group. In addition, subjective measures of workloadand usability were measured via the NASA Task Load Index (TLX) andthe Post-Study System Usability Questionnaire (PSSUQ), respectively.
2. Materials and methods:
2.1. Participants
Nine professional commercial airline pilots and eighteen non-pro-fessional pilots participated in the study. The rank of professional pilotparticipants included three first officers and six captains. Pilots’ averageflying experience was 5550 h (SD = 4149). Non-pilots consisted ofvolunteer aviation/automotive engineering students and staff from theFaculty of Mobility and Transport at Coventry University. The experi-ment was approved by Coventry University Ethics and was in line withEthical guidelines as per the British Psychological Society.
2.2. Experimental design and apparatus
The purpose of the study was to investigate systematic individualdifferences between professional (pilots) and non-professional pilots(non-pilots) in terms of flight performance and workload when flying amanual flying simulator task with either a colour or monochrome head-up symbology set. A desktop simulator running X-plane 9.71 (LaminarResearch) was used for the manual flying task. Participants were seatedat a viewing distance of 75 cm from a 55-by-40 cm display, produced atotal field of view of 40.3 deg. The simulation required the participantsto fly a very light single-engine jet aircraft (the Cirrus Vision SF50) in a20-min manual flying task involving a take-off, 4 separate manoeuvres(Table 1), an Instrument Landing System (ILS) interception andlanding.
Fig. 1 presents the symbology that was overlaid onto the simula-tion’s visual scene, highlighting how the colour coding of the sym-bology was implemented. Task complexity was increased by omittingseveral information elements (i.e. the velocity vector, vertical airspeed),promoting synthesis of disparate information sources to accomplishspecific tasks. For example, maintaining a stead vertical airspeed re-quired attending to altitude and airspeed information simultaneously.
Colour was a changeable independent variable, with the symbologyfeature/item colour used to indicate the accuracy of the flight profile.The colour coding conventions was aligned with the FAA’s guidance oncolour coding within electronic flight displays (Advisory circular: 25-11B (Federal Aviation Administration, 2014)). Whereby, the progres-sion from green to red represented the increasing need for flight crewawareness and response. If a participant was to veer off course, fly too
Table 1Flight manoeuvres details.
Manoeuvre Description Flight Parameters Evaluated
Alt (ft) IAS (knts) Hdg(deg)
Bnk (deg)
S&L Straight and level 4000 170 260 0Descend Straight decent for
1000ft– 170 130 0
Flat Turn Flat left 130° turn 4000 170 – 20Climbing Turn Climbing right 190°
turn for 2000 ft– 170 – 20
J. Blundell, et al. Displays 61 (2020) 101932
2
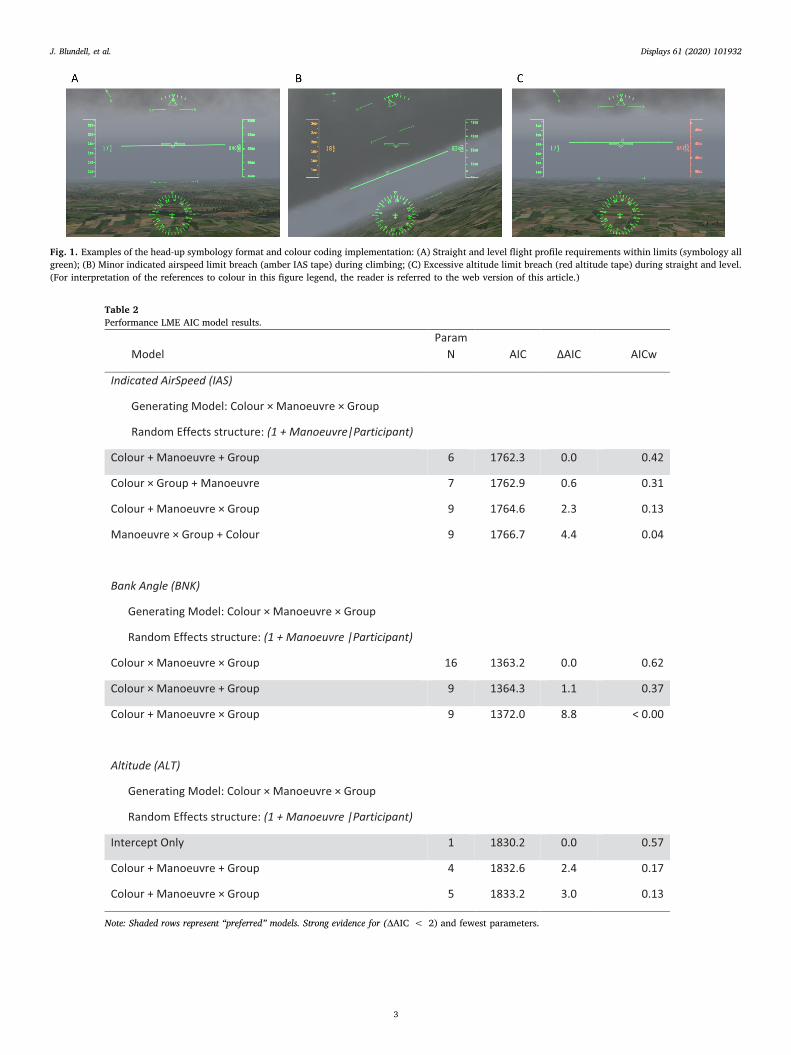
Fig. 1. Examples of the head-up symbology format and colour coding implementation: (A) Straight and level flight profile requirements within limits (symbology allgreen); (B) Minor indicated airspeed limit breach (amber IAS tape) during climbing; (C) Excessive altitude limit breach (red altitude tape) during straight and level.(For interpretation of the references to colour in this figure legend, the reader is referred to the web version of this article.)
Table 2Performance LME AIC model results.
Note: Shaded rows represent “preferred” models. Strong evidence for (ΔAIC < 2) and fewest parameters.
J. Blundell, et al. Displays 61 (2020) 101932
3
low or high, too fast or slow, or with a high degree of roll, the relevantitem would change from green to amber and ultimately to red, de-pending upon the amount of deviance from a set of flight profile criteria(Table 1). For example, if a subject flew too low or high then the alti-tude tape would turn to amber at +/-50ft and red at +/-60ft. Thelimits in which colour changes occurred were pre-defined. The sym-bology colour was manipulated in MATLAB® (version R2018b) in realtime, using user datagram protocol (UDP) to send/retrieve relevantflight parameter data between X-plane and MATLAB®.
The experimental design was a 2 × 4 × 2 mixed factorial design.Within subject factors included type of symbology (Colour: colour ormonochrome) and type of flight manoeuvre (Manoeuvre; Table 1). The
between subject factor was the experience of the participant group(Group: pilot or non-pilot). Performance was measured as the root meansquare error (RMSE) data of the deviation from a given manoeuvre’srequired altitude, indicated air speed, heading and bank angle. Theorder participants experienced the two Colour conditions were coun-terbalanced across participants.
2.3. Subjective measurements
Subjective measures of workload and usability were measured aftereach 20-min scenario via the NASA Task Load Index (TLX) [31] and thePost-Study System Usability Questionnaire (PSSUQ) [32], respectively.
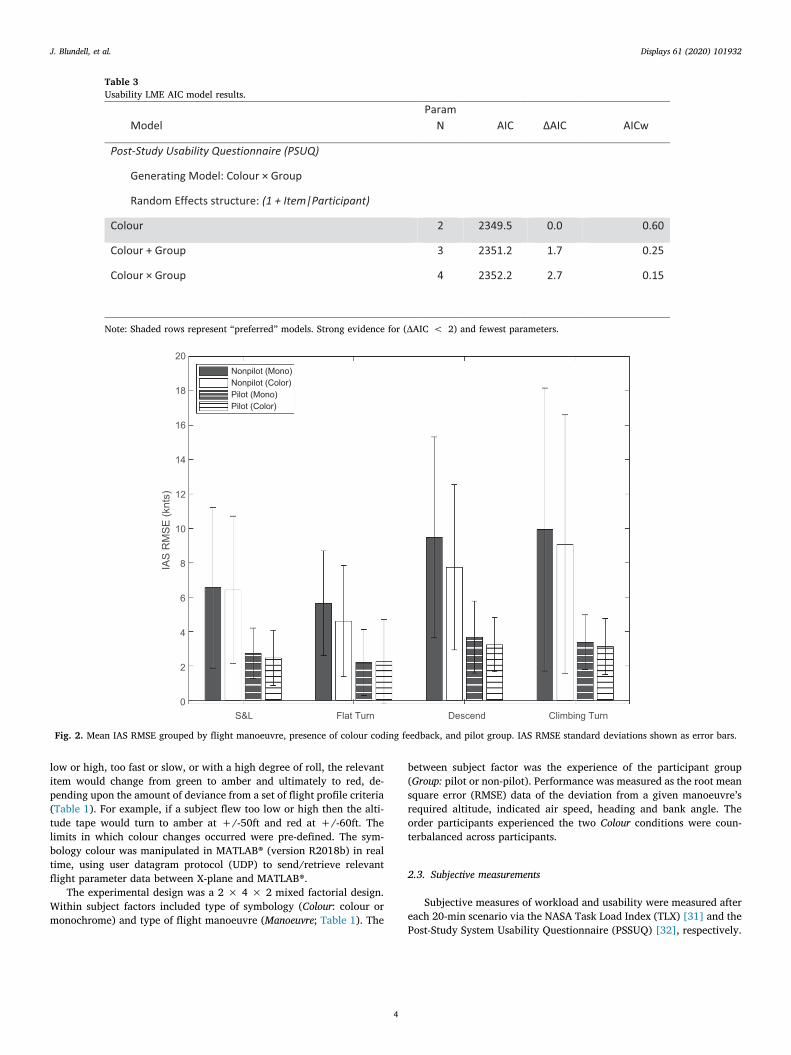
Table 3Usability LME AIC model results.
Note: Shaded rows represent “preferred” models. Strong evidence for (ΔAIC < 2) and fewest parameters.
Fig. 2. Mean IAS RMSE grouped by flight manoeuvre, presence of colour coding feedback, and pilot group. IAS RMSE standard deviations shown as error bars.
J. Blundell, et al. Displays 61 (2020) 101932
4
S&L Flat Turn Descend Climbing Turn-2
0
2
4
6
8
10
12
BN
K R
MS
E (D
eg)
Nonpilot (Mono)Nonpilot (Color)Pilot (Mono)Pilot (Color)
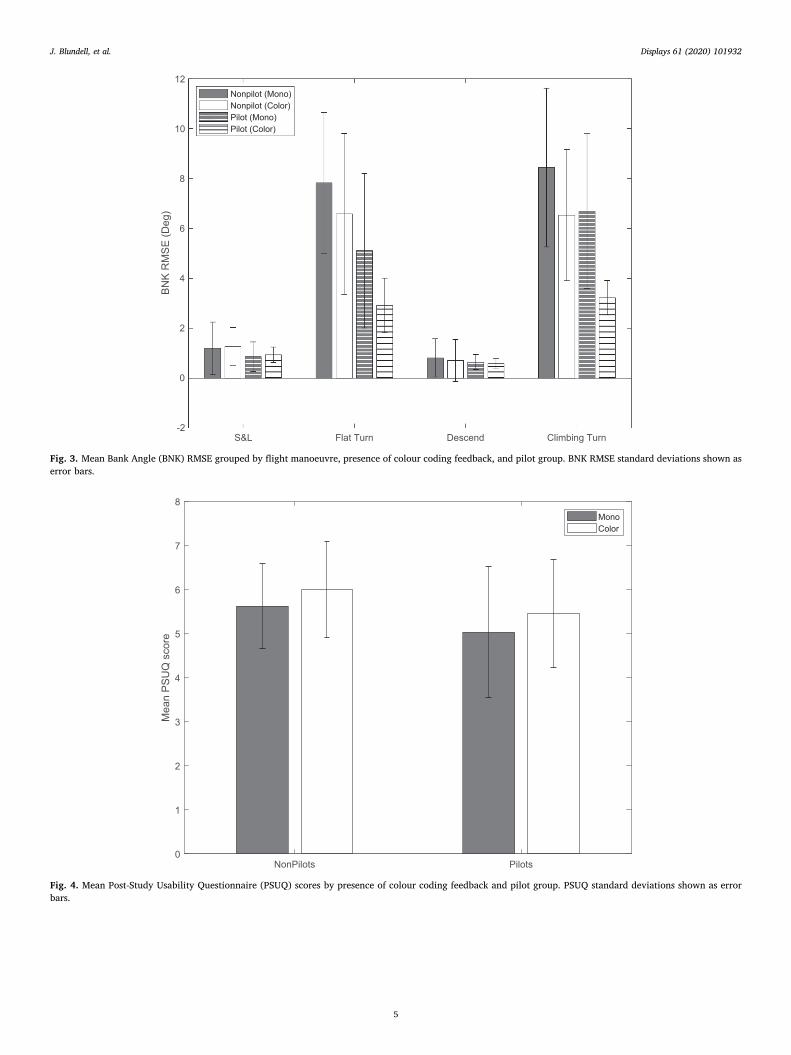
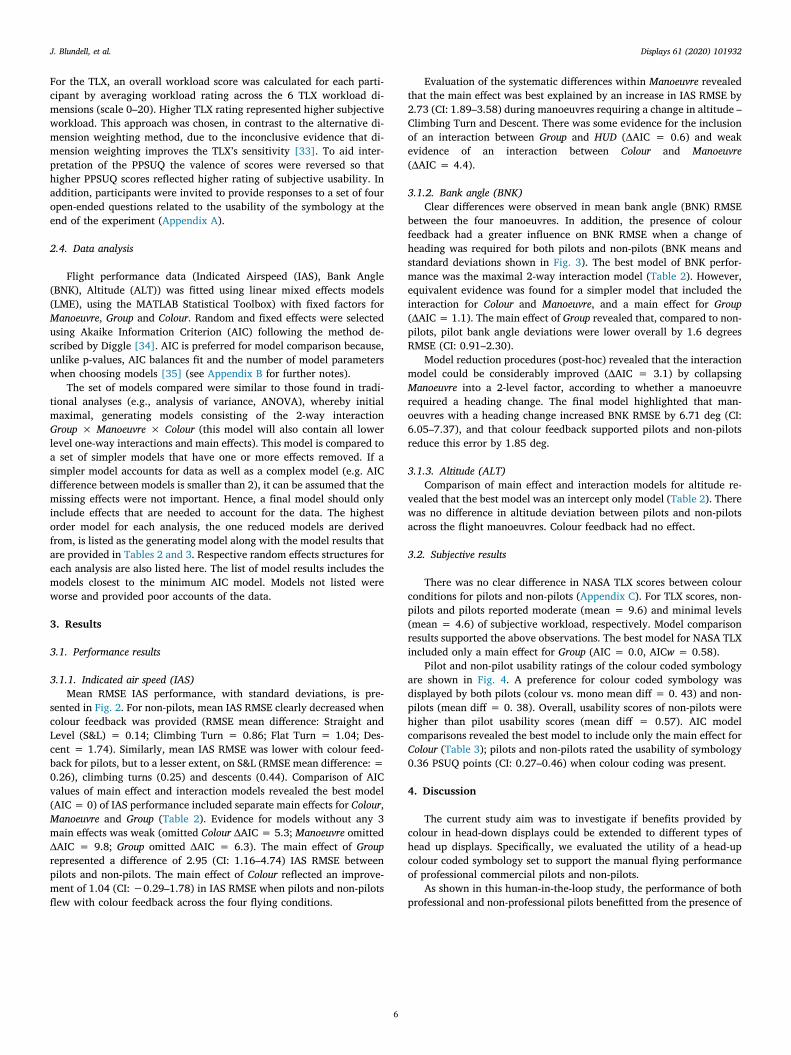
Fig. 3. Mean Bank Angle (BNK) RMSE grouped by flight manoeuvre, presence of colour coding feedback, and pilot group. BNK RMSE standard deviations shown aserror bars.
NonPilots Pilots0
1
2
3
4
5
6
7
8
Mea
nP
SU
Qsc
ore
MonoColor
Fig. 4. Mean Post-Study Usability Questionnaire (PSUQ) scores by presence of colour coding feedback and pilot group. PSUQ standard deviations shown as errorbars.
J. Blundell, et al. Displays 61 (2020) 101932
5
For the TLX, an overall workload score was calculated for each parti-cipant by averaging workload rating across the 6 TLX workload di-mensions (scale 0–20). Higher TLX rating represented higher subjectiveworkload. This approach was chosen, in contrast to the alternative di-mension weighting method, due to the inconclusive evidence that di-mension weighting improves the TLX’s sensitivity [33]. To aid inter-pretation of the PPSUQ the valence of scores were reversed so thathigher PPSUQ scores reflected higher rating of subjective usability. Inaddition, participants were invited to provide responses to a set of fouropen-ended questions related to the usability of the symbology at theend of the experiment (Appendix A).
2.4. Data analysis
Flight performance data (Indicated Airspeed (IAS), Bank Angle(BNK), Altitude (ALT)) was fitted using linear mixed effects models(LME), using the MATLAB Statistical Toolbox) with fixed factors forManoeuvre, Group and Colour. Random and fixed effects were selectedusing Akaike Information Criterion (AIC) following the method de-scribed by Diggle [34]. AIC is preferred for model comparison because,unlike p-values, AIC balances fit and the number of model parameterswhen choosing models [35] (see Appendix B for further notes).
The set of models compared were similar to those found in tradi-tional analyses (e.g., analysis of variance, ANOVA), whereby initialmaximal, generating models consisting of the 2-way interactionGroup × Manoeuvre × Colour (this model will also contain all lowerlevel one-way interactions and main effects). This model is compared toa set of simpler models that have one or more effects removed. If asimpler model accounts for data as well as a complex model (e.g. AICdifference between models is smaller than 2), it can be assumed that themissing effects were not important. Hence, a final model should onlyinclude effects that are needed to account for the data. The highestorder model for each analysis, the one reduced models are derivedfrom, is listed as the generating model along with the model results thatare provided in Tables 2 and 3. Respective random effects structures foreach analysis are also listed here. The list of model results includes themodels closest to the minimum AIC model. Models not listed wereworse and provided poor accounts of the data.
3. Results
3.1. Performance results
3.1.1. Indicated air speed (IAS)Mean RMSE IAS performance, with standard deviations, is pre-
sented in Fig. 2. For non-pilots, mean IAS RMSE clearly decreased whencolour feedback was provided (RMSE mean difference: Straight andLevel (S&L) = 0.14; Climbing Turn = 0.86; Flat Turn = 1.04; Des-cent = 1.74). Similarly, mean IAS RMSE was lower with colour feed-back for pilots, but to a lesser extent, on S&L (RMSE mean difference: =0.26), climbing turns (0.25) and descents (0.44). Comparison of AICvalues of main effect and interaction models revealed the best model(AIC = 0) of IAS performance included separate main effects for Colour,Manoeuvre and Group (Table 2). Evidence for models without any 3main effects was weak (omitted Colour ΔAIC = 5.3; Manoeuvre omittedΔAIC = 9.8; Group omitted ΔAIC = 6.3). The main effect of Grouprepresented a difference of 2.95 (CI: 1.16–4.74) IAS RMSE betweenpilots and non-pilots. The main effect of Colour reflected an improve-ment of 1.04 (CI: −0.29–1.78) in IAS RMSE when pilots and non-pilotsflew with colour feedback across the four flying conditions.
Evaluation of the systematic differences within Manoeuvre revealedthat the main effect was best explained by an increase in IAS RMSE by2.73 (CI: 1.89–3.58) during manoeuvres requiring a change in altitude –Climbing Turn and Descent. There was some evidence for the inclusionof an interaction between Group and HUD (ΔAIC = 0.6) and weakevidence of an interaction between Colour and Manoeuvre(ΔAIC = 4.4).
3.1.2. Bank angle (BNK)Clear differences were observed in mean bank angle (BNK) RMSE
between the four manoeuvres. In addition, the presence of colourfeedback had a greater influence on BNK RMSE when a change ofheading was required for both pilots and non-pilots (BNK means andstandard deviations shown in Fig. 3). The best model of BNK perfor-mance was the maximal 2-way interaction model (Table 2). However,equivalent evidence was found for a simpler model that included theinteraction for Colour and Manoeuvre, and a main effect for Group(ΔAIC = 1.1). The main effect of Group revealed that, compared to non-pilots, pilot bank angle deviations were lower overall by 1.6 degreesRMSE (CI: 0.91–2.30).
Model reduction procedures (post-hoc) revealed that the interactionmodel could be considerably improved (ΔAIC = 3.1) by collapsingManoeuvre into a 2-level factor, according to whether a manoeuvrerequired a heading change. The final model highlighted that man-oeuvres with a heading change increased BNK RMSE by 6.71 deg (CI:6.05–7.37), and that colour feedback supported pilots and non-pilotsreduce this error by 1.85 deg.
3.1.3. Altitude (ALT)Comparison of main effect and interaction models for altitude re-
vealed that the best model was an intercept only model (Table 2). Therewas no difference in altitude deviation between pilots and non-pilotsacross the flight manoeuvres. Colour feedback had no effect.
3.2. Subjective results
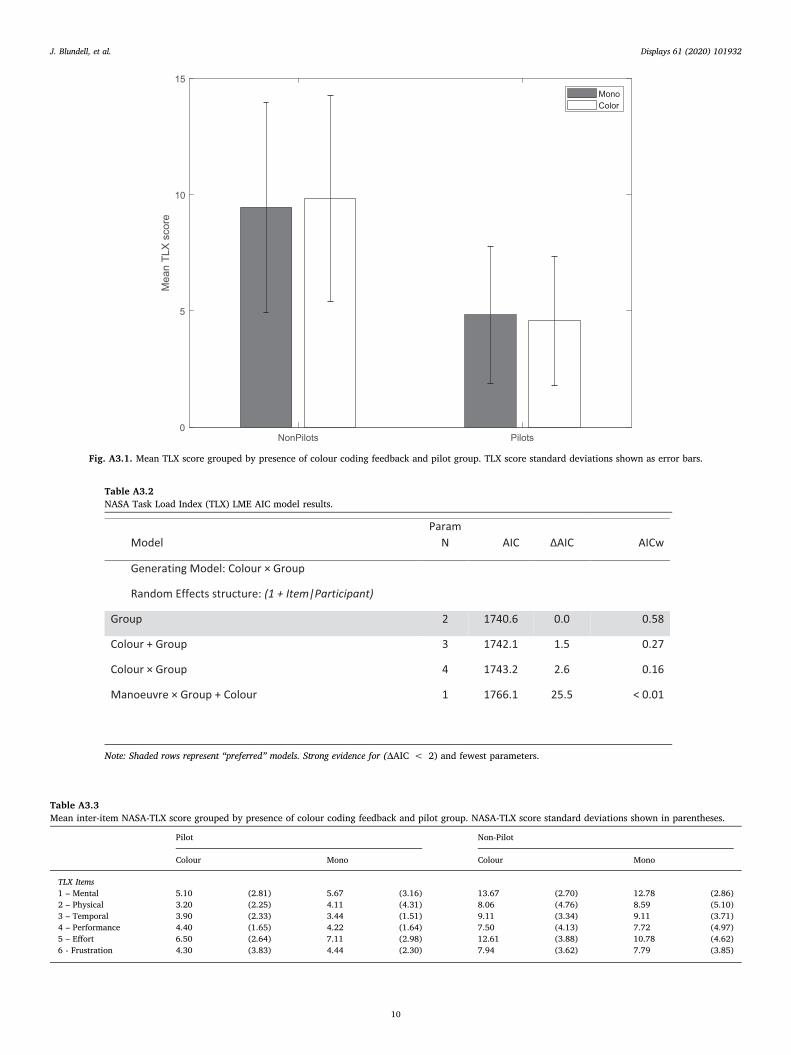
There was no clear difference in NASA TLX scores between colourconditions for pilots and non-pilots (Appendix C). For TLX scores, non-pilots and pilots reported moderate (mean = 9.6) and minimal levels(mean = 4.6) of subjective workload, respectively. Model comparisonresults supported the above observations. The best model for NASA TLXincluded only a main effect for Group (AIC = 0.0, AICw = 0.58).
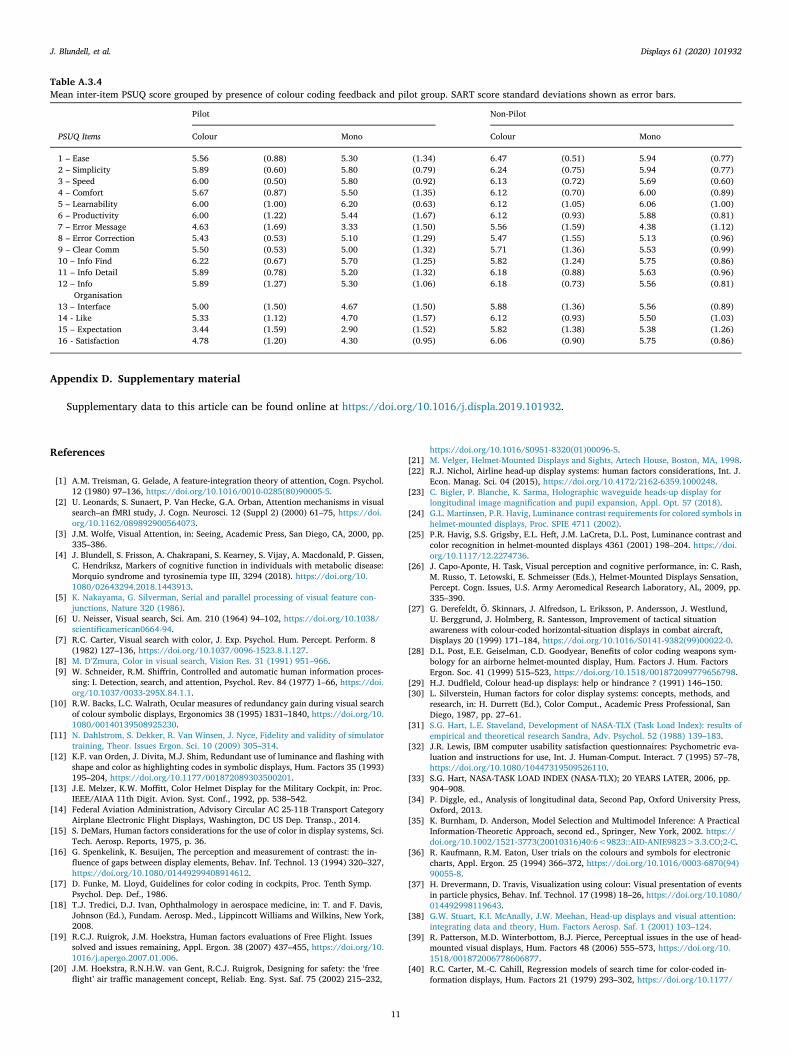
Pilot and non-pilot usability ratings of the colour coded symbologyare shown in Fig. 4. A preference for colour coded symbology wasdisplayed by both pilots (colour vs. mono mean diff = 0. 43) and non-pilots (mean diff = 0. 38). Overall, usability scores of non-pilots werehigher than pilot usability scores (mean diff = 0.57). AIC modelcomparisons revealed the best model to include only the main effect forColour (Table 3); pilots and non-pilots rated the usability of symbology0.36 PSUQ points (CI: 0.27–0.46) when colour coding was present.
4. Discussion
The current study aim was to investigate if benefits provided bycolour in head-down displays could be extended to different types ofhead up displays. Specifically, we evaluated the utility of a head-upcolour coded symbology set to support the manual flying performanceof professional commercial pilots and non-pilots.
As shown in this human-in-the-loop study, the performance of bothprofessional and non-professional pilots benefitted from the presence of
J. Blundell, et al. Displays 61 (2020) 101932
6
a colour coded symbology set. Specifically, colour coding of the bankindicator and airspeed tape minimised error during turning and altitudechange manoeuvres, respectively. Therefore, the use of colour served acognitive purpose beyond only facilitating the learning process in anovice group [30]. In agreement with Dudfield [29], colour coding didnot improve either professional or non-professional pilot performanceduring straight and level flight. The specificity of the performancebenefits associated with manoeuvres that require a change of headingand/or altitude is likely to be due to their increased complexity overstraight and level flight. In contrast to a wings-level profile, pilots arerequired to monitor one or more dynamic flight parameters (e.g. theaircraft’s current heading during a heading change) whilst maintainingother static parameters (e.g. airspeed and/or bank angle). In this con-text, where pilots are deploying more attentional focus to dynamicflight parameter, colour feedback may support the relocation of atten-tion to neglected static parameters whenever their associated errormargins are breached. Essentially, neglected parameters “pop-out” ofthe display when colour coding feedback is provided. The functionalbenefit of colour in this regard has been reported widely in the visualattention literature [1–5]. Indeed, in the post-study usability survey themajority of professional and non-professional pilots highlighted thevalue of colour in supporting the shifting of attention during instanceswhere the integrity of their scan pattern had deteriorated.
NASA TLX scores indicated that pilots and non-pilots reportedminimal and moderate levels of workload on the current task, respec-tively. However, while participant flight performance benefitted fromthe presence of colour feedback, these benefits occurred in isolation ofany reported subjective workload benefit. A possibility for this outcomeis that participants were required to report their average workloadexperienced over the entire flight scenario. Since the colour related-performance gains were manoeuvre specific, any associated workloadbenefits may have been masked with this averaging approach.Alternatively, the current task did not sufficiently challenge pilots inorder to produce a discernible change in experienced work load. InDudfield’s HUD colour study [29], workload benefits were reported fora flying task which included a secondary task. Therefore, future studiesshould evaluate the value of colour coding during scenarios that includea greater emphasis on visual attention and planning (e.g. taxing, pre-cision approach and landing), and/or include a secondary task to si-mulate information processing burden.
Participant subjective usability ratings revealed a preference for thecolour coding format. This supports the large body of research thatsuggests colour enhances usability of avionic displays. For example,Kaufmann and Eaton [36] found that the users preferred the in-troduction of colour coding into an established radar navigation system.Colour has also benefited systems used in visualising experiments inphysics [37]. Overall, the aesthetic qualities associated with colourappear to appeal to the user, and they tend to express preferences forcolour over monochromatic displays.
A consideration of how colour coding effects attentional capture isimportant, where attention is allocated to one source of visual in-formation at the expense of others, to the detriment of performance[38]. In the context of HUDs and HMDs, attentional capture has beenassociated with instances where the pilot neglects far-domain in-formation to attend to the more compelling near domain flight sym-bology. The likelihood of attentional capture occurring has been shownto increase as a function of the degree of experienced perceptual load,the likelihood of an expected event, and the salience/compelling natureof the symbology [38]. For the latter, according to feature integrationtheory [1–3,5], colour implementation on a HUD and HMD would
substantial increase the salience of near domain symbology informa-tion. Therefore, future research will need to examine whether the im-plementation of colour impacts the prevalence of the attentional cap-ture effects. In particular, understanding how the introduction ofcolour-coded head-up symbology might influence the risk of missingunexpected events during high workload flight tasks, for examplerunway incursion detection whilst landing in high turbulence.
Notwithstanding the attentional factors mentioned above, the cur-rent low-fidelity study did not consider the impact of other aspects thatare important in the visual processing of HUD and HMD symbology.Issues relating to brightness and contrast are key considerations forHUD and HMD systems as these directly influence the visual perceptionof the symbols and information being presented [39]. Other issues re-lated to HUD and HMD visual processing, while outside of scope for thisstudy, should also be considered in future higher fidelity research; suchas depth of field, focal distance, visual acuity, eye box and off-axisviewing.
Colour could also have deleterious effects if overused. For example,Carter and Cahill [40] warned against the adverse effects of the ‘un-restrained use’ of irrelevant colour and argued that it could interferewith the processing of other symbol dimensions (especially when thistype of coding antagonised the other symbol features). Similarly,Teichner [41] found that instead of improving performance, too muchuse of colour increased mental workload and the incidence of visualstrain [42,43]. Further research by Nagy and Sanchez [44] showed thatsearch times were slower when the number of colours was increased.Indeed, McFadden, Kaufmann, and Janzen [45] suggested that shifts incolour appearance (as a function of surround colours) impaired theaccurate interpretation of information and suggested the use of limitedcolour combinations. This suggestion is echoed by the FAA, who adviseimplementing a restricted set of colours on displays in order to avoidmany of the above effects (FAA Advisory circular: 25-11B [14]).Nevertheless, it will be important for future research to discern theoptimal set size for colour coding head-up symbology that simulta-neously maximises performance and minimises pilot workload.
5. Conclusion and recommendations
The main finding of this study was that head-up colour codedsymbology improved the performance of both professional commercialpilots and non-professional pilots during a low workload manual flyingtask. Specifically, colour coding of the bank indicator and airspeed tapeminimised error during turning and altitude change manoeuvres, re-spectively. In this context, such a finding has not been previously re-ported. Despite the absence of a colour-related workload improvement,the results of this study provide an encouraging basis for the futurereview of FAA HUD design guidelines regarding the design and devel-opment of HUD/HMD colour implementation (FAA Advisory circular:25-11B (Federal Aviation Administration, 2014)). Pertinent questionsremain regarding where and how head-up colour coding would be bestutilised in-flight deck operations. In particular, the benefit of colourcoding needs to be examined during high workload flight conditionsthat place emphasis on visual attention and planning (e.g. taxiing,precision approach and landing). In addition, higher fidelity evalua-tions of how head-up colour coding interacts with attentional captureeffects must be addressed, specifically, would colour coding promotethe allocation of attentional resources to near domain information atthe detriment of far domain information?
J. Blundell, et al. Displays 61 (2020) 101932
7
Funding
This work was supported by Innovate UK, the UK’s InnovationAgency, with support from the UK Aerospace Technology Institute(grant reference number 113108).
Declaration of Competing Interest
The authors declare that they have no known competing financialinterests or personal relationships that could have appeared to influ-ence the work reported in this paper.
Acknowledgements
This article is based on work performed in the programme: OpenFlight Deck, which has received funding from Innovate UK programme,the UK’s Innovation Agency, with support from the UK AerospaceTechnology Institute (grant reference number 113108). The views andopinions expressed in this paper are those of the authors and are notintended to represent the position or opinions of the Open Flight Deckconsortium or any of the individual partner organisations.
Appendix A. Symbology usability survey
J. Blundell, et al. Displays 61 (2020) 101932
8
Appendix B. AIC LME analysis notes
Model selection using AIC is different from that using p-values, but not difficult to understand. AIC is preferred for model comparison because,unlike p-values, AIC balances fit and the number of model parameters when choosing models. In brief, better models produce smaller AIC values, butthe absolute AIC values are not interpretable. Instead, the change in AIC (ΔAIC) between models is meaningful and captures the weight of evidencefor each model (rather than being subject to a cut-off, like p-values). Evidence for a model starts to be clear if the ΔAIC exceeds 2. If ΔAIC betweenthe “best” model and alternative models is less than 2 then the two models are substantially equivalent. When ΔAIC is between 2 and 10 there isdecreasing support for an alternative model. A model with a ΔAIC > 10 has essentially no support. For models where the ΔAIC is less than 2, it isreasonable to favour the least complex model (i.e. model with fewest parameters/variables). Favoured models contain terms that are important inaccounting for data. This is parallel to significant effects in an analysis using hypothesis testing. For example, if a highly rated model has a term forgroup but no interaction, this is parallel to a significant main effect of group and a non-significant interaction. Comparisons can be assisted bycalculating Akaike weights (AICw; Burnham & Anderson, 2002). AICw expresses the relative probability that a model is the best in a particular set,considering only the models from that set. It measures the weight of evidence for the models being compared. When values are relatively equal acrosstwo or more models, they are all relatively good models of the data. If one model has a high value, and the others are low, there is a model that isclearly better.
Appendix C. Subjective workload and situation awareness figures/tables and AIC model results
See Fig. A3.1 and Tables A3.2–A3.4.
J. Blundell, et al. Displays 61 (2020) 101932
9
NonPilots Pilots0
5
10
15
Mea
n TL
X s
core
MonoColor
Fig. A3.1. Mean TLX score grouped by presence of colour coding feedback and pilot group. TLX score standard deviations shown as error bars.
Table A3.2NASA Task Load Index (TLX) LME AIC model results.
Note: Shaded rows represent “preferred” models. Strong evidence for (ΔAIC < 2) and fewest parameters.
Table A3.3Mean inter-item NASA-TLX score grouped by presence of colour coding feedback and pilot group. NASA-TLX score standard deviations shown in parentheses.
Pilot Non-Pilot
Colour Mono Colour Mono
TLX Items1 – Mental 5.10 (2.81) 5.67 (3.16) 13.67 (2.70) 12.78 (2.86)2 – Physical 3.20 (2.25) 4.11 (4.31) 8.06 (4.76) 8.59 (5.10)3 – Temporal 3.90 (2.33) 3.44 (1.51) 9.11 (3.34) 9.11 (3.71)4 – Performance 4.40 (1.65) 4.22 (1.64) 7.50 (4.13) 7.72 (4.97)5 – Effort 6.50 (2.64) 7.11 (2.98) 12.61 (3.88) 10.78 (4.62)6 - Frustration 4.30 (3.83) 4.44 (2.30) 7.94 (3.62) 7.79 (3.85)
J. Blundell, et al. Displays 61 (2020) 101932
10
Appendix D. Supplementary material
Supplementary data to this article can be found online at https://doi.org/10.1016/j.displa.2019.101932.
References
[1] A.M. Treisman, G. Gelade, A feature-integration theory of attention, Cogn. Psychol.12 (1980) 97–136, https://doi.org/10.1016/0010-0285(80)90005-5.
[2] U. Leonards, S. Sunaert, P. Van Hecke, G.A. Orban, Attention mechanisms in visualsearch–an fMRI study, J. Cogn. Neurosci. 12 (Suppl 2) (2000) 61–75, https://doi.org/10.1162/089892900564073.
[3] J.M. Wolfe, Visual Attention, in: Seeing, Academic Press, San Diego, CA, 2000, pp.335–386.
[4] J. Blundell, S. Frisson, A. Chakrapani, S. Kearney, S. Vijay, A. Macdonald, P. Gissen,C. Hendriksz, Markers of cognitive function in individuals with metabolic disease:Morquio syndrome and tyrosinemia type III, 3294 (2018). https://doi.org/10.1080/02643294.2018.1443913.
[5] K. Nakayama, G. Silverman, Serial and parallel processing of visual feature con-junctions, Nature 320 (1986).
[6] U. Neisser, Visual search, Sci. Am. 210 (1964) 94–102, https://doi.org/10.1038/scientificamerican0664-94.
[7] R.C. Carter, Visual search with color, J. Exp. Psychol. Hum. Percept. Perform. 8(1982) 127–136, https://doi.org/10.1037/0096-1523.8.1.127.
[8] M. D’Zmura, Color in visual search, Vision Res. 31 (1991) 951–966.[9] W. Schneider, R.M. Shiffrin, Controlled and automatic human information proces-
sing: I. Detection, search, and attention, Psychol. Rev. 84 (1977) 1–66, https://doi.org/10.1037/0033-295X.84.1.1.
[10] R.W. Backs, L.C. Walrath, Ocular measures of redundancy gain during visual searchof colour symbolic displays, Ergonomics 38 (1995) 1831–1840, https://doi.org/10.1080/00140139508925230.
[11] N. Dahlstrom, S. Dekker, R. Van Winsen, J. Nyce, Fidelity and validity of simulatortraining, Theor. Issues Ergon. Sci. 10 (2009) 305–314.
[12] K.F. van Orden, J. Divita, M.J. Shim, Redundant use of luminance and flashing withshape and color as highlighting codes in symbolic displays, Hum. Factors 35 (1993)195–204, https://doi.org/10.1177/001872089303500201.
[13] J.E. Melzer, K.W. Moffitt, Color Helmet Display for the Military Cockpit, in: Proc.IEEE/AIAA 11th Digit. Avion. Syst. Conf., 1992, pp. 538–542.
[14] Federal Aviation Administration, Advisory Circular AC 25-11B Transport CategoryAirplane Electronic Flight Displays, Washington, DC US Dep. Transp., 2014.
[15] S. DeMars, Human factors considerations for the use of color in display systems, Sci.Tech. Aerosp. Reports, 1975, p. 36.
[16] G. Spenkelink, K. Besuijen, The perception and measurement of contrast: the in-fluence of gaps between display elements, Behav. Inf. Technol. 13 (1994) 320–327,https://doi.org/10.1080/01449299408914612.
[17] D. Funke, M. Lloyd, Guidelines for color coding in cockpits, Proc. Tenth Symp.Psychol. Dep. Def., 1986.
[18] T.J. Tredici, D.J. Ivan, Ophthalmology in aerospace medicine, in: T. and F. Davis,Johnson (Ed.), Fundam. Aerosp. Med., Lippincott Williams and Wilkins, New York,2008.
[19] R.C.J. Ruigrok, J.M. Hoekstra, Human factors evaluations of Free Flight. Issuessolved and issues remaining, Appl. Ergon. 38 (2007) 437–455, https://doi.org/10.1016/j.apergo.2007.01.006.
[20] J.M. Hoekstra, R.N.H.W. van Gent, R.C.J. Ruigrok, Designing for safety: the ‘freeflight’ air traffic management concept, Reliab. Eng. Syst. Saf. 75 (2002) 215–232,
https://doi.org/10.1016/S0951-8320(01)00096-5.[21] M. Velger, Helmet-Mounted Displays and Sights, Artech House, Boston, MA, 1998.[22] R.J. Nichol, Airline head-up display systems: human factors considerations, Int. J.
Econ. Manag. Sci. 04 (2015), https://doi.org/10.4172/2162-6359.1000248.[23] C. Bigler, P. Blanche, K. Sarma, Holographic waveguide heads-up display for
longitudinal image magnification and pupil expansion, Appl. Opt. 57 (2018).[24] G.L. Martinsen, P.R. Havig, Luminance contrast requirements for colored symbols in
helmet-mounted displays, Proc. SPIE 4711 (2002).[25] P.R. Havig, S.S. Grigsby, E.L. Heft, J.M. LaCreta, D.L. Post, Luminance contrast and
color recognition in helmet-mounted displays 4361 (2001) 198–204. https://doi.org/10.1117/12.2274736.
[26] J. Capo-Aponte, H. Task, Visual perception and cognitive performance, in: C. Rash,M. Russo, T. Letowski, E. Schmeisser (Eds.), Helmet-Mounted Displays Sensation,Percept. Cogn. Issues, U.S. Army Aeromedical Research Laboratory, AL, 2009, pp.335–390.
[27] G. Derefeldt, Ö. Skinnars, J. Alfredson, L. Eriksson, P. Andersson, J. Westlund,U. Berggrund, J. Holmberg, R. Santesson, Improvement of tactical situationawareness with colour-coded horizontal-situation displays in combat aircraft,Displays 20 (1999) 171–184, https://doi.org/10.1016/S0141-9382(99)00022-0.
[28] D.L. Post, E.E. Geiselman, C.D. Goodyear, Benefits of color coding weapons sym-bology for an airborne helmet-mounted display, Hum. Factors J. Hum. FactorsErgon. Soc. 41 (1999) 515–523, https://doi.org/10.1518/001872099779656798.
[29] H.J. Dudfield, Colour head-up displays: help or hindrance ? (1991) 146–150.[30] L. Silverstein, Human factors for color display systems: concepts, methods, and
research, in: H. Durrett (Ed.), Color Comput., Academic Press Professional, SanDiego, 1987, pp. 27–61.
[31] S.G. Hart, L.E. Staveland, Development of NASA-TLX (Task Load Index): results ofempirical and theoretical research Sandra, Adv. Psychol. 52 (1988) 139–183.
[32] J.R. Lewis, IBM computer usability satisfaction questionnaires: Psychometric eva-luation and instructions for use, Int. J. Human-Comput. Interact. 7 (1995) 57–78,https://doi.org/10.1080/10447319509526110.
[33] S.G. Hart, NASA-TASK LOAD INDEX (NASA-TLX); 20 YEARS LATER, 2006, pp.904–908.
[34] P. Diggle, ed., Analysis of longitudinal data, Second Pap, Oxford University Press,Oxford, 2013.
[35] K. Burnham, D. Anderson, Model Selection and Multimodel Inference: A PracticalInformation-Theoretic Approach, second ed., Springer, New York, 2002. https://doi.org/10.1002/1521-3773(20010316)40:6<9823::AID-ANIE9823>3.3.CO;2-C.
[36] R. Kaufmann, R.M. Eaton, User trials on the colours and symbols for electroniccharts, Appl. Ergon. 25 (1994) 366–372, https://doi.org/10.1016/0003-6870(94)90055-8.
[37] H. Drevermann, D. Travis, Visualization using colour: Visual presentation of eventsin particle physics, Behav. Inf. Technol. 17 (1998) 18–26, https://doi.org/10.1080/014492998119643.
[38] G.W. Stuart, K.I. McAnally, J.W. Meehan, Head-up displays and visual attention:integrating data and theory, Hum. Factors Aerosp. Saf. 1 (2001) 103–124.
[39] R. Patterson, M.D. Winterbottom, B.J. Pierce, Perceptual issues in the use of head-mounted visual displays, Hum. Factors 48 (2006) 555–573, https://doi.org/10.1518/001872006778606877.
[40] R.C. Carter, M.-C. Cahill, Regression models of search time for color-coded in-formation displays, Hum. Factors 21 (1979) 293–302, https://doi.org/10.1177/
Table A.3.4Mean inter-item PSUQ score grouped by presence of colour coding feedback and pilot group. SART score standard deviations shown as error bars.
Pilot Non-Pilot
PSUQ Items Colour Mono Colour Mono
1 – Ease 5.56 (0.88) 5.30 (1.34) 6.47 (0.51) 5.94 (0.77)2 – Simplicity 5.89 (0.60) 5.80 (0.79) 6.24 (0.75) 5.94 (0.77)3 – Speed 6.00 (0.50) 5.80 (0.92) 6.13 (0.72) 5.69 (0.60)4 – Comfort 5.67 (0.87) 5.50 (1.35) 6.12 (0.70) 6.00 (0.89)5 – Learnability 6.00 (1.00) 6.20 (0.63) 6.12 (1.05) 6.06 (1.00)6 – Productivity 6.00 (1.22) 5.44 (1.67) 6.12 (0.93) 5.88 (0.81)7 – Error Message 4.63 (1.69) 3.33 (1.50) 5.56 (1.59) 4.38 (1.12)8 – Error Correction 5.43 (0.53) 5.10 (1.29) 5.47 (1.55) 5.13 (0.96)9 – Clear Comm 5.50 (0.53) 5.00 (1.32) 5.71 (1.36) 5.53 (0.99)10 – Info Find 6.22 (0.67) 5.70 (1.25) 5.82 (1.24) 5.75 (0.86)11 – Info Detail 5.89 (0.78) 5.20 (1.32) 6.18 (0.88) 5.63 (0.96)12 – Info
Organisation5.89 (1.27) 5.30 (1.06) 6.18 (0.73) 5.56 (0.81)
13 – Interface 5.00 (1.50) 4.67 (1.50) 5.88 (1.36) 5.56 (0.89)14 - Like 5.33 (1.12) 4.70 (1.57) 6.12 (0.93) 5.50 (1.03)15 – Expectation 3.44 (1.59) 2.90 (1.52) 5.82 (1.38) 5.38 (1.26)16 - Satisfaction 4.78 (1.20) 4.30 (0.95) 6.06 (0.90) 5.75 (0.86)
J. Blundell, et al. Displays 61 (2020) 101932
11
001872087902100304.[41] W.H. Teichner, Temporal measurement of input and output processes in short/term
memory, J. Gen. Psychol. 101 (1979) 279–305, https://doi.org/10.1080/00221309.1979.9920082.
[42] M. Bruce, J.J. Foster, The visibility of colored characters on colored backgrounds inviewdata displays, Visible Lang. 4 (1982) 382–390.
[43] M.L. Matthews, The influence of colour on CRT reading performance and subjective
comfort under operational conditions, Appl. Ergon. 18 (1987) 323–328.[44] A.L. Nagy, R.R. Sanchez, Chromaticity and luminance as coding dimensions in vi-
sual search, Hum. Factors 34 (1992) 601–614, https://doi.org/10.1177/001872089203400507.
[45] S. McFadden, R. Kaufmann, M. Janzen, Classification of colours presented againstdifferent coloured backgrounds, Displays 15 (1994) 203–214, https://doi.org/10.1016/0141-9382(94)90069-8.
J. Blundell, et al. Displays 61 (2020) 101932
12