
Wishart Formation. The Wishart Formation is a sandstone ... · Wishart Formation. The Wishart...
21
REPORT 1045934 December 19, 2008 71 Wishart Formation. The Wishart Formation is a sandstone formation (quartzite and arkose) cemented by quartz and minor amounts of hematite and other iron oxides. It well differentiated from the iron ore bearing overlaying formations by its texture and color. Ruth Formation. It is a black, grey-green or maroon ferruginous slate, 3 to 36 metres thick. This thinly banded material contains lenses of black chert and various amounts of iron ore. Sokoman Formation – More than 80 percent of the ore in the Knob Lake Range occurs within this formation. Lithologically the iron formation varies in detail in different parts of the range and the thickness of individual members is not consistent. A thinly bedded, slatey facies at the base of the formation consists largely of fine chert with an abundance of iron silicates and disseminated magnetite and siderite. Fresh surfaces are grey to olive green, and weathered surfaces brownish yellow to bright orange. Thin-banded oxide facies of iron formation occurs above the silicate-carbonate facies in nearly all parts of the area. The thin (<1.25cm) jasper bands are mostly deep red, but in some places are greenish yellow to grey, and are interbanded with hard, blue layers of fine-grained hematite and a minor magnetite. The thin jasper beds are located underneath thick massive beds of grey to pinkish chert and beds that are very rich in blue and black iron oxides, and make up most of the Sokoman Formation. The upper part of the Sokoman Formation comprises discontinuous beds of dull green to grey or black massive chert. Menihek Formation – A thin-banded, grey to black argillaceous slate conformably overlies the Sokoman Formation in the Knob Lake area. Thicknesses are unknown since the slate is found in faulted blocks in the main ore zone. 4.1.4.3 Regional Mineralization The earthy bedded iron deposits are a residually enriched type within the Sokoman iron formation that formed after two periods of intense folding and faulting, followed by the circulation of meteoric waters in the fractured rocks. The enrichment process was caused largely by leaching and the loss of silica, resulting in a strong increase in porosity. This produced a friable, granular and earthy-textured iron ore. The siderite and silica minerals were altered to hydrated oxides of goethite and limonite. The second stage of enrichment included the addition of secondary iron and manganese which appear to have moved in solution and filled pore spaces with limonite-goethite. Secondary manganese minerals, i.e., pyrolusite and manganite, form veinlets and vuggy pockets. The types of iron ores developed in the deposits are directly related to the original mineral facies. The predominant blue granular ore was formed from the oxide facies of the middle iron formation. The yellowish-brown ore, composed of limonite-goethite, formed from the carbonate-silicate facies, and the red painty hematite ore originated from mixed facies in the argillaceous slaty members. The overall ratio of blue to yellow to red ore is approximately 70:15:15. The proportion of each varies widely within the deposits. Only the direct shipping ore is considered beneficiable to produce lumps and sinter feed and will be part of the resources for the LIM Project. The direct shipping ore was classified by IOC in six categories based on their chemical, mineralogical and textural compositions. This classification is still used in the evaluation of the mineralization. The following six ore categories and two other mineralization categories not part of the potential economic mineralization, are: • High Non-Bessemer (HNB)
Transcript of Wishart Formation. The Wishart Formation is a sandstone ... · Wishart Formation. The Wishart...

REPORT 1045934 December 19, 2008 71
Wishart Formation. The Wishart Formation is a sandstone formation (quartzite and arkose) cemented by quartz and minor amounts of hematite and other iron oxides. It well differentiated from the iron ore bearing overlaying formations by its texture and color.
Ruth Formation. It is a black, grey-green or maroon ferruginous slate, 3 to 36 metres thick. This thinly banded material contains lenses of black chert and various amounts of iron ore.
Sokoman Formation – More than 80 percent of the ore in the Knob Lake Range occurs within this formation. Lithologically the iron formation varies in detail in different parts of the range and the thickness of individual members is not consistent.
A thinly bedded, slatey facies at the base of the formation consists largely of fine chert with an abundance of iron silicates and disseminated magnetite and siderite. Fresh surfaces are grey to olive green, and weathered surfaces brownish yellow to bright orange. Thin-banded oxide facies of iron formation occurs above the silicate-carbonate facies in nearly all parts of the area. The thin (<1.25cm) jasper bands are mostly deep red, but in some places are greenish yellow to grey, and are interbanded with hard, blue layers of fine-grained hematite and a minor magnetite.
The thin jasper beds are located underneath thick massive beds of grey to pinkish chert and beds that are very rich in blue and black iron oxides, and make up most of the Sokoman Formation. The upper part of the Sokoman Formation comprises discontinuous beds of dull green to grey or black massive chert.
Menihek Formation – A thin-banded, grey to black argillaceous slate conformably overlies the Sokoman Formation in the Knob Lake area. Thicknesses are unknown since the slate is found in faulted blocks in the main ore zone.
4.1.4.3 Regional Mineralization
The earthy bedded iron deposits are a residually enriched type within the Sokoman iron formation that formed after two periods of intense folding and faulting, followed by the circulation of meteoric waters in the fractured rocks. The enrichment process was caused largely by leaching and the loss of silica, resulting in a strong increase in porosity. This produced a friable, granular and earthy-textured iron ore. The siderite and silica minerals were altered to hydrated oxides of goethite and limonite. The second stage of enrichment included the addition of secondary iron and manganese which appear to have moved in solution and filled pore spaces with limonite-goethite. Secondary manganese minerals, i.e., pyrolusite and manganite, form veinlets and vuggy pockets. The types of iron ores developed in the deposits are directly related to the original mineral facies. The predominant blue granular ore was formed from the oxide facies of the middle iron formation. The yellowish-brown ore, composed of limonite-goethite, formed from the carbonate-silicate facies, and the red painty hematite ore originated from mixed facies in the argillaceous slaty members. The overall ratio of blue to yellow to red ore is approximately 70:15:15. The proportion of each varies widely within the deposits.
Only the direct shipping ore is considered beneficiable to produce lumps and sinter feed and will be part of the resources for the LIM Project. The direct shipping ore was classified by IOC in six categories based on their chemical, mineralogical and textural compositions. This classification is still used in the evaluation of the mineralization. The following six ore categories and two other mineralization categories not part of the potential economic mineralization, are:
• High Non-Bessemer (HNB)

REPORT 1045934 December 19, 2008 72
• Lean Non Bessemer (LNB)
• High Silica (HiSiO2) (waste)
• Treat Rock (TRX) (waste but previously stockpiled for possible later treatment)
The blue ores, which are composed mainly of the minerals hematite and martite, are generally coarse grained and friable. They are usually found in the middle section of the iron formation.
The yellow ores, which are made up of the minerals limonite and goethite, are located in the lower section of the iron formation. These ores have the unfavourable characteristic of retaining high moisture content.
The red ore is predominantly a red earthy hematite. It forms the basal layer that underlies the lower section of the iron formation. Red ore is characterized by its clay and slate-like texture.
Direct shipping ores and lean ores mined in the Schefferville area during the period 1954-1982 amounted to some 150 million tons. Based on the original ore definition of IOC (+50% Fe <18% SiO2 dry basis), approximately 200 million tonnes of iron resources remain in the area, exclusive of magnetite taconite. LIM has acquired rights to approximately 50 percent of this remaining iron resource.
4.1.4.4 Deposit Types
The Labrador Trough contains four main types of iron deposits:
• soft iron ores formed by supergene leaching and enrichment of the weakly metamorphosed cherty iron formation; they are composed mainly of friable fine-grained secondary iron oxides (hematite, goethite, limonite).
• taconites, the fine-grained, weakly metamorphosed iron formations with above average magnetite content and which are also commonly called magnetite iron formation.
• more intensely metamorphosed, coarser-grained iron formations, termed metataconites which contain specular hematite and subordinate amounts of magnetite as the dominant iron minerals.
• minor occurrences of hard high-grade hematite ore occur southeast of Schefferville at Sawyer Lake, Astray Lake and in some of the Houston deposits.
The Labrador Iron Mountain deposits are composed of iron formations of the Lake Superior-type. The Lake Superior-type iron formation consists of banded sedimentary rocks composed principally of bands of iron oxides, magnetite and hematite within quartz (chert)-rich rock, with variable amounts of silicate, carbonate and sulphide lithofacies. Such iron formations have been the principal sources of iron throughout the world.
The Sokoman iron formation was formed as chemical sediment under varied conditions of oxidation-reduction potential (Eh) and hydrogen ion concentrations (pH) in varied depth of seawater. The resulting irregularly bedded, jasper-bearing, granular, oolite and locally conglomeratic sediments are typical of the predominant oxide facies of the Superior-type iron formations, and the Labrador Trough is the largest example of this type.
The facies changes consist commonly of carbonate, silicate and oxide facies. Typical sulphide facies are poorly developed. The mineralogy of the rocks is related to the change in facies during deposition, which reflects changes from shallow to deep-water environments of sedimentation. In general, the
REPORT 1045934 December 19, 2008 73
oxide facies are irregularly bedded, and locally conglomeratic, having formed in oxidizing shallow-water conditions. Most carbonate facies show deep-water features, except for the presence of minor amounts of granules. The silicate facies are present in between the oxide and carbonate facies, with some textural features indicating deep-water formation.
Each facies contains typical primary minerals, ranging from siderite, minnesotaite, and magnetite-hematite in the carbonate, silicate and oxide facies, respectively. The most common mineral in the Sokoman Formation is chert, which is closely associated with all facies, although it occurs in minor quantities with the silicate facies. Carbonate and silicate lithofacies are present in varying amounts in the oxide members.
The sediments of the Labrador Trough were initially deposited in a stable basin which was subsequently modified by penecontemporaneous tectonic and volcanic activity. Deposition of the iron formation indicates intraformational erosion, redistribution of sediments, and local contamination by volcanic and related clastic material derived from the volcanic centers in the Dyke-Astray area.
The consolidation of the sediments into cherty banded iron formation is due to diagenesis and low grade metamorphism which only reached the greenschist rank. The iron may be a product of erosion. It is unlikely that the Nimish volcanism made a significant contribution.
The Project currently involves the James North, James South and Redmond Deposits.
James Deposit
The James deposit is a northeast dipping elongated iron deposit with a direction of N330° in its main axis and it appears to be structurally and stratigraphically controlled. The stratigraphic units recorded in James area go from the Denault Formation to the Menihek Formation. The main volume of the mineralization is developed in the Middle Iron Formation (MIF) and lower portion of the Upper Iron Formation (UIF) both part of the Sokoman Formation.
The iron mineralization in the James deposit consist of thin layers (<10cms thick) of fine to medium grained steel blue hematite intercalated with minor cherty silica bands <5cms thick dipping 30° to 45° to the northeast. The James mine mineralization has been affected by strong alteration which removed most of the cementing silica giving it a sandy friable texture.
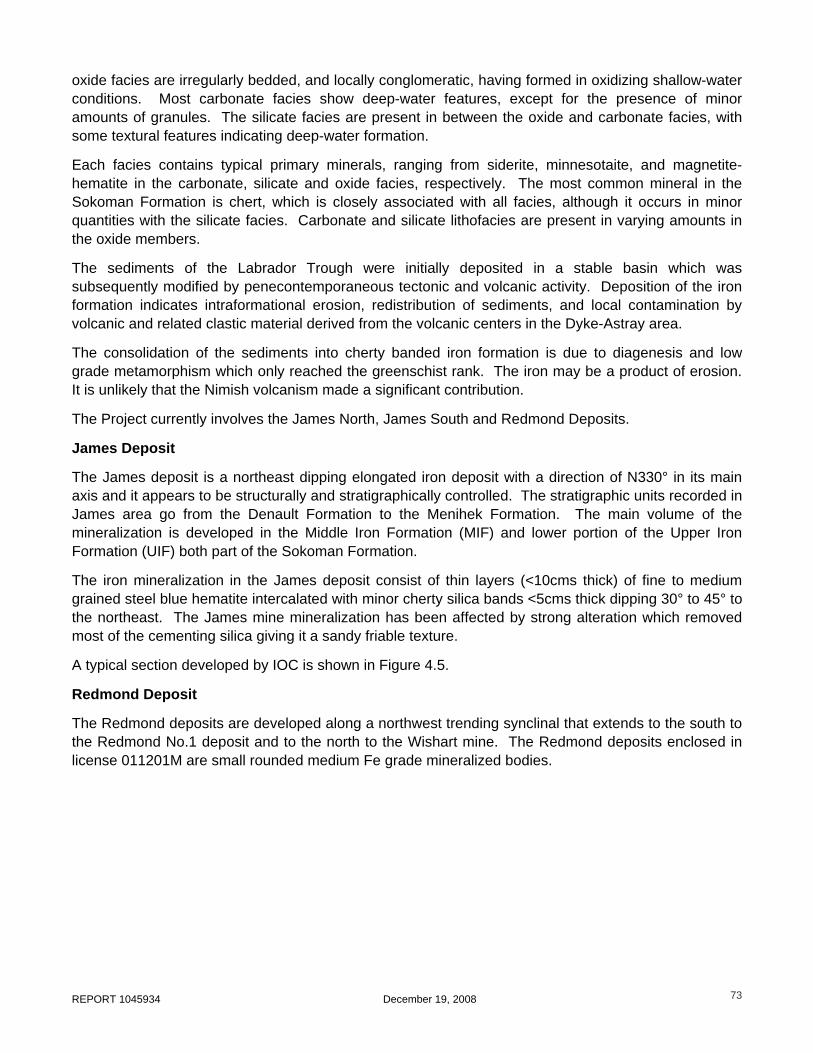
A typical section developed by IOC is shown in Figure 4.5.
Redmond Deposit
The Redmond deposits are developed along a northwest trending synclinal that extends to the south to the Redmond No.1 deposit and to the north to the Wishart mine. The Redmond deposits enclosed in license 011201M are small rounded medium Fe grade mineralized bodies.

REPORT 1045934 December 19, 2008 74
Source: Labrador Iron Mines Limited
Figure 4.5 Generalized Cross Section-James Deposits
4.1.4.5 Geomorphology, Surficial Geology, Soils and Permafrost
There are dominant surficial materials within the area surrounding the Project deposits of drift-poor areas, glacial till and other surficial deposits (undifferentiated), with occasional areas of glaciofluvial deposits.
The till and other surficial deposits (undifferentiated), are predominantly nonstratified, poorly sorted, silty to sandy diamicton, gravel, and sandy gravel; deposited either directly from ice or by meltout during ablation; includes glaciofluvial, glaciolacutrine, marine, and fluvial deposits of either minor areal extent or thin (less than two m) and discontinuous.
The drift-poor areas are described as greater than 80 percent bedrock; including areas of till and other surficial materials generally < 1m thick and discontinuous.
The glaciofluvial deposits are classified as proglacial or ice contact sand and gravel; forming ice contact fans and deltas, outwash plains and terraces, pitted outwash, crevasse fillings, kames and kame terraces; commonly associated with eskers; including areas of extensive, thick fluvial sediments derived from pre-existing glaciofluvial deposits.
The areas in and surrounding the deposits associated with the Project being predominantly greater than 80 percent bedrock, and a previously mined area, do not possess a high number of identifiable landforms. There is evidence of striae, indicating direction of flow known and unknown, as well as identified eskers (esker ridge; kame or splay deposit) in the area (R.A. Klassen et al, 1992).
Permafrost
There have been observations of permafrost of 120 m in thickness in the Schefferville region (Brown 1979). The Schefferville area has been previously identified as the “tentative southern limit of

REPORT 1045934 December 19, 2008 75
continuous permafrost”, Jenness (1949), then later as the “approximate southern limit of permafrost”, Thomas (1953). It was later concluded that there were no continuous zones of permafrost in the Labrador-Ungava and boundaries of discontinuous and sporadic zones were specified, Black (1951). An area 160 km north of Schefferville was indicated as the southern limit of discontinuous permafrost and extending to within 80 km of the Gulf of St. Lawrence was the sporadic zone (Pryer 1966).
Permafrost was determined to be more widespread than thought once IOC began mining near Schefferville in 1954. As described by Brown 1979, the southern limit of the discontinuous permafrost zone approximately extends along the 51st parallel of latitude from the southern end of James Bay to the Strait of Belle-Isle, 1500 km to the east (Figure 4.6). The western extremity of the northern limit of the discontinuous zone begins at Hudson Bay in the vicinity of Post-de-la-Baleine, 55oN latitude. The eastern extremity of this zone ends in the vicinity of Hopedale. Schefferville is situated at the northern margin of the permafrost. The permafrost occurs as scattered islands which increase in size and number from south to north. Permafrost is present within the Fleming-Timmins group of deposits, 25 km northwest of Schefferville (Garg, 1982).
Figure 4.6 Permafrost Distribution in Nouveau-Quebec and Labrador (Source Brown, 1979)

REPORT 1045934 December 19, 2008 76
Various studies on permafrost refer to vegetation and snow cover as having correlation with permafrost presence and thickness. Snow depth and density changes with relief, weather and vegetation (Thom 1969). Thom suggests thick permafrost (up to 60 m) is likely in areas where snow cover is less than 0.4 m during the winter months of January and February.
Research on permafrost distribution at numerous sites in the Schefferville area has been conducted by Nicholson (February 1978). Two sites north of the Project included Timmins 4 and Fleming 7, at an elevation of 700 m, between 1973 and 1975. It was determined that deep permafrost underlies areas of high elevation, which were exposed and vegetation cover consisted of tundra. The permafrost ranged from 60 to 100 m in depth, and entirely unfrozen areas occurred in valleys on the edge of these sites. No permafrost was present on less exposed and low-lying wood covered ground surfaces (Nicholson and Lewis 1976). Permafrost is expected to be absent beneath water bodies in the area that are so deep they do not freeze solid during winter, due to the water bodies’ ability to produce higher ground temperatures. Permafrost is not expected to occur within 30 m from permanently covered shoreline (Nicholson February 1978).
It is not anticipated that permafrost will interfere with mining at the James and Redmond deposit areas.
4.1.4.6 Acid Rock Drainage
Based on the geology associated with iron ore deposits and specifically the deposits associated with the James and Redmond Properties that form the Project, the geological materials to be excavated, exposed and processed during mining of the James and Redmond deposits have low to no potential for Acid Rock Drainage (ARD). However, due diligence requires that ARD potential for any new mine site to fully evaluated and LIM is committed to ensuring the long term chemical stability of the Project through all stages of the mine life.
To date, sufficient historical and baseline data as well as current laboratory test work exists to suggest that ARD potential is extremely low for this Project. The following sections summarize the available data and the ongoing test work that will be completed.
Historical and Baseline Water Quality
Exploration and mining activities have occurred at the Project site dating back to the 1950’s. IOC excavated large open pits and stockpiled considerable waste rock, low grade ore and other materials around the site. These materials have been exposed to both water and air (both required for acid generation from rock) for decades and to date there is no evidence of poor or deteriorating water quality (lowered pH, elevated metals) in the flooded pits, stockpile drainage areas, or the surrounding natural water bodies.
Water quality monitoring on and around the James and Redmond Properties completed by AECOM in 2007 and 2008 (see Appendix J) indicates generally good water quality with pH ranging from 6.5 to 8.5 and normal metal concentrations.
ARD Sampling and Testing Program
A phased ARD sampling and testing program has been initiated to investigate and confirm the ARD potential for all geological materials (ore and waste) to be exposed at this site. To date, preliminary ‘static’ ARD test work has commenced on geological materials available from LIM’s 2008 sampling (trenching and boreholes) program.
REPORT 1045934 December 19, 2008 77
The results of the acid base accounting test work completed to date are compiled in Table 4.4. These samples contain very low concentrations of sulphur and the NP/AP ratios for these samples tested range from 37 to 44 over seven samples. Based on the static ARD test results available to date, it is not anticipated that any of the ore or waste materials for this Project will be acid generating.
Bulk metals analysis was completed on seven samples by strong acid digestion (4 Acid) for trace metals (ICP-AES and ICP-MS). These results are shown in Table 4.4 and show generally typical element composition with the exception of iron, as would be expected.
Additional ARD test work will be completed as additional samples from LIM’s 2008 sampling (trenching and boreholes) program become available. Additional test work will be designed to provide coverage of all geological materials and spatial extents of the planned mine workings.
4.1.5 Hydrology
This section describes the general hydrological conditions at the James and Redmond properties and presents flow monitoring data from specific stream monitoring stations installed in June 2008 and monitored until the fall of 2008. A water balance for the James Creek/Bean Lake watershed is also presented, and an assessment is provided of potential impacts to the water balance from pit and beneficiation operations at the James site.
The drainage systems in the area are strongly influenced by the underlying geology. Streams and lakes tend to be oriented northwest/southeast to match the strike of the bedrock units. Watershed boundaries are generally quite clearly defined by exposed bedrock ridges that run in a northwest/southeast direction.
4.1.5.1 James Property
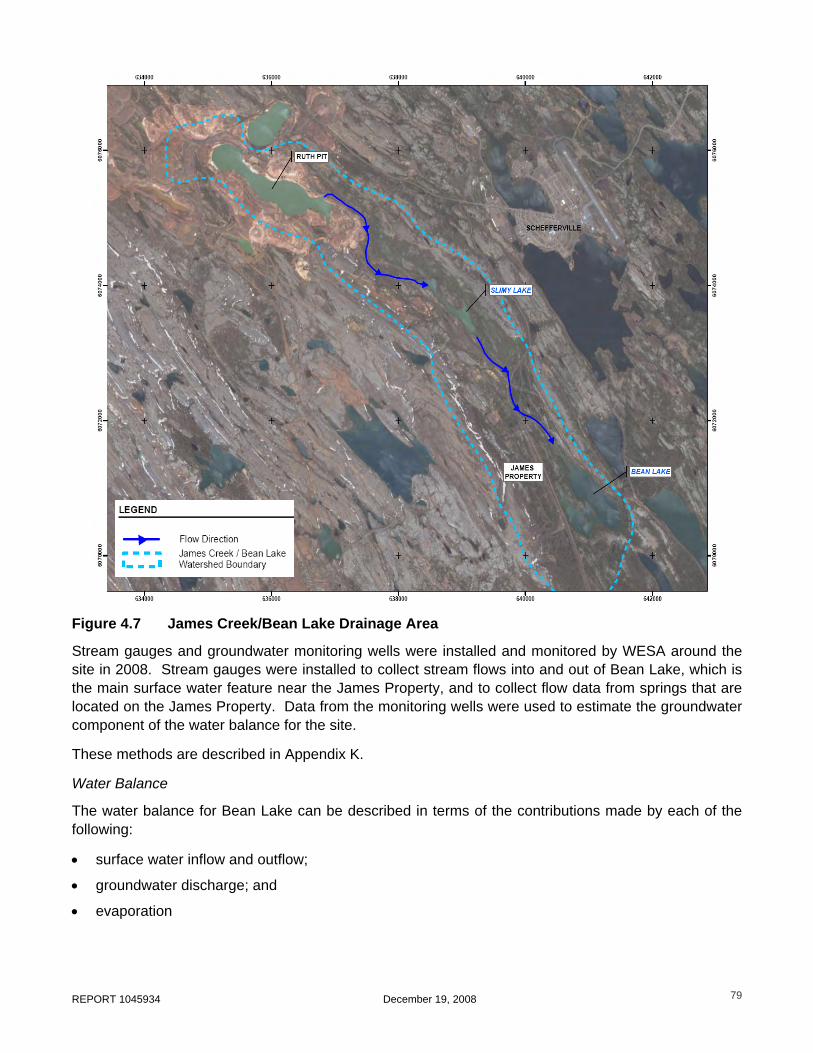
The James Property is located at the base of an eastern slope of a prominent northwest/southeast trending bedrock ridge. Bean Lake is located to the east of the site and is the closest lake to the James Property (Figure 4.7). This lake is fed by James Creek which enters Bean Lake at its northern-most point. James Creek begins in the area east of Ruth Pit, flows southeast past the south end of Ruth Pit into Slimy Lake, then flows out of Slimy Lake continuing southeast to Bean Lake. There are two springs on the James Property that form an unnamed tributary that flows into Bean Lake. These springs (and tributary) figure in the hydrological assessment of the James site and potential impacts to the water balance of the system from pit dewatering. Bean Lake discharges from the southeast and flows into a stream that discharges from Lejeune Lake.

REPORT 1045934 December 19, 2008 78
Table 4.4 Acid Base Accounting (ABA) Results
Deposit Sample Method
Material Type
Paste pH
Total Sulphur
Acid Leachable
SO4-S Sulphide
-S Total
Carbon Carbonate NP (t CaCO3/
1000t)
AP (t CaCO3/
1000t)
Net NP (t CaCO3/
1000t) NP/AP Ratio
(units) (%) (%) (%) (%) (%)
James Bulk HGO 6.98 < 0.005 < 0.1 < 0.01 0.040 0.127 12.5 0.31 12.2 40.3
James Bulk LGO 7.10 < 0.005 < 0.1 < 0.01 0.091 0.024 12.5 0.31 12.2 40.3 Redmond 2 Bulk LGO 7.55 < 0.005 < 0.1 < 0.01 0.048 0.029 13.0 0.31 12.7 41.9 Redmond 2 Bulk Waste 6.95 < 0.005 < 0.1 < 0.01 0.047 0.119 11.6 0.31 11.3 37.4 Redmond 2B Bulk HGO 7.04 < 0.005 < 0.1 < 0.01 0.141 0.228 13.4 0.31 13.1 43.2 Redmond 5 Bulk HGO 7.41 < 0.005 < 0.1 < 0.01 0.081 0.017 13.7 0.31 13.4 44.2
Ruth Bulk Waste 8.03 0.121 0.3 < 0.01 0.026 0.031 12.1 0.31 11.8 39.0
REPORT 1045934 December 19, 2008 79
Figure 4.7 James Creek/Bean Lake Drainage Area
Stream gauges and groundwater monitoring wells were installed and monitored by WESA around the site in 2008. Stream gauges were installed to collect stream flows into and out of Bean Lake, which is the main surface water feature near the James Property, and to collect flow data from springs that are located on the James Property. Data from the monitoring wells were used to estimate the groundwater component of the water balance for the site.
These methods are described in Appendix K.
Water Balance
The water balance for Bean Lake can be described in terms of the contributions made by each of the following:
• surface water inflow and outflow;
• groundwater discharge; and
• evaporation

REPORT 1045934 December 19, 2008 80
The balance of flows into and out of the lake was examined as a kind of 'snapshot' at two points in time, one on a day in early spring (June 6, 2008) and the other on a day in late fall (September 25, 2008). These two sets of data were then compared to each other.
Precipitation was not included in the balance due to the fact that the week preceding each of these two days had been dry, as discussed below. Lake storage was also excluded from the balance based on the expectation that storage contribution would be minimal using the snapshot approach.
The components of the water balance are discussed in more detail below.
Surface Water
Surface water inflow to Bean Lake is primarily through James Creek, which forms the main inlet at the north end, and from an inlet (unnamed tributary) along the west side of the lake that represents the combined flow of the two springs at the proposed mine site. In addition, there are some minor streams flowing into the lake near the south end. Extensive visual observation of the perimeter of the lake did not reveal any other substantive inflows to the lake, and it is therefore assumed that the surface water input to the lake is captured by these inflow streams. All of the water in the area of the proposed mine site appears to drain into Bean Lake.
Stream Gauges
Five stream gauges were placed in both of the two larger inlets (James Creek and the unnamed tributary) and the outlet, as well as the two springs near the proposed mine site (SG-1, SG-2, SG-4, SG-8, and SG-5).
In addition, measurements of cross-sectional areas and stream velocities were made on July 30, 2008 at the two small streams near the south end of Bean Lake (XS-1-N and XS-2-S).
Stream Velocities
Stream velocities were measured during three field visits, on June 5 and 6, July 30 and September 25 and 26, 2008.
June measurements were collected during spring high levels following a period of little precipitation; July measurements followed a heavy rain; and late September measurements would be expected to represent the seasonal low. Despite these variations in conditions, measured flow velocities did not vary by more than 20 percent over the course of the season. The measured velocities are presented in Table 4.5 below.
Table 4.5 Measured Stream Velocities
Stream Gauge Location Jun-06 m/s
Jul-30 m/s
Sep-25 m/s
mean m/s
SG-1 James North spring 0.09 0.07 0.05 0.07 SG-2 James South spring 0.34 0.32 0.41 0.36
SG-4 combined spring flow, unnamed tributary, at inlet to Bean Lake (culvert) 1.31 1.49 1.24 1.35
SG-8 James Creek, primary Bean Lake inlet 0.91 0.74 0.88 0.84 XS-1-N minor stream (culvert) 0.98 0.98 XS-2-S minor stream (culvert) 0.73 0.73 SG-5 Bean Lake outlet (culvert) 1.52 1.41 1.30 1.41

REPORT 1045934 December 19, 2008 81
Stream Flows
Flow in the surface streams was calculated based on velocity measurements collected on June 5 and 6, July 30 and September 25 and 26, 2008. The measured flows in the streams are summarized in Table 4.6, below.
Table 4.6 Measured Flows
Stream Gauge Location June 6
m3/min July 30 m3/min
Sep 25 m3/min
SG-1 James North spring 3.3 2.0 1.5 SG-2 James South spring 2.2 1.6 2.7
SG-4 combined spring flow, unnamed tributary, at inlet to Bean Lake (culvert) 2.4 2.4 1.2
SG-8 James Creek, primary Bean Lake inlet 42.1 32.1 41.8 SG-5 Bean Lake outlet (culvert) 61.0 56.1 54.4
Maximum, minimum and mean flows were calculated based on a combination of stream gauge data and measured values. The maximum flow was calculated using the highest water level (either measured or recorded by the stream gauge) and the maximum velocity. The minimum flow was similarly calculated using the lowest water level (either measured or recorded by the stream gauge) and the minimum velocity. Mean flows were calculated using the average depth recorded by the stream gauge or the average measured depth, and the average of the three measured velocities. These values are presented in Table 4.7, below.
Table 4.7 Maximum, Minimum and Mean Flows
Stream Gauge Location Max
m3/min Min
m3/min Mean
m3/min SG-1 James North spring 3.4 1.1 2.0 SG-2 James South spring 2.7 1.6 2.1
SG-4 combined spring flow, unnamed tributary, at inlet to Bean Lake (culvert) 3.2 0.9 1.6
SG-8 James Creek, primary Bean Lake inlet 48.6 19.7 26.3 SG-5 Bean Lake outlet (culvert) 72.8 41.5 55.9
Periods of Low Precipitation
Average rates of precipitation in the area, based on data collected from 1949 until 2007, falls in the range of 2.6 – 3.9 mm/day (or 19 - 27 mm/week), for the months of June through October (see Table 4.8).
Table 4.8 Meteorological Data - Daily Averages (1949 - 2007)
Month Min
Temp ( C)
Max Temp ( C)
Mean Temp ( C)
Rain (mm)
Snow (mm)
Total Precipitation (mm)
Jun 3.4 14.0 8.73 2.41 0.24 2.65 Jul 7.8 17.5 12.65 3.20 0.01 3.21 Aug 6.8 15.7 11.25 2.97 0.07 3.04 Sep 2.1 9.6 5.83 2.98 0.56 3.53 Oct -4.0 2.1 -0.96 2.44 1.49 3.93

REPORT 1045934 December 19, 2008 82
In order to determine the water balance for Bean Lake, periods of very low precipitation have been examined. Without input from precipitation and runoff, the water balance consists of surface water inputs, groundwater inputs, and evaporation.
Stream measurements were collected on June 5 and 6, 2008, which was at the end of a relatively dry period (5 mm of precipitation in the week preceding June 5, and an additional 1.5 mm on June 6), as compared to the weekly average for June of approximately 19 mm/week. June 18 also marked the end of a seven-day period of very little precipitation (0.5 mm) The stream water levels at two of the stations were very similar on both June 6 and June 18 , and stream velocities did not vary a great deal over the entire season. Flows calculated for early June are therefore considered to represent a period of minimal precipitation in June.
Similarly, September 8 marked the end of a seven-day dry period (0 mm of precipitation). Stream measurements were taken on September 25 and 26, which also marked the end of a period of low precipitation (4.5 mm over the preceding seven days). The stream water levels at SG-4 were very similar on both September 8 and September 25/26 (Figure 4.8 and Figure 4.9), and similarly at SG-5; flows calculated for late September are considered representative of a period of minimal precipitation in September.
SG-4 Stream Gauge Data
0.05
0.1
0.15
0.2
0.25
0.3
0:00
10:0
0
20:0
0
24:0
0
Time of Day
Wat
er D
epth
(m) Jun-06
Jun-18Sep-08Sep-25minmax
Figure 4.8 SG-4 Stream Gauge Data on June 6 and 18, September 8 and 25

REPORT 1045934 December 19, 2008 83
SG-5 Stream Gauge Data
0.3
0.32
0.34
0.36
0.38
0.4
0.42
0.44
0.46
0.48
0.5
0:00
10:00
20:00
24:00
:00
Time of Day
Wat
er D
epth
(m) Jun-06
Jun-18Sep-08Sep-25minmax
Figure 4.9 SG-5 Stream Gauge Data on June 6 and 18, September 8 and 25
Groundwater Flow
An estimate of the groundwater discharge to Bean Lake was made using information obtained during a hydrogeological assessment of the site. This assessment involved installing a total of 27 groundwater monitoring wells at eight well nest locations across the property, conducting single well response testing to determine hydraulic conductivity, conducting a constant discharge pumping test as a further estimate of hydraulic conductivity, sampling the wells for chemical analysis, and measuring groundwater elevations to determine hydraulic gradients. The locations of the wells are shown on Figure 4.10.

REPORT 1045934 December 19, 2008 84
Figure 4.10 Monitoring Wells and Stream Gauges Locations

REPORT 1045934 December 19, 2008 85
Groundwater discharge to the west side of Bean Lake (from the James property side of the lake) was approximated using:
Q = kiA,
Where Q = Groundwater Flux
K = Hydraulic Conductivity
A = Cross sectional area of flowpath
The groundwater discharge estimate is an approximation and does not include any groundwater flow that may discharge to the lake from the north, south or east sides of the lake. Based on the topography, the groundwater contributions to the lake from these directions are thought to be much less than the flow from the west.
The mean hydraulic conductivity measured from single well response testing and from a pumping test conducted on pumping wells located southeast of the James North Spring was determined to be 2.69 x 10⁻⁴ m/sec. The estimated horizontal hydraulic gradient of groundwater monitoring wells installed in the shallower zone at the James site (the zone most likely to potentially discharge to Bean Lake) was determined to be 0.08. The cross sectional area of the groundwater flow path along the west side of Bean Lake was roughly estimated to be 15000 m2. Based on these input values the groundwater discharge to the lake from the James Property side was estimated to be approximately 19 m3/min.
Evaporation
Evaporation in this case includes all evaporation directly from the surface of Bean Lake.
According to the Water Resources Atlas of Newfoundland, the mean annual potential evapo-transpiration in the area falls in the range of 375 – 400 mm. Evaporation from lakes in Newfoundland and Labrador falls in the range of 300 – 600 mm. Based on this information, it was assumed that the evaporation from Bean Lake would occur at the rate of 400 mm/year.
It is also assumed that all of the evaporation takes place during the period when the lake is not frozen. There are approximately 185 ice-free days in the region. The area of Bean Lake is 547,760 m2. Based on this area and an evaporation rate of 400 mm in 185 days, the loss from Bean Lake due to evaporation is estimated to be 0.8 m3/min.
James Creek/Bean Lake Water Balance Summary
The combined inflows to Bean Lake (surface and groundwater) and the combined outflows (surface water flow and evaporation) are presented in Figures 9 and 10, in Appendix K.
The difference between the total inflow and outflow amounts is assumed to represent the cumulative error in the measurements and estimations that make up the components of the water balance. The June values balance very closely while the balance for September is not as close. The total inflow values to Bean Lake were very consistent between the June and September 2008 measurement periods. The component with the greatest unknown degree of accuracy is the groundwater flux, because the cross-sectional area of flow was determined based on an estimate of the width and depth of the groundwater zone that discharges to Bean Lake, and the zone may differ from the estimate. More wells closer to the lake would be required before a more precise groundwater flux estimate could be developed, however this is not considered to be necessary at this time because flow estimates were

REPORT 1045934 December 19, 2008 86
sufficiently accurate for assessment purposes. The outflow estimate from Bean Lake was lower in September than in June; it is possible that the groundwater discharge to Bean Lake decreased over the course of the summer and/or that water from the lake was lost to groundwater later in the season.
Overall, the June and September water balance ‘snapshots’ were quite similar: the flows were similar, and the relative contributions of the various components in the balance were similar. They are therefore considered to be representative of the entire ice-free season.
A comparison of measured flow rates - Theoretical Rates for James Creek and Bean Lake watershed are presented in Table 4.9.
Table 4.9 James Creek/Bean Lake Water Balance Summary
Stream Gauge June m3/min
Sep m3/min
XS-1-N 0.4 0.2 XS-2-S 2.2 1.1 SG-4 (Un-named tributary) 2.4 1.2 Groundwater Discharge 18.9 18.9 SG-8 (James Creek) 42.1 41.8 TOTAL INFLOW 66.0 63.2 Evaporation 0.8 0.8 SG-5 61.0 54.4 TOTAL OUTFLOW 61.8 55.2 Difference 4.2 8.0
Impact of James Pit Development on Water Balance
Pit dewatering will be required to lower the water table in the immediate vicinity of the pits to allow mining to occur. Dewatering will be achieved using in pit sumps and perimeter dewatering wells. The lowering of the water table in response to pit dewatering is expected to affect the flow from the James North and James South Springs, and will likely lead to a reduction and perhaps even complete cessation of flow from the unnamed tributary unless steps are taken to replace the lost flow. The steps that will be taken to prevent this will involve diverting a portion of the perimeter well dewatering water to the unnamed tributary. Development of the pumping wells to a sediment-free state may take several weeks; therefore water from the wells may need to be put through a settling pond/filter system as a temporary measure until well development has been achieved. The targeted redirected water flow rate during operations would be the maximum rate measured from the tributary (SG4 flow data) during the 2008 monitoring period, while the average flow rate measured would be used during winter shutdown periods.
The maximum, minimum, and mean flows from the James North and James South Springs over the June to October recording period are summarized below (Table 4.10).
Table 4.10 Maximum, Minimum and Mean Flows, June to October
Flow James North Spring – SG1 James South Spring – SG2 Maximum (m3/min) 3.4 2.7 Minimum (m3/min) 1.1 1.6
Mean (m3/min) 2 2.1
Flow from the James North Spring forms the upper end of an unnamed tributary that flows southeast, accepts additional flow from the James South Spring, and ultimately discharges into Bean Lake

REPORT 1045934 December 19, 2008 87
(Figure 4.11). Flow rates for the unnamed tributary were also recorded from June to mid October 2008 at a location just before it discharges to Bean Lake (SG4). The maximum, minimum, and mean flow rates for this location are summarized below (Table 4.11).
Figure 4.11 James Springs and Unnamed Tributary
Table 4.11 Maximum and Mean Flows, Unnamed Tributary
Flow Unnamed Tributary at Bean Lake – SG4 Maximum (m3/min) 3.2 Minimum (m3/min) 0.9
Mean (m3/min) 1.6
The flow rate from SG4 (downstream end of the tributary) was always less than the combined flow from the two springs, indicating that water in the tributary infiltrates into the ground as it flows toward Bean Lake.
Pumping will be continued during the winter months.

REPORT 1045934 December 19, 2008 88
Effects of Dewatering Water on Bean Lake
The cumulative amount of water pumped by the pit dewatering system is estimated to be up to 113 m3/min (SNC 2008). Approximately 8 m3/min of this water will be diverted to the unnamed tributary to offset water lost from the springs by dewatering, therefore approximately 105 m3/min of dewatering water will be sent to Bean Lake, James Creek or directed to the Silver Yard for use in the beneficiation process. The area of Bean Lake is approximately 54 ha, therefore the estimated discharge rate only adds about 0.02 cm/min to the hydraulic loading of Bean Lake. The hydraulic impact to Bean Lake is considered to be negligible.
Effects of Rejects Fines Wash Water Slurry
An additional item in the James Creek/Bean Lake water balance includes process water used to wash the ore prior to shipment. It is estimated that up to 8 m3/min of water will be required. The reject fines wash water will contain approximately 21 percent solids after washing and will be pumped to Ruth Pit for settling. This additional volume will have a negligible hydraulic impact on Ruth Pit, which has an area of 61 hectares (hydraulic loading of 0.001 cm/min). This water will also have a very long residency time in Ruth Pit if it is discharged into the northern portion of the pit and flow from the pit occurs from the southeast portion. The volume of Ruth Pit is very roughly estimated to be 50,000,000 m3, therefore an input rate of 8 m3/min, and over the expected operational period of washing (the anticipated annual beneficiation duration) this equates to 2,055,000 m3/year. This means the theoretical maximum residency time for this wash water in Ruth Pit is approximately 23 years. It will likely be less than this as a result of short-circuiting through the pit; however the residency time should be on the order of years. The evaporation rate from Ruth Pit is estimated to be 244,000 m3/year.
4.1.5.2 Redmond Property
Open pit mining was conducted at the Redmond property by IOC until the early 1980’s in the Redmond 1 and Redmond 2 pits. Both of these pits have filled with groundwater and surface water over the years. Other than the surface water in the two open pits, the main surface water feature at the property is a small stream that starts in a wetland in the former railway turnaround area north of the Redmond 2 pit and flows southeast past the north side of the Redmond 1 pit and eventually discharges into Redmond Lake (Figure 4.12). The proposed Redmond 2B pit will be located immediately to the northwest of the existing Redmond 2 pit. Runoff from this area flows to the north and northeast toward the wetland in the former railway turnaround area.
Two stream gauges and three groundwater monitoring wells were installed and monitored by WESA at the Redmond site in 2008 in order to measure surface flows in the stream and to obtain information on groundwater flow and quality.
The hydrology of the Redmond Property is described in terms of the contributions made by surface water and groundwater discharge. Flows were examined in early spring, mid-summer and fall.

REPORT 1045934 December 19, 2008 89
Figure 4.12 Redmond Property Drainage Area
Stream Gauges
Stream gauges were placed in two locations in the stream that runs from the former railway turnaround to Redmond Lake. One stream gauge (SG-7) was installed near the start of the stream in the discharge from the wetland/pond area in the former railway turnaround area of the site. This gauge was installed to measure flow near the starting point of the stream. This location provides useful information on groundwater discharge rates especially during dry base flow conditions. This gauge was installed in a corrugated steel culvert that allows the stream to pass beneath the main access road into the site.
The second gauge (SG3) was installed further downstream east of the Redmond 1 pit. This gauge was installed to measure changes in flow in the stream, particularly from rain events. There are extensive disturbed areas of waste rock along the north and south sides of this stream in the vicinity of the Redmond 1 pit. This stream gauge location was installed to measure runoff from these areas.
REPORT 1045934 December 19, 2008 90
The water level at SG-7, the pond discharge, did not change by more than 5 percent over the course of the season, indicating that groundwater base flow and not precipitation and runoff is the primary source of water in this wetland/pond.
Water levels at SG-3, the downstream location, appear to reflect the steady drainage from the ponds in addition to the effect of precipitation and runoff. Of particular interest is the response at the downstream stream gauge (SG-3) to the very high rainfall (41 mm) that occurred on July 28, 2008. There was a very sharp increase in water depth over a 15 minute period, followed by a steady drop in the stream water level over the next several days; the stream level then stabilized at a new lower level for the rest of the season. It is inferred that a blockage downstream had been providing a temporary dam since the beginning of the season, and that the runoff flow from the very high rainfall on July 28, 2008 was enough to dislodge the obstruction. These data suggest that the stream is strongly influenced by precipitation and runoff, but also that the base flow in the stream represents the steady drainage from the wetland/ponds in the railway turnaround area.
Stream Velocities
Stream velocities were measured during three field visits, on June 5 and 6, July 30 and September 25 and 26.
June measurements were collected during spring high levels following a period of little precipitation; July measurements followed a heavy rain; and late September measurements would be expected to be close to the seasonal low. The measured velocities are presented in Table 4.12, below.
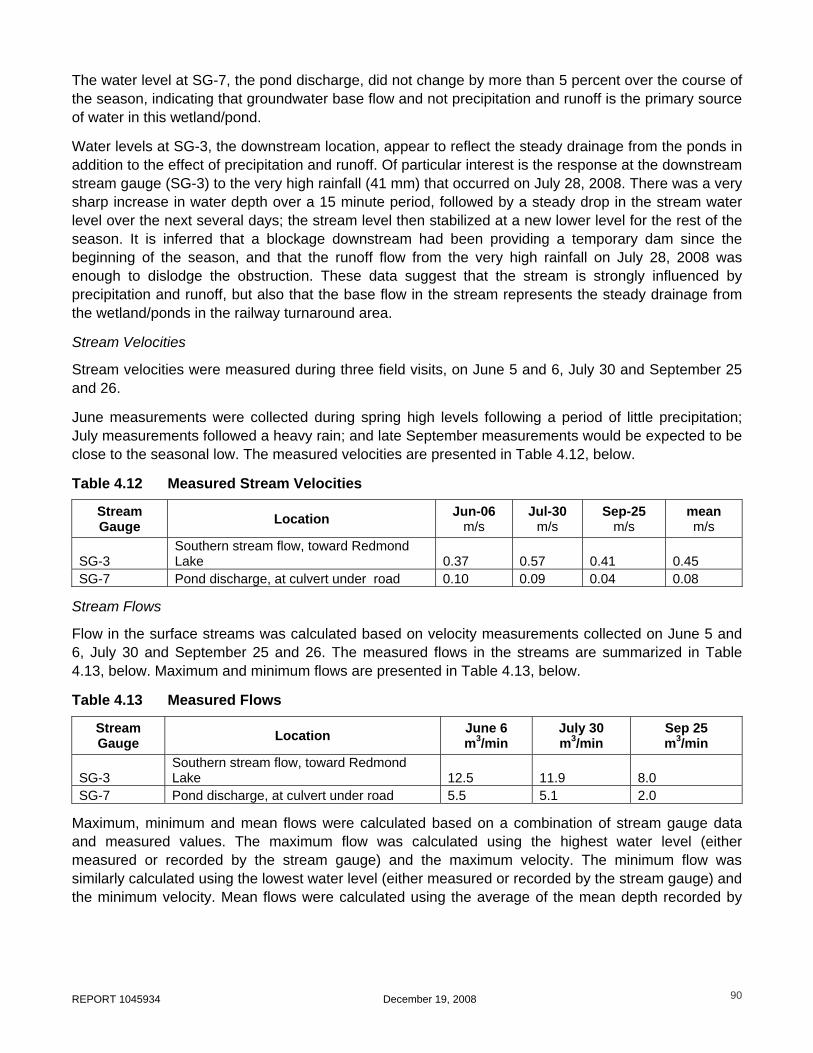
Table 4.12 Measured Stream Velocities
Stream Gauge Location Jun-06
m/s Jul-30
m/s Sep-25
m/s mean m/s
SG-3 Southern stream flow, toward Redmond Lake 0.37 0.57 0.41 0.45
SG-7 Pond discharge, at culvert under road 0.10 0.09 0.04 0.08
Stream Flows
Flow in the surface streams was calculated based on velocity measurements collected on June 5 and 6, July 30 and September 25 and 26. The measured flows in the streams are summarized in Table 4.13, below. Maximum and minimum flows are presented in Table 4.13, below.
Table 4.13 Measured Flows
Stream Gauge Location June 6
m3/min July 30 m3/min
Sep 25 m3/min
SG-3 Southern stream flow, toward Redmond Lake 12.5 11.9 8.0
SG-7 Pond discharge, at culvert under road 5.5 5.1 2.0
Maximum, minimum and mean flows were calculated based on a combination of stream gauge data and measured values. The maximum flow was calculated using the highest water level (either measured or recorded by the stream gauge) and the maximum velocity. The minimum flow was similarly calculated using the lowest water level (either measured or recorded by the stream gauge) and the minimum velocity. Mean flows were calculated using the average of the mean depth recorded by

REPORT 1045934 December 19, 2008 91
the stream gauge and the mean measured depth, and the average of the three measured velocities. These values are presented in Table 4.14, below.
Table 4.14 Maximum, Minimum and Mean Flows
Stream Gauge Location Max
m3/min Min
m3/min Mean
m3/min SG-3 Southern stream flow, toward Redmond Lake 19.1 5.1 10.2 SG-7 Pond discharge, at culvert under road 5.5 2.0 4.1
Groundwater Flow
Information about groundwater flow and quality conditions was obtained from a hydrogeological assessment of the site. This assessment involved installing six groundwater monitoring wells at three well nest locations. One of the well nests (Red-MW3) was installed within the proposed future Redmond 2B pit footprint, while the other two nest locations were installed between the proposed Redmond 2B pit and the wetland/pond area north of the proposed pit. Single well response testing was conducted on each well to determine hydraulic conductivity, each well was sampled for chemical analysis, and groundwater elevations were measured to determine hydraulic gradient and flow direction.
Groundwater in the wells located within the proposed future Redmond 2B pit footprint was encountered at a depth of approximately 25 metres below ground surface, at an elevation of approximately 530 masl. Groundwater in the shallower wells located north of the proposed pit was encountered at depths ranging from approximately 4 to 7 metres below ground surface, at elevations ranging between approximately 526 and 528 masl. The ground surface north of the proposed pit area is currently approximately 20 metres lower than in the pit area, so this is why groundwater is so much shallower there. Groundwater is flowing to the north, i.e. from the proposed pit area to the wetland.
Based on the groundwater results and the measurements obtained from stream gauge SG7, It appears that the source of water in the wetland/pond, which in turn serves as the source of water in the stream, is shallow groundwater.
Influence of Redmond 2B Pit Development on Water Balance
The approximate location of the proposed Redmond 2B Pit is shown on Figure 4.12. The depth to groundwater in the proposed pit area is approximately 25 metres below ground surface and the maximum depth of the proposed pit is 40 metres, therefore pit dewatering will be required to lower the water table in the immediate vicinity of the pit to allow mining to occur to the base depth of the proposed pit. Dewatering will likely be achieved using in pit sumps and perimeter dewatering wells. Pit dewatering may affect the rate of groundwater discharging to the area north of the proposed Redmond 2B pit if it falls within the dewatering zone. If this happens then the base flow of the stream could drop. Pit dewatering is not expected to be required until a year or so after pit development begins, when extraction approaches the water table. After initiation of mining at Redmond 2B, water levels will be measured regularly in the groundwater monitoring wells and flow rates at location SG-7 will be monitored to track potential effects. If monitoring indicates that effects will occur then pit dewatering water should be diverted to the stream as make-up water. The diversion rate should be the mean baseflow rate measured at location SG7.
Water from the Redmond Pit dewatering system will be treated by diverting it to a settling area (Redmond 2 or Redmond 1 pit) to remove suspended solids before it enters the natural environment.