Wisconsin's Nutrient Reduction Strategy
139
Wisconsin’s Nutrient Reduction Strategy November 2013
Transcript of Wisconsin's Nutrient Reduction Strategy

Wisconsin’s Nutrient Reduction Strategy
November 2013

Wisconsin’s Nutrient Reduction Strategy
A Framework for Nutrient Reduction and Management This document was developed by the Department of Natural Resources with contractual assistance from the University of Wisconsin – Extension. Substantial input from staff of other federal, state and local agencies was provided, especially on work groups convened to fill programmatic gaps and to enhance coordination. It was the intent of the Department of Natural Resources to provide information on nutrient reduction activities within Wisconsin regardless of the level of government or particular agency. To keep the document to a reasonable size, all programs and activities could not be described in detail. For more information, the reader is encouraged to go to websites identified in the text. Lead Authors: Wisconsin Department of Natural Resources:
Jim Baumann, Brian Weigel, Amy Callis, Corinne Billings and Mark Binder (GIS maps)
University of Wisconsin Extension
Ken Genskow, Chad Cook, John Exo and Astrid Newenhouse
This strategy and any updates of this strategy are available at: http://dnr.wi.gov/topic/surfacewater/nutrientstrategy.html

Acknowledgements
The Department of Natural Resources very much appreciates the inter-agency cooperation provided to develop this document. In particular this cooperation was exhibited by three work groups convened to fill programmatic gaps and enhance coordination. Targeting Workgroup Jim Baumann, DNR (lead) Ken Genskow, UW-Madison/Extension (facilitator) Corinne Billings, DNR Brian Austin, DNR Adam Freihoefer, DNR Sara Walling, DATCP Pat Murphy, NRCS Dale Robertson, USGS Kurt Calkins, Columbia County Jim VandenBrook, WI Land & Water Cons. Assoc. John Panuska, UW-Madison Tracking & Reporting Workgroup Jim Baumann, DNR (lead) John Exo, UW-Extension (facilitator) Amy Callis, DNR Corinne Billings, DNR Theresa Nelson, DNR Jeff Helmuth, DNR Sara Walling, DATCP Pat Murphy, NRCS Laura Ward Good, UW-Madison
Ken Genskow, UW-Madison/Extension Greg Leonard, Eau Claire County Steve Bradley, Portage County Kirk Langfoss, Marathon County Angela Wenninger, Marathon County Jim VandenBrook, WI Land & Water Cons. Assoc. Monitoring Workgroup Brian Weigel, DNR (lead), Chad Cook, UW-Extension (facilitator) Mike Sorge, DNR Andy Fayram, DNR Matt Diebel, DNR Jeff Helmuth, DNR John Sullivan, DNR Rick Graham, DATCP Kris Stepenuck, UW-Extension Eric Allness, NRCS Dale Robertson, USGS Matt Komiskey, USGS Chris Arnold, Columbia County Astrid Newenhouse, UW-Extension, served as recorder for all three workgroup
The Department also appreciates the assistance provided by the U. S. Environmental Protection Agency and its contractor, Tetra Tech.
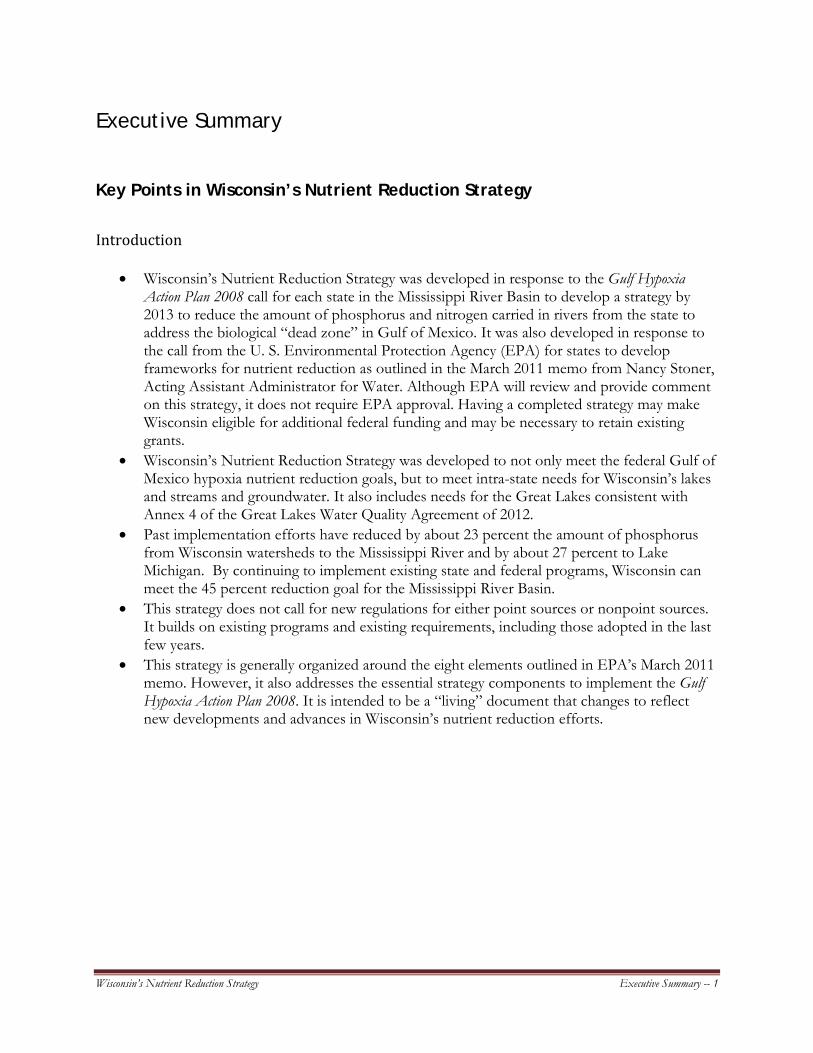
Wisconsin’s Nutrient Reduction Strategy Executive Summary -- 1
Executive Summary Key Points in Wisconsin’s Nutrient Reduction Strategy
Introduction
• Wisconsin’s Nutrient Reduction Strategy was developed in response to the Gulf Hypoxia Action Plan 2008 call for each state in the Mississippi River Basin to develop a strategy by 2013 to reduce the amount of phosphorus and nitrogen carried in rivers from the state to address the biological “dead zone” in Gulf of Mexico. It was also developed in response to the call from the U. S. Environmental Protection Agency (EPA) for states to develop frameworks for nutrient reduction as outlined in the March 2011 memo from Nancy Stoner, Acting Assistant Administrator for Water. Although EPA will review and provide comment on this strategy, it does not require EPA approval. Having a completed strategy may make Wisconsin eligible for additional federal funding and may be necessary to retain existing grants.
• Wisconsin’s Nutrient Reduction Strategy was developed to not only meet the federal Gulf of Mexico hypoxia nutrient reduction goals, but to meet intra-state needs for Wisconsin’s lakes and streams and groundwater. It also includes needs for the Great Lakes consistent with Annex 4 of the Great Lakes Water Quality Agreement of 2012.
• Past implementation efforts have reduced by about 23 percent the amount of phosphorus from Wisconsin watersheds to the Mississippi River and by about 27 percent to Lake Michigan. By continuing to implement existing state and federal programs, Wisconsin can meet the 45 percent reduction goal for the Mississippi River Basin.
• This strategy does not call for new regulations for either point sources or nonpoint sources. It builds on existing programs and existing requirements, including those adopted in the last few years.
• This strategy is generally organized around the eight elements outlined in EPA’s March 2011 memo. However, it also addresses the essential strategy components to implement the Gulf Hypoxia Action Plan 2008. It is intended to be a “living” document that changes to reflect new developments and advances in Wisconsin’s nutrient reduction efforts.

Wisconsin’s Nutrient Reduction Strategy Executive Summary -- 2
State Nutrient Reduction Strategy Components and EPA Framework Elements1
Essential Strategy Components Identified by States
EPA Framework Elements Characterizing Watersheds and Identifying Nutrient Sources and Contributions
1. Prioritize Watersheds on a Statewide Basis for Nitrogen and Phosphorus Loading Reductions
Priority Setting Evaluating and Selecting Appropriate Analytical Tools Establishing Quantitative Reduction Targets 2. Set Watershed Load Reduction Goals Based upon
Best Available Information Establishing Current Status and Historical Trends Examining Current Regulations, Programs, and Policies Identifying and Documenting Appropriate Management Practices and Technical Assistance Programs (Input Management, Water Management, Proven and Innovative Nonpoint Source BMPs, Point Source Management)
3. Ensure Effectiveness of Point Source Permits in Targeted/Priority Sub-watersheds for WW facilities, CAFOs, and Urban Storm water 4. Agricultural Areas
5. Storm Water and Septic Systems
6. Accountability and Verification Measures
Designing and Implementing Effective Monitoring
Identifying and Creating Economic Incentives and Funding Sources
Additional Strategy Components Identified by States
EPA Framework Element Involving and Engaging Stakeholders Effective Education and Outreach Tracking and Reporting Progress 7. Annual Public Reporting of Implementation
Activities and Bi-annual Reporting of Load Reductions and Environmental Impacts Associated with Each Management Activity in Targeted Watersheds
Developing Numeric Nutrient Standards 8. Develop Work Plan and Schedule for Numeric Criteria Development
Figure ES.1 Comparison between Gulf Hypoxia Task Force components and March 2011 EPA memo elements.
Chapter 1. Targeting/Priority Setting
• Nutrient contributions come from both point sources and nonpoint sources throughout much of the state. For the Mississippi River basin portion of Wisconsin, 80% of the nonpoint source contribution of phosphorus comes from 20 of the 30 major river (HUC 8) basins. Similarly for the Lake Michigan basin, 80% of the nonpoint source contribution comes from nine of the 13 major river (HUC 8) basins. The relative point source and nonpoint source nutrient contributions vary greatly by basin
1 Gulf Hypoxia Coordinating Committee

Wisconsin’s Nutrient Reduction Strategy Executive Summary -- 3
• Initial lists of high priority “top group” HUC 10 watersheds comprising about 10 percent of
the state’s watersheds were developed for the Mississippi River Basin and Lake Michigan Basin for phosphorus and nitrogen to surface waters and for nitrates in public drinking water wells. The initial list and subsequent updates of the list may be used in selection of future federally-funded implementation projects.
Figure ES.2 -- Top Group Watersheds for Phosphorus
This strategy uses the federal agency watershed coding system, the Hydrologic Unit Classification (HUC) system. The number of digits in the code increases as the size of the watershed decreases. The average size of a HUC 10 watershed in Wisconsin is about 150 square miles (100,000 acres) while the size of a HUC 12 watershed is about 30 square miles (20,000 acres).

Wisconsin’s Nutrient Reduction Strategy Executive Summary -- 4
Figure ES.3 Top Group Watersheds for Nitrogen

Wisconsin’s Nutrient Reduction Strategy Executive Summary -- 5
Figure ES.4 Top Group Watersheds for Drinking/Groundwater
Wisconsin’s Nutrient Reduction Strategy Executive Summary -- 6
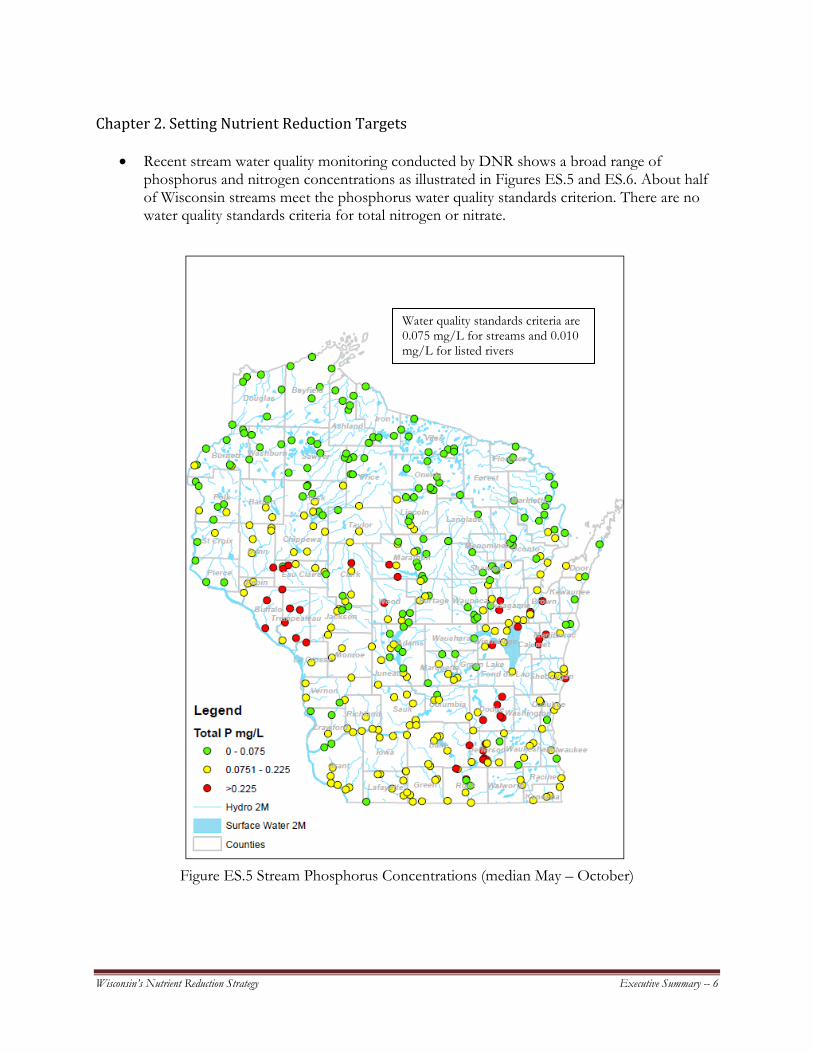
Chapter 2. Setting Nutrient Reduction Targets
• Recent stream water quality monitoring conducted by DNR shows a broad range of
phosphorus and nitrogen concentrations as illustrated in Figures ES.5 and ES.6. About half of Wisconsin streams meet the phosphorus water quality standards criterion. There are no water quality standards criteria for total nitrogen or nitrate.
Figure ES.5 Stream Phosphorus Concentrations (median May – October)
Water quality standards criteria are 0.075 mg/L for streams and 0.010 mg/L for listed rivers

Wisconsin’s Nutrient Reduction Strategy Executive Summary -- 7
Figure ES.6 Stream Nitrogen Concentrations (median May-October)
• As shown in Figure ES.7, many of Wisconsin’s public drinking water systems have elevated
nitrate concentrations with some exceeding the enforcement standard of 10 mg/L.
There are no water quality standards criteria for total nitrogen

Wisconsin’s Nutrient Reduction Strategy Executive Summary -- 8
Figure ES.7 Public Water Systems with Nitrate Concentrations exceeding 5 mg/L
• An initial analysis shows that existing Wisconsin point source and nonpoint source programs have the potential to meet the Gulf Hypoxia goal of 45% load reduction for phosphorus using 1995 as a base year. For the Mississippi River Basin, about a 23% reduction has already been achieved through implementation of Wisconsin’s point source phosphorus removal requirements and through a number of nonpoint source management programs. For the Lake Michigan Basin, an estimated 27% reduction has been achieved.

Wisconsin’s Nutrient Reduction Strategy Executive Summary -- 9
Figure ES.8 Gulf Hypoxia Phosphorus Load Reduction Goal and Estimated Progress to Date
• Trend analysis of data collected over more than three decades at long-term river monitoring sites shows a decrease in phosphorus concentrations for much of the southern half of the state. In contrast, nitrogen concentrations have increased somewhat.
Figure ES.9 Total Phosphorus Concentration Trends at Wisconsin River Long-term Trend Sites
-
1,000,000
2,000,000
3,000,000
4,000,000
5,000,000
6,000,000
7,000,000
8,000,000
9,000,000
10,000,000
1995 Today
Aver
age
Annu
al P
ound
s pe
r Ye
ar
Point Source
NonpointSource
0
0.1
0.2
0.3
0.4
0.5
0.6
0.7
0.8
0.9
TP (m
g/L)
45%
reduction goal
23% reduction
to date
Initial year of monitoring; generally 1977
Latest year of monitoring; generally 2010

Wisconsin’s Nutrient Reduction Strategy Executive Summary -- 10
Figure ES.10 Total Nitrogen Concentration Trends at Wisconsin River Long-Term Trends Sites Chapter 3. Point Source Permits
• Wisconsin has point source programs in place to manage phosphorus from municipal and industrial wastewater facilities, Concentrated Animal Feeding Operations (CAFOs), and municipal urban storm water. In 2010, Wisconsin adopted administrative rules requiring further discharges of phosphorus to meet water quality standards. Innovative, cost-effective compliance alternatives have been developed and approved by EPA.
Chapter 4. Agricultural Nonpoint Nutrients
• Wisconsin also has a number of federal, state and local agricultural and rural nonpoint source programs to control nutrients. Control of phosphorus was enhanced by the 2011 adoption of a phosphorus index for farmlands as part of its suite of state-adopted enforceable performance standards and prohibitions.
• In 2013, federal and state agricultural nonpoint source financial and technical assistance grants will exceed $50 million.
• This strategy recommends that a Nitrogen Science Summit be convened to identify what technical tools need to be developed to better manage nitrogen in an efficient and cost-effective manner. Although such a science summit was conducted by Iowa, many of their conclusions do not apply to Wisconsin’s predominantly livestock agriculture.
0
1
2
3
4
5
6
7TN
(mg/
L)
Initial year of monitoring; generally 1977
Latest year of monitoring; generally 2010
Wisconsin’s Nutrient Reduction Strategy Executive Summary -- 11
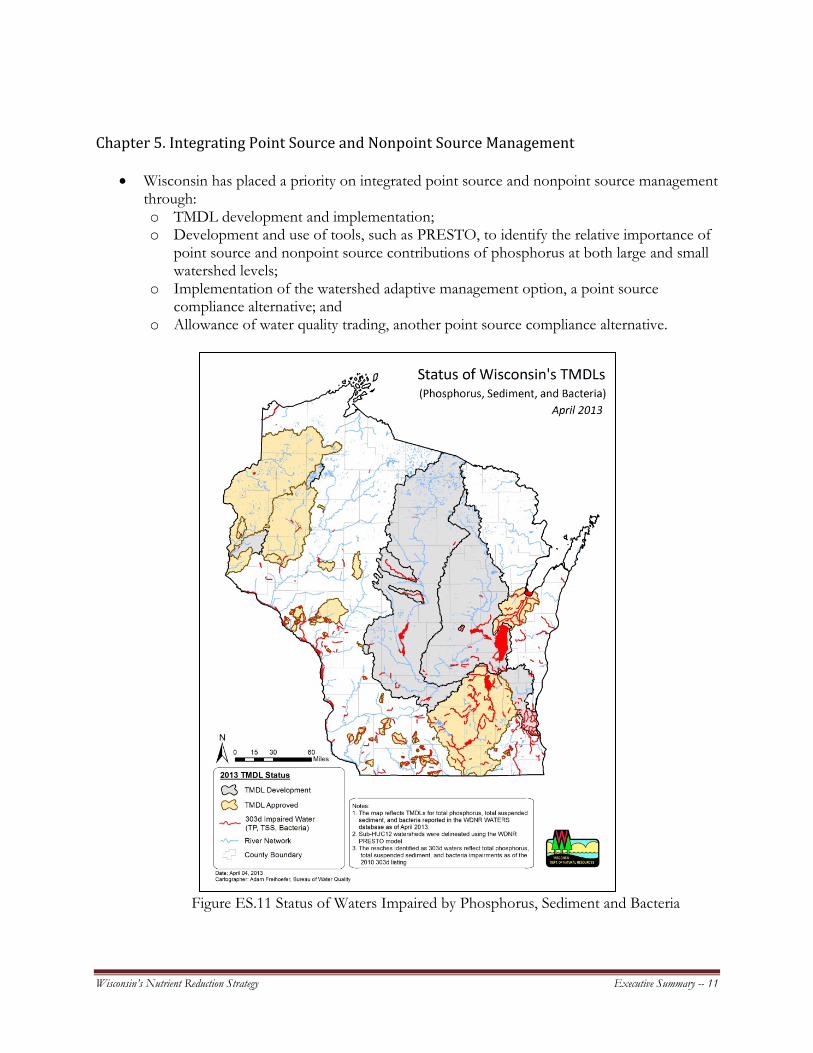
Chapter 5. Integrating Point Source and Nonpoint Source Management
• Wisconsin has placed a priority on integrated point source and nonpoint source management
through: o TMDL development and implementation; o Development and use of tools, such as PRESTO, to identify the relative importance of
point source and nonpoint source contributions of phosphorus at both large and small watershed levels;
o Implementation of the watershed adaptive management option, a point source compliance alternative; and
o Allowance of water quality trading, another point source compliance alternative.
Figure ES.11 Status of Waters Impaired by Phosphorus, Sediment and Bacteria

Wisconsin’s Nutrient Reduction Strategy Executive Summary -- 12
Chapter 6. Storm Water and Septic Systems
• Wisconsin has programs in place to manage on-site disposal systems, phosphorus in lawn fertilizer and phosphorus in detergents. A number of Wisconsin’s nonpoint source performance standards apply to non-permitted urban areas.
Chapter 7. Accountability and Verification Measures
• A multi-agency work group is developing an integrated tracking for agricultural nonpoint sources. It is based on county systems for tracking compliance with Chapter NR 151, Wis. Adm. Code, performance standard and prohibitions and Farmland Preservation/Working Lands Initiative. Information reported to state agencies is aggregated at the HUC 12 small watershed level along with point source tracking information. Development of the agricultural nonpoint source system will continue as a multi-agency, state-federal-local effort throughout 2013. Point source reporting for phosphorus discharges is well established. Nitrogen discharge reporting has been increased for major facilities in the Mississippi River Basin.
Chapter 8. Water Quality Monitoring
• Water quality monitoring is an integral component of many of the elements in this strategy and will continue as a multi-agency effort. DNR will continue to use its River Long-term Trend sites to analyze trends and is considering ways to enhance this fixed-station network. Many of these River Long-term Trends sites are parts of multi-state networks for the Great Lakes and Mississippi River. Other monitoring activities are identified to address nutrient-related concerns in in-state lakes, streams and rivers.

Wisconsin’s Nutrient Reduction Strategy Executive Summary -- 13
Figure ES.12 Wisconsin’s River Long-Term Trends Monitoring Sites Chapter 9. Reporting
• Wisconsin will report on nutrient reduction progress through an annual nutrient summit and information on a website, consistent with the EPA reporting element. The annual nutrient

Wisconsin’s Nutrient Reduction Strategy Executive Summary -- 14
reduction summit may be held in conjunction with period point source phosphorus control summits.
Chapter 10. Numeric Nutrient Water Quality Criteria
• In 2010, Wisconsin adopted numeric phosphorus water quality standards criteria for rivers, streams, lakes, reservoirs and the Great Lakes. DNR continues to research the impact of nitrogen on biotic stream systems.

Wisconsin’s Nutrient Reduction Strategy
Table of Contents
Acknowledgements
Executive Summary ........................................................................................................... Exec Sum - 2
Table of Contents ......................................................................................................................................
Introduction ............................................................................................................................................ 1
Chapter 1. Targeting/Priority Setting ............................................................................................ 4 1.1 EPA and Gulf Hypoxia Task Force Expectations ............................................................................ 4
1.1.1 Nutrient Reduction Framework Expectation: ........................................................................................ 4 1.1.2 Gulf Hypoxia Task Force Essential Strategy Component .................................................................. 5
1.2 Wisconsin’s Approach .............................................................................................................................. 7 1.2.1. Geographic Extent of Nutrient Sources .................................................................................................. 7 1.2.2. Geographic Targeting/Priority Setting ................................................................................................. 10 1.2.3 Models and Monitoring Data. ..................................................................................................................... 20 1.2.4 Urban Watersheds .......................................................................................................................................... 21 1.2.5 Targeting within Watersheds ..................................................................................................................... 21
1.3 Future Directions .................................................................................................................................... 22 Chapter 2. Setting Nutrient Reduction Targets ....................................................................... 24
2.1 EPA and Gulf Hypoxia Task Force Expectations .......................................................................... 24 2.1.2 Gulf Hypoxia Task Force Essential Strategy Component ................................................................ 24
2.2 Wisconsin’s Approach ........................................................................................................................... 24 2.2.1 Analytical Tools ............................................................................................................................................... 25 2.2.2 Current Status .................................................................................................................................................. 26 2.2.3 Nutrient Trends ............................................................................................................................................... 29 2.2.4 General Approach for Nutrient Management in Wisconsin .......................................................... 31 2.2.5 Mississippi River Basin/Gulf Hypoxia – 45% Reduction Goal ..................................................... 32 2.2.6 Lake Michigan – Estimated Phosphorus Load Reduction ............................................................... 39 2.2.7 Total Maximum Daily Load Analyses ....................................................................................................... 42
Chapter 3 – Point Source Permits .................................................................................................. 43 3.1 EPA and Gulf Hypoxia Task Force Expectations .......................................................................... 43 3.2 Wisconsin’s Approach ........................................................................................................................... 43
3.2.1 Permits for Municipal and industrial wastewater treatment facilities ..................................... 44 3.2.2 CAFO permits .................................................................................................................................................... 46 3.2.3 Municipal Storm Water Discharge Permits ........................................................................................... 47
3.3 Future Directions .................................................................................................................................... 48 Chapter 4. Agricultural Nonpoint Nutrients .............................................................................. 49
4.1 EPA and Gulf Hypoxia Task Force Expectations .......................................................................... 49 4.2 Wisconsin’s Approach ........................................................................................................................... 49
4.2.1 Agricultural Performance Standards and Prohibitions.................................................................... 49 4.2.2 Best Management Practices for Nonpoint Source Pollution Control .......................................... 51 4.2.3 Programs intended to control agricultural nitrogen and phosphorus ...................................... 52 4.2.4 Forums for coordination and engagement ............................................................................................ 57
4.3 Future Directions .................................................................................................................................... 58 Chapter 5. Integrating Point Source and Nonpoint Source Management ....................... 61
5.1 Total Maximum Daily Loads (TMDLs) ............................................................................................. 61 5.2 PRESTO ....................................................................................................................................................... 63
Wisconsin’s Nutrient Reduction Strategy
5.3 Watershed Adaptive Management Option .................................................................................... 65 5.4 Water Quality Trading .......................................................................................................................... 65
Chapter 6. Storm Water and Septic Systems .............................................................................. 66 6.1 EPA and Gulf Hypoxia Task Force Expectations .......................................................................... 66 6.2 Wisconsin’s Approach ........................................................................................................................... 66
6.2.1 Construction Sites, Post-Construction Sites, and Non-Permitted Municipalities .................. 66 6.2.2 Septic Systems ................................................................................................................................................... 67 6.2.3 Lawn Fertilizer .................................................................................................................................................. 68 6.2.4 Phosphorus in Detergents. .......................................................................................................................... 69
6.3 Future Directions .................................................................................................................................... 69 Chapter 7. Accountability and Verification Measures ............................................................ 70
7.1 EPA and Gulf Hypoxia Task Force Expectations .......................................................................... 70 7.2 Wisconsin’s Approach ........................................................................................................................... 70
7.2.1 Point Source Tracking .................................................................................................................................... 70 7.2.2 Watershed based nutrient tracking for practices to reduce Nonpoint Sources .................... 70
7.3 Future Directions .................................................................................................................................... 71 Chapter 8. Water Quality Monitoring ........................................................................................... 74
8.1 EPA and Gulf Hypoxia Task Force Expectations .......................................................................... 74 8.2 Wisconsin’s Approach – Surface Water .......................................................................................... 74
8.2.1 Coordination of water monitoring efforts ............................................................................................. 74 8.2.2 Key Monitoring Program Components ................................................................................................... 75
8.3 Wisconsin’s Approach – Groundwater and Drinking Water ................................................... 79 8.3.1 Coordination of water monitoring efforts ............................................................................................. 79 8.3.2 Key Monitoring Program Components ................................................................................................... 79
8.4 Future Directions for Monitoring Improvement ......................................................................... 82 8.4.1 Surface Water Monitoring ............................................................................................................................ 83 8.4.2 Groundwater Monitoring.............................................................................................................................. 84 8.4.3 Moving Forward ............................................................................................................................................... 85
Chapter 9. Reporting .......................................................................................................................... 86 9.1 EPA and Gulf Hypoxia Task Force Expectations .......................................................................... 86 9.2 Wisconsin’s Approach ........................................................................................................................... 86 9.3 Future Directions .................................................................................................................................... 86
Chapter 10. Numeric Nutrient Water Quality Criteria ........................................................... 87 10.1 EPA and Gulf Hypoxia Task Force Expectations ....................................................................... 87 10.2 Wisconsin’s Approach and Future Directions ........................................................................... 87
Phosphorus Criteria ................................................................................................................................................... 87 Nitrogen Criteria – Surface Waters ...................................................................................................................... 88
Appendix 1. Wisconsin’s Nutrient Reduction Strategy HUC 10 Data Table ......... A-Error! Bookmark not defined. Appendix 2. Wisconsin Watershed Rotation Water Quality Monitoring Data (Pour Point data) ....................................................................................................................................................... B-1

Wisconsin’s Nutrient Reduction Strategy 1
Introduction Wisconsin’s Nutrient Reduction Strategy is a broad overview of nutrient management activities for both point sources and nonpoint sources in Wisconsin. This strategy documents ongoing activities whether they are implemented by federal, state or local agencies. It identifies areas where further progress is needed. This strategy is in part a response to two federal initiatives. The Gulf Hypoxia Action Plan 2008, developed and approved by representatives of a number of federal agencies and 12 states, calls for each agency and state in the Mississippi River Basin to develop a nutrient reduction strategy by 2013. The Gulf Hypoxia Action Plan 2008 further calls for the strategies to target watersheds contributing the greatest amount of nutrients and to focus implementation where both local water quality needs and Gulf of Mexico needs can be met. Similarly, in March 2011, Nancy Stoner, Acting Assistant Administrator for Water for the U. S. Environmental Protection Agency (EPA,) released a memorandum encouraging EPA Regions to work with states to develop state nutrient reduction frameworks. That memo identifies and recommends eight elements essential to adequate state nutrient reduction programs. Neither of these initiatives call for EPA approval, although EPA may review and comment on the strategy. It also includes needs for the Great Lakes consistent with Annex 4 of the Great Lakes Water Quality Agreement of 2012. While the federal initiatives are important, it is also important to develop a state Nutrient Reduction Strategy to meet water quality needs within Wisconsin to most effectively and efficiently coordinate resources. That is, incorporate needs associated with eliminating water quality problems in local impaired streams and lakes as well as in local drinking water. Within Wisconsin, about half of the streams and rivers do not meet water quality standards for phosphorus. Analysis of water quality data collected over more than three decades at 15 of 38 sites across the state show increases in nitrogen concentrations. In addition, many local public drinking water wells have concentrations exceeding or approaching the drinking water quality standard for nitrates. Many of these well owners are facing increased costs to remove nitrates. Gulf Hypoxia Components and EPA Framework Elements The Gulf Hypoxia Action Plan and the March 2011 EPA memo call for similar elements in the state reduction strategies or frameworks2. The Table I.1 below presents a comparison of the elements.
2 For this document, “strategy” is used to mean both the Gulf Hypoxia Action Plan 2008 strategy and the March 2011 EPA memo framework.

Wisconsin’s Nutrient Reduction Strategy 2
State Nutrient Reduction Strategy Components and EPA Framework Elements3
Essential Strategy Components Identified by States
EPA Framework Elements Characterizing Watersheds and Identifying Nutrient Sources and Contributions
1. Prioritize Watersheds on a Statewide Basis for Nitrogen and Phosphorus Loading Reductions
Priority Setting Evaluating and Selecting Appropriate Analytical Tools Establishing Quantitative Reduction Targets 2. Set Watershed Load Reduction Goals Based upon
Best Available Information Establishing Current Status and Historical Trends Examining Current Regulations, Programs, and Policies Identifying and Documenting Appropriate Management Practices and Technical Assistance Programs (Input Management, Water Management, Proven and Innovative Nonpoint Source BMPs, Point Source Management)
3. Ensure Effectiveness of Point Source Permits in Targeted/Priority Sub-watersheds for WW facilities, CAFOs, and Urban Storm water 4. Agricultural Areas
5. Storm Water and Septic Systems
6. Accountability and Verification Measures
Designing and Implementing Effective Monitoring
Identifying and Creating Economic Incentives and Funding Sources
Additional Strategy Components Identified by States
EPA Framework Element Involving and Engaging Stakeholders Effective Education and Outreach Tracking and Reporting Progress 7. Annual Public Reporting of Implementation
Activities and Bi-annual Reporting of Load Reductions and Environmental Impacts Associated with Each Management Activity in Targeted Watersheds
Developing Numeric Nutrient Standards 8. Develop Work Plan and Schedule for Numeric Criteria Development
Figure I.1 Comparison between Gulf Hypoxia Task Force components and March 2011 EPA memo elements. Development of Strategy Although development of Wisconsin’s Nutrient Reduction Strategy was coordinated by the Department of Natural Resources with assistance from the University of Wisconsin – Extension, the intent is to provide a brief compendium of federal, state and local programs being implemented in Wisconsin to reduce nutrients reaching surface waters and groundwater. To meet this intent, the strategy was developed with substantial input from staff of federal, state, and local agencies and stakeholders. It covers both point sources and nonpoint sources as well as both urban areas and rural areas.
3 Gulf Hypoxia Coordinating Committee

Wisconsin’s Nutrient Reduction Strategy 3
This strategy was developed with the presumption that Wisconsin has many nutrient reduction programs in place and that we, as a state, are not “starting from scratch”. This does not mean that program implementation is complete. Filling programmatic gaps and enhancing coordination were two areas of emphasis in developing this strategy. This strategy does not call for new regulations for either point sources or nonpoint sources. It is anticipated that completion of an adequate state Nutrient Reduction Strategy will enable the state to be eligible for grants from EPA and other federal agencies. In the future, an adequate state Nutrient Reduction Strategy may also be necessary to maintain current grants to states, such as the section 319 nonpoint source management grant from EPA. While this document attempts to represent current programs and activities, it is anticipated that periodic updates will be need to keep the document up-to-date. Updates will be part of the annual reports and presented at both public meetings and the nutrient reduction website: [specific site TBD following draft review].

Wisconsin’s Nutrient Reduction Strategy 4
Chapter 1. Targeting/Priority Setting Element 1. Prioritize Watersheds on a Statewide Basis for Nitrogen and Phosphorus Loading Reductions 1.1 EPA and Gulf Hypoxia Task Force Expectations
1.1.1 Nutrient Reduction Framework Expectation: From EPA’s WQ-26 national performance measure: States set priorities on a watershed or source-sector basis. States may also include a combination of watershed and sector approaches in prioritizations. State should set priorities reflecting each of the three following considerations:
• Systematic and Data-Driven: Prioritization of sub-watersheds (or water bodies) or source sectors should reflect a systematic evaluation based on available data concerning N and P loadings, high-risk receiving water problems, public and private drinking water supply impacts, or other environmental factors. States may: (a) identify watersheds in the state which are of highest priority, or (b) identify which key source sectors or sub-sectors are of highest priority (e.g., identifying which sectors could contribute the most near-term loading reductions, such as POTWs, industrial or municipal storm water, fertilizer usage, urban or rural BMPs, etc.). States are also encouraged to utilize an adaptive approach to priority setting; i.e., as new information is available, priorities may shift. Examples: Use the USGS SPARROW model to identify major watersheds or sectors that individually or collectively account for a substantial portion of loads (e.g. 80%) delivered to waters in a state or directly delivered to multi-jurisdictional waters. Or use the Recovery Potential Screening Tool (www.epa.gov/recoverypotential/) to screen potential nutrient load reductions.
• Appropriate scale: For setting watershed priorities, the state should use the scale (HUC 12, HUC 8, etc.) that is most appropriate for watershed management purposes. Within each major HUC 8 watershed that has been identified as accounting for a substantial portion of the load, identify targeted/priority sub-watersheds on a HUC 12 or similar scale where subsequent activities under the strategy will be focused. For setting priorities among source sectors, the state should use an appropriate level of source detail (e.g., sector or sub-sector) for watershed management purposes.
• Inclusive: The state should include all state waters and water body types for which it has data available, and/or all source sectors within the state for which it has data, in its priority-setting analysis. Example: Use SPARROW to estimate N & P loadings delivered to rivers, streams, lakes, reservoirs, etc. in each major watershed and/or from each source sector across the state.

Wisconsin’s Nutrient Reduction Strategy 5
The EPA encourages states to involve the public in their priority-setting approaches, or to make the priorities available to the public. 1.1.2 Gulf Hypoxia Task Force Essential Strategy Component
• Characterize watersheds and identify nutrient sources and contributions. • Set geographic priorities
Federal Watershed Codes In this and other chapters we use the federal agency watershed code, the Hydrologic Unit Classification (HUC) system. The number of digits in the code increases as the size of the watershed decreases. In this document, 8-digit (HUC 8), 10-digit (HUC 10) and 12-digit (HUC 12) codes are used. The table below shows the number of HUCs in Wisconsin for each of these three commonly used levels.
Major Basin HUC 8 HUC 10 HUC 12
Lake Superior 5 22 108
Lake Michigan 13 90 450
Mississippi River 32 256 1244
Total 50 368 1802
The average size of a HUC 10 in Wisconsin is about 150 square miles (100,000 acres) while the size of a HUC 12 is about 30 square miles (20,000 acres). Since the federal delineation of HUC watersheds extends across state lines, a number of the HUCs have a very small area in Wisconsin with the smallest being less than 10 acres. These very small HUCs may have been combined with adjoining HUCs in the analyses described in this chapter or not included in the analysis.

Wisconsin’s Nutrient Reduction Strategy 6
Figure 1.1 HUC 8 Watersheds in Wisconsin
Wisconsin’s Nutrient Reduction Strategy 7
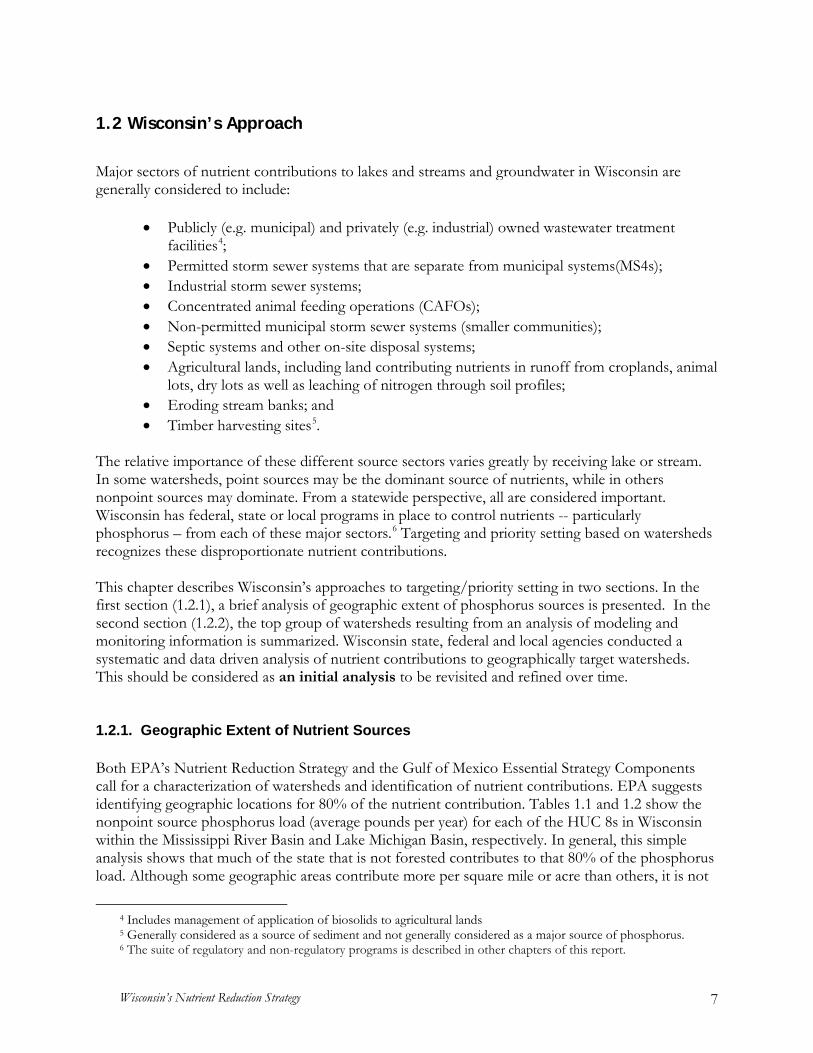
1.2 Wisconsin’s Approach
Major sectors of nutrient contributions to lakes and streams and groundwater in Wisconsin are generally considered to include:
• Publicly (e.g. municipal) and privately (e.g. industrial) owned wastewater treatment facilities4;
• Permitted storm sewer systems that are separate from municipal systems(MS4s); • Industrial storm sewer systems; • Concentrated animal feeding operations (CAFOs); • Non-permitted municipal storm sewer systems (smaller communities); • Septic systems and other on-site disposal systems; • Agricultural lands, including land contributing nutrients in runoff from croplands, animal
lots, dry lots as well as leaching of nitrogen through soil profiles; • Eroding stream banks; and • Timber harvesting sites5.
The relative importance of these different source sectors varies greatly by receiving lake or stream. In some watersheds, point sources may be the dominant source of nutrients, while in others nonpoint sources may dominate. From a statewide perspective, all are considered important. Wisconsin has federal, state or local programs in place to control nutrients -- particularly phosphorus – from each of these major sectors.6 Targeting and priority setting based on watersheds recognizes these disproportionate nutrient contributions. This chapter describes Wisconsin’s approaches to targeting/priority setting in two sections. In the first section (1.2.1), a brief analysis of geographic extent of phosphorus sources is presented. In the second section (1.2.2), the top group of watersheds resulting from an analysis of modeling and monitoring information is summarized. Wisconsin state, federal and local agencies conducted a systematic and data driven analysis of nutrient contributions to geographically target watersheds. This should be considered as an initial analysis to be revisited and refined over time. 1.2.1. Geographic Extent of Nutrient Sources Both EPA’s Nutrient Reduction Strategy and the Gulf of Mexico Essential Strategy Components call for a characterization of watersheds and identification of nutrient contributions. EPA suggests identifying geographic locations for 80% of the nutrient contribution. Tables 1.1 and 1.2 show the nonpoint source phosphorus load (average pounds per year) for each of the HUC 8s in Wisconsin within the Mississippi River Basin and Lake Michigan Basin, respectively. In general, this simple analysis shows that much of the state that is not forested contributes to that 80% of the phosphorus load. Although some geographic areas contribute more per square mile or acre than others, it is not
4 Includes management of application of biosolids to agricultural lands 5 Generally considered as a source of sediment and not generally considered as a major source of phosphorus. 6 The suite of regulatory and non-regulatory programs is described in other chapters of this report.

Wisconsin’s Nutrient Reduction Strategy 8
feasible to achieve large reductions in nutrient loads to downstream waters, such as the Mississippi River or Lake Michigan, by working only in small portions of the state. Both of the tables were developed using USGS SPARROW (SPAtially Referenced Regressions On Watershed) model results for agricultural, urban, forested and other lands.7 In the SPARROW analysis, urban storm water runoff nutrient contributions are included as nonpoint sources even for urban areas under the WPDES storm water permit program. Wastewater treatment facilities were not included in this simple analysis. However, both point sources and nonpoint sources are included in the analyses described in Chapter 2 (Element 2). The HUC 8 river basins are listed in the tables in decreasing order of phosphorus yield (average pounds per acre per year). Yields are a better indication of the significance of the contribution, while total load tends to be more a response to the size of the basin given the wide variation in basin size. It is presumed that nitrogen contributions follow a similar geographic distribution, but a future analysis is warranted when better point source and nonpoint source information is available. For the Mississippi River Basin, the HUC 8 river basins in southwest Wisconsin (e.g. Grant – Platte River Basin and Sugar – Pecatonica River Basin) have the highest phosphorus yields and also rank at the top for phosphorus loads (pounds per year). The Upper Rock River Basin, the Lower Wisconsin River Basin, the Buffalo --Trempealeau River Basin, the Lower Chippewa River Basin and the Central Wisconsin River Basin, although having a lower yield, also contribute relatively large phosphorus loads due to the large geographic area of each of the basins. For the Lake Michigan Basin, the Lower Fox River, Pensaukee River and combined Manitowoc – Sheboygan Rivers HUC 8 basins contribute the highest phosphorus yields. However, the Wolf River Basin due to its very large size contributes a substantial phosphorus load.
7 Robertson, D. M., and Saad, D. A., 2011, Nutrient inputs to the Laurentian Great Lakes by source and watershed estimated using SPARROW watershed models: Journal of the American Water Resources Association. V. 47, p. 1011-1033, DOI: 10.1111/j.1752-1688.2011.00574.x.

Wisconsin’s Nutrient Reduction Strategy 9
Table 1.1 Nonpoint Source Phosphorus Yield and Load Contributions for the Mississippi River Basin – By HUC 8 (in order of decreasing yields)
Mississippi River Basin 8-digit HUC DNR Basin
Nonpoint Source yield
(lb/a/yr)
Nonpoint Source Load
(lb/yr)
Cumulative Total
(lb/yr) % of total
Cumulative % of Total
Grant- Maquoketa Grant-Platte 0.99 499,755 499,755 6.8% 6.8% Pecatonica River Sugar – Pecatonica 0.88 642,667 1,142,423 8.8% 15.6% Apple-Plum Rivers Grant-Platte 0.74 82,735 1,225,158 1.1% 16.7% Coon-Yellow Rivers Bad Axe – La Crosse 0.59 254,458 1,479,616 3.5% 20.2% Des Plaines River South East Fox 0.51 44,392 1,524,009 0.6% 20.8% Sugar River Sugar – Pecatonica 0.49 216,708 1,740,717 3.0% 23.7% Kickapoo River Lower Wisconsin 0.47 229,545 1,970,262 3.1% 26.9% Upper Rock River Upper Rock 0.46 401,250 2,607,935 5.5% 32.3% Baraboo River Lower Wisconsin 0.45 186,795 2,794,730 2.5% 34.9% Buff-Whitewater Buffalo-Trempealeau 0.44 206,814 3,001,544 2.8% 37.7% Rush-Vermillion Rivers Lower Chippewa 0.37 121,479 3,123,023 1.7% 39.4% Lower Wisconsin River Lower Wisconsin 0.36 538,274 3,661,298 7.3% 46.7% Trempealeau River Buffalo-Trempealeau 0.35 527,810 4,189,108 7.2% 53.9% Black River Black 0.33 477,914 4,667,022 6.5% 60.4% La Crosse-Pine Rivers Bad Axe - La Crosse 0.31 119,466 4,786,488 1.6% 62.1% Lake Dubay Central Wisconsin 0.30 519,094 5,305,582 7.1% 69.1% Eau Claire River Lower Chippewa 0.25 138,624 5,444,206 1.9% 71.0% Lower Chippewa River Lower Chippewa 0.24 317,434 5,761,639 4.3% 75.4% Upper Fox River South East Fox 0.23 136,103 5,897,742 1.9% 77.2% Red Cedar River Lower Chippewa 0.22 268,346 6,166,088 3.7% 80.9% Lower Rock River # Lower Rock 0.19 236,423 2,206,685 3.2% 84.1% Lower St. Croix River St. Croix 0.19 209,114 6,728,886 2.9% 87.0% Jump River Upper Chippewa 0.19 105,681 6,834,567 1.4% 88.4% Castle-Rock Central Wisconsin 0.17 353,684 6,519,772 4.8% 93.2% Upper Chippewa River Upper Chippewa 0.13 161,258 6,995,825 2.2% 95.4% Upper St. Croix River St. Croix 0.10 99,276 7,095,101 1.4% 96.8% Namekagon River St. Croix 0.08 49,827 7,144,928 0.7% 97.5% Flambeau River Upper Chippewa 0.08 61,762 7,206,690 0.8% 98.3% South Fork Flambeau R Upper Chippewa 0.08 39,125 7,245,815 0.5% 98.8%
Upper Wisconsin River Upper Wisconsin 0.06 85,220 7,331,035 1.2% 100.0%
Note: Lower Rock River data also includes Kishwaukee River and Piscasaw Creek 8-digit HUCs

Wisconsin’s Nutrient Reduction Strategy 10
Table 1.2 Nonpoint Source Phosphorus Yield and Load Contributions for the Lake Michigan Basin – By HUC 8 Watershed (in order of decreasing yields)
Lake Michigan Basin 8-digit HUC DNR Basin
Nonpoint Source yield
(lb/a/yr)
Nonpoint Source Load
(lb/yr)
Cumulative Total
(lb/yr) % of total
Cumulative % of Total
Lower Fox River Lower Fox 0.65 270,672 270,672 10.6 10.6% Pensaukee River Green Bay 0.63 133,995 404,666 5.3 15.9% Manitowoc -Sheboygan Manitowoc Sheboygan 0.58 458,625 863,291 18.0 33.9% Lake Winnebago Upper Fox 0.48 114,353 977,644 4.5 38.4% Door-Kewaunee Twin-Door-Kewaunee 0.45 221,589 1,199,233 8.7 47.1% Pike-Root Rivers Southeast 0.44 94,562 1,293,795 3.7 50.8% Milwaukee River Milwaukee 0.38 212,662 1,506,457 8.4 59.2% Upper Fox River Upper Fox 0.22 229,076 1,735,533 9.0 68.2% Wolf River Wolf 0.21 489,918 2,225,451 19.2 87.4% Oconto River Green Bay 0.20 125,579 2,351,030 4.9 92.3% Brule River Green Bay 0.12 14,577 2,365,606 0.6 92.9% Peshtigo River Green Bay 0.11 85,594 2,451,201 3.4 96.3% Menominee River Green Bay 0.11 94,861 2,546,061 3.7 100.0%
1.2.2. Geographic Targeting/Priority Setting For purposes of targeting and priority setting, HUC 10 watersheds currently provide the best match with available modeling and water quality information; even though the HUC 12 is more suitable for implementation projects. In general, analysis at the HUC 12 level would require more sophisticated modeling and water quality monitoring at many more streams or groundwater locations. Future efforts will move toward developing a HUC 12 analysis to better serve implementation project selection. An initial suite of “top group” HUC 10 watersheds were identified through a data-driven, systematic analysis. Top groups were identified separately for the Mississippi River Basin and for the Lake Michigan Basin. Within each major basin, top groups were identified separately for phosphorus concerns and nitrogen concerns in surface waters. An initial statewide analysis of nitrogen concerns in groundwater was also conducted. It is anticipated that the top groups of HUC 10 watersheds listed in this section will be used to help select future implementation nonpoint source projects, such as for the Mississippi River Basin Initiative (USDA – NRCS), Environmental Quality Incentives Program (EQIP) (USDA – NRCS) and the Great Lakes Restoration Initiative.8 Several additional factors, such as local interest and capability; likelihood for the water to respond; coordination with other implementation activities; and availability of water quality monitoring data, will also be considered in future implementation
8 Programs may also give priority to high quality waters where “threats or stressors” have been identified.

Wisconsin’s Nutrient Reduction Strategy 11
project selection. These top group HUC 10 watersheds may also be used in setting priorities for implementation programs. For example, Wisconsin federal, state and local agencies may focus water quality monitoring, technical assistance or other management tools in these watersheds. This initial analysis uses a multiple lines of evidence approach. In such an approach, if multiple lines of evidence (e.g., SPARROW model results and monitored concentrations) identify the same top HUC 10s, there should be a high level of confidence that those HUC 10s are among the highest contributors. If different lines of evidence give substantially different rankings, then those HUC 10s are not necessarily in the top group. This is not meant to infer that any of the lines of evidence are in error, since they may measure or predict different parameters. In future analyses, it is anticipated that additional lines of evidence will be incorporated, such as likelihood of the lake or stream to respond to reduced nutrient loads. A summary of information on each of the HUC 10 watersheds is included in Table A.1 of Appendix A. As shown on Figures 1.2 and 1.3, the HUC 10 watersheds tend to form clusters based on common land use, soils and topography. HUC 10 watersheds in the Lake Superior Basin would compare to the bottom half of watersheds in the Lake Michigan and Mississippi River Basin. Information on these Lake Superior Basin HUC 10 watersheds is included in Table A.1. Table A.1 also contains the following information:
• Percent agricultural and urban use • Point source – nonpoint source phosphorus load ratio (identified by PRESTO model) • The inclusion of the watershed in an EPA approved TMDL • The presence of an Outstanding Resource Water or Exceptional Resource Water in or
“touching” the watershed

Wisconsin’s Nutrient Reduction Strategy 12
Figure 1.2 Top Group HUC 10 Watersheds for Phosphorus
Headwaters Big Eau Pleine, Black & Eau Claire Rivers
Grant, Platte, Pecatonica River Basins
Upper Rock River Basin
Manitowoc & Sheboygan River
Basins
Lower Fox River Basin
Upper Fox & Wolf River
Basins

Wisconsin’s Nutrient Reduction Strategy 13
Figure 1.3 Top Group HUC 10 Watersheds for Nitrogen
Manitowoc and Sheboygan River
Basins
Grant, Platte, Pecatonica & Sugar River Basins
Upper & Lower Rock River
Basins
Wisconsin’s Nutrient Reduction Strategy 14
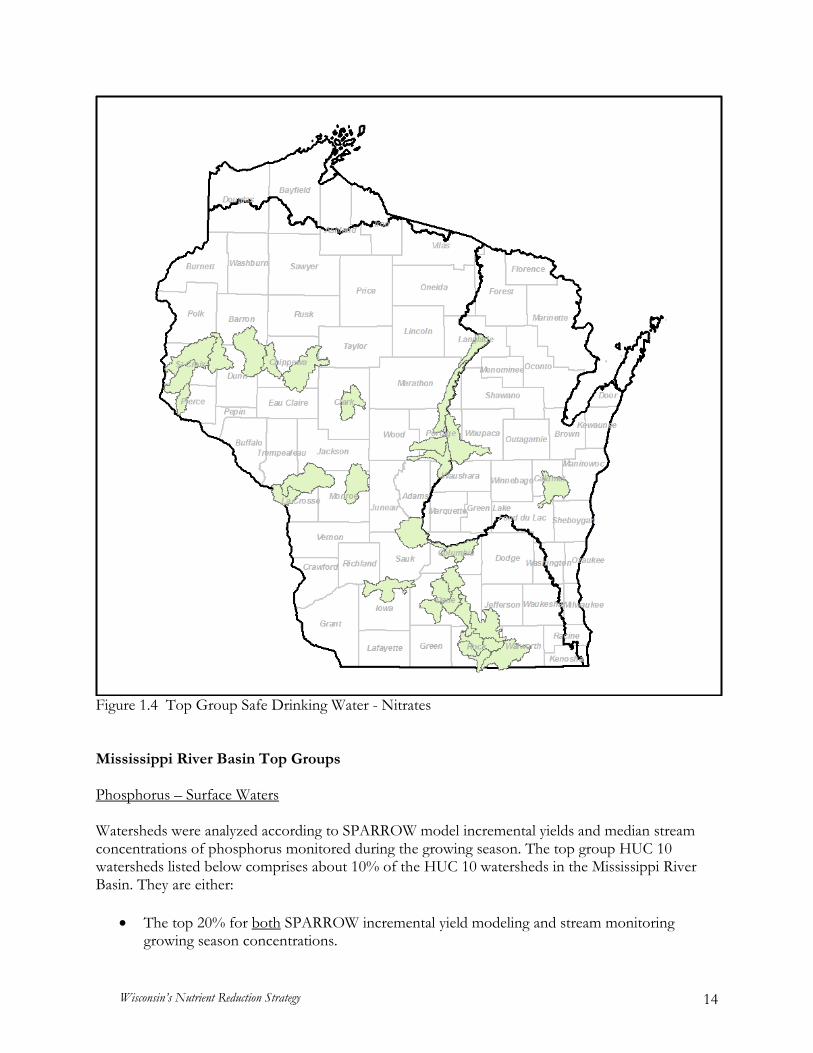
Figure 1.4 Top Group Safe Drinking Water - Nitrates Mississippi River Basin Top Groups Phosphorus – Surface Waters
Watersheds were analyzed according to SPARROW model incremental yields and median stream concentrations of phosphorus monitored during the growing season. The top group HUC 10 watersheds listed below comprises about 10% of the HUC 10 watersheds in the Mississippi River Basin. They are either:
• The top 20% for both SPARROW incremental yield modeling and stream monitoring
growing season concentrations.

Wisconsin’s Nutrient Reduction Strategy 15
• The top 10% of either SPARROW incremental yield modeling or stream monitoring growing season concentrations and the top 30% for the other.
Headwaters of the Big Eau Pleine River, Yellow River and the Black River in western Marathon County, Wood County and Clark County.
0704000702 Popple River 0704000704 Rock Creek-- Black River 0707000215 Dill Creek – Big Eau Pleine River 0707000217 Little Eau Pleine River 0707000311 Rocky Creek – Yellow River
Watersheds in southwestern Wisconsin south of Military Ridge, including those in the Grant-Platte and Sugar-Pecatonica River basins.
0706000303 Lower Grant River 0706000304 Little Platte River 0709000301 Mineral Point Branch 0709000303 Ames Branch – Pecatonica River 0709000304 Dodge Branch 0709000306 Ridgeway Branch – Pecatonica River 0709000307 Yellowstone River 0709000308 East Branch Pecatonica River 0709000309 Spafford Creek – Pecatonica River 0709000310 Honey Creek – Pecatonica River
Watersheds in the Rock River Basin9
0709000101 East Branch Rock River 0709000102 West Branch Rock River – Rock River 0709000104 Sinissippi Lake – Rock River 0709000108 Maunesha River 0709000109 Beaver Dam River 0709000110 Crawfish River 0709000111 Johnson Creek – Rock River
Others
0704000504 Middle Trempealeau River 0704000709 Lake Arbutus – Black River
9 The two HUC 10s draining to Lake Mendota are ranked lower due to the SPARROW analysis where the analytical watershed is at the outlet of Lake Mendota and not at locations entering the lake. In the Rock River TMDL analysis where the SWAT Model was used, these two HUC 10s ranked in the top five HUC 10s in the basin. It is not clear whether as a result of a revised SPARRROW analysis that these two HUC 10s would be in the top group. See sidebar.
Wisconsin’s Nutrient Reduction Strategy 16
Nitrogen – Surface Waters Watersheds were analyzed according to SPARROW model incremental yields and median stream concentrations of total nitrogen monitored during the growing season. The top group HUC 10 watersheds listed below comprises about 15% of the HUC 10 watersheds in the Mississippi River Basin. Many of those listed are also listed for phosphorus above, but a few, such as Blackhawk Creek, are ranked very high for nitrogen but not for phosphorus. Watersheds in Marathon, Clark and Taylor Counties listed above for phosphorus, do not come out as high for nitrogen. Due to similar overall results, a larger list for nitrogen than the list for phosphorus is appropriate. The HUC 10 watersheds are listed based on being in either:
• the top 20% for both SPARROW incremental yield modeling and stream monitoring
growing season concentrations. • the top 10% of either SPARROW incremental yield modeling or stream monitoring growing
season concentrations and the top 30% for the other.
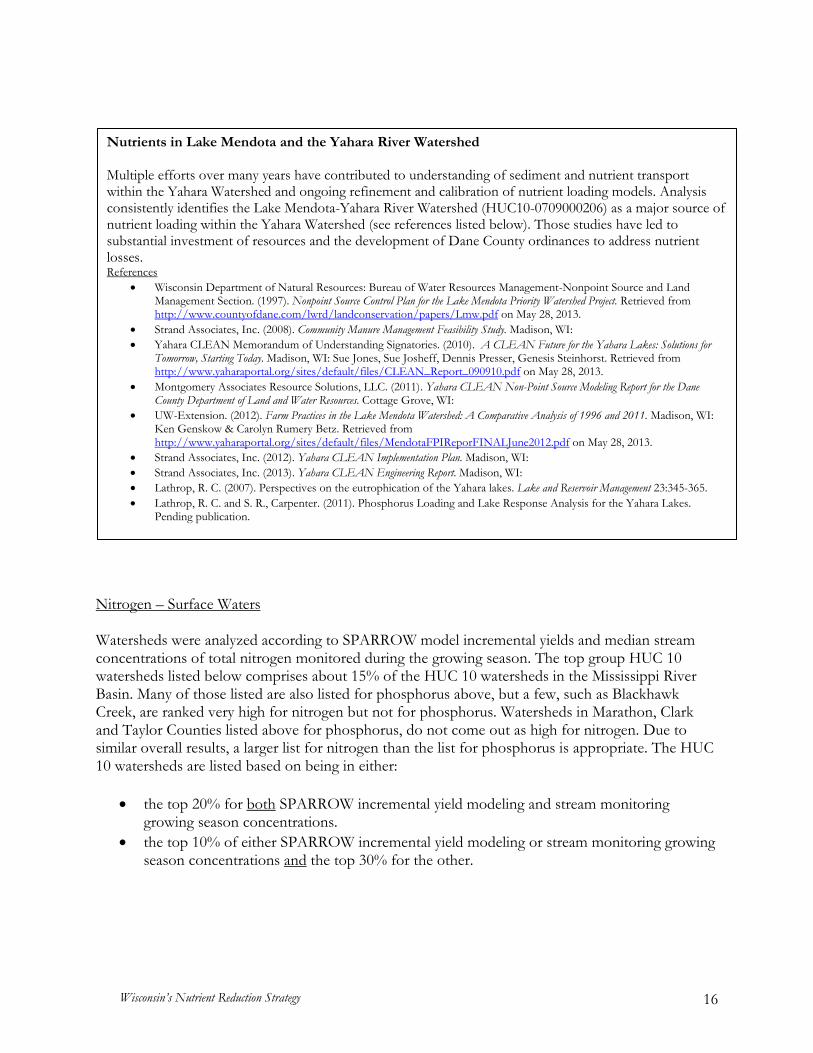
Nutrients in Lake Mendota and the Yahara River Watershed Multiple efforts over many years have contributed to understanding of sediment and nutrient transport within the Yahara Watershed and ongoing refinement and calibration of nutrient loading models. Analysis consistently identifies the Lake Mendota-Yahara River Watershed (HUC10-0709000206) as a major source of nutrient loading within the Yahara Watershed (see references listed below). Those studies have led to substantial investment of resources and the development of Dane County ordinances to address nutrient losses. References
• Wisconsin Department of Natural Resources: Bureau of Water Resources Management-Nonpoint Source and Land Management Section. (1997). Nonpoint Source Control Plan for the Lake Mendota Priority Watershed Project. Retrieved from http://www.countyofdane.com/lwrd/landconservation/papers/Lmw.pdf on May 28, 2013.
• Strand Associates, Inc. (2008). Community Manure Management Feasibility Study. Madison, WI: • Yahara CLEAN Memorandum of Understanding Signatories. (2010). A CLEAN Future for the Yahara Lakes: Solutions for
Tomorrow, Starting Today. Madison, WI: Sue Jones, Sue Josheff, Dennis Presser, Genesis Steinhorst. Retrieved from http://www.yaharaportal.org/sites/default/files/CLEAN_Report_090910.pdf on May 28, 2013.
• Montgomery Associates Resource Solutions, LLC. (2011). Yahara CLEAN Non-Point Source Modeling Report for the Dane County Department of Land and Water Resources. Cottage Grove, WI:
• UW-Extension. (2012). Farm Practices in the Lake Mendota Watershed: A Comparative Analysis of 1996 and 2011. Madison, WI: Ken Genskow & Carolyn Rumery Betz. Retrieved from http://www.yaharaportal.org/sites/default/files/MendotaFPIReporFINALJune2012.pdf on May 28, 2013.
• Strand Associates, Inc. (2012). Yahara CLEAN Implementation Plan. Madison, WI: • Strand Associates, Inc. (2013). Yahara CLEAN Engineering Report. Madison, WI: • Lathrop, R. C. (2007). Perspectives on the eutrophication of the Yahara lakes. Lake and Reservoir Management 23:345-365. • Lathrop, R. C. and S. R., Carpenter. (2011). Phosphorus Loading and Lake Response Analysis for the Yahara Lakes.
Pending publication.

Wisconsin’s Nutrient Reduction Strategy 17
Watersheds in southwestern Wisconsin south of Military Ridge, including those in the Grant-Platte and Sugar-Pecatonica river basins.
0706000301 Upper Grant River 0706000302 Middle Grant River 0706000303 Lower Grant River 0706000304 Little Platte River 0706000305 Platte River 0706000502 Sinsinawa River – Mississippi River 0706000503 Galena River 0706000505 South Fork Apple River – Apple River 0709000301 Mineral Point Branch 0709000302 Headwaters Pecatonica River 0709000303 Ames Branch – Pecatonica River 0709000305 Blue Mounds Branch 0709000306 Ridgeway Branch – Pecatonica River 0709000307 Yellowstone River 0709000308 East Branch Pecatonica River 0709000309 Spafford Creek – Pecatonica River 0709000310 Honey Creek – Pecatonica River 0709000311 Richland Creek 0709000315 Raccoon Creek 0709000401 West Branch Sugar River 0709000402 Headwaters Sugar River 0709000403 Allen Creek 0709000404 Little Sugar River 0709000405 Story Creek – Sugar River 0709000406 Sylvester Creek – Sugar River 0709000407 Taylor Creek – Sugar River
Watersheds in the Rock River
0709000107 Headwaters Crawfish River 0709000108 Maunesha River 0709000110 Crawfish River 0709000204 Koshkonong Creek 0709000208 Badfish Creek 0709000209 Lake Kegonsa – Yahara River 0709000211 Blackhawk Creek 0709000212 Bass Creek 0709000214 Turtle Creek 0709000215 City of Beloit – Lower Rock River
Others
0712000401 Headwaters Des Plaines River

Wisconsin’s Nutrient Reduction Strategy 18
Nitrogen – Drinking Water/Groundwater HUC 10 watersheds with higher nitrogen levels in well water compared to other watersheds in Wisconsin were identified statewide basis. The analysis included both the number and percent of public wells with nitrate concentrations of 5 mg/L or greater. The threshold of 5 mg/L was chosen as being well within the range of “human activity influenced” groundwater degradation for this nutrient, and is also thought to place the public system at greater risk of exceeding the enforcement standard of 10 mg/L. The top 10% of HUC 10 watersheds statewide are considered as the top group, and comprise about 12% of the HUC 10s in the Mississippi River Basin. The HUC 10 watersheds of the top group located within the Mississippi River Basin in order of HUC 10 number are:
0703000510 Willow River 0703000511 Kinnickinnic River 0704000103 Trimbelle River 0704000601 Halfway Creek – Mississippi River 0704000704 Rock Creek – Black River 0704000712 Fleming Creek – Black River 0705000503 Lake Wissota 0705000504 Duncan Creek 0705000705 Lake Chetek 0705000707 Lower Pine Creek – Red Cedar River 0707000211 Spring Brook 0707000301 Plover River 0707000304 Fourmile Creek 0707000305 Tenmile Creek 0707000315 Upper Lemonweir River 0707000319 Dell Creek – Wisconsin River 0707000501 Duck Creek – Wisconsin River 0707000512 City of Spring Green – Wisconsin River 0709000205 Headwaters Yahara River 0709000206 Lake Mendota – Yahara River 0709000207 Lake Monona – Yahara River 0709000209 Lake Kegonsa – Yahara River 0709000210 Lake Koshkonong – Rock River 0709000211 Blackhawk Creek 0709000212 Bass Creek 0709000213 Marsh Creek – Rock River 0709000214 Turtle Creek 0709000215 City of Beloit – Lower Rock River 0709000402 Headwaters Sugar River

Wisconsin’s Nutrient Reduction Strategy 19
Lake Michigan Basin Top Groups Watersheds in the Lake Michigan Basin were analyzed for phosphorus and total nitrogen in surface waters and nitrogen in drinking water/groundwater in the same manner used for the Mississippi River Basin. Phosphorus – Surface Waters Those HUC 10s listed below comprise about 16% of the HUC 10s in the Lake Michigan Basin.
Watersheds in the Manitowoc and Sheboygan River Basins.
0403010103 North Branch Manitowoc River 0403010104 South Branch Manitowoc River 0403010107 Sevenmile & Silver Creeks – Frontal Lake Michigan 0403010108 Pigeon River 0403010112 Black R, Sauk Cr and Sucker Cr – Frontal L. Mich.
Watersheds in the Lower Fox River Basin.
0403020401 Duck Creek – Frontal Green Bay 0403020402 Plum Creek – Fox River 0403020403 East River 0403020404 Fox River – Frontal Green Bay (Apple–Ashwaubenon-Dutchman Creeks)
Watersheds surrounding or west of Lake Winnebago.10
0403020104 Upper Grand River 0403020112 Lake Butte des Mortes 0403020208 Shioc River 0403020213 Bear Creek – Embarrass River 0403020214 Bear Creek – Wolf River. 0403020302 Fond du Lac River
Nitrogen – Surface Waters Those HUC 10s listed below comprise about 13% of the HUC 10s in the Lake Michigan Basin. Many of those listed are also listed for phosphorus above. Watersheds in the Manitowoc, Sheboygan and Milwaukee River Basins.
0403010101 East Twin River – Frontal Lake Michigan 0403010103 North Branch Manitowoc River 0403010104 South Branch Manitowoc River 0403010105 Branch River
10 The relative rank of these watersheds would be lower if the “delivered” SPARROW results are used where trapping of phosphorus within Lake Winnebago is incorporated.
Wisconsin’s Nutrient Reduction Strategy 20
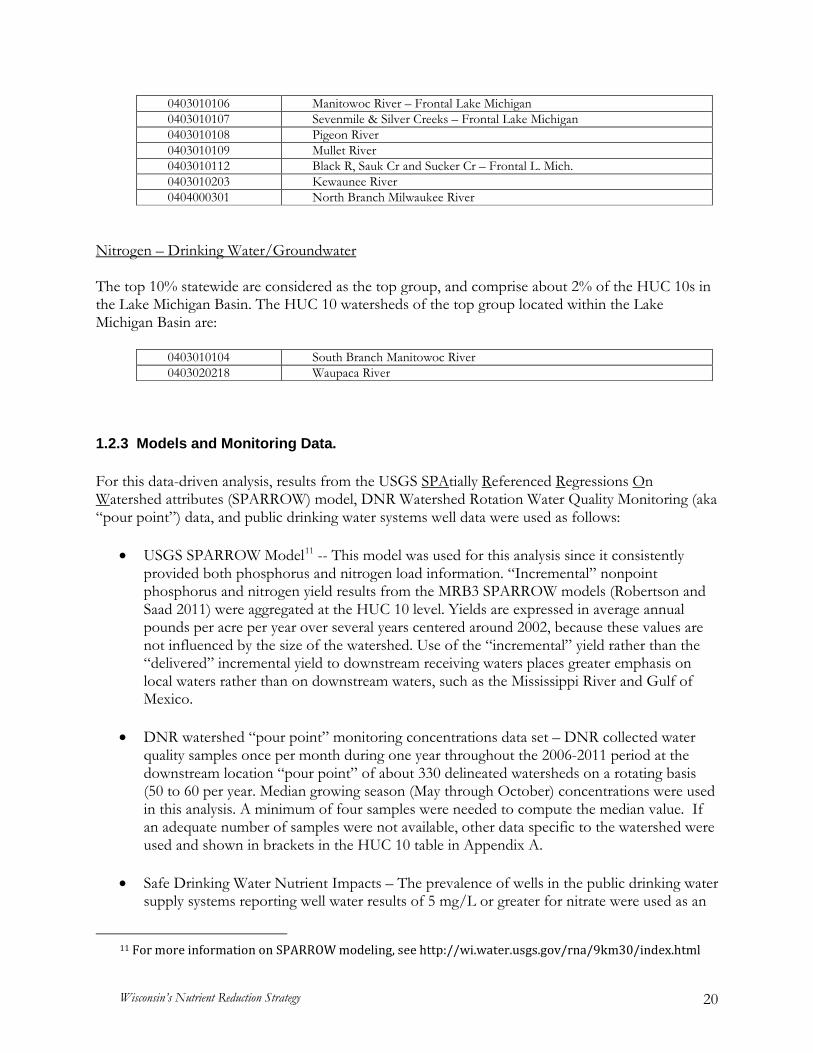
0403010106 Manitowoc River – Frontal Lake Michigan 0403010107 Sevenmile & Silver Creeks – Frontal Lake Michigan 0403010108 Pigeon River 0403010109 Mullet River 0403010112 Black R, Sauk Cr and Sucker Cr – Frontal L. Mich. 0403010203 Kewaunee River 0404000301 North Branch Milwaukee River
Nitrogen – Drinking Water/Groundwater
The top 10% statewide are considered as the top group, and comprise about 2% of the HUC 10s in the Lake Michigan Basin. The HUC 10 watersheds of the top group located within the Lake Michigan Basin are:
0403010104 South Branch Manitowoc River 0403020218 Waupaca River
1.2.3 Models and Monitoring Data. For this data-driven analysis, results from the USGS SPAtially Referenced Regressions On Watershed attributes (SPARROW) model, DNR Watershed Rotation Water Quality Monitoring (aka “pour point”) data, and public drinking water systems well data were used as follows:
• USGS SPARROW Model11 -- This model was used for this analysis since it consistently provided both phosphorus and nitrogen load information. “Incremental” nonpoint phosphorus and nitrogen yield results from the MRB3 SPARROW models (Robertson and Saad 2011) were aggregated at the HUC 10 level. Yields are expressed in average annual pounds per acre per year over several years centered around 2002, because these values are not influenced by the size of the watershed. Use of the “incremental” yield rather than the “delivered” incremental yield to downstream receiving waters places greater emphasis on local waters rather than on downstream waters, such as the Mississippi River and Gulf of Mexico.
• DNR watershed “pour point” monitoring concentrations data set – DNR collected water
quality samples once per month during one year throughout the 2006-2011 period at the downstream location “pour point” of about 330 delineated watersheds on a rotating basis (50 to 60 per year. Median growing season (May through October) concentrations were used in this analysis. A minimum of four samples were needed to compute the median value. If an adequate number of samples were not available, other data specific to the watershed were used and shown in brackets in the HUC 10 table in Appendix A.
• Safe Drinking Water Nutrient Impacts – The prevalence of wells in the public drinking water
supply systems reporting well water results of 5 mg/L or greater for nitrate were used as an
11 For more information on SPARROW modeling, see http://wi.water.usgs.gov/rna/9km30/index.html
Wisconsin’s Nutrient Reduction Strategy 21
approximate indicator that groundwater quality within the watershed shows evidence of significant nutrient impact. Two factors were considered jointly; the frequency of occurrence and the ratio of impacted wells to total active public drinking water systems located in the HUC 10 watershed. Each impacted groundwater well is counted only once for the ten year period from 2003-2012.
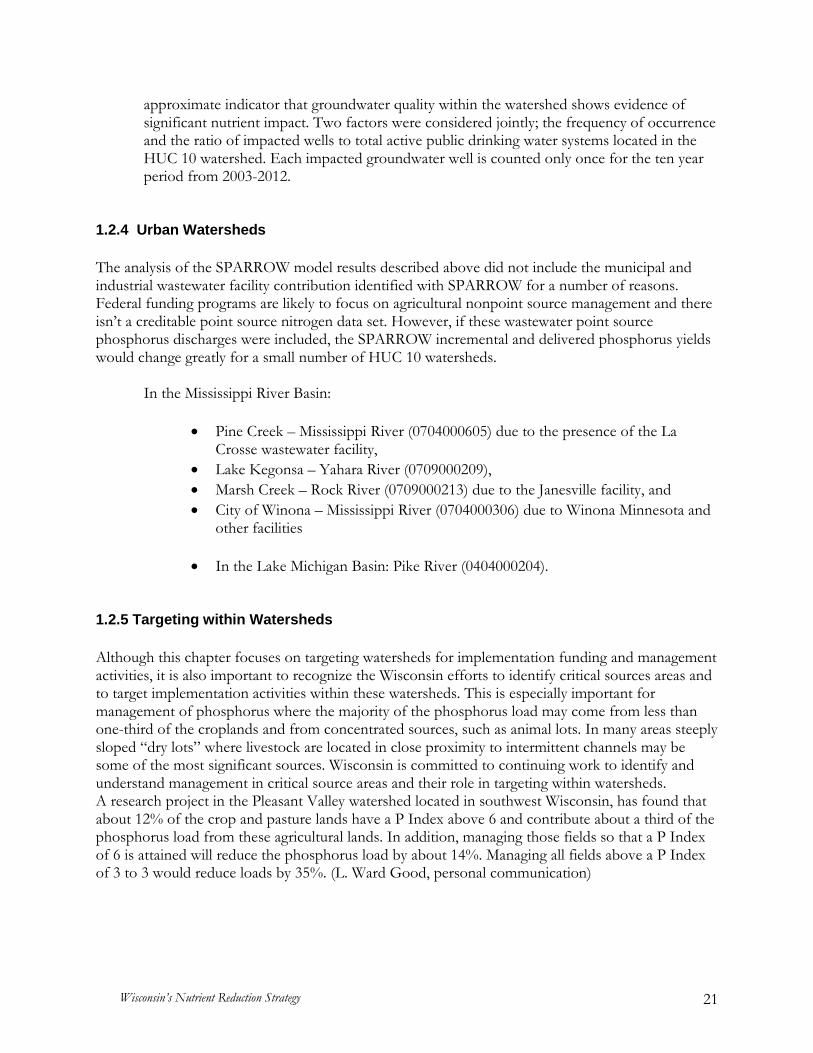
1.2.4 Urban Watersheds
The analysis of the SPARROW model results described above did not include the municipal and industrial wastewater facility contribution identified with SPARROW for a number of reasons. Federal funding programs are likely to focus on agricultural nonpoint source management and there isn’t a creditable point source nitrogen data set. However, if these wastewater point source phosphorus discharges were included, the SPARROW incremental and delivered phosphorus yields would change greatly for a small number of HUC 10 watersheds.
In the Mississippi River Basin:
• Pine Creek – Mississippi River (0704000605) due to the presence of the La Crosse wastewater facility,
• Lake Kegonsa – Yahara River (0709000209), • Marsh Creek – Rock River (0709000213) due to the Janesville facility, and • City of Winona – Mississippi River (0704000306) due to Winona Minnesota and
other facilities
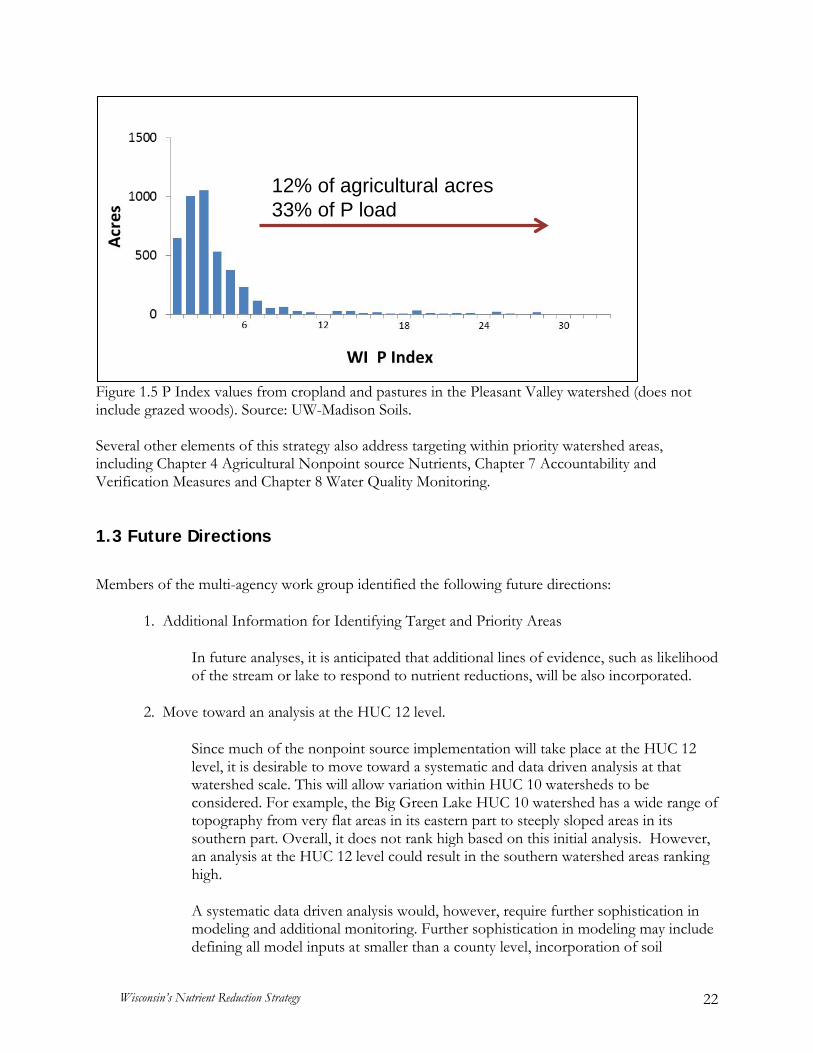
• In the Lake Michigan Basin: Pike River (0404000204). 1.2.5 Targeting within Watersheds Although this chapter focuses on targeting watersheds for implementation funding and management activities, it is also important to recognize the Wisconsin efforts to identify critical sources areas and to target implementation activities within these watersheds. This is especially important for management of phosphorus where the majority of the phosphorus load may come from less than one-third of the croplands and from concentrated sources, such as animal lots. In many areas steeply sloped “dry lots” where livestock are located in close proximity to intermittent channels may be some of the most significant sources. Wisconsin is committed to continuing work to identify and understand management in critical source areas and their role in targeting within watersheds. A research project in the Pleasant Valley watershed located in southwest Wisconsin, has found that about 12% of the crop and pasture lands have a P Index above 6 and contribute about a third of the phosphorus load from these agricultural lands. In addition, managing those fields so that a P Index of 6 is attained will reduce the phosphorus load by about 14%. Managing all fields above a P Index of 3 to 3 would reduce loads by 35%. (L. Ward Good, personal communication)
Wisconsin’s Nutrient Reduction Strategy 22
Figure 1.5 P Index values from cropland and pastures in the Pleasant Valley watershed (does not include grazed woods). Source: UW-Madison Soils. Several other elements of this strategy also address targeting within priority watershed areas, including Chapter 4 Agricultural Nonpoint source Nutrients, Chapter 7 Accountability and Verification Measures and Chapter 8 Water Quality Monitoring. 1.3 Future Directions
Members of the multi-agency work group identified the following future directions:
1. Additional Information for Identifying Target and Priority Areas
In future analyses, it is anticipated that additional lines of evidence, such as likelihood of the stream or lake to respond to nutrient reductions, will be also incorporated.
2. Move toward an analysis at the HUC 12 level.
Since much of the nonpoint source implementation will take place at the HUC 12 level, it is desirable to move toward a systematic and data driven analysis at that watershed scale. This will allow variation within HUC 10 watersheds to be considered. For example, the Big Green Lake HUC 10 watershed has a wide range of topography from very flat areas in its eastern part to steeply sloped areas in its southern part. Overall, it does not rank high based on this initial analysis. However, an analysis at the HUC 12 level could result in the southern watershed areas ranking high.
A systematic data driven analysis would, however, require further sophistication in modeling and additional monitoring. Further sophistication in modeling may include defining all model inputs at smaller than a county level, incorporation of soil
12% of agricultural acres33% of P load

Wisconsin’s Nutrient Reduction Strategy 23
groupings and bedrock geology. However, uniform “pour point” monitoring for each of the 1800 HUC 12 watersheds is beyond the staff time and money of the Department of Natural Resources. Future HUC 12 monitoring may need to be focused on those watersheds likely to rank high as nutrient contributors.
3. Incorporation of information from the Healthy Watersheds Initiative.
The Wisconsin DNR is currently conducting a Healthy Watersheds Initiative assessment to rank watersheds on scales of health and vulnerability. These rankings may be used to target appropriate funding, focus management practices, promote protection through education and assess trends. Incorporation of this assessment could allow targeting on both a restoration and protection basis.

Wisconsin’s Nutrient Reduction Strategy 24
Chapter 2. Setting Nutrient Reduction Targets Element 2. Set Watershed Load Reduction Goals Based Upon Best Available Information 2.1 EPA and Gulf Hypoxia Task Force Expectations
2.1.1 Nutrient Reduction Framework Expectation From EPA’s WQ-26 national performance measure:
1. Develop a methodology to evaluate the nitrogen and phosphorus loadings from all sectors.
2. Establish numeric goals for loading reductions that will likely be needed to meet water quality goals. States may opt to submit a schedule of load reduction targets within interim goals.
Quoting from the recommended elements, “[load reduction] goals should be based upon best available physical, chemical, biological, and treatment/control information from local, state, and federal monitoring, guidance, and assistance activities including implementation of agriculture conservation practices, source water assessment evaluations, watershed planning activities, water quality assessment activities, Total Maximum Daily Loads (TMDL) implementation, and National Pollutant Discharge Elimination System (NPDES) permitting reviews.” For the protection of watersheds that are not impaired, instead of setting load reduction needed to meet water quality goals, the states may determine an alternative baseline for setting load reduction goals. Load reduction goals may be set using, for example, any of the three considerations below:
● Pounds of total phosphorus and/or pounds of total nitrogen; ● Percentage of downstream pour point goal or targeted sector estimated loadings; and ● Water quality standards-based calculation based on flow/volume.
2.1.2 Gulf Hypoxia Task Force Essential Strategy Component
• Evaluate and select analytical tools • Establish current status and trends • Establish quantitative reduction targets
2.2 Wisconsin’s Approach
As illustrated in the Table 2.1, Wisconsin’s federal, state and local programs use a mixture of approaches to meet water quality standards, restore impaired waters, protect interstate downstream waters, protect high quality waters and minimize contaminants reaching groundwater. The specific

Wisconsin’s Nutrient Reduction Strategy 25
programs and their implementation progress are described in subsequent elements of this strategy. The purpose of this chapter is to relate the primary program features to identified water quality goals. Specifically, this chapter describes the following:
• Analytical tools • Current status • Nutrient trends ● Attaining the 45% phosphorus and nitrogen load reductions to the Mississippi River and
Gulf of Mexico. ● Estimating phosphorus load reduction to Lake Michigan. ● Water quality- based effluent limits for municipal and industrial wastewater facilities. (See
description of point source requirements in Chapter 3) ● Wasteload and load reductions identified in EPA-approved TMDLs.
2.2.1 Analytical Tools In developing this strategy a number of analytical tools were used primarily and fall into three groups: analysis of stream, river and well monitoring data; results of modeling and compilations of point source discharge concentrations. The following is a brief description of the analytical tools, why they were selected, how they were used and how they may be used in the future.
• Stream, river and well water monitoring data
Stream, river and well water river monitoring data was used to provide an analysis of the current status of nutrient related water quality in Wisconsin (section 2.2.2 of this chapter), determine which waters are considered impaired under section 303(d) of the Clean Water Act, rank watersheds for targeting future actions (Chapter 1), determining trends (section 2.2.3 of this chapter), measuring and reporting progress (Chapters 8 and 9). Three sets of monitoring data were primarily used in developing this strategy. The first set is data collected at the downstream “pour point” of over 300 watersheds (about HUC 10 watershed size). At each site, data was collected monthly for a 12-month period. Between50 and 60 watersheds were monitored each year from 2006 through 2011. The second set is data collected monthly for a number of decades at long-term river trend sites across the state. Data from these sites was used to conduct the trend analysis summarized in section 2.2.4 and will be part of Wisconsin’s approach for measuring progress. The third set is public well monitoring data from wells across the state. Data from these wells was used in the targeting/priority setting analysis in Chapter 1 of this strategy.
• Modeling
Models are used extensively in nutrient management in Wisconsin with the specific model tied to the specific use. For example, the nutrient model SNAP+ is frequently used to develop cropland nutrient management plans. Total maximum daily load
Wisconsin’s Nutrient Reduction Strategy 26
analyses may use a variety of models including the Soil and Water Assessment Tool (SWAT) to estimate nutrient loads reaching streams. In preparing this strategy, the SPARROW model (see Chapter 1) was used in a number of analyses. SPARROW model results were used to estimate phosphorus and nitrogen yield and loads for HUC 8 watersheds in Chapter 1 and for targeting HUC 10 watersheds also in Chapter 1. SPARROW was selected for these analyses because it provides information for both phosphorus and nitrogen, is available for both the Mississippi River and Great Lakes Basins, is calibrated based on monitoring data and has had extensive review. For future modeling, all available models, including enhanced versions of SPARROW, will be considered.
• Discharge Monitoring Reports and Watershed Project Research Results
Analyses in this strategy also made extensive use of discharge monitoring report information from hundreds of municipal and industrial wastewater facilities and research results from nonpoint source implementation research projects.
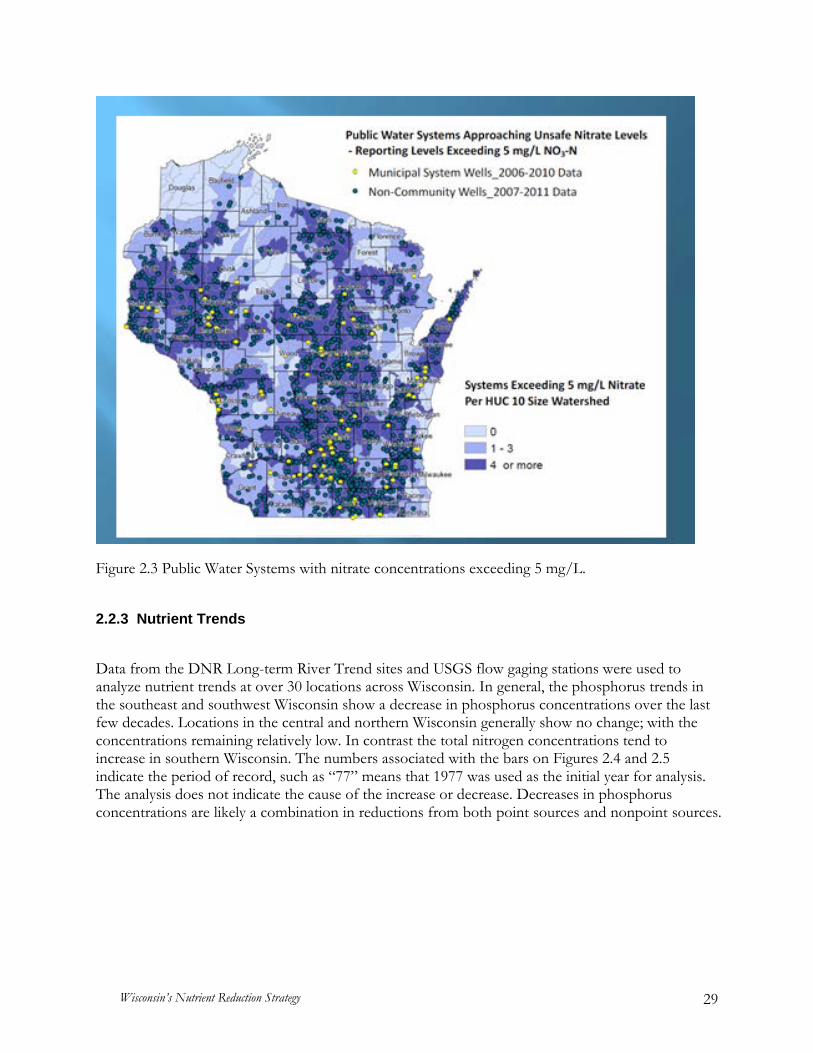
2.2.2 Current Status The current status of Wisconsin’s waters is illustrated by the maps in Figures 2.1, 2.2 and 2.3. For total phosphorus, Figure 2.1 shows about half of the monitoring sites meet the water quality standards criteria and about half of the sites exceed the criteria. The criterion for streams is 0.075 mg/L (75 ug/L) and the criterion for rivers is 0.100 mg/L (100 ug/L). Figure 2.2 shows the total nitrogen concentrations for these same sites. No water quality standards criteria have been adapted for total nitrogen. See Chapter 10 of this strategy for more information. Figure 2.3 shows the locations of public (use) drinking water wells across the state. The non-community public wells include restaurants, bars, schools, etc. The drinking water quality standard is 10 mg/l for nitrate and the preventive action level is 2 mg/L.

Wisconsin’s Nutrient Reduction Strategy 27
Figure 2.1 Stream Phosphorus Concentrations (Median May-October)
Water quality standards criteria are 0.075 mg/L for streams and 0.10 mg/L for listed rivers

Wisconsin’s Nutrient Reduction Strategy 28
Figure 2.2 Stream Nitrogen Concentrations (Median May-October)
No water quality standards criterion for total nitrogen has been adopted
Wisconsin’s Nutrient Reduction Strategy 29
Figure 2.3 Public Water Systems with nitrate concentrations exceeding 5 mg/L. 2.2.3 Nutrient Trends Data from the DNR Long-term River Trend sites and USGS flow gaging stations were used to analyze nutrient trends at over 30 locations across Wisconsin. In general, the phosphorus trends in the southeast and southwest Wisconsin show a decrease in phosphorus concentrations over the last few decades. Locations in the central and northern Wisconsin generally show no change; with the concentrations remaining relatively low. In contrast the total nitrogen concentrations tend to increase in southern Wisconsin. The numbers associated with the bars on Figures 2.4 and 2.5 indicate the period of record, such as “77” means that 1977 was used as the initial year for analysis. The analysis does not indicate the cause of the increase or decrease. Decreases in phosphorus concentrations are likely a combination in reductions from both point sources and nonpoint sources.

Wisconsin’s Nutrient Reduction Strategy 30
Figure 2.4 Total phosphorus concentration trends at Wisconsin River Long-Term Trend sites.
Figure 2.5 Total nitrogen concentration trends at Wisconsin Long-term River Trend sites.
0
0.1
0.2
0.3
0.4
0.5
0.6
0.7
0.8
0.9
TP (m
g/L)
0
1
2
3
4
5
6
7
TN (m
g/L)
Initial year of monitoring data; generally 1977
Latest year of monitoring data; generally 2010
Initial year of monitoring data; generally 1977
Latest year of monitoring data; generally 2010

Wisconsin’s Nutrient Reduction Strategy 31
. 2.2.4 General Approach for Nutrient Management in Wisconsin Wisconsin programs use a variety of technology-based and water quality based approaches to manage nutrients. Technology-based approaches tend to be uniform and tied to readily available technology or practice. They do not vary by the condition of the water quality. They may, however, be adequate to result in water quality standards being met in various locations. In contrast, water quality-based approaches tailor the level of management to the specific water quality needs. For example, a total maximum daily load (TMDL) analysis for a watershed tailors both the point source and nonpoint source management to meet water quality standards. Table 2.1 shows the mix of technology-based and water quality-based approaches used by Wisconsin programs. Table 2.1 Overview of Wisconsin Water Quality-Based Approach by Sector
Sector (described in subsequent chapters)
Technology or uniform approach
Water quality standards – based approach
Other
Agricultural nonpoint sources
State adopted performance standards and prohibitions and local ordinance requirements. Practices to implement performance standards and prohibitions designed to minimize impact on groundwater.
Potentially identified as part of a TMDL implementation plan
Other conservation practices and programs, such as stream bank stabilization, riparian buffers, enrollment in Conservation Reserve Program, animal lot abandonment. Also, through source water (wellhead) protection plans
Concentrated Animal Feeding Operations -- WPDES permits
Federal and state-enacted requirements on “no discharge” from animal lot (less than 25-year, 24-hour storm) and compliance with state adopted performance standards (NR 243). Practices to implement performance standards and prohibitions designed to minimize impact on groundwater.
Potentially identified as part of a TMDL implementation plan Permits may include specific requirements to meet groundwater quality standards
Municipal Separate Storm Sewer Systems – WPDES permits
Federal minimum management measures and state-enacted performance standards. Practices to implement performance standards and prohibitions designed to minimize impact on groundwater.
Potentially identified as part of a TMDL implementation plan
Non-permitted urban areas or activities
State adopted performance standards and prohibitions. Practices to implement
Potentially identified as part of a TMDL implementation plan

Wisconsin’s Nutrient Reduction Strategy 32
performance standards and prohibitions designed to minimize impact on groundwater.
Publicly and privately owned (e.g. municipal and industrial) wastewater treatment facilities – WPDES permits
Federal and state adopted technology-based requirements, including Subchapter II of NR 217 (1 mg/L or alternate limit). Also federal and state groundwater protection requirements.
Water quality based effluent limits based on federal and state requirements, including Subchapter III of NR 217 for phosphorus and NR 106 for ammonia
Note: Water quality based effluent limit compliance may be achieved through water quality trading or through implementation of a watershed adaptive management option plan
On-site waste disposal systems
State adopted WPDES requirements or state sanitary code.
2.2.5 Mississippi River Basin/Gulf Hypoxia – 45% Reduction Goal Wisconsin should be able to reach the 45% reduction goal for phosphorus load reduction to the Mississippi River and subsequently to the Gulf of Mexico, based on an analysis conducted by the Department of Natural Resources. This presumes a 1995 base year and phosphorus reduction from point sources and nonpoint sources within the Mississippi River Basin within Wisconsin beginning in that base year and going into the future. The analysis assumes current programs and current requirements for those programs. 1995 Baseline. Consistent with the Gulf Hypoxia Action Plan, 1995 was selected as a base year. Phosphorus loads were derived for the Wisconsin portion of each of the 32 HUC 8s in Wisconsin’s Mississippi River Basin using 1995 point source monitored loads and “2002 normalized” SPARROW nonpoint source load estimates.12 For most of the Mississippi River Basin, the 1995 point source load was not the dominant source of the estimated phosphorus loads, and the substitution for the 1995 point source loads for the 2002 point source loads would not significantly influence the baseline loads. Under the derived 1995 baseline, the combination of point source and nonpoint source loads by HUC 8 are shown in the Table 2.2 and Figure 2.6. Although Wisconsin’s technology-based phosphorus effluent limits became effective statewide in late 1992, they were phased-in primarily in the late-1990s as new permits were issued with compliance dates set within the five-year permit term. Projected Reduction. The projected reduction is estimated for both point sources and nonpoint sources using existing data and a series of assumptions. This projection does not specify a time period.
12 For wastewater point sources 1995 discharge monitoring report data were used, if available. If not, data from the closest year were used. The 2002 SPARROW model results were deemed appropriate for a 1995 nonpoint source baseline since the calibration data used by USGS were collected near to 2002, including data that may have been collected five, ten or more years prior to 2002. For each HUC 8, the 2002 point source loads were subtracted from the total “2002-normalized: SPARROW load to derive a nonpoint source estimate.

Wisconsin’s Nutrient Reduction Strategy 33
For municipal and industrial wastewater treatment facilities, the projected reduction is based on comparing the actual or estimated 1995 baseline phosphorus loads to the actual 2009 point source contribution on a facility-by-facility basis using discharge monitoring report information. Discharges for 2009 are very similar to those for 2010 and 2011, and reflect current conditions and compliance with state WPDES permit program technology-based phosphorus control requirements described in Subchapter II of NR 217, Wis. Adm. Code. For the basin as a whole, the wastewater point source phosphorus discharge has been reduced by 67percent since the 1995 baseline. Compliance with the more recent water quality-based requirements in Subchapter III of NR 217 may produce additional load reductions. However, compliance with these newer requirements may come in the form of water quality trading or implementation of watershed plans under the Wisconsin watershed adaptive management option. As such, there could be some overlap with the nonpoint source load reduction. Thus, the 2009 conditions are used in conservatively estimating future phosphorus loads from these facilities. For storm water management in urban areas, the analysis assumes a 10% phosphorus load reduction. Current WPDES permits call for a 20% or 40% reduction in suspended solids loads. It is assumed that the phosphorus load reduction will be one-third to one-half of the reduction for suspended solids load reduction. Thus, the 10% load reduction is conservatively assumed for urban areas. Some TMDLs may call for further reduction. For agricultural lands, two assumptions are made:
• A 10% load reduction from 1995 to present. With substantial implementation of federal, state and local conservation programs, a higher reduction could be assumed. However, available data, such as from the NRCS Natural Resource Inventory, shows a degree of backsliding in Wisconsin and other states during this period. Taking land out of the Conservation Reserve Program is commonly cited as one of the reasons for falling back. On the other hand there is much anecdotal information from across the state that many smaller animal lots immediately adjacent to streams have been removed, and new slope diversions have been installed on many other animal lots. Thus, the 10% reduction represents a conservative reduction from 1995 to present.
• A 30% reduction into the future. Experience in the Pleasant Valley watershed project in southwestern Wisconsin shows that a 25 to 30% reduction is reasonable to achieve through meeting the phosphorus index performance standard. Compliance with other performance standards will increase the percent reduction. Thus, a 30% future reduction is deemed a reasonable further reduction.13 This reduction may be achieved through the programs listed in Chapter 3 of this strategy, including NRCS’s Environmental Incentives Program, DNR’s Runoff Management Program (including Targeted Runoff Management Grants and Notice of Discharge grants); DATCP’s Farmland Preservation/Working Lands Initiative and county programs.
For all other lands, such as wetlands, barren lands and wooded lands, no reduction is assumed. Using the above assumptions, about a 40% reduction is estimated. It is further expected that reductions in phosphorus load needed to implement TMDLs will bridge the remaining gap to
13 Personal communication Laura Ward Good, University of Wisconsin – Madison.

Wisconsin’s Nutrient Reduction Strategy 34
achieve the 45% reduction goal. Table 2.3 and Figure 2.7 show the projected reduction for each Mississippi River Basin HUC 8 watershed using the assumptions described above.
Table 2.2. 1995 Baseline Phosphorus Loads by HUC 8 Watershed (listed in order of decreasing nonpoint source yields)
8-Digit HUC Name
Nonpoint Source Load
(lb/yr) (1)
1995 Point Source Load (lb/yr) (2)
1995 Total Load (lb/yr)
% Nonpoint Source
% Point Source
Grant-Little Maquoketa
499,755 27,404 527,159 95% 5% Pecatonica River 642,667 19,391 662,058 97% 3% Apple-Plum Rivers 82,735 7,293 90,028 92% 8% Coon-Yellow Rivers 254,458 15,657 270,115 94% 6% Des Plaines River 44,392 8,283 52,675 84% 16% Sugar River 216,708 27,743 244,451 89% 11% Kickapoo River 229,545 19,359 248,904 92% 8% Lower Rock River 236,423 379,639 616,062 38% 62% Upper Rock River 401,250 330,414 731,664 55% 45% Baraboo River 186,795 28,045 214,840 87% 13% Buffalo-Whitewater Rivers 206,814 7,482 214,296 97% 3% Rush-Vermillion Rivers 121,479 13,780 135,259 90% 10% Lower Wisconsin River 538,274 21,454 559,728 96% 4% Trempealeau River 527,810 45,467 573,277 92% 8% Black River 477,914 55,769 533,683 90% 10% La Crosse-Pine Rivers 119,466 255,094 374,560 32% 68% Lake Dubay 519,094 124,151 643,245 81% 19% Eau Claire River 138,624 2,706 141,330 98% 2% Lower Chippewa River 317,434 59,941 377,375 84% 16% Upper Fox River 136,103 61,372 197,475 69% 31% Red Cedar River 268,346 35,295 303,641 88% 12% Castle-Rock 353,684 514,524 868,208 41% 59% Lower St. Croix River 209,114 27,256 236,370 88% 12% Jump River 105,681 2,245 107,926 98% 2% Upper Chippewa River 161,258 549 161,807 100% 0% Upper St. Croix River 99,276 1,238 100,514 99% 1% Namekagon River 49,827 - 49,827 100% 0% Flambeau River 61,762 46,602 108,364 57% 43% South Fork Flambeau River 39,125 5,243 44,368 88% 12% Upper Wisconsin River 85,220 81,442 166,662 51% 49% Totals 7,331,035 2,224,838 9,555,873 77% 23%
Table Notes:
(1)Nonpoint sources include agricultural lands, urban lands, wetlands, woodlands, etc. (2) Point source loads do not include urban storm water runoff, CAFOs, and biosolids application to land. These runoff related point sources are included in the nonpoint source column.
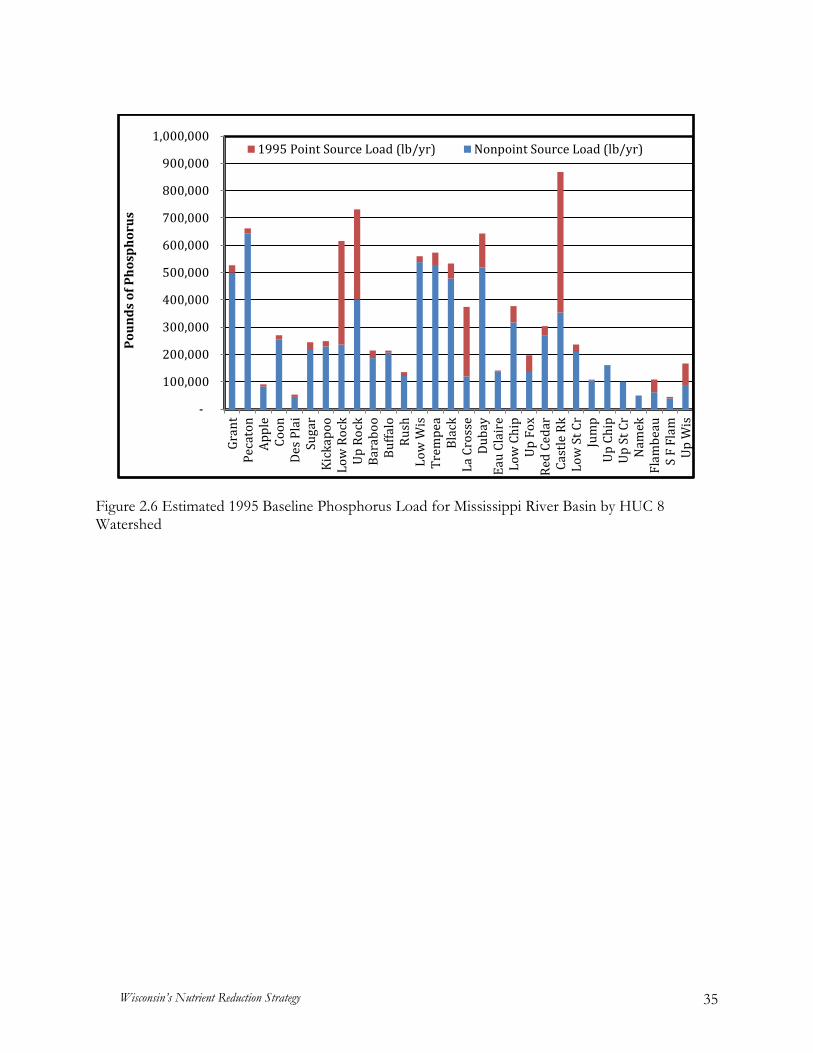
Wisconsin’s Nutrient Reduction Strategy 35
Figure 2.6 Estimated 1995 Baseline Phosphorus Load for Mississippi River Basin by HUC 8 Watershed
-
100,000
200,000
300,000
400,000
500,000
600,000
700,000
800,000
900,000
1,000,000
Gran
tPe
cato
nAp
ple
Coon
Des P
lai
Suga
rKi
ckap
ooLo
w R
ock
Up R
ock
Bara
boo
Buffa
loRu
shLo
w W
isTr
empe
aBl
ack
La C
ross
eDu
bay
Eau
Clai
reLo
w C
hip
Up F
oxRe
d Ce
dar
Cast
le R
kLo
w S
t Cr
Jum
pUp
Chi
pUp
St C
rN
amek
Flam
beau
S F
Flam
Up W
is
Poun
ds o
f Pho
spho
rus
1995 Point Source Load (lb/yr) Nonpoint Source Load (lb/yr)
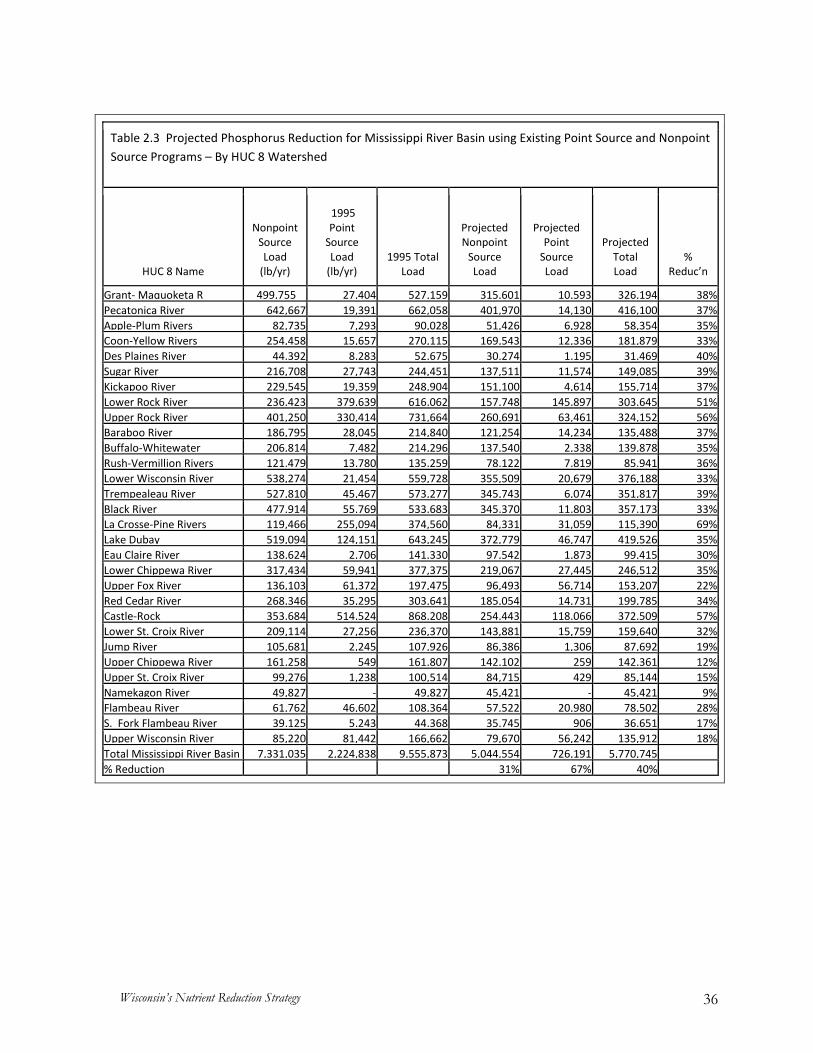
Wisconsin’s Nutrient Reduction Strategy 36
Table 2.3 Projected Phosphorus Reduction for Mississippi River Basin using Existing Point Source and Nonpoint Source Programs – By HUC 8 Watershed
HUC 8 Name
Nonpoint
Source Load
(lb/yr)
1995 Point
Source Load
(lb/yr) 1995 Total
Load
Projected Nonpoint
Source Load
Projected Point
Source Load
Projected Total Load
% Reduc’n
Grant- Maquoketa R 499,755 27,404 527,159 315,601 10,593 326,194 38% Pecatonica River 642,667 19,391 662,058 401,970 14,130 416,100 37% Apple-Plum Rivers 82,735 7,293 90,028 51,426 6,928 58,354 35% Coon-Yellow Rivers 254,458 15,657 270,115 169,543 12,336 181,879 33% Des Plaines River 44,392 8,283 52,675 30,274 1,195 31,469 40% Sugar River 216,708 27,743 244,451 137,511 11,574 149,085 39% Kickapoo River 229,545 19,359 248,904 151,100 4,614 155,714 37% Lower Rock River 236,423 379,639 616,062 157,748 145,897 303,645 51% Upper Rock River 401,250 330,414 731,664 260,691 63,461 324,152 56% Baraboo River 186,795 28,045 214,840 121,254 14,234 135,488 37% Buffalo-Whitewater 206,814 7,482 214,296 137,540 2,338 139,878 35% Rush-Vermillion Rivers 121,479 13,780 135,259 78,122 7,819 85,941 36% Lower Wisconsin River 538,274 21,454 559,728 355,509 20,679 376,188 33% Trempealeau River 527,810 45,467 573,277 345,743 6,074 351,817 39% Black River 477,914 55,769 533,683 345,370 11,803 357,173 33% La Crosse-Pine Rivers 119,466 255,094 374,560 84,331 31,059 115,390 69% Lake Dubay 519,094 124,151 643,245 372,779 46,747 419,526 35% Eau Claire River 138,624 2,706 141,330 97,542 1,873 99,415 30% Lower Chippewa River 317,434 59,941 377,375 219,067 27,445 246,512 35% Upper Fox River 136,103 61,372 197,475 96,493 56,714 153,207 22% Red Cedar River 268,346 35,295 303,641 185,054 14,731 199,785 34% Castle-Rock 353,684 514,524 868,208 254,443 118,066 372,509 57% Lower St. Croix River 209,114 27,256 236,370 143,881 15,759 159,640 32% Jump River 105,681 2,245 107,926 86,386 1,306 87,692 19% Upper Chippewa River 161,258 549 161,807 142,102 259 142,361 12% Upper St. Croix River 99,276 1,238 100,514 84,715 429 85,144 15% Namekagon River 49,827 - 49,827 45,421 - 45,421 9% Flambeau River 61,762 46,602 108,364 57,522 20,980 78,502 28% S. Fork Flambeau River 39,125 5,243 44,368 35,745 906 36,651 17% Upper Wisconsin River 85,220 81,442 166,662 79,670 56,242 135,912 18% Total Mississippi River Basin 7,331,035 2,224,838 9,555,873 5,044,554 726,191 5,770,745 % Reduction 31% 67% 40%
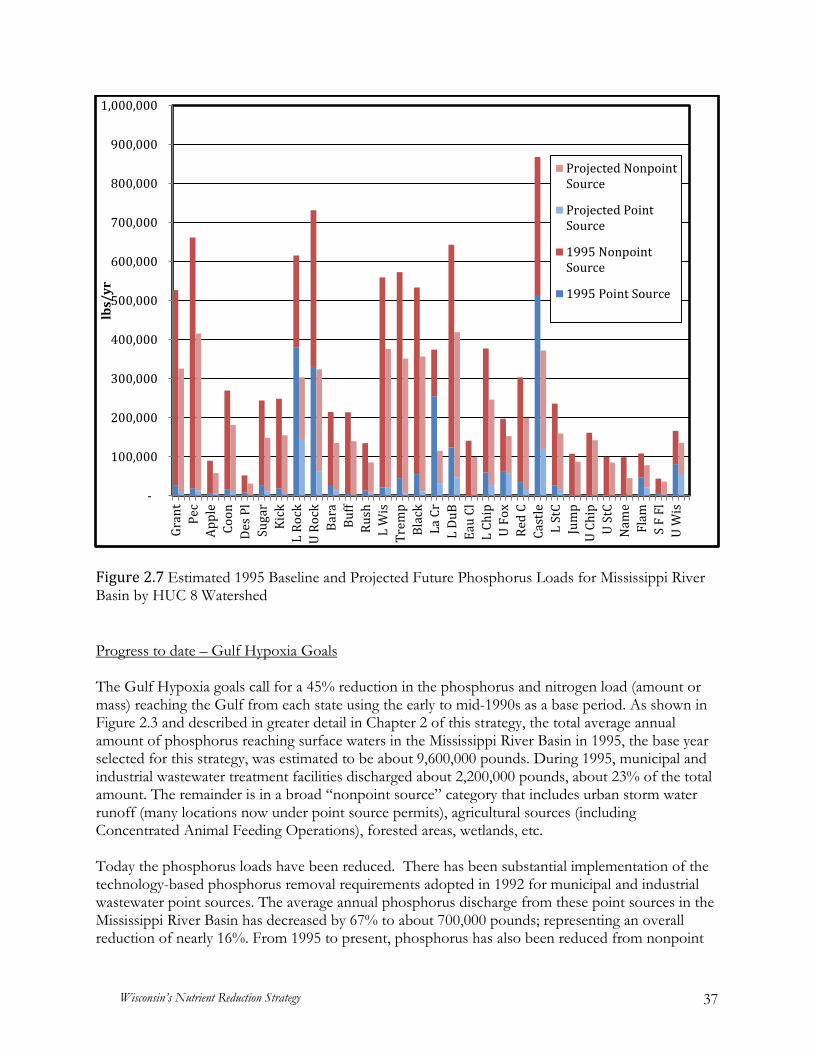
Wisconsin’s Nutrient Reduction Strategy 37
Figure 2.7 Estimated 1995 Baseline and Projected Future Phosphorus Loads for Mississippi River Basin by HUC 8 Watershed Progress to date – Gulf Hypoxia Goals The Gulf Hypoxia goals call for a 45% reduction in the phosphorus and nitrogen load (amount or mass) reaching the Gulf from each state using the early to mid-1990s as a base period. As shown in Figure 2.3 and described in greater detail in Chapter 2 of this strategy, the total average annual amount of phosphorus reaching surface waters in the Mississippi River Basin in 1995, the base year selected for this strategy, was estimated to be about 9,600,000 pounds. During 1995, municipal and industrial wastewater treatment facilities discharged about 2,200,000 pounds, about 23% of the total amount. The remainder is in a broad “nonpoint source” category that includes urban storm water runoff (many locations now under point source permits), agricultural sources (including Concentrated Animal Feeding Operations), forested areas, wetlands, etc. Today the phosphorus loads have been reduced. There has been substantial implementation of the technology-based phosphorus removal requirements adopted in 1992 for municipal and industrial wastewater point sources. The average annual phosphorus discharge from these point sources in the Mississippi River Basin has decreased by 67% to about 700,000 pounds; representing an overall reduction of nearly 16%. From 1995 to present, phosphorus has also been reduced from nonpoint
-
100,000
200,000
300,000
400,000
500,000
600,000
700,000
800,000
900,000
1,000,000
Gran
tPe
cAp
ple
Coon
Des P
lSu
gar
Kick
L Ro
ckU
Rock
Bara
Buff
Rush
L W
isTr
emp
Blac
kLa
Cr
L Du
BEa
u Cl
L Ch
ipU
Fox
Red
CCa
stle
L St
CJu
mp
U Ch
ipU
StC
Nam
eFl
amS
F Fl
U W
is
lbs/
yr
Projected NonpointSource
Projected PointSource
1995 NonpointSource
1995 Point Source
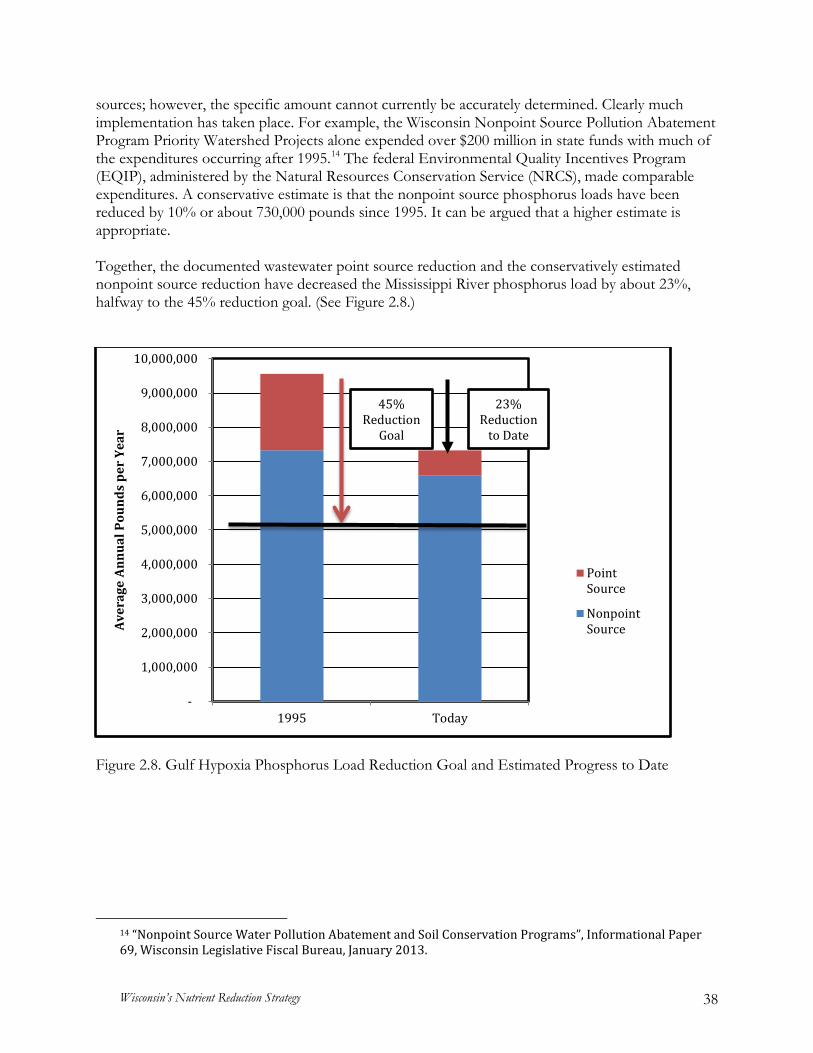
Wisconsin’s Nutrient Reduction Strategy 38
sources; however, the specific amount cannot currently be accurately determined. Clearly much implementation has taken place. For example, the Wisconsin Nonpoint Source Pollution Abatement Program Priority Watershed Projects alone expended over $200 million in state funds with much of the expenditures occurring after 1995.14 The federal Environmental Quality Incentives Program (EQIP), administered by the Natural Resources Conservation Service (NRCS), made comparable expenditures. A conservative estimate is that the nonpoint source phosphorus loads have been reduced by 10% or about 730,000 pounds since 1995. It can be argued that a higher estimate is appropriate. Together, the documented wastewater point source reduction and the conservatively estimated nonpoint source reduction have decreased the Mississippi River phosphorus load by about 23%, halfway to the 45% reduction goal. (See Figure 2.8.)
Figure 2.8. Gulf Hypoxia Phosphorus Load Reduction Goal and Estimated Progress to Date
14 “Nonpoint Source Water Pollution Abatement and Soil Conservation Programs”, Informational Paper 69, Wisconsin Legislative Fiscal Bureau, January 2013.
-
1,000,000
2,000,000
3,000,000
4,000,000
5,000,000
6,000,000
7,000,000
8,000,000
9,000,000
10,000,000
1995 Today
Aver
age
Annu
al P
ound
s pe
r Ye
ar
PointSource
NonpointSource
45% Reduction
Goal
23% Reduction
to Date

Wisconsin’s Nutrient Reduction Strategy 39
2.2.6 Lake Michigan – Estimated Phosphorus Load Reduction No phosphorus or nitrogen load reduction goal has been identified for Lake Michigan. Presently, open water portions of Lake Michigan are meeting the phosphorus water quality standards criterion of 7 ug/L. Nearshore waters may be exceeding the water quality standards criterion. A load reduction, however, can be estimated through implementation of ongoing programs. A phosphorus load reduction is estimated for Lake Michigan, including Green Bay, using the same assumptions, data inputs and analysis described for the Mississippi River Basin above and shown in Table 2.4 and Figure 2.9 below. The following items help illustrate differences between the two major basins:
● The majority of the municipal wastewater treatment plant discharge reduction came in the 1980s, prior to the base year, as a result of international agreements for phosphorus reductions for the Great Lakes. As a result, the point source phosphorus loads have remained unchanged or even increased in some of the HUC 8s since 1995.
● Some reductions in municipal wastewater facility phosphorus discharges have occurred, with the largest being at the Milwaukee Metropolitan Sewerage District plants.
● There has been a decrease in phosphorus discharges since 1995 from industrial wastewater facilities. ● For this analysis, urban storm water discharges are included in the nonpoint source category (as they
are in SPARROW). Given the large urban areas within a number of the HUC 8s of the Lake Michigan Basin, this is a large component of the nonpoint source load for those HUC 8s.

Wisconsin’s Nutrient Reduction Strategy 40
Table 2.4 Projected Phosphorus Reduction for Lake Michigan using Existing Point Source and Nonpoint Source Programs – By HUC 8
HUC 8 Name
Nonpoint Source Load
(lb/yr)
1995 Point Source Load
(lb/yr) 1995 Total
Load
Projected Nonpoint
Source Load
Projected Point
Source Load Projected
Total Load %
Reduc’n
Lower Fox River 270,672 344,201 614,873 193,293 157,807 351,100 43%
Pensaukee River 133,995 524 134,519 90,204 748 90,952 32%
Manitowoc-Sheboygan 458,625 87,646 546,271 300,839 69,289 370,128 32%
Lake Winnebago 114,353 19,628 133,981 77,207 18,942 96,149 28%
Door-Kewaunee Rivers 221,589 6,530 228,119 147,842 4,927 152,769 33%
Pike-Root Rivers 94,562 925,951 1,020,513 72,623 364,311 436,934 57%
Milwaukee River 212,662 80,206 292,868 157,419 41,982 199,401 32%
Upper Fox River 229,076 30,374 259,450 155,161 25,945 181,106 30%
Wolf River 489,918 49,403 539,321 350,479 25,945 376,424 30%
Oconto River 125,579 6,720 132,299 97,447 7,847 105,294 20%
Brule River 14,577 - 14,577 13,626 13,626 7%
Peshtigo River 85,594 10,733 96,327 69,133 4,278 73,411 24%
Menominee River 94,861 38,367 133,228 86,870 6,323 93,193 30% Total Lake Michigan Basin 2,546,061 1,600,283 4,146,344 1,812,143 728,344 2,540,487
% Reduction 29% 54% 39%

Wisconsin’s Nutrient Reduction Strategy 41
Figure 2.9 Estimated 1995 Baseline and Projected Future Phosphorus Load for Lake Michigan Basin by HUC 8 Watershed15 Progress to Date – Lake Michigan Basin As shown in Figure 2.10, there has been an estimated 27% reduction since 1995 using the same analysis as used for the Mississippi River Basin. The municipal and industrial wastewater point sources’ phosphorus loads have been reduced by 54%. However, there has been substantial reduction in phosphorus discharges in the 1980s, prior to the 1995 base year. No phosphorus or nitrogen load reduction goals have been identified for Lake Michigan.
15 Man-Sheb = Manitowoc and Sheboygan; Pensau = Pensaukee; Menom = Menominee; Up Fox = Upper Fox; Lake Winn = Lake Winnebago; Low Fox = Lowr Fox and Milwau = Milwaukee
-
200,000
400,000
600,000
800,000
1,000,000
1,200,000Lb
s/Ye
ar
Projected NPS Projected PS 1995 NPS 1995 PS

Wisconsin’s Nutrient Reduction Strategy 42
Figure 2.10 Lake Michigan Basin Phosphorus Load Reduction Estimated Progress to Date 2.2.7 Total Maximum Daily Load Analyses Implementation of TMDLs will provide additional phosphorus load reductions beyond what would be achieved through compliance with the Chapter NR 151, Wis. Adm. Code, performance standards and prohibitions (see Chapter 4 for more information). TMDLs are the primary means for setting watershed specific load reductions for Wisconsin lakes and streams identified as impaired (not meeting water quality standards). In each TMDL analysis involving nutrients, such as phosphorus, specific load reductions are identified for both point sources and nonpoint sources (wasteload allocations and load allocations) that are necessary to attain water quality standards. For many TMDL analyses, a level of nutrient reduction for nonpoint sources will exceed the reduction provided by the Chapter NR 151 performance standards and prohibitions. That is, compliance with the performance standards and prohibitions may not be adequate to achieve phosphorus water quality standards criteria. Implementation plans for approved TMDLs will specify what additional control is needed.
-
500,000
1,000,000
1,500,000
2,000,000
2,500,000
3,000,000
3,500,000
4,000,000
4,500,000
1995 Today
Aver
age
Annu
al P
ound
s pe
r Ye
ar
Point Source
Nonpoint Source
27% Reduction to Date
Wisconsin’s Nutrient Reduction Strategy 43
Chapter 3 – Point Source Permits Element 3. Ensure Effectiveness of Point Source Permits in Targeted/Priority Sub-watersheds for Wastewater facilities, CAFOs, and Urban Storm Water 3.1 EPA and Gulf Hypoxia Task Force Expectations
EPA’s expectation emphasizes ensuring that point source control permits in targeted or priority watersheds are effective with respect to:
"A. Municipal and Industrial Wastewater Treatment facilities that contribute to significant and measureable N & P loadings,
"B. All Concentrated Animal Feeding Operations (CAFOs) that discharge or propose to discharge, and/or
"C. Urban Storm water sources that discharge into N & P- impaired waters or are otherwise identified as a significant source [of nitrogen and phosphorus].”
3.2 Wisconsin’s Approach
Wisconsin conducts a statewide water quality permit program to control phosphorus contributions from municipal and industrial wastewater treatment facilities, concentrated animal feeding operations (CAFO), and urban storm water sources. The Wisconsin Pollutant Discharge Elimination System (WPDES) permit program is established by Chapter 283, Wisconsin Statutes, and delegated authority to administer the federal Clean Water Act permit program. WPDES permits are issued by the DNR Bureaus of Water Quality and Watershed Management, with federal oversight from EPA. Wisconsin’s Office of the Attorney General provides legal resources for enforcement. Permits for groundwater discharges are issued under state law. DNR is responsible for the issuance, reissuance, modification, and enforcement of all WPDES permits issued for discharges into the waters of Wisconsin, except discharges occurring on Native American lands which are regulated directly by EPA. Wisconsin regulates discharges to both groundwater and surface water. Facilities discharging wastewater from a specific point (end of a pipe) must meet either the federal minimum requirements for secondary treatment for municipalities and technology-based categorical (or base level) limits for industries; or, the discharges must meet levels necessary to achieve water quality standards, whichever is more stringent. Land disposal systems also receive permits with limits established to protect groundwater. WPDES permits contain all the monitoring requirements, special reports, and compliance schedules appropriate to the facility in question. Permits are issued for five-year periods as either individual or general permits. Individual WPDES permits are issued to municipal and industrial facilities discharging to surface water and/or groundwater. Approximately 350 industrial facilities and approximately 650 municipalities hold individual WPDES permits.

Wisconsin’s Nutrient Reduction Strategy 44
General WPDES permits are issued for specific categories of industrial, municipal and other wastewater discharges. DNR may issue WPDES general permits applicable to categories or classes of point source discharges. When a general permit is issued, many facilities meeting its requirements may be covered under the same general permit. Several WPDES general permit categories have the potential to influence nutrient loads, including: land application of by-product solids, industrial sludge, and industrial waste; pit/trench dewatering; Sanitary Sewer Overflows (SSO) from Sewage Collection Systems, and more (see http://dnr.wi.gov/topic/wastewater/Permits.html). WPDES permit information is available at: http://dnr.wi.gov/topic/wastewater/PermitLists.html. Locations of permit discharges may be found on the DNR surface water data viewer at: http://dnr.wi.gov/topic/surfacewater/swdv/ 3.2.1 Permits for Municipal and industrial wastewater treatment facilities Phosphorus Wisconsin, through the provisions of Chapter NR 217, Wis. Adm. Code (hereafter in this chapter referred to as ch. NR 217) has technology-based phosphorus limits that have been in effect since the early 1980s for the Great Lakes basin and statewide since 1993. Wisconsin enacted additional administrative rules for phosphorus water quality standards criteria and resulting water quality based effluent limits in 2010. Subchapter 2 of NR 217, Wis. Adm. Code, regulates technology based limits enacted in 1992. Wisconsin’s publically owned treatment works and privately owned domestic sewage works that discharge more than 150 pounds of total phosphorus per month have been limited to a 1 mg/L effluent concentration or an alternative limit as a monthly average for more than two decades. An effluent limitation equal to 1 mg/L total phosphorus or an alternative limit as a monthly average also applies in certain cases. These cases are where the discharge of wastewater from all outfalls of a facility other than those subject to ch. NR 210, Wis. Adm. Code (generally non-municipal), contains a cumulative total of more than 60 pounds of total phosphorus per month. The 1 mg/L discharge limit is a Technology Based Effluent Limit (TBEL). The intent of technology-based effluent limits is to require a minimum level of treatment of pollutants for point source discharges based on available treatment technologies, while allowing the discharger to use any available control technique to meet the limits. Since 1993 there has been about a 67% reduction in phosphorus discharged from wastewater facilities in the Mississippi River basin as a result of complying with the technology based requirements and a 54% reduction in the Great Lakes Basin. Some WPDES permits now include a water quality based effluent limit (WQBEL), based on the quality of the receiving water, rather than available treatment technologies. These provisions became effective in 2010 and have been approved by EPA as part of the delegation agreement. In order to ensure the protection of water quality and the designated uses of the receiving water, WQBELs may be more stringent than technology-based effluent limits. As specified in ch. NR 217, Wis. Adm. Code, a WQBEL may be used in WPDES permits if the following conditions are met:
● When the discharge from a point source contains phosphorus at concentrations or loadings that will cause, has the reasonable potential to cause, or contribute to an exceedance of the

Wisconsin’s Nutrient Reduction Strategy 45
criteria in s. NR 102.06, Wis. Adm. Code, in either the receiving water or downstream waters; and
● The technology based effluent limitation is less stringent than necessary to achieve the applicable water quality standard for phosphorus in s. NR 102.06, Wis. Adm. Code.
Since the WQBELs enacted in the 2010 revisions to ch. NR 217, Wis. Adm. Code, are potentially much more stringent than TBEL that have been in effect since 1993, there is some flexibility in how the WQBEL is achieved. WPDES permittees may be eligible for two approaches that blend point source and nonpoint source phosphorus control for overall water quality benefits. These approaches (water quality trading and the watershed adaptive management option, discussed in greater detail in chapter 5 of this strategy) allow WPDES permittees to meet their obligations by working with other WPDES permittees or nonpoint sources to reduce phosphorus in waterways. Nitrogen Historically, since phosphorus is the key nutrient of concern causing eutrophication in freshwater systems in the Midwest, the requirements for monitoring and controlling nitrogen in surface water discharges has been limited mainly to ammonia due to its toxicity to fish and aquatic life. Monitoring and discharge limits for ammonia have been included in WPDES permits since the 1980s. Generally total nitrogen discharge limits have not been included in WPDES permits. Since 2008, DNR has required a single analysis of nitrate/nitrite and total Kjeldahl nitrogen for all facilities with their permit applications. Recently, Wisconsin implemented additional monitoring and reporting actions for WPDES permittees in the Mississippi River Basin consistent with the Gulf Hypoxia Task Force Action Plan. The following actions are currently taking place or being phased in as permits are renewed:
● Include total nitrogen (ammonia nitrogen, organic nitrogen, and nitrate/nitrite) quarterly monitoring for major municipalities (greater than 1 MGD) discharging to the Mississippi River Basin.
● Require quarterly total nitrogen permit monitoring for facilities whose permit application shows levels of total nitrogen greater than 40 mg/L.
● Include total nitrogen monitoring in reissued permits for larger cheese plants. ● Monitor meat processors for total nitrogen. ● Continue to require a single analysis of total nitrogen for all facilities with the permit
application. ● Since data from paper mills indicate low levels of total nitrogen discharged, no additional
permit related monitoring of these discharges is warranted. ● Evaluate future data to determine whether a seasonal variability exists. ● Ensure that the DNR wastewater database tracks which facilities have biological phosphorus
removal to enable a future evaluation on the relationship between biological phosphorus and total nitrogen removal.
Wisconsin regulates total nitrogen in groundwater discharges consistent with the 1984 enactment of Wisconsin's groundwater law, Chapter 160, Wisconsin Statutes. For wastewater facilities that discharge treated effluent to groundwater, it is assumed that all forms of nitrogen discharged eventually convert naturally to nitrate, for which there is a health-based drinking water standard of

Wisconsin’s Nutrient Reduction Strategy 46
10 mg/L. DNR limits total nitrogen to 10 mg/L and requires data collection for facilities that discharge to groundwater. 3.2.2 CAFO permits Phosphorus contributions and to some degree nitrogen contributions from Concentrated Animal Feeding Operations (CAFOs) are controlled by WPDES permits. A Wisconsin livestock operation with 1,000 animal units or more is a Large CAFO. Large CAFOs must have a WPDES permit to operate. These water quality protection permits ensure farms use proper planning, nutrient management, structures, and systems to protect Wisconsin waters. Wisconsin's CAFO permit requirements are in Chapter NR 243, Wis. Adm. Code. DNR may designate a smaller-scale animal feeding operation (fewer than 1,000 animal units) as a CAFO if it has pollutant discharges to navigable waters or contaminates a well. Under ch. NR 243, Wis. Adm. Code, WPDES permitted CAFOs have the following requirements (not exhaustive):
● Operators must complete the Animal Units Calculation Worksheet so they can determine if they are a CAFO and need to apply for the WPDES permit.
● Operators must complete the WPDES preliminary and final permit applications. If an operation plans to become a CAFO it must submit a preliminary permit application 12 months prior to reaching CAFO size and a final detailed application six months prior to reaching CAFO size.
● WPDES permitted CAFOs must construct manure and process wastewater storage and handling systems in accordance with accepted design standards. There is a zero discharge standard for feedlot and feed storage runoff.
● CAFOs must properly dispose of animal carcasses and develop an emergency response plan for addressing catastrophic spills.
● Farms must develop and implement a nutrient management plan for when, where and how much manure and process wastewater they will apply on cropped fields.
● Manure spread on land must be set back from drinking water wells, sinkholes and fractured bedrock. Additional restrictions apply to manure and process wastewater spread on shallow soils over fractured bedrock.
● Operators may not spread liquid manure on frozen or snow–covered ground unless it’s injected or immediately incorporated into soil or there is an emergency outside the operation’s control.
● Operators may not spread solid manure on frozen or snow-covered ground during February and March unless immediately incorporated. Farmers can stack solid manure in fields or store it in a designed structure during February and March.
● Six months of liquid manure storage is required with some exceptions. ● There are also inspection, monitoring and reporting requirements, which are included in
the Wisconsin CAFO Compliance Calendar. In addition to the WPDES permit requirements of ch. NR 243, Wis. Adm. Code, CAFOs must also meet Wisconsin’s agricultural performance standards and prohibitions, as detailed in ch. NR 151, Wis. Adm. Code. These standards and prohibitions must be met by all agricultural operations, not

Wisconsin’s Nutrient Reduction Strategy 47
just permitted operations. More discussion of these performance standards and prohibitions can be found in Chapter 4 of this strategy. 3.2.3 Municipal Storm Water Discharge Permits Approximately 220 municipalities in Wisconsin are currently required to have a Municipal Separate Storm Sewer System (MS4) permit. A MS4 permit is required for a municipality that meets one of the following criteria:
● It is located within a federally-designated Urbanized Area, ● Its population equals 10,000 or more based on the latest decennial census; or ● DNR designates the municipality for permit coverage in accordance with s. NR 216.025, Wis.
Adm. Code. The MS4 permits are effective for a period of up to five years, at which point the permits are updated and re-issued.
The MS4 permits require municipalities to reduce polluted storm water runoff by implementing storm water management programs with best management practices. The MS4 permits do not contain numerical effluent limits like other WPDES permits. Municipal storm water management programs cover a wide array of activities that occur within a municipality. The permits contain the following required elements:
● Public Education and Outreach: The MS4 permit specifies that public education and outreach programs be developed to encourage the public and businesses to modify their behaviors and procedures to reduce storm water pollution.
● Public Involvement and Participation: In addition to public education and outreach, the MS4 permit requires municipalities to encourage participation from individuals to prevent storm water pollution. Some examples of public involvement are volunteer stream monitoring, storm drain stenciling, presenting information to established community groups, or planting a community rain garden.
● Illicit Discharge Detection and Elimination: Storm sewers that carry rain water runoff are not intended for other fluids and waste material. These pollutants are illicit discharges and may have the potential to harm people, animals and aquatic life in the downstream rivers, lakes and wetlands. Municipalities are required to develop programs to identify, prevent, and eliminate illicit discharges to their storm sewer systems. The DNR has developed additional illicit discharge detection and elimination guidance to assist municipalities with this requirement.
● Construction Site Pollutant Control: Municipalities are required to develop a soil erosion control ordinance and enforce it on construction sites. Municipalities may use state-recommended technical standards for methods and products used to control erosion and prevent sediment-laden water from discharging into a lake, stream or wetland.
● Post-Construction Storm water Management: Municipalities are required to develop a post-construction ordinance and enforce it to ensure that areas of new and redevelopment will include structural measures to control pollutants, control peak flow, maintain infiltration, and establish vegetated protective areas adjacent to waterways and wetlands. Municipalities may use state-recommended technical standards for post-construction storm water management practices.

Wisconsin’s Nutrient Reduction Strategy 48
● Pollution Prevention Practices for the Municipality: MS4 storm water programs are to include practices to prevent pollutants from municipally-owned transportation infrastructure, maintenance areas, storage yards, sand and salt storage areas, and waste transfer stations entering the storm sewer system.
● Developed Urbanized Area Standard: Municipalities are required to control the Total Suspended Solids (TSS) carried in storm water from existing urban areas as compared to no controls. Many municipalities have already achieved the state standard of 20% TSS. Compliance with the standard is achieved by implementing a system of practices and activities, which has been verified by a storm water computer model.
● Storm Sewer System Maps: Municipalities covered by a MS4 permit area are required to maintain a map of the storm sewer system. These maps identify storm sewer conveyances such as pipes and ditches, and also identify roads, streams and lakes.
● Impaired Waters: Many streams and lakes in Wisconsin are polluted or impaired to a point that animal and plant communities in the receiving waters are significantly impacted. If the storm sewer system discharges a pollutant of concern to an impaired water, a municipality covered by a MS4 permit is required to develop a plan to reduce those pollutants.
3.3 Future Directions
Wisconsin partners will continue to work with regulated entities to manage nutrients through traditional permits and innovative approaches such as pollutant trading and the Watershed Adaptive Management Option discussed in Chapter 5 of this strategy.
Wisconsin’s Nutrient Reduction Strategy 49
Chapter 4. Agricultural Nonpoint Nutrients Element 4. Agricultural Areas 4.1 EPA and Gulf Hypoxia Task Force Expectations
Quoted from EPA’s recommended elements: “In partnership with Federal and State Agricultural partners, NGOs, private sector partners, landowners, and other stakeholders, develop watershed-scale plans that target the most effective practices where they are needed most. Look for opportunities to include innovative approaches, such as targeted stewardship incentives, certainty agreements, and N & P markets, to accelerate adoption of agricultural conservation practices. Also, incorporate lessons learned from other successful agricultural initiatives in other parts of the country.” 4.2 Wisconsin’s Approach
For more than 30 years, an array of governmental and nongovernmental partners in Wisconsin have cooperated to implement a suite of federal, state, and local agricultural nonpoint source programs to control nutrients, sediments, and other pollutants. Collectively, these programs operate statewide using a blend of education, technical assistance, financial assistance, and compliance. Coordination occurs through a number of committees, forums, and both formal and informal working arrangements. Wisconsin’s long history in this area includes many innovations, including the former Priority Watershed Program, rules specifying agricultural performance standards and prohibitions, and new approaches currently underway (described in Chapter 5 of this strategy) for reducing phosphorus through pollutant trading and the watershed adaptive management option. An expanded discussion of Wisconsin’s approach including partners, statutory and administrative authority, planning framework, and implementation programs can be found in Wisconsin’s Nonpoint Source Program Management Plan (http://dnr.wi.gov/topic/nonpoint/aboutnpsprogram.html). This chapter outlines some of Wisconsin’s approach for agricultural areas by describing the agricultural performance standards and prohibitions and highlighting several agency programs and coordination forums. 4.2.1 Agricultural Performance Standards and Prohibitions Wisconsin’s agricultural performance standards and prohibitions identify requirements to control runoff from agricultural fields, pastures, and livestock facilities. All farmers in Wisconsin must comply with the requirements if cost-sharing is made available. As noted in Chapter 3, CAFOs must also follow additional requirements outlined in WPDES permits. Farmers must demonstrate compliance to participate in some state and local programs (such as the Wisconsin’s Farmland Preservation Tax Credit) or to obtain local and state permits (e.g., for livestock siting and manure storage facilities). A variety of educational, technical assistance, and financial assistance programs are available to help farmers comply with the standards and prohibitions. Several are described in more detail later in this chapter. A partial list includes:
• Targeted Runoff Management Grants – DNR

Wisconsin’s Nutrient Reduction Strategy 50
• Urban Runoff Management Grants – DNR • Notice of Discharge Grants – DNR • Managed Forest Program – DNR • Clean Water Fund loans and grants – DNR • Soil and Water Management Grants – DATCP • Clean Sweep • Farmer Nutrient Management Plan training – UWEX • Environmental Quality Incentives Program (EQIP) – NRCS • Conservation Stewardship Program (CSP) – NRCS • County grants and technical assistance
Table 4.1 Selected Federal and State Funding Programs
Program Agency 2013 Funding ($ million)
Environmental Quality Incentives Program NRCS – USDA 29.0 Conservation Stewardship Program (2012) NRCS -- USDA 3.1 Funding to Counties -- staffing DATCP 8.6 Funding to Counties – cost sharing DATCP 5.8 Targeted Runoff Management DNR 4.8
Total for listed programs 51.83 Additional resources, including federal programs, are identified in the Wisconsin’s Nonpoint Source Program Management Plan (http://dnr.wi.gov/topic/nonpoint/aboutnpsprogram.html). A brief description of the agricultural performance standards and manure management prohibitions from ch. NR 151, Wis. Adm. Code, is included here. The tillage setback and PI performance measure noted below became effective in 2011. The full rule can be found at: http://legis.wisconsin.gov/rsb/code/nr/nr151.pdf. Wisconsin’s Agricultural Performance Standards and Prohibitions:
• Tillage setback: A setback of 5 feet from the top of a channel of a waterbody for the purpose of maintaining stream bank integrity and avoiding soil deposits into state waters. Tillage setbacks greater than 5 feet but no more than 20 feet may be required if necessary to meet the standard. Harvesting of self-sustaining vegetation within the tillage setback is allowed.
• Phosphorus Index (PI): A limit on the amount of phosphorus that may run off croplands as measured by a phosphorus index with a maximum of 6, averaged over an eight-year accounting period, and a PI cap of 12 for any individual year.
• Process wastewater handling: a prohibition against significant discharge of process wastewater from milk houses, feedlots, and other similar sources.
• Meeting TMDLs: A standard that requires crop and livestock producers to reduce discharges if necessary to meet a load allocation specified in an approved Total Maximum Daily Load (TMDL). Producers must implement targeted performance standards specified for the TMDL area using best management practices specified in ch. ATCP 50, Wis. Adm. Code. If a more stringent or additional performance standard is necessary, it must be promulgated by rule before compliance is required.

Wisconsin’s Nutrient Reduction Strategy 51
• Sheet, rill and wind erosion: All cropped fields shall meet the tolerable (T) soil erosion rate established for that soil. This provision also applies to pasture lands.
• Manure storage facilities: All new, substantially altered, or abandoned manure storage facilities shall be constructed, maintained or abandoned in accordance with accepted standards, which includes a new margin of safety. Failing and leaking existing facilities which pose an imminent threat to public health or fish and aquatic life or violate groundwater standards shall be upgraded or replaced.
• Clean water diversions: Runoff from agricultural buildings and fields shall be diverted away from contacting feedlots, manure storage areas and barnyards located within water quality management areas (300 feet from a stream or 1,000 feet from a lake or areas susceptible to groundwater contamination).
• Nutrient management: Agricultural operations applying nutrients to agricultural fields shall do so according to a nutrient management plan. This standard does not apply to applications of industrial waste, municipal sludge or septage regulated under other DNR programs provided the material is not commingled with manure prior to application.
• Manure management prohibitions include: no overflow of manure storage facilities, no unconfined manure piles in a water quality management area, no direct runoff from feedlots or stored manure into state waters, no unlimited livestock access to waters of the state in locations where high concentrations of animals prevent the maintenance of adequate or self-sustaining sod cover.
4.2.2 Best Management Practices for Nonpoint Source Pollution Control Wisconsin has identified best management practices (BMPs) that may be used to address agricultural, urban, and other categories or sources of NPS pollution and to meet the statewide performance standards and prohibitions. BMPs are enumerated in chs. NR 154 and ATCP 50, Wis. Adm. Code. See Table 4.2. Other practices may be approved when determined necessary to meet water quality objectives. Table 4.2 Best Management Practices Outlined in ch. NR 154 and ch. ATCP 50, Wis. Adm. Code.
Legal Authority BMP Primary Pollutant(s) Addressed
NR 154.04 ATCP 50.62 Manure storage systems Nutrients NR 154.04 ATCP 50.63 Manure storage systems closure Nutrients NR 154.04 ATCP 50.64 Barnyard runoff control systems Nutrients NR 154.04 ATCP 50.65 Access roads and cattle crossings Sediment, Nutrients NR 154.04 ATCP 50.66 Animal trails and walkways Sediment, Nutrients NR 154.04 ATCP 50.67 Contour farming Sediment, Nutrients NR 154.04 ATCP 50.68 Cover and green manure crop Sediment, Nutrients NR 154.04 ATCP 50.69 Critical area stabilization Sediment, Nutrients NR 154.04 ATCP 50.70 Diversions Sediment, Nutrients NR 154.04 ATCP 50.71 Field windbreaks Sediment, Nutrients NR 154.04 ATCP 50.72 Filter strips Sediment, Nutrients NR 154.04 ATCP 50.73 Grade stabilization Sediment, Nutrients NR 154.04 ATCP 50.74 Heavy use area protection Sediment, Nutrients NR 154.04 N/A Lake sediment treatment Sediment, Nutrients NR 154.04 ATCP 50.75 Livestock fencing Sediment, Nutrients NR 154.04 ATCP 50.76 Livestock watering systems Sediment, Nutrients NR 154.04 ATCP 50.77 Milking center waste control systems Nutrients NR 154.04 ATCP 50.78 Nutrient management Sediment, Nutrients NR 154.04 ATCP 50.79 Pesticide management Pesticides

Wisconsin’s Nutrient Reduction Strategy 52
Legal Authority BMP Primary Pollutant(s) Addressed
NR 154.04 ATCP 50.80 Prescribed grazing Sediment, Nutrients NR 154.04 ATCP 50.81 Relocating or abandoning animal feeding
operations Sediment, Nutrients
NR 154.04 ATCP 50.82 Reside management Sediment, Nutrients NR 154.04 ATCP 50.83 Riparian buffers Sediment, Nutrients NR 154.04 ATCP 50.84 Roofs for animal lot and manure storage structures Nutrients NR 154.04 ATCP 50.85 Roof runoff systems Nutrients NR 154.04 ATCP 50.86 Sediment basins Sediment, Nutrients NR 154.04 N/A Shoreline habitat restoration for developed areas Sediment, Nutrients NR 154.04 ATCP 50.87 Sinkhole treatment Nutrients NR 154.04 ATCP 50.88 Streambank and shoreline protection Sediment, Nutrients NR 154.04 ATCP 50.89 Strip-cropping Sediment, Nutrients NR 154.04 ATCP 50.90 Subsurface drains Sediment, Nutrients NR 154.04 ATCP 50.91 Terrace systems Sediment, Nutrients NR 154.04 ATCP 50.92 Underground outlets Sediment, Nutrients NR 154.04 ATCP 50.93 Waste transfer systems Nutrients NR 154.04 ATCP 50.94 Wastewater treatment strips Nutrients NR 154.04 ATCP 50.95 Water and sediment control basins Sediment, Nutrients NR 154.04 ATCP 50.96 Waterway systems Sediment, Nutrients NR 154.04 ATCP 50.97 Well decommissioning Nutrients NR 154.04 ATCP 50.98 Wetland development Sediment, Nutrients NR 154.04 N/A Urban best management practices Sediment, Nutrients
Refer here for complete details about chapters NR154 and ATCP50: (http://legis.wisconsin.gov/rsb/code/nr/nr154.pdf http://legis.wisconsin.gov/rsb/code/atcp/atcp050.pdf) 4.2.3 Programs intended to control agricultural nitrogen and phosphorus As noted, Wisconsin’s approach to reducing agricultural nonpoint source pollution includes many programs conducted by federal, state, and local governments, generally in cooperation with nongovernmental organizations. Many of the programs include connections to Wisconsin’s agricultural performance standards and prohibitions. Several key programs are described below. Additional programs and details are described in Chapter 4 of Wisconsin’s Nonpoint Source Program Management Plan (http://dnr.wi.gov/topic/nonpoint/aboutnpsprogram.html). EPA Section 319 Grants (and TMDL implementation) Federal funds provided to Wisconsin through EPA’s Section 319 program address agricultural watersheds through direct projects and through multiple programs. These include:
• DNR Targeted Runoff Management (TRM) grants. This program supports implementation of nutrient reduction practices in large and small watersheds of both TMDL and non-TMDL classification.
• DNR Lake Management grants. Qualified units of government are eligible for funding to collect and analyze information needed to protect and restore lakes and their watersheds, including nutrient reduction actions.
• Funds also support DNR and DATCP technical and administrative capacity to implement nonpoint source programs.

Wisconsin’s Nutrient Reduction Strategy 53
USDA-NRCS Environmental Quality Incentives Program (EQIP) EQIP has been the core of NRCS’s agricultural conservation practice incentives program since 1997. EQIP is predominantly a source of non-targeted funding that pays cost-sharing for numerous structural and non-structural nutrient and sediment reduction practices on cropland, farmsteads and stream-side sites. Common practices funded for Wisconsin producers include grassed waterways, cover crops, nutrient management planning, contour farming and strip-cropping, stream bank management practices and manure storage structures. There are several dozen total practices. The EQIP program is a combination of technical and financial assistance in one program and is implemented by NRCS with support from county land conservation departments. For more information, see: http://www.wi.nrcs.usda.gov/programs/eqip.html). NRCS Conservation Stewardship Program (CSP) CSP was created by the 2002 Farm Bill as an alternative strategy to incentivize installation of conservation practices. For EQIP a resource concern (problem) must exist to be eligible for financial assistance. Under CSP a producer fills out a Conservation Management Tool to describe the nature of their farming operation. The tool rates the relative level of conservation protection existing on the farm and establishes an annual base level payment. Farmers accepted into the program are required to maintain their existing level of conservation protection over the 5-year contract period and must implement additional conservation activities as agreed. The annual payment is based on the initial level of conservation performance and the level of protection offered by the additional conservation activities. For more information see: http://www.nrcs.usda.gov/Internet/FSE_DOCUMENTS/stelprdb1046181.pdf) NRCS – Great Lakes Restoration Initiative (GLRI) projects Wisconsin NRCS participates in the GLRI, a multi-federal-agency effort to restore priority watersheds in the Great Lakes basin (Figure 4.1). Technical assistance is currently available to producers located in the Lower Fox, Manitowoc-Sheboygan, and Milwaukee watersheds to assist with conservation planning needs. Financial assistance through EQIP/GLRI is anticipated to be available in 2013 for implementation of select conservation practices. (for more information: http://www.wi.nrcs.usda.gov/programs/eqip/GLRI/glri.html) NRCS – Mississippi River Basin Healthy Watersheds Initiative (MRBI) projects To improve the health of the Mississippi River Basin, NRCS has established the Mississippi River Basin Healthy Watersheds Initiative (MRBI). Through this Initiative, NRCS and its partners help producers in selected watersheds in the Mississippi River Basin voluntarily implement conservation practices that avoid, control, and trap nutrient runoff; improve wildlife habitat; and maintain agricultural productivity. Wisconsin NRCS currently has a MRBI-EQIP project in place in the Six-mile Creek watershed in Dane County (see http://www.wi.nrcs.usda.gov/programs/mrbi.html). This targeted technical and financial assistance program supports the Watershed Adaptive Management option process being led by numerous partners, including producers, Dane County Department of Land and Water Resources and Madison Metropolitan Sewerage District and its customers.

Wisconsin’s Nutrient Reduction Strategy 54
Figure 4.1 Map of NRCS-GLRI Project for the Lower Fox River Watershed
NRCS National Water Quality Initiative This relatively new initiative by NRCS provided funding for nutrient and sediment reduction practices in watersheds selected with input from several state and local partners. These HUC 12 watersheds were selected in part because they contained water bodies included on Wisconsin’s Impaired Waters list. NRCS field offices work in partnership with county land conservation departments to provide technical assistance to landowners. Funding is provided through EQIP. Funding for FY 2012 was allocated in these locations (HUC 12 Watersheds):
• Lower Waumandee Creek – Buffalo County • Ward Creek-Little Sugar River - Dane and Green Counties (additional funding provided by
DNR through Gulf Hypoxia Project funding) • Big Green Lake - Green Lake County
FY 2013 funding will continue in the Big Green Lake project and two additional watersheds. http://www.wi.nrcs.usda.gov/programs/eqip/nwqi.html
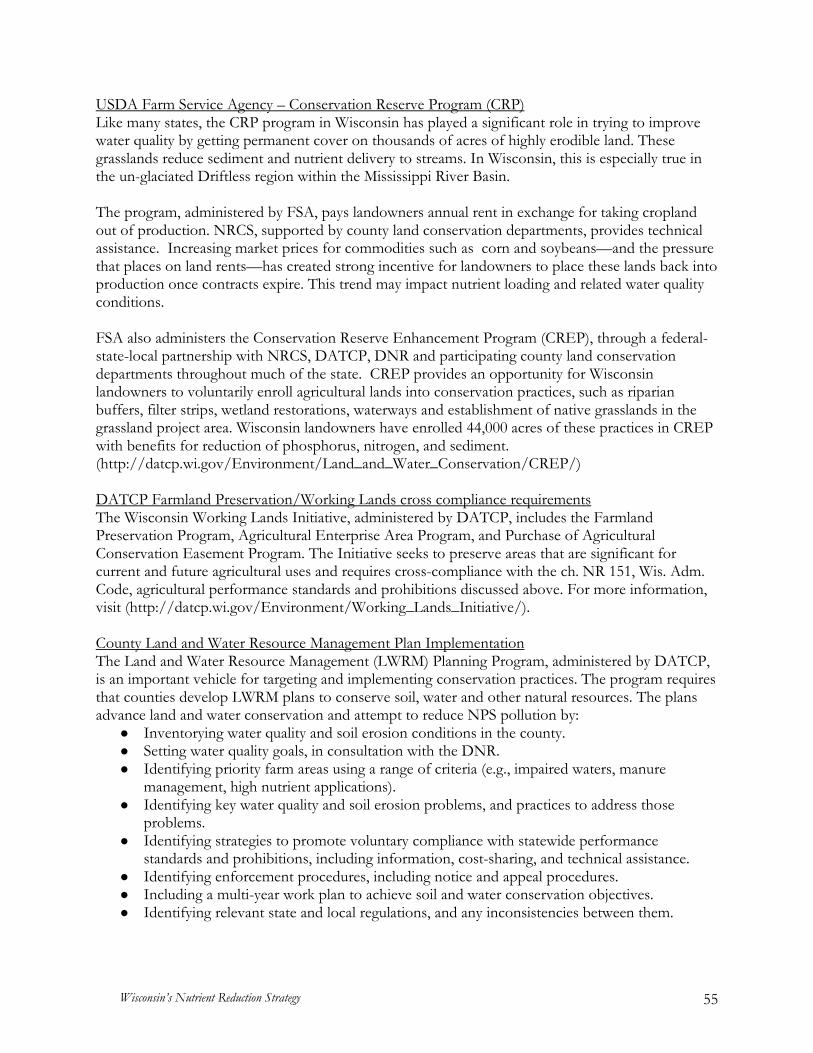
Wisconsin’s Nutrient Reduction Strategy 55
USDA Farm Service Agency – Conservation Reserve Program (CRP) Like many states, the CRP program in Wisconsin has played a significant role in trying to improve water quality by getting permanent cover on thousands of acres of highly erodible land. These grasslands reduce sediment and nutrient delivery to streams. In Wisconsin, this is especially true in the un-glaciated Driftless region within the Mississippi River Basin. The program, administered by FSA, pays landowners annual rent in exchange for taking cropland out of production. NRCS, supported by county land conservation departments, provides technical assistance. Increasing market prices for commodities such as corn and soybeans—and the pressure that places on land rents—has created strong incentive for landowners to place these lands back into production once contracts expire. This trend may impact nutrient loading and related water quality conditions. FSA also administers the Conservation Reserve Enhancement Program (CREP), through a federal-state-local partnership with NRCS, DATCP, DNR and participating county land conservation departments throughout much of the state. CREP provides an opportunity for Wisconsin landowners to voluntarily enroll agricultural lands into conservation practices, such as riparian buffers, filter strips, wetland restorations, waterways and establishment of native grasslands in the grassland project area. Wisconsin landowners have enrolled 44,000 acres of these practices in CREP with benefits for reduction of phosphorus, nitrogen, and sediment. (http://datcp.wi.gov/Environment/Land_and_Water_Conservation/CREP/) DATCP Farmland Preservation/Working Lands cross compliance requirements The Wisconsin Working Lands Initiative, administered by DATCP, includes the Farmland Preservation Program, Agricultural Enterprise Area Program, and Purchase of Agricultural Conservation Easement Program. The Initiative seeks to preserve areas that are significant for current and future agricultural uses and requires cross-compliance with the ch. NR 151, Wis. Adm. Code, agricultural performance standards and prohibitions discussed above. For more information, visit (http://datcp.wi.gov/Environment/Working_Lands_Initiative/). County Land and Water Resource Management Plan Implementation The Land and Water Resource Management (LWRM) Planning Program, administered by DATCP, is an important vehicle for targeting and implementing conservation practices. The program requires that counties develop LWRM plans to conserve soil, water and other natural resources. The plans advance land and water conservation and attempt to reduce NPS pollution by:
● Inventorying water quality and soil erosion conditions in the county. ● Setting water quality goals, in consultation with the DNR. ● Identifying priority farm areas using a range of criteria (e.g., impaired waters, manure
management, high nutrient applications). ● Identifying key water quality and soil erosion problems, and practices to address those
problems. ● Identifying strategies to promote voluntary compliance with statewide performance
standards and prohibitions, including information, cost-sharing, and technical assistance. ● Identifying enforcement procedures, including notice and appeal procedures. ● Including a multi-year work plan to achieve soil and water conservation objectives. ● Identifying relevant state and local regulations, and any inconsistencies between them.

Wisconsin’s Nutrient Reduction Strategy 56
County Land Conservation Department (LCD) staff are key stakeholders in the development and implementation of comprehensive watershed management plans that address water quality impairments. The knowledge, skills, and connections to local landowners and producers that local LCDs provide are a key component in the development of any comprehensive watershed plan, as well as implementation of practices and programs designed to improve water quality. DNR Targeted Runoff Management (TRM) Grant and Notice of Discharge (NOD) grant-funded projects TRM grants may be used to cost share the installation of best management practices and support a variety of local administrative and planning functions. Projects are selected through a competitive scoring system and generally take two to three years to complete. The TRM grant program has evolved into a three-tiered structure to provide flexibility in addressing a range of scales, from single sites to small sub-watersheds. (For more information, see Chapter 4.7a of Wisconsin’s Nonpoint Source Program Management Plan at http://dnr.wi.gov/topic/nonpoint/documents/npsprogrammgmtplan6282011.pdf). DNR Safe Drinking Water Protection Pilot Projects DNR Bureau of Drinking Water and Groundwater is conducting pilot projects to target sub-watersheds with high levels of nitrate identified in public drinking water systems (greater than 5 mg/L) and potential agricultural contributions. The pilot projects seek to assess and control potential agricultural contributions through a mix of incentives. Information and Education Information and education programs and activities are conducted through the network of agencies and organizations involved in nutrient reduction. Efforts include statewide programs organized by state and federal agencies and nongovernmental partners (see coordination forums below), as well as local field days, farm visits, skills training, informational workshops, and development and delivery of educational materials. For more information, see section 4.6 of Wisconsin’s Nonpoint Source Program Management Plan. Wisconsin’s Farmer-led Initiative Wisconsin is exploring new approaches to engage farmers in solving water quality restoration and protection challenges related to agricultural nonpoint sources. Based on successful models in Iowa and Minnesota, conservation partners in Wisconsin are providing coordination and technical support for farmer-led watershed councils in tributary watersheds to the St Croix River basin and the Red Cedar River basin. Each farmer-led watershed councils establishes performance measures to address production and water quality issues. UW Discovery Farms and UW Pioneer Farm UW Discovery Farms focus on economic and environmental effects of agricultural practices through on-farm research and outreach and training programs. In cooperation with working farms, UW Discovery Farms considers a comprehensive, whole-farm approach to understanding interactions between agricultural practices, farm profitability, farm management, and water quality. (http://uwdiscoveryfarms.org). UW Pioneer Farm, part of UW-Platteville’s School of Agriculture, conducts systems and applied research on management practices in a working farm setting and provides training and outreach for students, agencies, producers, and the public. (http://www.uwplatt.edu/pioneerfarm/)

Wisconsin’s Nutrient Reduction Strategy 57
University of Wisconsin System Beyond the UW Discovery Farms and UW Pioneer Farm programs described above, many research partnerships coordinated through the University of Wisconsin System also address agricultural nutrients and water quality. In many cases, research is coordinated with agencies, local governments, agricultural associations, and other stakeholders, and encompasses research on private working farms and university research facilities. Several examples include ongoing projects led by various faculty members at UW institutions including UW-Madison through the College of Agricultural and Life Sciences (CALS), College of Engineering, and the network of UW Agricultural Research Stations. Numerous UW Extension centers and teams also address issues of agricultural nutrients. UW also has two members serving on the Wisconsin Groundwater Coordinating Council. Additional information can be found through web searches on key terms.
4.2.4 Forums for coordination and engagement A number of forums exist for coordination and engagement among agencies, NGOs, and agricultural interests that address nutrient management and reduction. These include:
Runoff Risk Advisory Forecast
Wisconsin DATCP and numerous partners developed this useful online tool designed to help farmers evaluate the future risk of manure runoff due to snowmelt or rainfall. The tool consists of a map indicating day-to-day risk of manure runoff, based on National Weather Service (NWS) flood forecast model that incorporates precipitation potential, soil moisture and the physical characteristics of 242 NWS basins. The tool (http://144.92.93.196/app/runoffrisk) is accessible in a variety of mobile electronic formats.
SnapPlus Nutrient Management Software
SnapPlus (Soil Nutrient Application Planner) is software to prepare nutrient management plans according to the NRCS Nutrient Management Standard 590. Developed by the University of Wisconsin, SnapPlus generates the following outputs:
• Crop nutrient requirements (N-P-K) according to soil test results and nutrient credits • Soil loss assessment based on the Revised Universal Soil Loss Equation (RUSLE-2) • A phosphorus index for all fields across a crop rotation • A rotational phosphorus balance for using soil test P as the criteria for phosphorus
management SnapPlus is used heavily by private crop consultants, farmers and other nutrient management planners and is regularly updated to incorporate new tools and information. For more information visit snapplus.wisc.edu.
Wisconsin’s Nutrient Reduction Strategy 58
● NRCS State Technical Committee – provides advice to NRCS on a variety of program and policy issues relevant for Wisconsin conservation. (http://www.wi.nrcs.usda.gov/about/stc.html)
● Wisconsin Land and Water Conservation Board – reviews and makes recommendations on county land and water conservation plans, makes recommendations for funding allocations, and provides a forum for land and water conservation issues. (http://datcp.wi.gov/Environment/Land_and_Water_Conservation/Land_and_Water_Conservation_Board/index.aspx)
● Biosolids Symposium -annually addressing applications on agricultural lands ● Governmental Affairs Seminar for point sources ● Standards Oversight Council (SOC) – a multi-agency council that oversees the development
and maintenance of conservation technical standards for Wisconsin (http://socwisconsin.org)
● Wisconsin Crop Management Conference (WCMC) – a 3-day annual event drawing 1,500 attendees focused on the agronomic inputs industry. (http://www.soils.wisc.edu/extension/wcmc/)
● UW-Extension Soil, Water, and Nutrient Management Meetings (SWNM) – annual meetings held across the state drawing 600 attendees annually
● Many watershed-level forums and initiatives – for example, annual conference and coordination events focused on specific river basins and watersheds.
● Many ad hoc statewide workgroups such as a recent effort to improve the effectiveness of agricultural nutrient management convened by WLWCA, DATCP, and others.
4.3 Future Directions Wisconsin is moving forward on many initiatives related to understanding and managing nutrients from agricultural areas and their impacts on surface water and groundwater. Those issues continue to be a focus for the broad set of partners discussed in this chapter. Among them are questions of reducing nitrogen losses or increasing nitrogen use efficiency, particularly in coarse soil; understanding and increasing actual implementation of nutrient management plans; understanding the dynamics of surface to subsurface flows of nitrogen and phosphorus in tile drainage; expanding development and use of 9-element watershed plans; and gaining experience with the innovative integrated approaches described in the next chapter. Two current additional activities relevant to nutrient reduction are the NRCS 590 Nutrient Management Standard revisions and a proposed Nitrogen Science Summit, both discussed below. NRCS 590 Nutrient Management Standard Revision Many questions are being addressed through an ongoing process to revise the NRCS 590 Nutrient Management Standard. This process, led by NRCS and coordinated through the Wisconsin Standards Oversight Council (SOC), involves a review team to provide interdisciplinary input to revise the standard. The effort includes input from farmers, researchers, water quality and agricultural agency staff and agricultural service providers. The 590 review process will address

Wisconsin’s Nutrient Reduction Strategy 59
nitrogen use efficiency and losses, along with several other significant technical issues with regard to nutrient management planning, including16:
● Creation of a Nitrogen Loss Risk Assessment Tool ● Developing a winter nutrient spreading risk assessment tool ● Soil test phosphorus criteria ● Soil test recommendation revisions from UW-Extension ● Add analysis for manure ammonium nitrogen content (consistent with the NRCS national
590 practice standard) ● Evaluate the potential for transport of nutrients to tile drainage ● Adaptive nutrient management - develop a process to establish a representative yield check
strip when nutrients are applied above the rates established by the standard unanticipated crop production conditions
● Developing a manure land base estimate (for animal feeding operations) - to address requirements for addressing the remaining volume of manure or other nutrient source if an adequate land base is NOT available
Exploring these technical issues through the revision to NRCS 590 will address a number of nutrient management issues, particularly relating to nitrogen losses to both surface water and groundwater. The NRCS 590 revision work is expected to continue through 2014. Nitrogen Science Summit Wisconsin is considering initiating a separate long-term process for examining nitrogen management beginning with a Nitrogen Science Summit to identify what is known and what is unknown focusing both on surface water and groundwater needs. While a major commitment has been made by agencies and universities in Wisconsin over more than two decades to develop tools and indices to manage phosphorus on agricultural lands, comparable tools and indices are likely needed to better manage nitrogen. The purpose of a Nitrogen Science Summit would be to create new tools to determine which practices are recommended on a given site and how effective they may be – especially considering the very complex nature of nitrogen use and mobility on agricultural lands. A Nitrogen Science Summit would draw from recent development from other states, including Iowa and Minnesota. The Nitrogen Science Summit could include literature reviews and discussion of the following items:
• Definition of Wisconsin’s surface water quality needs and groundwater quality needs related to nitrogen.
• Pathways of nitrogen to both surface waters and groundwater and the relative contribution of nitrogen in runoff verses nitrogen in groundwater reaching streams and lakes.
• Movement of nitrogen through the many diverse soils present in Wisconsin. • Determination of relative nitrogen contribution of cropped fields, pastures, animal lots and
other lands. • Geographic variation across Wisconsin and the potential use of agro-ecoregion designations
as a tool.
16 Standards Oversight Council 590 Nutrient Management Team Charge, November 15, 2012 (NRCS, custodian)
Wisconsin’s Nutrient Reduction Strategy 60
• Compilation of existing data and information from research projects, including Pioneer Farm and Discovery Farms, and N management/loss research currently performed by the Agricultural Research Service (ARS) and the UW Soils Department.
• Assessment of the practicality and effectiveness of N loss reduction materials such as slow release urea/urease inhibitors.
• Role of field-based targets and surrogates to guide management. • Economic costs and benefits – both on farm and off site – related to nitrogen management. • Role of pilot projects to test and mold implementation and education processes, as well as to
measure water quality changes resulting from project implementation. • Identify research needed to fill knowledge gaps. • Other items identified by a Summit scoping group.
The Nitrogen Science Summit would build upon Wisconsin’s long-standing practice of using partnerships and coordination forums to exchange thoughts, ideas and information. Participants would include university, state, and federal researchers; water quality experts; federal, state and local agency program managers; consulting agronomists; practicing farmers; agricultural economists; educational experts; and others identified by a Nitrogen Science Summit scoping committee.

Wisconsin’s Nutrient Reduction Strategy 61
Chapter 5. Integrating Point Source and Nonpoint Source Management Chapters 3 and 4 describe Wisconsin’s programs for controlling nutrients from point sources and nonpoint sources. However, a description of Wisconsin programs would be incomplete without a short description of activities that assess or manage nutrients in an integrated manner. This chapter describes four of these activities: Total Maximum Daily Load (TMDL) analyses; a model called PRESTO; the Watershed Adaptive Management Option; and water quality trading. All four activities address aspects of a number of elements for Wisconsin’s Nutrient Reduction Strategy.
5.1 Total Maximum Daily Loads (TMDLs)
All states, including Wisconsin, are required by EPA to develop TMDL analyses for impaired waters, (those not meeting water quality standards). TMDLs, as authorized under the federal Clean Water Act, determine the pollutant load (mass) reduction needed to attain and maintain water quality standards. TMDL analyses also allocate the maximum allowable load between each point source and nonpoint sources. As a result, in watersheds where both point sources and nonpoint sources are significant contributors of nutrients, the entire load reduction is not necessarily assigned to the point sources. As shown in Figure 5.1 Wisconsin has many approved TMDLs and is developing new TMDLs. TMDL implementation comes through the point source programs described in Chapter 3 and the suite of federal, state and local nonpoint source programs described in Chapter 4. In the near future, implementation may also come through Watershed Adaptive Management Option projects and water quality trading described below.
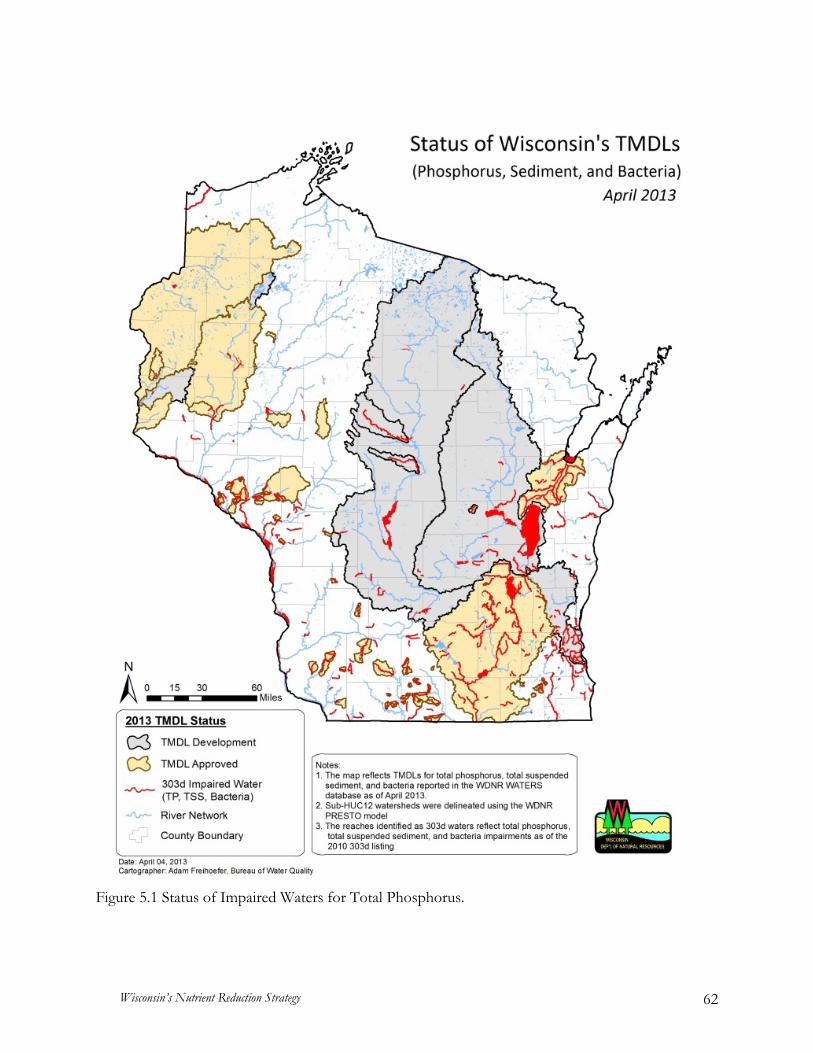
Wisconsin’s Nutrient Reduction Strategy 62
Figure 5.1 Status of Impaired Waters for Total Phosphorus.
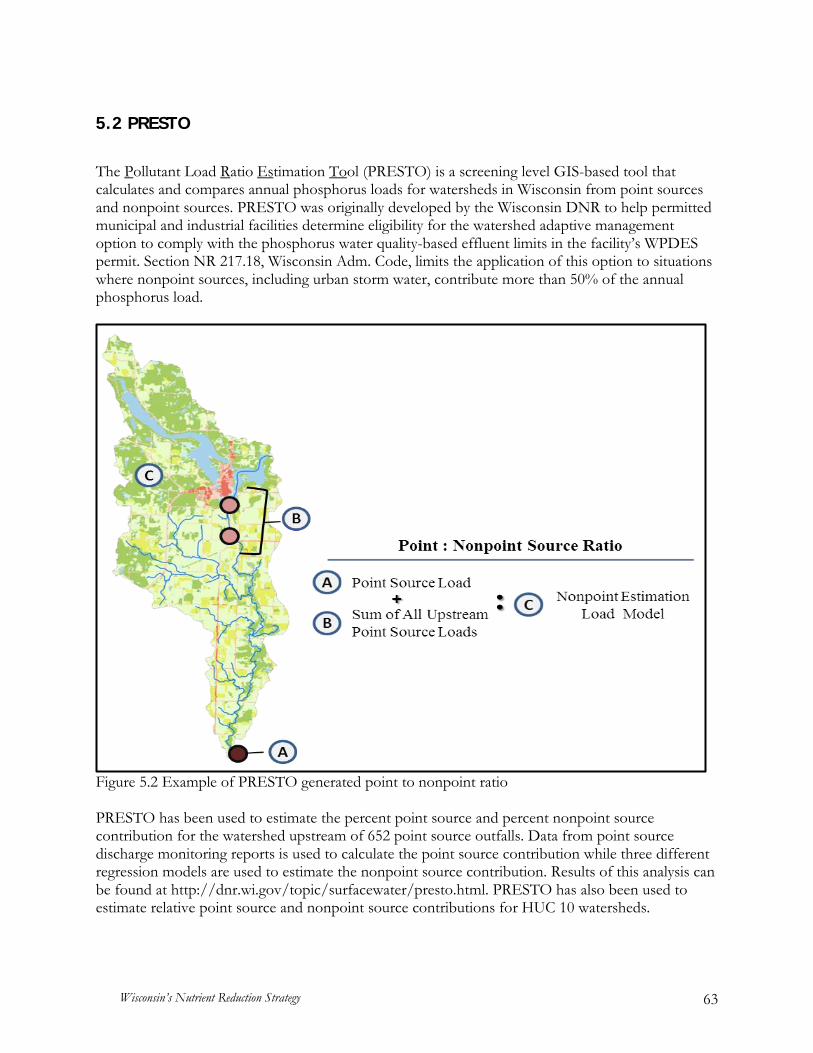
Wisconsin’s Nutrient Reduction Strategy 63
5.2 PRESTO
The Pollutant Load Ratio Estimation Tool (PRESTO) is a screening level GIS-based tool that calculates and compares annual phosphorus loads for watersheds in Wisconsin from point sources and nonpoint sources. PRESTO was originally developed by the Wisconsin DNR to help permitted municipal and industrial facilities determine eligibility for the watershed adaptive management option to comply with the phosphorus water quality-based effluent limits in the facility’s WPDES permit. Section NR 217.18, Wisconsin Adm. Code, limits the application of this option to situations where nonpoint sources, including urban storm water, contribute more than 50% of the annual phosphorus load.
Figure 5.2 Example of PRESTO generated point to nonpoint ratio PRESTO has been used to estimate the percent point source and percent nonpoint source contribution for the watershed upstream of 652 point source outfalls. Data from point source discharge monitoring reports is used to calculate the point source contribution while three different regression models are used to estimate the nonpoint source contribution. Results of this analysis can be found at http://dnr.wi.gov/topic/surfacewater/presto.html. PRESTO has also been used to estimate relative point source and nonpoint source contributions for HUC 10 watersheds.

Wisconsin’s Nutrient Reduction Strategy 64
Figure 5.3 PRESTO pre-calculated source outfall points
Wisconsin’s Nutrient Reduction Strategy 65
5.3 Watershed Adaptive Management Option
The Watershed Adaptive Management Option is a compliance option for point source facilities having both stringent phosphorus effluent limits and nonpoint sources that are the dominant contributor of phosphorus to the stream, river or lake receiving the facility’s effluent. It is based on the concept that control of nonpoint sources within the point source facility’s upstream watershed will result in attaining and maintaining water quality standards at far less cost than installing phosphorus filtration technology at the treatment plant. It was created in s. NR 217.18, Wis. Adm. Code (effective December 2010) and was approved for use in the WPDES point source permit program by EPA in 2012. At this time, this option is only available in Wisconsin. Under this option, point source facilities must accept interim phosphorus limits and work with watershed partners to develop and implement a watershed plan that will control phosphorus. The watershed plan when implemented should result in improved water quality in the watershed and potentially allow the effluent limit to be adjusted. The watershed plan may use a variety of implementation tools, such as education, technical assistance and financial assistance. Water quality monitoring must be a component of the plan. Facilities, along with their watershed partners, have two five-year permit terms to implement the watershed plan. Depending on the progress, the third permit may require compliance with the water quality-based effluent in the permit. The Wisconsin Department of Natural Resources has developed a technical handbook and other guidance information to guide use of this option. These are available at http://dnr.wi.gov/topic/SurfaceWater/AdaptiveManagement.html. 5.4 Water Quality Trading
Point source facilities with stringent effluent limits may also pursue water quality trading as a compliance option. Water quality trading typically involves a permit holder facing relatively high pollutant reduction costs compensating another party to achieve less costly pollutant load reduction while providing a greater water quality benefit. In a trade, the permit holder enters into an agreement with a municipality, other point source or nonpoint source landowners within a watershed to offset a portion of the permittee’s specific effluent discharge. This offset must control a greater amount of phosphorus based on model simulations than what would have to be controlled at the treatment facility to comply with the facility’s effluent limit. Consistent with EPA guidance, trade ratios are used to account for uncertainties and other factors such that a greater amount of pollutant is removed. Trade thresholds and acceptable trade calculation tools are also specified in the guidance documents. Wisconsin, as with many other states, has developed a trading framework and implementation guidance. Trading applies to a limited number of pollutants, but more detail is provided for total phosphorus and total suspended solids given the recently promulgated water quality standards criteria for phosphorus and recently approved total maximum daily loads for phosphorus and suspended sediment. For more information on water quality trading, see http://dnr.wi.gov/topic/surfacewater/adaptivemanagement.html.

Wisconsin’s Nutrient Reduction Strategy 66
Chapter 6. Storm Water and Septic Systems Element 5.Storm Water and Septic Systems 6.1 EPA and Gulf Hypoxia Task Force Expectations
Quoted from EPA’s recommended elements: “Identify how the State will use state, county and local government tools to assure N and P reductions from developed communities not covered by the Municipal Separate Storm Sewer Systems (MS4) program, including an evaluation of minimum criteria for septic systems, use of low impact development/ green infrastructure approaches, and/or limits on phosphorus in detergents and lawn fertilizers.” 6.2 Wisconsin’s Approach
Wisconsin has programs in place to address communities not covered by the MS4 storm water system, septic systems, and the use of phosphorus in detergents and lawn fertilizers. Programs entail a mixture of regulatory controls and financial incentives to address potential nutrient sources that are not covered under a WPDES permit structure. Construction and post-construction sites are subject to performance-based standards while certain municipalities must meet minimum standards designed to reduce pollution potential. Septic systems are regulated through county ordinances and through state regulations administered by the Department of Safety and Professional Services (DSPS), which also administers a financial assistance program for failing septic systems. Wisconsin state law also restricts phosphorus in lawn fertilizers and household detergents. 6.2.1 Construction Sites, Post-Construction Sites, and Non-Permitted Municipalities Construction sites not covered under a Municipal Separate Storm Sewer System (MS4) permit may be regulated by:
• A general construction site permit issued by the DNR, if the site has a disturbed areas of more than one acre;
• The Uniform Dwelling Code for one and two family residential construction administered by the Department of Safety and Professional Services, regardless of size;
• By technical standards of the Department of Transportation for highway construction sites; or
• By local government ordinance. Under the general construction site permit program, ch. NR 151, Wis. Adm. Code, requirements include the following:.

Wisconsin’s Nutrient Reduction Strategy 67
• Construction on any size site shall limit sediment losses to a maximum of 5 tons/acre/year. ● Construction site erosion control BMPs (Best Management Practices) located in navigable
waters or wetlands are disallowed, except for re-development sites where the BMP is on an intermittent waterway and all applicable permits are received.
● Storm water management plans are required to be implemented following construction on sites of one acre or more. The plans shall include BMPs to:
○ Reduce total suspended solids losses. ○ Reduce peak runoff discharge rates to match the pre-development peak flow rates,
using the 1-year 24 hour design storm and the 2-year, 24 hour design storm as peak flow rates.
○ Infiltrate initial runoff except where groundwater contamination could occur. (The rule specifies 3 levels of connected impervious conditions and assigns an infiltration percentage to each level, reflecting the ability of the development to meet the goal.)
○ Maintain a permanent 50 foot vegetative buffer area around lakes, rivers, streams and wetlands in the construction area.
○ Maintain a permanent 75 foot vegetative buffer zone around high quality wetlands such as sedge meadows, open and coniferous bogs, low prairies, calcareous fens, coniferous swamps, lowland hardwood swamps, and ephemeral ponds.
○ Control petroleum products in runoff from fueling and vehicle maintenance areas. The construction site requirements in the Uniform Dwelling Code, s. SPS 321.125, Wis. Adm. Code, parallel and reference the requirements in ch. NR 151, Wis. Adm. Code. Similarly, performance standards for highway construction used by the Wisconsin Department of Transportation and identified in ch. NR 151, Wis. Adm. Code. More information on these regulations can be found at http://dnr.wi.gov/topic/stormwater/construction/overview.html 6.2.2 Septic Systems Septic Systems, formally called private onsite waste treatment systems (POWTS), are under the purview of the DSPS (formerly the Department of Commerce). Chapter SPS 383, Wis. Adm. Code contains policies and procedures to establish uniform standards and criteria for the location, design, installation, inspection and management of septic system to ensure that systems will not harm public health and the waters of the state. Standards are based on the premise that soil column properties will treat the wastewater to a point where adverse impacts to surface and groundwater are minimized. Specifically:
● Soil percolation rates or soil morphological features (texture, shape, grade) dictate the maximum application rate in gallons per square foot per day. Five-day biological oxygen demand and total suspended solids of the influent also factor into the maximum application rate.
● Soil texture, percent coarse fragments, and fecal coliform levels dictate whether 24, 36, or 60 inches of unsaturated soils are required for discharge.
● Soil profile borings instead of previous “perc” tests are required to determine drain field siting. County Sanitarians administer the program at the local level.

Wisconsin’s Nutrient Reduction Strategy 68
Failing septic systems that were installed prior to July 1, 1978, are eligible for financial assistance to replace or rehabilitate the system. Chapter SPS 387, Wis. Adm. Code, governs this assistance program. A failing septic system is defined in s. 145.245 (4), Stats, and is one which causes or results in any of the following conditions:
● The discharge of sewage into surface water or groundwater. ● The introduction of sewage into zones of saturation, which adversely affects the operation
of a private sewage system. ● The discharge of sewage to a drain tile or into zones of bedrock. ● The discharge of sewage to the surface of the ground. ● The failure to accept sewage discharges and the back up of sewage into the structure served
by the private sewage system. 6.2.3 Lawn Fertilizer Wisconsin prohibits the use and sale of fertilizer containing phosphorus except under certain conditions. State law restricts the use and sale of phosphorus containing fertilizer to only those establishing new lawn or those whose soil tests indicate a need for applied phosphorus. The statutes also restrict the retail display of fertilizer to only those products not containing phosphorus. Agricultural fertilizer use is exempted from these restrictions. The term "fertilizer" does not include manipulated animal or vegetable manure or finished sewage sludge product. Restrictions are administered by DATCP under the authorities of s. 94.643 Wisconsin Stats. The use restrictions are:
● fertilizer containing phosphorus may not be used unless the person is establishing grass or if a soil test (taken within the last 36 months) indicates a phosphorus deficiency in the soil.
● fertilizer, manipulated animal or vegetable manure, or finished sewage sludge product may not be applied to turf when the ground is frozen.
● fertilizer, manipulated animal or vegetable manure, or finished sewage sludge product may not be intentionally applied to an impervious surface.
The sales restrictions are:
● No person may sell a retail turf fertilizer that is labeled as containing phosphorus or available phosphate if the person knows that the purchaser intends to use the fertilizer for a purpose other than one of the following:
○ For establishing grass, using seed or sod, during the growing season in which the purchaser began establishing the grass.
○ For application to an area if the soil in the area is deficient in phosphorus, as shown by a soil test performed no more than 36 months before the application by a laboratory.
○ For application to pasture, land used to grow grass for sod, or any other land used for agricultural production.
More information on the restrictions for use and sale of lawn fertilizer is available here: http://datcp.wi.gov/Environment/Fertilizer/Turf_Fertilizer/Retailers/
Wisconsin’s Nutrient Reduction Strategy 69
6.2.4 Phosphorus in Detergents. Wisconsin limits phosphate in detergents for washing machines and automatic dishwashers. Regulations restricting the sale of detergent products are enforced through DATCP Consumer Protection Division. Specific restrictions and exemptions are included in section 110.28 Wisconsin Statutes found, here: http://docs.legis.wisconsin.gov/statutes/statutes/100/28. 6.3 Future Directions Wisconsin will continue to implement existing programs and emphasize improving their integration with watershed planning and management efforts.
Wisconsin’s Nutrient Reduction Strategy 70
Chapter 7. Accountability and Verification Measures Element 6. Accountability and Verification Measures 7.1 EPA and Gulf Hypoxia Task Force Expectations
Quoted from EPA’s recommended elements:
"A. Identify where and how each of the tools identified in sections [Elements] 3, 4, and 5 will be used within targeted/priority sub-watersheds to assure reductions will occur.
"B. Verify that load reduction practices are in place. "C. Assess/Demonstrate progress in implementing and maintaining management activities and
achieving load reduction goals: 1) establish a baseline of existing N & P loads and current Best Management Practices
(BMP) implementation in each targeted/priority sub-watershed, 2) conduct ongoing sampling and analysis to provide regular seasonal measurements of
N & P loads leaving the watershed, and 3) provide a description and confirmation of the degree of additional BMP
implementation and maintenance activities.” 7.2 Wisconsin’s Approach Wisconsin is developing an integrated point source and nonpoint source tracking and reporting system to be used at the 12-digit HUC level. Presently, the state relies on discharge monitoring reports and efforts by County Land and Water Conservation Departments, supported by state agencies, for tracking and reporting of BMPs. The current proposal is to build upon this framework to develop a comprehensive nutrient tracking system. 7.2.1 Point Source Tracking As summarized in Chapter 3 of this document, Wisconsin requires discharge monitoring reports from WPDES permit holders for phosphorus discharges. Data exist back to the mid-1990s. For tracking nitrogen point source discharges, DNR is phasing in enhanced discharge monitoring for nitrogen for wastewater treatment facilities in the Mississippi River basin (see Chapter 8). 7.2.2 Watershed based nutrient tracking for practices to reduce Nonpoint Sources As described in previous chapters (and also in Wisconsin’s Nonpoint Source Program Management Plan, http://dnr.wi.gov/topic/nonpoint/aboutnpsprogram.html) many programs administered in Wisconsin rely on some level of BMP tracking. Wisconsin counties lead the state’s efforts to track compliance issues and water quality management practices associated with the NR 151 performance standards and prohibitions. Capacity and type of tracking system varies by county and are

Wisconsin’s Nutrient Reduction Strategy 71
inconsistent across the state. DATCP and DNR compile summaries of BMP data and prepare annual reports. While developing this Nutrient Reduction Strategy, a Tracking and Reporting Work Group began outlining an integrated tracking system that could serve an expanded set of state and local needs. Current and future efforts will help build capacity for county-level tracking that addresses these multiple program needs. Federal agency partners will continue to conduct separate compliance assessments related to their programs. DATCP and the Tracking and Reporting Work Group members have surveyed counties to learn the extent, variety, and capabilities of county BMP and compliance tracking systems. Current systems range from paper files to highly sophisticated GIS-based data management systems. DATCP and the Tracking and Reporting Work Group is compiling a comprehensive statewide summary of county systems, including the type of tracking system in place (if any), the practices and related information in the database, and how those data are collected and updated. Outcomes from this assessment and their implications for the creation of an integrated nutrient tracking system are addressed in the Future Directions portion of this chapter. Table 7.1 Sample of current nutrient reduction tracking needs
Lead Organization Program/Tracking Need
Information Collected Reporting
DNR Verification of funded BMPs through multiple grant and financial assistance programs
BMP implementation; compliance with NR151
Reports to state and EPA
DNR Public wells meeting health standards
Nitrate levels State, EPA, database
DATCP Compliance with NR151 and Working Lands Initiative
Nutrient Management Plans (acres and farms)
Annual reports; WLI compliance checking
Count Land & Water Conservation Departments
NR151 compliance and county ordinance
BMPs County, state
7.3 Future Directions
Building on innovative GIS-based tracking and inventory systems developed by multiple counties, DATCP, DNR, and the Wisconsin Land and Water Conservation Association (WLWCA) are exploring options to make efficient tracking systems available to all Wisconsin counties. The systems should be able to meet multiple data management and BMP tracking needs, and would be most efficient if they could be accessed from farm fields. While reviewing county tracking systems, WLWCA, DNR, and DATCP will examine inventory technologies, assess effectiveness with counties, and establish needed support mechanisms for counties to install and operate a tracking system. By coordinating trainings and work groups, project partners will establish an effective communication network for system users to share successes, failures, and new approaches to inventorying farms and conservation practices.

Wisconsin’s Nutrient Reduction Strategy 72
The Tracking and Reporting Work Group will systematically evaluate issues related to a potential integrated statewide tracking system throughout 2013. On initial review, systems in Outagamie County (east-central Wisconsin), Marathon County (central Wisconsin), and Eau Claire County (western Wisconsin) hold promise for an integrated statewide effort. Screen shots from the three systems are included in Figures 7.1, 7.2, and 7.3. Additional systems may be identified through the statewide assessment currently underway.
Figure 7.1 Marathon County Tracking System – ability for zoom-in view of individual parcels
Figure 7.2 Eau Claire County Tracking System – links to multiple county data sets

Wisconsin’s Nutrient Reduction Strategy 73
Figure 7.3 Sample screens from Outagamie County Tracking System The Tracking and Reporting Work Group identified several issues to address in coming months. A selection of key issues is listed here. Tracking System Structures
● Explore and develop the ability to aggregate tracking information for a variety of programs and purposes.
● Pursue the aggregation of tracking information to the HUC 12 level. This aggregation should be kept simple for reporting purposes and would not target individual farm-level information.
● Evaluate the addition of a nutrient reduction component to existing county tracking systems. Baseline Issues It is challenging to determine a “baseline” for tracking purposes, because the baseline differs according to its purpose. A baseline that enables determination of a base load is not the same as one that enables determination of a load reduction. Models Future meetings will determine how to use aggregated tracking data for models. Models may be used to evaluate and quantify non-cropland sources of nutrients. Groundwater modeling may provide additional data to track nutrients, especially those from field-tile sources. Reporting The Tracking and Reporting Work Group identified these topics concerning reporting on nutrients:
● Who is the intended audience for various reporting, especially for new reporting mechanisms?
● How will nutrient tracking reports best be generated and conveyed to these audiences? ● How could an annual Nutrient Summit play a role that combines summarizing tracking
information, and relaying specific efforts to further reduce nutrient loads?

Wisconsin’s Nutrient Reduction Strategy 74
Chapter 8. Water Quality Monitoring 8.1 EPA and Gulf Hypoxia Task Force Expectations
EPA Expectations for water quality monitoring are an implied component of all 8 elements in the Nutrient Reduction Framework, the Gulf Hypoxia essential elements, and related programs. Monitoring data are critical for targeting and prioritizing watersheds (Element 1), supporting determination of load reductions (Element 2), determining the effectiveness of permit programs (Element 3), understanding nutrient concentrations in agricultural areas (Element 4), documenting conditions in urbanized areas and from septic systems (Element 5), accountability and verification of efforts (Element 6), reporting (Element 7), and establishing numeric criteria for nutrients (Element 8). Other EPA programs, such the Section 319 Program for addressing nonpoint source pollution, also emphasize water quality monitoring of implementation projects. Simply stated, EPA expects Wisconsin to have an effective monitoring program as well as the capability to determine trends and implement a Nutrient Reduction Strategy. 8.2 Wisconsin’s Approach – Surface Water
Extensive water quality monitoring has occurred in Wisconsin for decades. DNR is the lead state agency for surface water quality monitoring but other state agencies, including DATCP, the Department of Health Services (DHS) and the University of Wisconsin System also conduct monitoring activities. In addition federal agencies, including USGS and NRCS, counties through their Land & Water Conservation Departments or health departments), non-profit organizations, volunteers, and many other local partners conduct monitoring activities. Each agency and organization conducts monitoring designed to meet specific programmatic needs, resulting in a tremendous body of information about the status of Wisconsin’s waters. A partial listing of programs is included in Table 8.1. 8.2.1 Coordination of water monitoring efforts Wisconsin’s multiple water quality monitoring efforts recognize the importance of effective monitoring to (1) calculate nutrient loads from major basins, (2) identify those basins with highest contributions (mass and yield), (3) determine trends, and (4) document progress. The workgroup assembled to address monitoring needs associated with the Nutrient Reduction Strategy identified opportunities for improving coordination and data management among Wisconsin’s multiple monitoring efforts to support the strategy. Several key monitoring programs are discussed below.

Wisconsin’s Nutrient Reduction Strategy 75
8.2.2 Key Monitoring Program Components
DNR Long-Term Trend (LTT) River Monitoring Wisconsin’s Long Term Trend (LTT) River water quality monitoring network is maintained by DNR. The LTT River network consists of 42 sites, with a minimum of one site per major river basin, generally located near the mouth of each river, most often at a site of a USGS gaging station.17 The sites are identified in Figure 8.1. Selection of the 42 trend monitoring sites considered different land coverage in the state varying from urban areas in the southeast, heavy agricultural use in central and southwest, and forest cover dominating the north. Just over half the sites (24) are sampled monthly and other sites quarterly. Monthly sites are generally located near the mouth of major rivers, whereas quarterly sites are often located at additional locations some distance above. DNR collaborates with other agencies that provide water quality measurements for some sites on the Mississippi River (e.g., Lock and Dams (LD) 3 and 4). Water quality samples are analyzed for nutrients, solids, specific conductance, pH, hardness, alkalinity, bacteria, and chlorophyll. Biannually they are analyzed for triazine herbicides during winter and summer. All analyses follow approved U.S. EPA methods. Information from long-term trends sites has been used to calculate annual loads to the Great Lakes as part of EPA’s reporting to the International Joint Commission. LTT River data have also contributed to background information for biennial Integrated Reports (“305b” Reports to US Congress), Wisconsin phosphorus rules, and development of current trends analysis (Robertson and Diebel, in preparation). Many LTT River sites are proposed to be included in a tributary load monitoring network for the Mississippi River. Information from these sites has also been used to calculate nutrient trends briefly described in Chapter 2.
DNR Watershed Rotation Water Quality Monitoring The Watershed Rotation Water Quality Monitoring activity was initiated in 2006 to collect water chemistry information at the downstream location, “pour point,” of each of 333 DNR watersheds (approximately HUC 10 size). If the watershed had multiple pour points, the largest stream was monitored. Water chemistry sampling was conducted at a monthly interval (e.g., every second Wednesday of the month) to avoid weather related bias. Field parameters included temperature, dissolved oxygen, pH and turbidity (using a transparency tube). Lab parameters include total phosphorus, ammonia-N, total Kjeldahl-N, nitrite-nitrate-N and suspended solids. This monitoring ended in September 2011. This information has been used in the targeting and priority setting analysis described in Chapter 1.
DNR TMDL Development TMDL development across the state has resulted in an increased level of monitoring to help determine pollutant load reductions necessary to meet water quality criteria. The monitoring associated with each TMDL varies widely and depends on the pollutant(s) of concern, the existing monitoring data, the geographic scale of the TMDL, and other factors. Often, DNR leads the monitoring efforts associated with TMDL development but a number of other entities contribute
17 from “Wisconsin’s Long Term Trend Water Quality Monitoring Program for Rivers: July 2001-June 2005.” Prepared by the DNR Bureau of Watershed Management River Long Term Trends Work Group. November 2006.
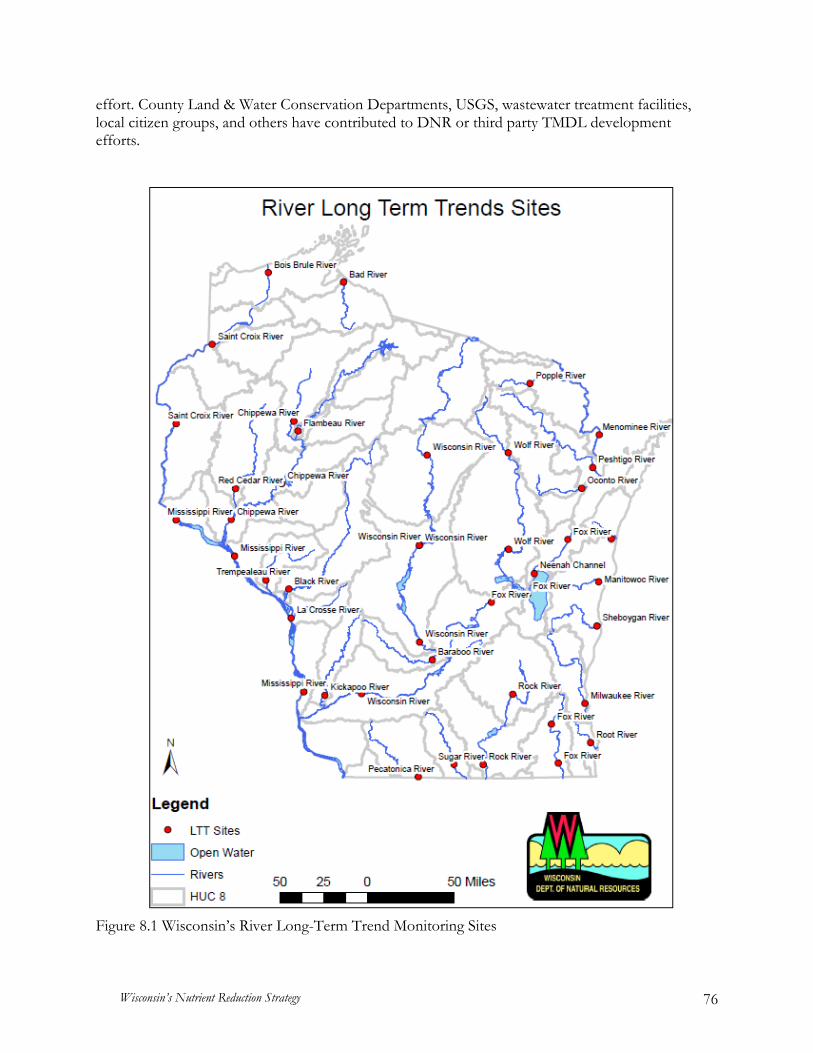
Wisconsin’s Nutrient Reduction Strategy 76
effort. County Land & Water Conservation Departments, USGS, wastewater treatment facilities, local citizen groups, and others have contributed to DNR or third party TMDL development efforts.
Figure 8.1 Wisconsin’s River Long-Term Trend Monitoring Sites

Wisconsin’s Nutrient Reduction Strategy 77
USGS Flow Gaging and Water Quality Monitoring The USGS is active in water quality monitoring and research across Wisconsin. USGS maintains a large network of flow gaging stations, including many long-term sites across the state that provide information used in a number of water quality programs, such as for calculating nutrient loads and point source permit effluent limits. Additional water quality monitoring sites are maintained through partnerships with DNR and others as part of various studies. These partnerships take advantage of USGS’s equipment, expertise, and historical involvement in Wisconsin.
NRCS Monitoring NRCS in collaboration with USGS, has organized monitoring efforts primarily through the Mississippi River Basin Initiative (MRBI). This three-tiered approach supports efforts to reduce nutrient loading from fields to waterways. The three tiers include edge-of-field monitoring, small watershed monitoring, and large watershed monitoring. These three tiers are intended to examine the impact field-level nutrient reduction practices have on loadings to adjacent waterways while also examining in-stream water quality at a number of scales. NRCS does not conduct monitoring itself but works with multiple partners to provide that service.
Multi-Partner Monitoring A number of additional monitoring efforts that are collaborative between multiple agency and organizational partners generate substantial water quality data for Wisconsin. Two projects focus on the water quality trading and watershed adaptive management options for meeting nutrient standards (see chapter 5 of this document). Municipal wastewater treatment facilities often partner with county Land & Water Conservation Departments to conduct the monitoring for these projects. County Land & Water Conservation Departments also frequently partner with agencies for other water quality monitoring efforts, including for TMDL development. Permitted wastewater discharge facilities (municipal and industrial) individually collect water quality data, and as a group, they provide data for selected urban areas of the state. Another set of monitoring efforts that collectively provide water quality data for the state is the volunteer monitoring program guided by DNR and UW-Extension. Volunteers are trained in techniques to ensure that the data they collect adheres to agency standards and is pertinent to statewide monitoring goals. Volunteer monitoring is often conducted by non-profit groups and individuals. An additional outcome of volunteer monitoring programs is increased awareness of water quality issues statewide.
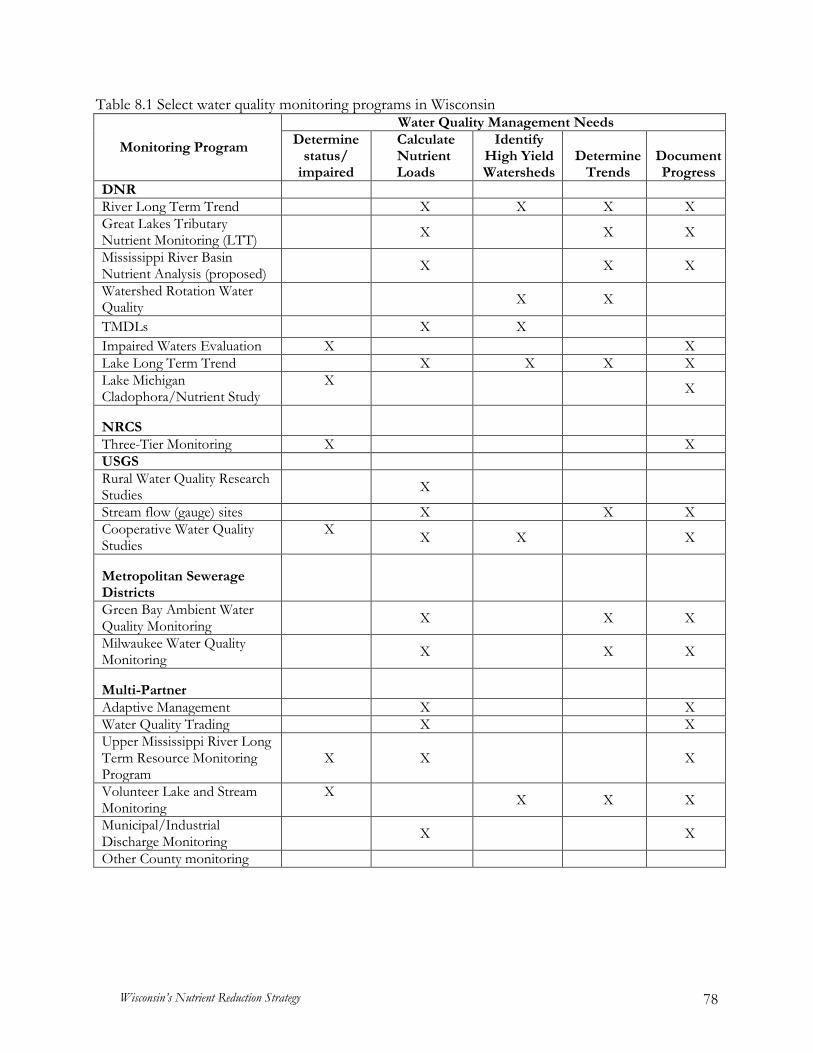
Wisconsin’s Nutrient Reduction Strategy 78
Table 8.1 Select water quality monitoring programs in Wisconsin
Monitoring Program
Water Quality Management Needs Determine
status/ impaired
Calculate Nutrient Loads
Identify High Yield Watersheds
Determine Trends
Document Progress
DNR River Long Term Trend X X X X Great Lakes Tributary Nutrient Monitoring (LTT)
X X X
Mississippi River Basin Nutrient Analysis (proposed)
X X X
Watershed Rotation Water Quality
X X
TMDLs X X Impaired Waters Evaluation X X Lake Long Term Trend X X X X Lake Michigan Cladophora/Nutrient Study
X X
NRCS
Three-Tier Monitoring X X USGS Rural Water Quality Research Studies
X
Stream flow (gauge) sites X X X Cooperative Water Quality Studies
X X X X
Metropolitan Sewerage Districts
Green Bay Ambient Water Quality Monitoring
X X X
Milwaukee Water Quality Monitoring
X X X
Multi-Partner
Adaptive Management X X Water Quality Trading X X Upper Mississippi River Long Term Resource Monitoring Program
X X X
Volunteer Lake and Stream Monitoring
X X X X
Municipal/Industrial Discharge Monitoring
X X
Other County monitoring

Wisconsin’s Nutrient Reduction Strategy 79
8.3 Wisconsin’s Approach – Groundwater and Drinking Water
Groundwater monitoring in Wisconsin occurs primarily through public water system testing associated with federal Safe Drinking Water Act (SDWA) requirements, private well testing for drinking water quality by individual homeowners, and formal monitoring programs conducted by DNR, DATCP, GNHS and USGS. The University of Wisconsin Stevens Point also maintains an extensive statewide database with water quality results from private wells and winter stream base-flow monitoring. The information collected from these efforts is used for various public health and environmental management purposes. Although groundwater monitoring programs frequently include nitrogen, phosphorus, due to the absence of human health concerns and low mobility in groundwater is rarely included. None of the above programs is focused on characterizing statewide groundwater with respect to nutrients or other contaminants. Compared to surface water monitoring, groundwater monitoring is more difficult due to the expense of constructing wells and considerations of contaminant transport, travel times, depth, and aquifer type. Because of the expense and these considerations there is no ambient groundwater quality network in Wisconsin. 8.3.1 Coordination of water monitoring efforts In 1983 the Wisconsin Groundwater Coordinating Council (GCC) was created to serve as a means of increasing the efficiency and facilitating the effective functioning of state agencies in activities related to groundwater management. The GCC is composed of representatives from six state agencies, the State Geologist and Governor’s representative and advises and assists state agencies in the coordination of nonregulatory programs and the exchange of information related to groundwater. One of the GCC’s main concerns has been groundwater monitoring and research activities and through their efforts groundwater monitoring has improved due to increased communication and eliminated duplication of effort. The GCC has coordinated the Joint Solicitation for proposals to Wisconsin’s Groundwater Research and Monitoring Program Since 1991 The DNR, UWS, DATCP, and Commerce have funded over 400 groundwater monitoring and research projects. The GCC prepares a report each year that, among other thing, summarizes the condition of the groundwater resource. Nitrate, being a leading threat to groundwater, is discussed at length in the report at: http://dnr.wi.gov/topic/groundwater/documents/GCC/GwQuality/Nitrate.pdf 8.3.2 Key Monitoring Program Components Wisconsin’s multiple groundwater quality monitoring efforts recognize the importance effective monitoring to characterize the quality of the resource, respond to groundwater quality problems, and assess the effectiveness of management efforts.

Wisconsin’s Nutrient Reduction Strategy 80
DNR Public Water System Monitoring The DNR’s Bureau of Drinking Water and Groundwater implements and enforces the requirements of the Safe Drinking Water Act in Wisconsin. There are approximately 11,500 public water systems in the state and each must monitor the quality of the water it provides. These systems monitor for nitrate-nitrogen at least annually. An example of recent use of public water supply data for resource monitoring purposes is DNR’s “Wisconsin Safer Drinking Water Nitrate Initiative. The initiative is targeted at reducing nitrate levels in groundwater by making the most efficient use of nitrogen in agricultural production. Activities in project areas include measuring all current nitrogen inputs and baseline groundwater nitrate levels, calculate agricultural input and production costs, determine and implement best nitrogen management practices that optimize groundwater conditions and agricultural production efficiency, and measure whether predicted results are achieved. Target areas were selected by reviewing statewide at non-community public well data (see Figure 8.2). Project areas have been selected in Rock and Sauk Counties within subwatersheds with large numbers of public drinking water systems approaching unsafe levels of nitrate contamination. DNR is currently working with stakeholders to determine an optimal nitrogen management system. In the next phase of the project the nitrogen management system will be applied in one of the project areas. Monitoring of nitrogen inputs, groundwater nitrate levels, production costs will continue and costs of nitrogen management will be compared to water treatment costs.
Private Drinking Water Supply Well Monitoring Regulations do not require that private water well be sampled for nitrate. However many well owners do have their well tested because of concerns about contamination. DNR, DATCP and UW-SP track this data where available. Since sampling is done for only a minority of wells the data is difficult to use to characterize the resource. However, DATCP has conducted 4 statewide surveys (1994, 1996, 2001 and 2007) using a stratified random sampling procedure that were used to represent groundwater accessible by private wells. The 2007 survey (http://datcp.wi.gov/uploads/Environment/pdf/ARMPub180.pdf) estimated that the proportion of wells that exceeded the 10 mg/l enforcement standard for nitrate-nitrogen was 9.0%. The UW-SP maintains a private well sampling program and a statewide database of private well water quality. The data is accessible through their Groundwater Quality Viewer (http://gissrv2.uwsp.edu/cnr/gwc/pw_web/) map viewer which displays groundwater quality information from private wells around the state.
Contaminated Site Monitoring DNR, DATCP and DSPS monitor sites of groundwater and soil contamination for the purpose of implementing the groundwater standards contained in ch. NR 140, Wis. Adm. Code. Monitoring occurs at sites associated with: spills, hazardous substance release sites, abandoned containers, drycleaners, brownfields, leaking underground storage tanks, closed wastewater and solid waste facilities, hazardous waste corrective action and generator closures, and sediment cleanup actions, proposed, active, and inactive solid waste facilities and landfills, municipal and industrial wastewater discharges, by-product solids and sludge disposal from wastewater treatment systems, and wastewater land treatment/disposal systems. Many of these sites are monitored for nitrate and/or ammonia concentrations but the data is somewhat difficult to access.
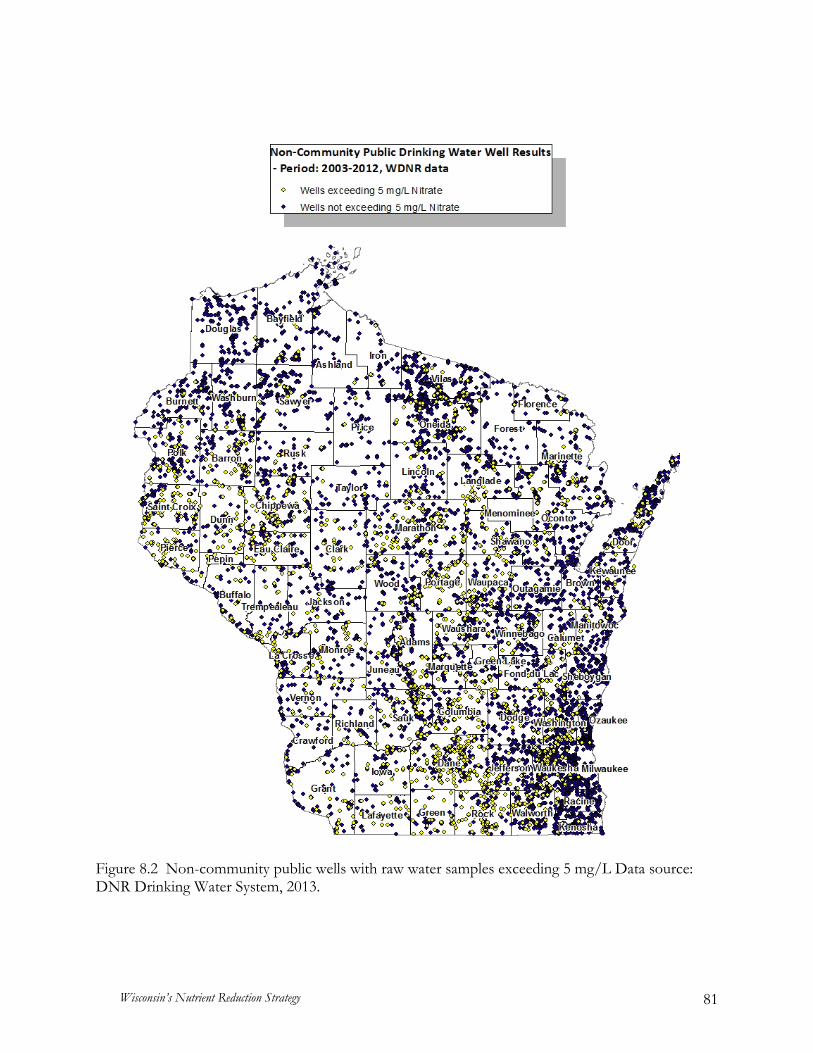
Wisconsin’s Nutrient Reduction Strategy 81
Figure 8.2 Non-community public wells with raw water samples exceeding 5 mg/L Data source: DNR Drinking Water System, 2013.

Wisconsin’s Nutrient Reduction Strategy 82
Groundwater Management Practice Monitoring Projects DNR, UWS, DATCP and DSPS/Commerce/DILHR have funded over 400 Groundwater Research and Monitoring projects since 1983. Many of these projects have contributed to the understanding of nitrogen occurrence in Wisconsin’s groundwater. A list of projects is here: http://dnr.wi.gov/topic/groundwater/documents/GCC/MonitoringResearch/AllProjects.pdf. A partial listing of groundwater monitoring programs is included in Table 8.2. Table 8.2 Selected groundwater and drinking water quality monitoring programs
Monitoring Program Objective Agency
Identify High Yield
Watersheds Determine
Trends Document Progress
Public water system monitoring
Determine Compliance -
SDWA requirements
DNR – DG No Yes Yes
Private well monitoring Determine
compliance - bacteria
DNR-DG Possibly Possibly In limited cases
Private well monitoring
Determine compliance – pesticides and
nitrate
DATCP Possibly Possibly In limited cases
Private well monitoring Homeowner information UW-SP Possibly Possibly In limited
cases
Landfill
Determine compliance – groundwater
standards
DNR – WMM Possibly Yes Yes
Contaminated and cleaned-up sites
Determine compliance – groundwater
standards
DNR-RR Possibly Yes Yes
Wastewater discharges, by-product solids, and sludge disposal
Determine compliance – Groundwater
standards
DNR-WQ Possibly Yes Yes
County monitoring Various Some Counties Various Various Various
Management Practice Monitoring and Research
Evaluate effectiveness of
management practices and various other
DNR, UWS, DATCP, USGS,
WGNHS and others
Possibly Possibly Possibly
8.4 Future Directions for Monitoring Improvement
The multiple agency partners involved in developing this Nutrient Reduction Strategy are exploring opportunities to ensure that existing monitoring efforts are coordinated into an expanded framework for water quality monitoring. The workgroup determined that an improved state monitoring framework could enhance communication and coordination among monitoring entities, guide future monitoring efforts, and continue to meet the specific and multiple programmatic needs

Wisconsin’s Nutrient Reduction Strategy 83
for analysis and reporting. The vision for an improved monitoring framework involves coordinating existing efforts through multiple levels. There are three levels of monitoring for surface water and three levels for groundwater. 8.4.1 Surface Water Monitoring The three levels of surface water quality monitoring coordination are described below. Together, they outline a structure to organize current monitoring efforts occurring across Wisconsin based on their goals, characteristics, and outcomes. The levels will be clarified and further refined as the Monitoring Work Group reviews details of monitoring efforts, such as scale, purpose, and potential for coordination.
Level 1 – A fixed statewide network to describe status and trends The objective of Level 1 is to characterize nutrient concentrations and loads and quantify long-term nutrient trends from HUC 6 and HUC 8 watersheds. To best achieve this objective a spatially distributed network of fixed stations co-located with flow gaging stations would be operated over a long term. Sites within the Wisconsin network may also be part of multi-state networks for the Great Lakes or Mississippi River Basin. Water chemistry samples should be collected at least on a monthly basis and analyzed for nutrients, and suspended sediment/solids. Flow should be monitored on a continuous basis. The existing DNR River LTT network described above and the Great Lakes Nutrient Load monitoring with their associated USGS flow gaging stations fit into this level. Wisconsin will continue to conduct long-term trend monitoring through DNR LTT River network. Data will be used for trend analysis, the biennial Integrated Report, and more.
Level 2 – A flexible network to identify high nutrient concentration surface waters The objective of Level 2 is to identify lakes, streams and rivers with high concentrations of nutrients that occur especially during the growing season (May through October). These waters will probably have high nutrient loadings. To best achieve this objective a spatially distributed network of stations corresponding to HUC 10s or HUC 12s is needed. Water chemistry samples for this objective should generally be taken on a monthly basis and analyzed for phosphorus, nitrogen and suspended sediment/solids. Given the size of such a network, continuous flow gaging is not practicable. The DNR Watershed Rotation Water Quality Monitoring activities fit into this level, and preliminary analysis is underway. More detailed monitoring would be needed – possibly in targeted HUC 10s – to best identify implementation projects at the HUC 12 scale. Sites in this network could be sampled on a rotational basis. Self help volunteer monitoring of lakes (for Secchi depth, total phosphorus, and cholorphyll a) and volunteer stream monitoring (for phosphorus) could also fit into this level. Data from Level 2 would also contribute to the biennial Integrated Report and to TMDL development and implementation.
Level 3 – Special projects to quantify surface water process and effects of management practices Monitoring at this level addresses specific questions to determine cause and effect of implementing specific land use practices. Nutrient loads in surface water in watersheds of varying sizes across the state would be analyzed before and after implementation of the practices. Comparisons would be

Wisconsin’s Nutrient Reduction Strategy 84
made to determine the effects of the practices on nutrient loads. The spatial scale for this level is generally at HUC 12 or smaller, depending on the specific questions being answered. Flow and concentration measurements would be made to support load calculations. Depending on the duration of the effort, this level may support trend identification. The frequency of monitoring and other details would vary by project and often specified in a quality assurance program plan or the program’s standard operating procedures. Several existing efforts fit into this level, including NRCS small watershed projects (e.g., East River, Dane Co projects), and UW projects including Pioneer and Discovery Farms, and volunteer monitoring within a specific watershed. An example of an emerging application for this level could be in-stream sampling by POTWs associated with trading or the Watershed Adaptive Management Option. 8.4.2 Groundwater Monitoring The two levels of groundwater quality monitoring coordination are described below. Together, they outline a structure to organize current monitoring efforts occurring across Wisconsin based on their goals, characteristics, and outcomes. The levels will be clarified and further refined as the Monitoring Work Group reviews details of monitoring efforts, such as scale, purpose, and potential for coordination.
Level 1 – A fixed statewide network to describe status and trends The goal at this level is to carry out regular monitoring of groundwater across the state to characterize the status and long-term trends of nitrate-nitrogen concentrations in Wisconsin’s groundwater. As with surface water monitoring at this level, this would allow for patterns to be analyzed and areas flagged for further study if high concentrations are observed. Ideally, a network of fixed sites that are spatially and geologically distributed and representative of groundwater statewide is needed. These sites would be maintained over the long term and would be monitored semi-annually or annually. The three-dimensional nature of factors that affect groundwater pose challenges to developing a monitoring network at this level. Different geologic formations vary in their susceptibility to contamination and thus well depth and aquifer information are important considerations. A network of this type is currently far beyond the financial resources available. In 2012-2013 the GCC’s Research and Monitoring Subcommittee evaluated options for achieving this goal and arrived at three options: 1) using available private well data; 2) using a statistical approach similar to what DATCP published in 2008 sampling a relatively small number of private wells at strategic locations and settings; and 3) using non-community public water well data as shown in Figure 8-2. Option 1 is a good tool to address issues such as where and when wells have been drilled and abandoned and can add some insight to where nitrate is most prevalent but is fraught with problems related to the disparate nature of the data set. Option 2 is a solid, cost-effective approach but the budget of approximately $100,000 is currently out-of-reach. This leaves Option 3 as the best currently attainable method. The 2008 DATCP report is available here: (http://datcp.wi.gov/uploads/Environment/pdf/ARMPub180.pdf).
Level 2 – Identification of high nitrate concentration in groundwater using existing wells Monitoring at this level addresses specific questions to determine cause and effect of implementing specific land use practices on water levels and nutrient concentration in groundwater as needed

Wisconsin’s Nutrient Reduction Strategy 85
across the state. Numerous Management Practice Monitoring Projects have monitored specific nitrogen-contributing agricultural or waste disposal practices to evaluate the effect of various geological conditions and management practices on nitrogen loading to groundwater. Another example of this kind of work is DNR’s “Wisconsin Safer Drinking Water Nitrate Initiative” which is targeted at reducing nitrate levels in groundwater by making the most efficient use of nitrogen in agricultural production. By focusing on small project areas an optimal nitrogen management system is more likely to be effective. 8.4.3 Moving Forward Agency partners have already identified many issues to address as part of their discussions exploring the potential for this tiered approach. Issues include identifying additional sites for the Long Term Trends (LTT) monitoring, identifying sampling frequency and methods for sites within various levels, and protocols for reporting and sharing data. Table 8.3 Potential levels for coordinating water quality monitoring
Level Spatial Scale Key
Measurements Duration Monitoring Goals Trend
Analysis Monitoring Frequency Lead Monitors
1 - surface Approx. HUC 8
Flow and concentrations Ongoing Broad Yes Monthly DNR/USGS
2 - surface Approx.
HUC 10 or 12
Concentrations
Periodic (perhaps every 5 years)
Inventory of conditions and for flagging waterways
with high concentrations for follow up study.
Possibly, but would be at a coarse scale
Monthly for 12 months DNR
3 - surface
Various scales,
generally HUC 12 or
smaller
Flow and Concentration Variable
Answering specific questions; local
interest
Variable, project specific
Variable, project specific
Variable, project specific. Volunteers,
others, publically owned wastewater treatment systems
1 - ground
Statewide, stratified by
geologic factors and
land use
Nitrate concentrations
In develop-
ment
Broad - identifying spatial patterns, problem areas
Yes Annually at minimum
DNR/USGS/ WGNHS/DATCP
2 - ground Localized Nitrate concentration Variable Answering specific
questions
Variable, project specific
Variable, project specific
Variable, project specific

Wisconsin’s Nutrient Reduction Strategy 86
Chapter 9. Reporting Element 7. Annual public reporting of implementation activities and biennial reporting of load reductions and environmental impacts associated with each management activity in targeted watersheds 9.1 EPA and Gulf Hypoxia Task Force Expectations
Quoted from EPA’s recommended elements:
"A. Establish a process to annually report for each targeted/priority sub-watershed: status, challenges, and progress toward meeting N & P loading reduction goals, as well as specific activities the state has implemented to reduce N & P loads such as: reducing identified practices that result in excess N & P runoff and documenting and verifying implementation and maintenance of source-specific best management practices.
"B. Share annual report publically on the state's website with request for comments and feedback for an adaptive management approach to improve implementation, strengthen collaborative local, county, state, and federal partnerships, and identify additional opportunities for accelerating cost effective N & P load reductions.”
9.2 Wisconsin’s Approach
Wisconsin plans to report on implementation activities and estimated nutrient reductions. Reporting will occur through a new annual forum or summit. This new annual event will highlight key issues and activities related to the strategy, provide a review of new information regarding watershed targeting, tracking, and monitoring, and help establish priorities and actions for partner agencies and organizations for the following year. Summary information about nutrient reduction and related activities will also be reported through websites and through the biennial Integrated Report to Congress (the 305b Report). Efforts tied to specific programs and funding sources will also be reported through those program’s required reporting structures (e.g., EPA 319 accomplishment reporting). 9.3 Future Directions The first annual report would take place at a summit in June 2014. Options for reporting additional nutrient information through websites are under consideration.

Wisconsin’s Nutrient Reduction Strategy 87
Chapter 10. Numeric Nutrient Water Quality Criteria Element 8. Develop Work Plan and Schedule for Numeric Criteria Development 10.1 EPA and Gulf Hypoxia Task Force Expectations
Both the EPA Framework and the Gulf Hypoxia Action Plan call for states to develop numeric water quality standards for both phosphorus and nitrogen. EPA has provided further elaboration in its national performance measure WQ-26, where, if a state has not completed adoption of numeric criteria, it must provide a schedule of activities with annual milestones for adoption no later than 2016. That schedule must include milestones for each of these activities:
1. Planning for criteria development 2. Collection of information and data 3. Analysis of information and data 4. Proposal of criteria 5. Adoption of criteria into the state's or territory's water quality standards (related to measure WQ-1a)
WQ-26 implies that states may have the option to scientifically justify that criteria are not needed for certain waters, such as phosphorus criteria are sufficient and nitrogen criteria are not needed. 10.2 Wisconsin’s Approach and Future Directions Phosphorus Criteria In 2010, the Wisconsin Department of Natural Resources adopted numeric phosphorus water quality standards criteria for three categories of waters: rivers and streams; lakes and reservoirs; and nearshore and open waters of the Great Lakes within Wisconsin jurisdiction. These numeric phosphorus water quality criteria were approved by EPA in December 2010 and met the EPA imposed deadline of December 31, 2010. The table below shows the adopted phosphorus water quality standards criteria by type of water body. The specific water body types are defined in the s. NR 102.06, Wis. Adm. Code.
Adopted Phosphorus Criteria by Type of Water Body Total Phosphorus in
ug/L NR 102.06 listed rivers 100
All other streams 75 Stratified reservoirs 30
Non-stratified reservoirs 40 Stratified “two-story” fishery lakes 15
Stratified drainage lakes 30 Non-stratified (shallow) drainage lakes 40

Wisconsin’s Nutrient Reduction Strategy 88
Stratified seepage lakes 20 Non-stratified (shallow) lakes 40
Impoundments Same as inflowing river or stream
Lake Michigan open and nearshore waters 7 Lake Superior open and nearshore waters 5
Note: There are some exclusions, such as lakes under 5 acres and ephemeral streams
The adopted criteria for streams and rivers were based primarily on two peer-reviewed published reports by the U. S. Geological Survey and the Wisconsin Department of Natural Resources: “Nutrient Concentrations and Their Relations to Biotic Integrity of Wadeable Streams in Wisconsin” (USGS Professional Paper 1722, 2006) and “Nutrient Concentrations and Their Relations to Biotic Integrity of Nonwadeable Rivers in Wisconsin” (USGS Professional Paper 1754, 2008). These research studies analyzed the relations between phosphorus and nitrogen and biotic indices, such as those for fish and aquatic insects. In general, the studies showed stronger relations for phosphorus than nitrogen, but there appeared to be an influence on biotic integrity from nitrogen. Nitrogen Criteria – Surface Waters EPA maintains a position that states must develop both phosphorus and nitrogen water quality standards criteria “unless the state provides a strong technical and scientific justification, considering both local and downstream effects, that one or the other is not needed” (EPA WQ-26). Where a state has not completed adoption of numeric nutrient criteria, EPA requires the state to provide a full set of performance measure milestone information for adopting numeric criteria (EPA WQ-26). Each year the state must report on progress for adopting criteria for at least one class of water, such as streams, lakes or estuaries, by 2016. EPA has identified the following key activities and requires milestones be established for each of the activities:
1. Planning for criteria development 2. Collection of information and data 3. Analysis of information and data 4. Proposal of criteria 5. Adoption of criteria into the state’s water quality standards.
Each of these activities is briefly described below.
1. Planning for criteria development -- completed
As mentioned above, the wadeable stream and non-wadeable river studies were designed to analyze the relations of both phosphorus and nitrogen on biotic indicators. Water quality samples were collected and analyzed for both phosphorus and nitrogen.

Wisconsin’s Nutrient Reduction Strategy 89
In 2011, the Department of Natural Resources convened a work group of technical experts from the Department, USGS, EPA and the University of Wisconsin to review previous work and identify any additional study needs. The work group recommended that additional information be collected on streams with relatively higher nitrogen concentrations and lower phosphorus concentrations. A working list of 15 to 20 of these streams was prepared.
2. Collection of information and data -- completed
In 2011 and 2012, water chemistry and biotic data was collected on the selected streams. Laboratory analysis of the collected samples was completed in late 2012.
3. Analysis of information and data – planned to be completed July 2014
Statistical analysis and expert review of the data is planned for 2013 and extending into 2014. The data from the new sites will be assessed both as a group and as part of the previously compiled data set on about 240 wadeable streams. The scientific review will include analysis of the strength of relations between nitrogen and biotic indices and conform to the suite of EPA guidance.
4. Proposal of criteria
Whether the Department of Natural Resources proposes criteria or pursues the option of showing that nitrogen criteria are not needed will be determined after the scientific analysis in the step 3 above is completed..
5. Adoption of criteria
Any proposed criteria will need to go through Wisconsin’s process for adoption of administrative rule development. Generally, this includes approval from the Natural Resources Board and Governor to pursue rule development, convening of a stakeholder advisory committee, presentation of proposed rules for public comment, development of an economic impact analysis, approval by the Natural Resources Board, legislative review and approval by EPA. Often this is at least a three year process. Included in the review process is an assessment of whether nearby states have adopted similar water quality standards criteria.
Nitrogen Standards – Groundwater and Drinking Water Wisconsin has adopted nitrogen water quality standards for groundwater and drinking water. Specifically, ch. NR 140, Wis. Adm. Code, includes a concentration of 10 mg/L nitrate (expressed as N) as the enforcement standard for groundwater. Similarly, ch. NR 809, Wis. Adm. Code identifies a nitrate concentration of 10 mg/L as a maximum contaminant level for drinking water. Chapter NR 809 also identifies 1 mg/L as a maximum contaminant level for nitrite.
A-1
Appendix 1. Wisconsin’s Nutrient Reduction Framework HUC 10 Data Table The following table contains summary information for all HUC 10s in Wisconsin. The table rows are divided by major basin: Lake Superior (listed first), Lake Michigan (listed second), and Mississippi River (listed third). The table includes thirteen columns with information about each HUC 10 watershed. Below is a column-by-column description. Columns 1 and 2 are watershed identifiers.
1. HUC 10 Code. The federal Hydrologic Unit Classification 10-digit number for the watershed. HUC 10s do span state boundaries and some have very small areas in Wisconsin.
2. HUC 10 Name. The federal Hydrologic Unit Classification 10-digit watershed official
name. Columns 3 (“% agriculture”) through 8 (“Contains ORW/ERW Water”) provide contextual information about each watershed to supplement the ranking information in columns 9 through 13.
3. % Agriculture. The percent of the land area within the HUC 10 watershed in agricultural
use (source: Wisconsin statewide GIS land cover and hydrography data sets)
4. % Urban. The percent of the land area within the HUC 10 watershed in urban use (source: Wisconsin statewide GIS land cover and hydrography data sets)
5. PRESTO PS NPS Ratio. The percent of the phosphorus contribution within the HUC 10
watershed estimated from point sources and nonpoint sources using the Pollutant Load Ratio Estimation Tool (PRESTO). The wastewater point source information is from the 2009-2011 Discharge Monitoring Reports submitted by the facilities. The nonpoint source contribution is based on a suite of models with the middle range result used. The values are expressed as percentages.
6. Contains Nutrient/Sediment Impaired Water. Identifies if the HUC 10 watershed
includes a water body listed as impaired for nutrients or sediments. Information is based on the 2012 303(d) list. Since sediment impaired waters generally require similar management of phosphorus impaired waters, they are also included as reference information. In a few cases, bacteria impaired waters are included. None of the waters are impaired due to total nitrogen.
7. Within Approved TMDL. Identifies if the HUC 10 watershed is within the basin or
watershed included in an EPA approved TMDL.

A-2
8. Contains ORW/ERW Water. Identifies if the HUC 10 watershed contains a state Outstanding Resource Water (ORW) or Exceptional Resource Water (ERW).
Columns 9A through 12 contain ranking information separately for phosphorus and nitrogen. HUC 10s with only a few square miles in Wisconsin are not given values and are marked “na”. For these columns, HUC 10 watersheds in the Lake Superior Basin were not ranked (see additional notes below). 9. TP Yield Decile (SPARROW Model). This column has two parts. Both are based on
phosphorus attributes of the USGS SPARROW model for nonpoint sources. Yields are loads per unit area, such as pounds per acre per average year. The left part (“Incr.”) contains the incremental yield for use when considering local impacts. The right part (“Del’d”) contains the delivered yield for use when considering transport of phosphorus to downstream waters, such as the Mississippi River or Lake Michigan. All values are expressed in deciles. For example, the highest 10 percent are in decile 10, while the lowest 10 percent are in decile 1. HUC 10 watersheds in the Lake Superior Basin were not ranked as the decile range is comparable to deciles 1-4 for Lake Michigan and Mississippi River.
10. TP Concentration Decile (monit’d). This column uses monitored stream information to
rank HUC 10 watersheds based on median growing season phosphorus concentrations. Deciles are based on highest to lowest concentrations. Over 80 percent of the information is from a 2006 to 2011 WDNR rotation watershed study of watersheds (described in chapter 8) where, if practical, the downstream “pour” point was measured. A minimum of four samples was needed to use the information. For about 10 percent of the HUC 10 watersheds, information from similar studies was used. For the remaining HUC 10s, results were extrapolated from similar, nearby HUC 10s. For deciles 1 through 4, the median concentrations were less than the Wisconsin water quality standards criterion for phosphorus. HUC 10 watersheds in the Lake Superior Basin were not ranked as the decile range is comparable to deciles 1-4 for Lake Michigan and Mississippi River.
11. TN Yield Decile (SPARROW Model). This column has two parts. Both are based on
nitrogen attributes of the USGS SPARROW model for nonpoint sources. Yields are loads per unit area, such as pounds per acre per average year. The left part (“Incr.”) contains the incremental yield for use when considering local impacts. The right part (“Del’d”) contains the delivered yield for use when considering transport of nitrogen to downstream waters, such as the Mississippi River or Lake Michigan. All values are expressed in deciles. For example, the highest 10 percent are in decile 10, while the lowest 10 percent are in decile 1. HUC 10 watersheds in the Lake Superior Basin were not ranked as the decile range is comparable to deciles 1-4 for Lake Michigan and Mississippi River.
12. TN Concentration Decile (monit’d). This column uses monitored stream information to
rank HUC 10 watersheds based on median growing season total nitrogen concentrations. Deciles are based on highest to lowest concentrations. Over 80 percent of the information is from a 2006 to 2011 WDNR rotation watershed study of watersheds (described in chapter 8) where, if practical, the downstream “pour” point was measured. A minimum of four samples was needed to use the information. For about 10 percent of the watersheds, only nitrite-nitrate results were used due to the lack of laboratory results for Total Kjeldahl Nitrogen. For about 5 percent of the HUC 10 watersheds, information from similar studies

A-3
was used. For the remaining HUC 10s, results were extrapolated from similar, nearby HUC 10s. HUC 10 watersheds in the Lake Superior Basin were not ranked as the decile range is comparable to deciles 1-4 for Lake Michigan and Mississippi River.
13. Safe Drinking Water Nutrient Impacts. The last column also uses decile ranking of watersheds with safe drinking water nutrient impacts. The deciles are based on the number and frequency of public drinking water wells located in the HUC 10 watershed with nitrate concentrations exceeding 5 mg/L based on samples from the wells reported to WDNR. A HUC 10 ranking high would have a number of public wells with a high percent with nitrate levels exceeding 5 mg/L. A HUC 10 ranking low could have low concentrations, few wells or only a small number of the wells with concentrations exceeding 5 mg/L.
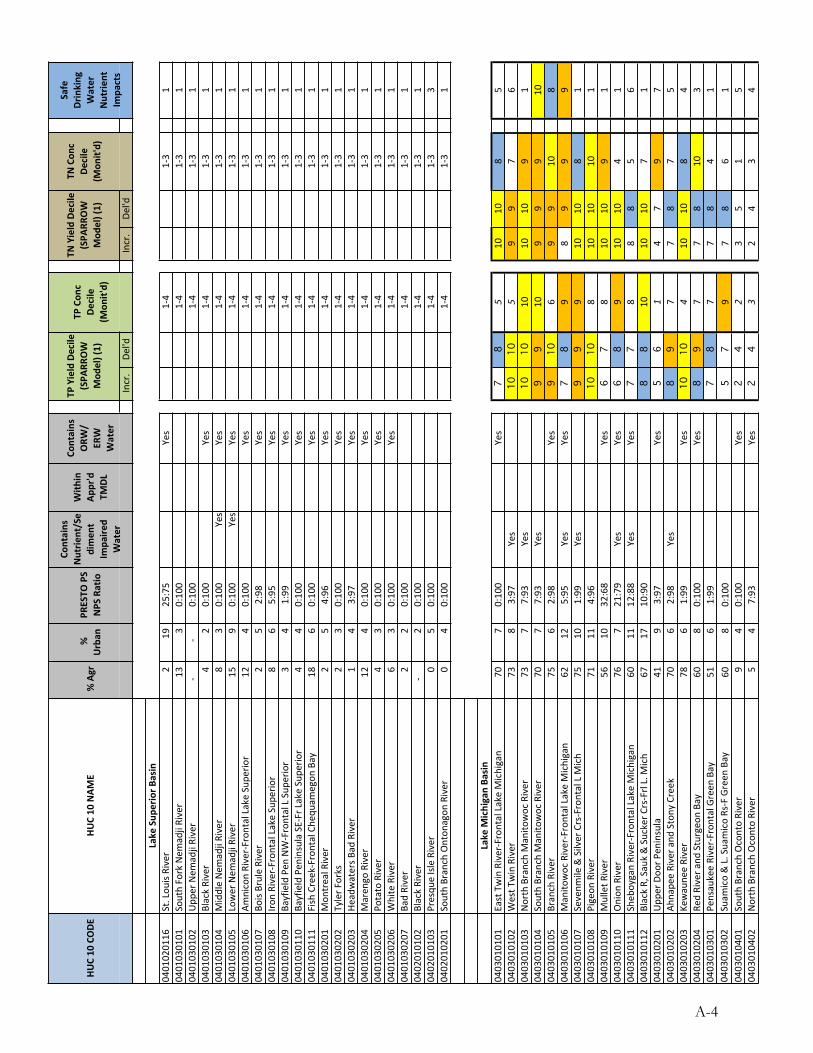
TN Con
c De
cile
(Mon
it'd)
Incr.
Del'd
Incr.
Del'd
Lake Sup
erior B
asin
0401020116
St. Lou
is River
2
19
25:75
Yes
1-‐4
1-‐3
10401030101
South Fork Nem
adji River
13
3
0:100
1-‐4
1-‐3
10401030102
Upp
er Nem
adji River
-‐
-‐
0:100
1-‐4
1-‐3
10401030103
Black River
4
2
0:100
Yes
1-‐4
1-‐3
10401030104
Middle Nem
adji River
8
3
0:100
Yes
Yes
1-‐4
1-‐3
10401030105
Lower Nem
adji River
15
9
0:100
Yes
Yes
1-‐4
1-‐3
10401030106
Amnicon River-‐Fron
tal Lake Supe
rior
12
4
0:100
Yes
1-‐4
1-‐3
10401030107
Bois Brule River
2
5
2:98
Yes
1-‐4
1-‐3
10401030108
Iron River-‐Fron
tal Lake Supe
rior
8
6
5:95
Yes
1-‐4
1-‐3
10401030109
Bayfield Pen
NW-‐Frontal L Sup
erior
3
4
1:99
Yes
1-‐4
1-‐3
10401030110
Bayfield Pen
insula SE-‐Fr Lake Supe
rior
4
4
0:100
Yes
1-‐4
1-‐3
10401030111
Fish Creek-‐Frontal Che
quam
egon
Bay
18
6
0:100
Yes
1-‐4
1-‐3
10401030201
Mon
treal River
2
5
4:96
Yes
1-‐4
1-‐3
10401030202
Tyler F
orks
2
3
0:100
Yes
1-‐4
1-‐3
10401030203
Headwaters B
ad River
1
4
3:97
Yes
1-‐4
1-‐3
10401030204
Maren
go River
12
4
0:100
Yes
1-‐4
1-‐3
10401030205
Potato River
4
3
0:100
Yes
1-‐4
1-‐3
10401030206
White River
6
3
0:100
Yes
1-‐4
1-‐3
10401030207
Bad River
2
2
0:100
1-‐4
1-‐3
10402010102
Black River
-‐
2
0:100
1-‐4
1-‐3
10402010103
Presqu
e Isle River
0
5
0:100
1-‐4
1-‐3
30402010201
South Branch Onton
agon
River
0
4
0:100
1-‐4
1-‐3
1
Lake M
ichigan Ba
sin
0403010101
East Twin River-‐Frontal Lake Michigan
70
7
0:100
Yes
78
510
108
50403010102
West T
win River
73
8
3:97
Yes
1010
59
97
60403010103
North Branch Manito
woc River
73
7
7:93
Yes
1010
1010
109
10403010104
South Branch M
anito
woc River
70
7
7:93
Yes
99
109
99
100403010105
Branch River
75
6
2:98
Yes
910
69
910
80403010106
Manito
woc River-‐Frontal Lake Michigan
62
12
5:95
Yes
Yes
78
98
99
90403010107
Sevenm
ile & Silver Crs-‐Frontal L M
ich
75
10
1:99
Yes
99
910
108
10403010108
Pigeon
River
71
11
4:96
1010
810
1010
10403010109
Mullet R
iver
56
10
32:68
Yes
67
810
109
10403010110
Onion
River
76
7
21:79
Yes
Yes
68
910
104
10403010111
Sheb
oygan River-‐Fron
tal Lake Michigan
60
11
12:88
Yes
Yes
77
88
85
60403010112
Black R, Sauk & Sucker C
rs-‐Frl L. M
ich
67
17
10:90
88
1010
107
10403010201
Upp
er Doo
r Pen
insula
41
9
3:97
Yes
56
14
79
70403010202
Ahnape
e River a
nd Stony Creek
70
6
2:98
Yes
89
77
87
50403010203
Kewaune
e River
78
6
1:99
Yes
1010
410
108
40403010204
Red River a
nd Sturgeo
n Ba
y60
8
0:100
Yes
89
77
810
30403010301
Pensaukee River-‐Fron
tal G
reen
Bay
51
6
1:99
78
77
84
10403010302
Suam
ico & L. Suamico Rs-‐F Green
Bay
60
8
0:100
57
97
86
10403010401
South Branch Oconto River
9
4
0:100
Yes
24
23
51
50403010402
North Branch Oconto River
5
4
7:93
Yes
24
32
43
4
TP Con
c De
cile
(Mon
it'd)
% Agr
%
Urban
PR
ESTO
PS
NPS Ratio
Contains
Nutrie
nt/Se
dimen
t Im
paire
d Water
With
in
Appr'd
TMDL
Contains
ORW
/ ER
W
Water
TP Yield Decile
(SPA
RROW
Mod
el) (1)
TN Yield Decile
(SPA
RROW
Mod
el) (1)
Safe
Drinking
Water
Nutrie
nt
Impa
cts
HUC 10
NAM
EHU
C 10
CODE
A-4

TN Con
c De
cile
(Mon
it'd)
Incr.
Del'd
Incr.
Del'd
TP Con
c De
cile
(Mon
it'd)
% Agr
%
Urban
PR
ESTO
PS
NPS Ratio
Contains
Nutrie
nt/Se
dimen
t Im
paire
d Water
With
in
Appr'd
TMDL
Contains
ORW
/ ER
W
Water
TP Yield Decile
(SPA
RROW
Mod
el) (1)
TN Yield Decile
(SPA
RROW
Mod
el) (1)
Safe
Drinking
Water
Nutrie
nt
Impa
cts
HUC 10
NAM
EHU
C 10
CODE
0403010403
Peshtig
o Broo
k7
4
0:100
24
32
55
20403010404
Little River
55
5
1:99
78
76
74
10403010405
Oconto River
38
8
21:79
Yes
56
45
75
40403010501
Rat R
iver
3
3
6:94
Yes
23
32
21
10403010502
Upp
er Peshtigo River
5
3
0:100
Yes
23
32
31
10403010503
Middle Inlet-‐Lake Noq
uebay
14
5
0:100
Yes
12
13
32
30403010504
Middle Pe
shtig
o River
4
4
11:89
Yes
24
21
23
60403010505
Little Peshtigo River
42
5
5:95
Yes
46
65
75
70403010506
Lower Peshtigo River
31
8
7:93
46
64
67
20403010601
North Branch Paint R
iver
-‐
-‐
0:100
nana
nana
13
10403010603
Iron River-‐Brule River
1
3
0:100
Yes
34
21
12
10403010605
Brule River
7
3
0:100
Yes
13
22
32
10403010801
Popp
le River
2
2
0:100
Yes
13
21
22
10403010802
Pine
River
2
2
0:100
Yes
23
11
22
20403010805
Pemeb
onwon
River
4
4
0:100
Yes
12
11
31
80403010806
Pike River
3
4
0:100
Yes
13
12
31
10403010807
Squaw Creek-‐M
enom
inee River
9
5
48:52
Yes
45
32
32
40403010809
Men
ominee River
13
6
33:67
Yes
24
33
51
30403020101
Swan Lake-‐Fox River
63
6
0:100
54
17
410
90403020102
Neenah Creek
49
5
10:90
Yes
Yes
42
46
45
70403020103
Mon
tello River
42
6
13:87
Yes
31
74
27
90403020104
Upp
er Grand
River
81
6
33:67
96
99
610
70403020105
Lower Grand
River
62
4
0:100
55
76
510
90403020106
Buffa
lo and
Puckaway Lakes-‐Fox River
42
6
6:94
Yes
42
65
35
80403020107
Mecan River
38
5
0:100
Yes
31
24
38
40403020108
White River
37
7
13:87
Yes
32
34
47
80403020109
Big Green Lake
63
8
12:88
Yes
Yes
71
45
110
60403020110
Rush Creek
67
4
0:100
76
89
78
70403020111
City of B
erlin-‐Fox River
54
5
20:80
Yes
Yes
55
47
65
50403020112
Lake Butte des M
ortes
56
19
57:43
Yes
86
108
67
20403020201
Swam
p Creek
4
4
0:100
Yes
11
31
12
50403020202
Lily River
5
4
0:100
Yes
11
22
11
60403020203
Evergreen River-‐Wolf R
iver
7
4
0:100
Yes
21
32
13
50403020204
West B
ranch of th
e Wolf R
iver
9
4
0:100
Yes
31
23
13
30403020205
Red River
24
4
6:94
Yes
32
24
23
80403020206
Shaw
ano Lake
29
9
0:100
Yes
43
63
23
30403020207
Legend
Lake-‐Wolf R
iver
6
5
0:100
Yes
32
43
24
0403020208
Shioc River
65
6
4:96
Yes
86
108
68
20403020209
Scho
ol Sectio
n Creek-‐Wolf R
iver
38
6
28:72
Yes
65
56
59
20403020210
Middle & Sou
th Branche
s Embarrass R
32
6
6:94
Yes
54
54
34
80403020211
Pigeon
River
47
7
20:80
Yes
65
86
54
90403020212
North Branch & M
ainstem Embarrass R
38
5
11:89
Yes
54
55
45
90403020213
Bear Creek-‐Embarrass R
iver
62
5
2:98
Yes
Yes
96
98
66
50403020214
Bear Creek-‐W
olf R
iver
59
10
16:84
Yes
107
98
69
10403020215
Flum
e Creek-‐Little W
olf R
iver
32
4
0:100
Yes
32
43
26
90403020216
South Branch of the
Little W
olf R
iver
41
5
12:88
Yes
43
45
48
50403020217
Blake Creek-‐Little W
olf R
iver
50
5
1:99
Yes
65
46
56
7
A-5

TN Con
c De
cile
(Mon
it'd)
Incr.
Del'd
Incr.
Del'd
TP Con
c De
cile
(Mon
it'd)
% Agr
%
Urban
PR
ESTO
PS
NPS Ratio
Contains
Nutrie
nt/Se
dimen
t Im
paire
d Water
With
in
Appr'd
TMDL
Contains
ORW
/ ER
W
Water
TP Yield Decile
(SPA
RROW
Mod
el) (1)
TN Yield Decile
(SPA
RROW
Mod
el) (1)
Safe
Drinking
Water
Nutrie
nt
Impa
cts
HUC 10
NAM
EHU
C 10
CODE
0403020218
Waupaca River
51
7
21:79
Yes
43
55
46
100403020219
Partrid
ge Lake-‐Wolf R
iver
47
6
16:84
Yes
65
66
48
50403020220
Willow
Creek-‐Pine Rver
44
5
14:86
Yes
Yes
Yes
42
55
44
60403020221
Lake Poygan
57
6
6:94
Yes
55
97
58
80403020301
West S
hore of Lake Winne
bago
65
23
0:100
Yes
97
75
51
20403020302
Fond
du Lac River
65
10
8:92
Yes
Yes
Yes
97
109
710
30403020303
East Sho
re of Lake Winne
bago
65
17
4:96
Yes
87
97
710
70403020304
Lake W
inne
bago (2
)0
0
naYes
nana
nana
1na
10403020401
Duck Creek-‐Frontal Green
Bay
60
16
2:98
Yes
Yes
109
88
84
10403020402
Plum
Creek-‐Fox River
43
40
70:30
Yes
Yes
1010
108
96
10403020403
East River
65
20
3:97
Yes
Yes
1010
109
95
10403020404
Fox River-‐Fron
tal G
reen
Bay
55
30
53:47
Yes
Yes
1010
109
96
10404000201
Oak Creek-‐Frontal Lake Michigan
10
61
89:11
Yes
78
54
73
10404000202
Root River Canal
78
8
11:89
Yes
89
810
102
10404000203
Root River
35
42
7:93
Yes
89
83
62
10404000204
Pike River-‐Frontal Lake Michigan
32
47
43:57
Yes
89
78
97
10404000205
Waukegan River-‐Fron
tal Lake Michigan
26
32
0:100
nana
nana
1na
10404000301
North Branch Milw
aukee River
65
6
13:86
Yes
Yes
67
79
99
20404000302
East & W
est B
rs M
ilwaukee R-‐Milw
R52
10
23:77
Yes
67
56
87
80404000303
Cedar C
reek
55
14
31:69
68
67
86
70404000304
Men
omon
ee River
18
61
66:34
Yes
99
63
69
50404000305
Kinn
ickinn
ic River
-‐
83
31:69
Yes
910
64
73
10404000306
Milw
aukee River-‐Fron
tal Lake Michigan
29
45
29:71
Yes
78
86
86
2
Mississippi River Basin
0703000101
Upp
er St. Croix-‐Eau Claire Rivers
16
0:100
Yes
Yes
11
11
11
10703000102
Moo
se River-‐Saint Croix River
13
0:100
Yes
Yes
22
22
23
10703000103
Upp
er Tam
arack River
12
0:100
Yes
Yes
33
22
21
10703000104
Shell Lake-‐Yellow River
247
1:99
Yes
Yes
22
42
23
10703000105
Yellow Lake-‐Yellow River
76
0:100
Yes
Yes
Yes
21
22
21
50703000106
Lower Tam
arack River
01
0:100
Yes
22
22
21
10703000108
North Fork of th
e Clam
River
284
0:100
Yes
Yes
33
51
11
20703000109
Clam
River
185
2:98
Yes
Yes
33
43
31
10703000112
Chases Brook-‐Saint Croix River
44
0:100
Yes
Yes
22
32
23
10703000201
Upp
er Nam
ekagon
River
45
0:100
Yes
Yes
11
12
21
30703000202
Trego Lake-‐Nam
ekagon
River
96
0:100
Yes
Yes
22
12
21
20703000203
Totagatic River
24
0:100
Yes
Yes
11
21
11
10703000204
Nam
ekagon
River
55
0:100
Yes
Yes
11
12
21
10703000501
Woo
d River
285
13:87
Yes
22
43
31
3
Phosph
orus con
centratio
ns less th
an th
e water quality standards c
riterion of 0.075
mg/L (75 ug/L) are in italics
"na" is used whe
n the HU
C 10
has less th
an a fe
w sq
uare m
iles o
f land in W
iscon
sin
(1) The SPAR
ROW increm
ental yield sh
ould be used
whe
n considereing nutrie
nt con
tributions to
nearby waters. The
SPA
RROW delivered
yield sh
ould be used
whe
n considering nu
trient con
tributions to
Lake Michigan
(2) The Lake W
inne
bago HUC 10
only consists o
f the
lake itself.
A-6
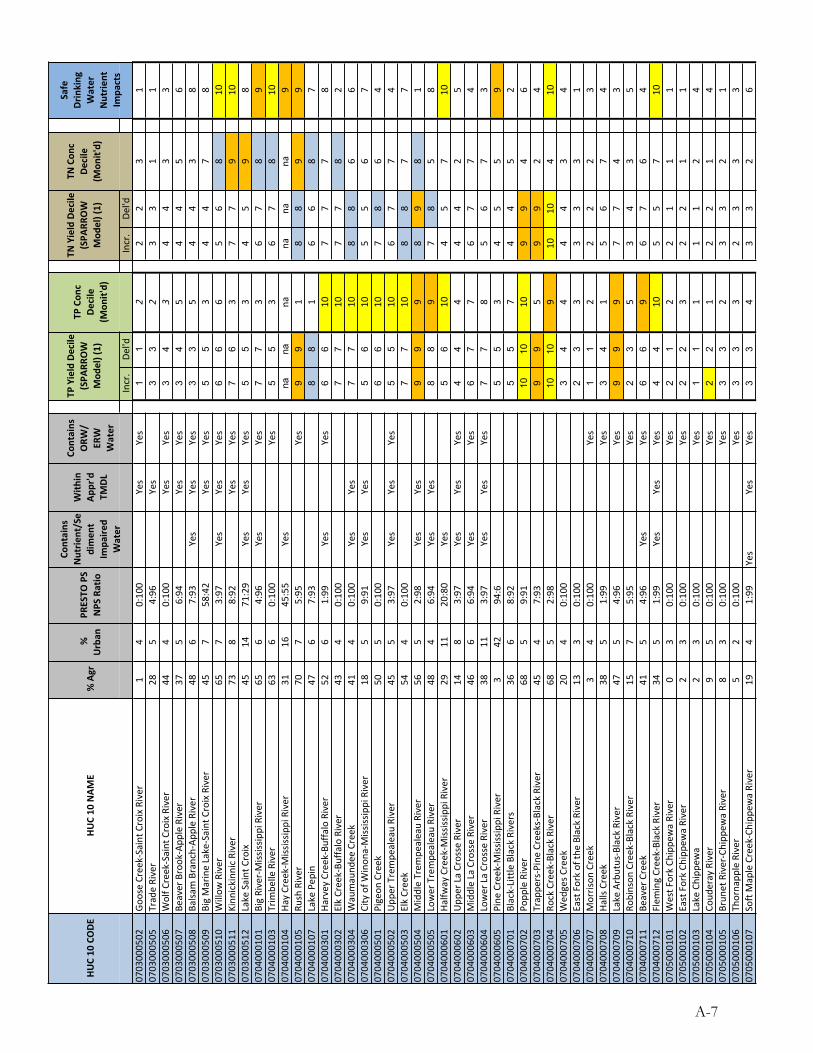
TN Con
c De
cile
(Mon
it'd)
Incr.
Del'd
Incr.
Del'd
TP Con
c De
cile
(Mon
it'd)
% Agr
%
Urban
PR
ESTO
PS
NPS Ratio
Contains
Nutrie
nt/Se
dimen
t Im
paire
d Water
With
in
Appr'd
TMDL
Contains
ORW
/ ER
W
Water
TP Yield Decile
(SPA
RROW
Mod
el) (1)
TN Yield Decile
(SPA
RROW
Mod
el) (1)
Safe
Drinking
Water
Nutrie
nt
Impa
cts
HUC 10
NAM
EHU
C 10
CODE
0703000502
Goose Creek-‐Saint C
roix River
14
0:100
Yes
Yes
11
22
23
10703000505
Trade River
285
4:96
Yes
33
23
31
10703000506
Wolf C
reek-‐Saint Croix River
444
0:100
Yes
Yes
34
34
43
30703000507
Beaver Brook-‐App
le River
375
6:94
Yes
Yes
34
54
45
60703000508
Balsa
m Branch-‐Ap
ple River
486
7:93
Yes
Yes
Yes
33
54
43
80703000509
Big Marine Lake-‐Saint Croix River
457
58:42
Yes
Yes
55
34
47
80703000510
Willow
River
657
3:97
Yes
Yes
Yes
66
65
68
100703000511
Kinn
ickinn
ic River
738
8:92
Yes
Yes
76
37
79
100703000512
Lake Saint Croix
4514
71:29
Yes
Yes
Yes
55
34
59
80704000101
Big River-‐Mississippi River
656
4:96
Yes
Yes
77
36
78
90704000103
Trim
belle River
636
0:100
Yes
55
36
78
100704000104
Hay Creek-‐Mississippi River
3116
45:55
Yes
nana
nana
nana
90704000105
Rush River
707
5:95
Yes
99
18
89
90704000107
Lake Pep
in47
67:93
88
16
68
70704000301
Harvey Creek-‐Buffalo River
526
1:99
Yes
Yes
66
107
77
80704000302
Elk Creek-‐Bu
ffalo River
434
0:100
77
107
78
20704000304
Waumaund
ee Creek
414
0:100
Yes
Yes
77
108
86
60704000306
City of W
inon
a-‐Mississippi River
185
9:91
Yes
Yes
56
105
56
70704000501
Pigeon
Creek
505
0:100
66
107
86
40704000502
Upp
er Trempe
aleau River
455
3:97
Yes
Yes
Yes
55
106
77
40704000503
Elk Creek
544
0:100
77
108
87
70704000504
Middle Trem
pealeau River
565
2:98
Yes
Yes
99
98
98
10704000505
Lower Trempe
aleau River
484
6:94
Yes
Yes
88
97
85
80704000601
Halfw
ay Creek-‐M
ississippi River
2911
20:80
Yes
56
104
57
100704000602
Upp
er La Crosse River
148
3:97
Yes
Yes
Yes
44
44
42
50704000603
Middle La Crosse River
466
6:94
Yes
Yes
67
76
77
40704000604
Lower La Crosse River
3811
3:97
Yes
Yes
Yes
77
85
67
30704000605
Pine
Creek-‐M
ississippi River
342
94:6
55
34
55
90704000701
Black-‐Little Black Rivers
366
8:92
55
74
45
20704000702
Popp
le River
685
9:91
1010
109
94
60704000703
Trappe
rs-‐Pine Creeks-‐Black River
454
7:93
99
59
92
40704000704
Rock Creek-‐Black River
685
2:98
1010
910
104
100704000705
Wed
ges C
reek
204
0:100
34
44
43
40704000706
East Fork of th
e Black River
133
0:100
23
33
33
10704000707
Morrison
Creek
34
0:100
Yes
11
22
22
30704000708
Halls Creek
385
1:99
Yes
34
15
67
40704000709
Lake Arbutus-‐Black River
475
4:96
Yes
99
97
74
30704000710
Robinson
Creek-‐Black River
157
5:95
Yes
23
53
43
50704000711
Beaver Creek
415
4:96
Yes
Yes
66
96
76
40704000712
Flem
ing Creek-‐Black River
345
1:99
Yes
Yes
Yes
44
105
57
100705000101
West F
ork Ch
ippe
wa River
03
0:100
Yes
21
22
11
10705000102
East Fork Ch
ippe
wa River
23
0:100
Yes
22
32
21
10705000103
Lake Chipp
ewa
23
0:100
Yes
11
11
12
40705000104
Coud
eray River
95
0:100
Yes
22
12
21
40705000105
Brun
et River-‐Chipp
ewa River
83
0:100
Yes
33
23
32
10705000106
Thornapp
le River
52
0:100
Yes
33
32
33
30705000107
Soft M
aple Creek-‐Chipp
ewa River
194
1:99
Yes
Yes
Yes
33
43
32
6
A-7
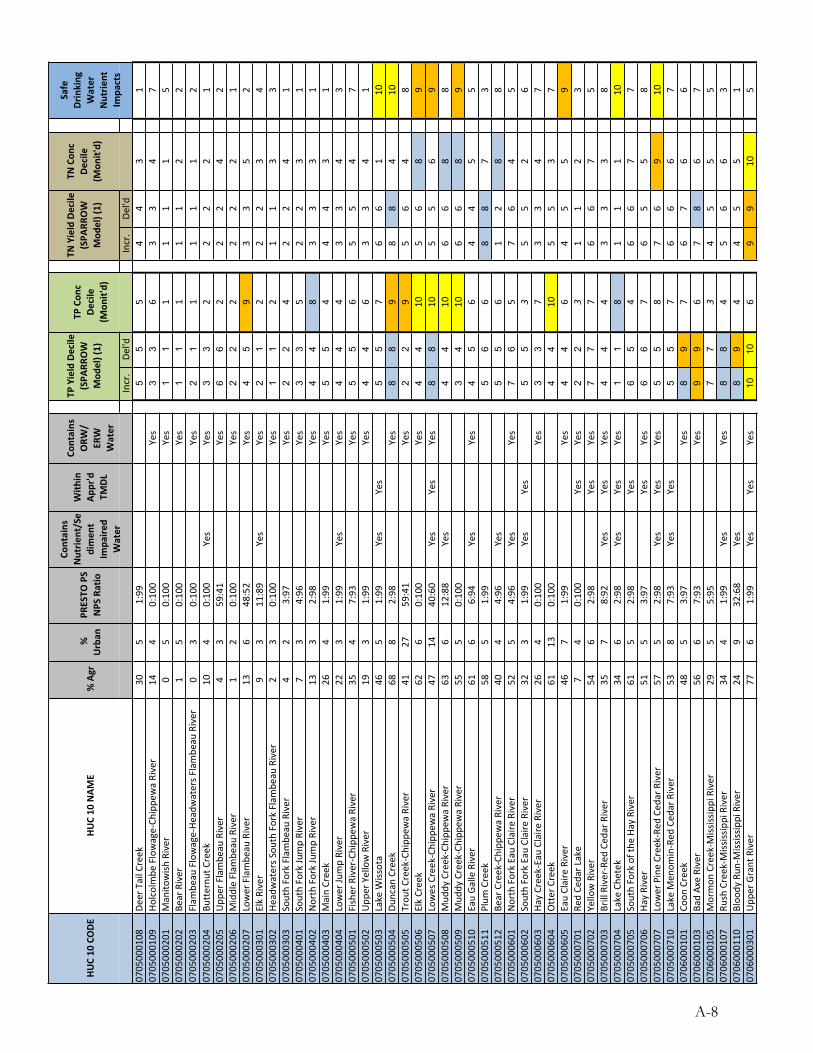
TN Con
c De
cile
(Mon
it'd)
Incr.
Del'd
Incr.
Del'd
TP Con
c De
cile
(Mon
it'd)
% Agr
%
Urban
PR
ESTO
PS
NPS Ratio
Contains
Nutrie
nt/Se
dimen
t Im
paire
d Water
With
in
Appr'd
TMDL
Contains
ORW
/ ER
W
Water
TP Yield Decile
(SPA
RROW
Mod
el) (1)
TN Yield Decile
(SPA
RROW
Mod
el) (1)
Safe
Drinking
Water
Nutrie
nt
Impa
cts
HUC 10
NAM
EHU
C 10
CODE
0705000108
Deer Tail Creek
305
1:99
55
54
43
10705000109
Holcolmbe
Flowage-‐Ch
ippe
wa River
144
0:100
Yes
33
63
34
70705000201
Manito
wish
River
05
0:100
Yes
11
11
11
50705000202
Bear River
15
0:100
Yes
11
11
12
20705000203
Flam
beau Flowage-‐He
adwaters F
lambe
au River
03
0:100
Yes
21
11
11
20705000204
Butternu
t Creek
104
0:100
Yes
Yes
33
22
22
10705000205
Upp
er Flambe
au River
43
59:41
Yes
66
22
24
20705000206
Middle Flam
beau River
12
0:100
Yes
22
22
22
10705000207
Lower Flambe
au River
136
48:52
Yes
45
93
35
20705000301
Elk River
93
11:89
Yes
Yes
21
22
23
40705000302
Headwaters S
outh Fork Flam
beau River
23
0:100
Yes
11
21
13
30705000303
South Fork Flambe
au River
42
3:97
Yes
22
42
24
10705000401
South Fork Ju
mp River
73
4:96
Yes
33
52
23
10705000402
North Fork Jump River
133
2:98
Yes
44
83
33
10705000403
Main Creek
264
1:99
Yes
55
44
43
10705000404
Lower Ju
mp River
223
1:99
Yes
Yes
44
43
34
30705000501
Fisher River-‐Chipp
ewa River
354
7:93
Yes
55
65
54
70705000502
Upp
er Yellow River
193
1:99
Yes
44
63
34
10705000503
Lake W
issota
465
1:99
Yes
Yes
55
76
61
100705000504
Duncan Creek
688
2:98
Yes
88
98
84
100705000505
Trou
t Creek-‐Chipp
ewa River
4127
59:41
Yes
22
95
64
80705000506
Elk Creek
626
0:100
Yes
44
105
68
90705000507
Lowes Creek-‐Chipp
ewa River
4714
40:60
Yes
Yes
Yes
88
105
56
90705000508
Mud
dy Creek-‐Chipp
ewa River
636
12:88
Yes
44
106
68
80705000509
Mud
dy Creek-‐Chipp
ewa River
555
0:100
34
106
68
90705000510
Eau Ga
lle River
616
6:94
Yes
Yes
45
64
45
50705000511
Plum
Creek
585
1:99
56
68
87
30705000512
Bear Creek-‐Chipp
ewa River
404
4:96
Yes
55
61
28
80705000601
North Fork Eau Claire River
525
4:96
Yes
Yes
76
57
64
50705000602
South Fork Eau Claire
River
323
1:99
Yes
Yes
55
35
52
60705000603
Hay Creek-‐Eau Claire River
264
0:100
Yes
33
73
34
70705000604
Otter Creek
6113
0:100
44
105
53
70705000605
Eau Claire River
467
1:99
Yes
44
64
55
90705000701
Red Ce
dar Lake
74
0:100
Yes
Yes
22
31
12
30705000702
Yellow River
546
2:98
Yes
Yes
77
76
67
50705000703
Brill River-‐Red
Ced
ar River
357
8:92
Yes
Yes
Yes
44
43
33
80705000704
Lake Che
tek
346
2:98
Yes
Yes
Yes
11
81
11
100705000705
South Fork of the
Hay River
615
2:98
Yes
65
46
67
70705000706
Hay River
515
3:97
Yes
Yes
66
76
55
80705000707
Lower Pine Creek-‐Re
d Ce
dar R
iver
575
2:98
Yes
Yes
Yes
55
87
69
100705000710
Lake M
enom
in-‐Red
Ced
ar River
538
7:93
Yes
Yes
55
76
66
70706000101
Coon
Creek
485
3:97
Yes
89
76
76
60706000103
Bad Axe River
566
7:93
Yes
99
67
86
70706000105
Mormon
Creek-‐M
ississippi River
295
5:95
77
34
55
50706000107
Rush Creek-‐M
ississippi River
344
1:99
Yes
Yes
88
45
66
30706000110
Bloo
dy Run
-‐Mississippi River
249
32:68
Yes
89
44
55
10706000301
Upp
er Grant River
776
1:99
Yes
Yes
Yes
1010
69
910
5
A-8

TN Con
c De
cile
(Mon
it'd)
Incr.
Del'd
Incr.
Del'd
TP Con
c De
cile
(Mon
it'd)
% Agr
%
Urban
PR
ESTO
PS
NPS Ratio
Contains
Nutrie
nt/Se
dimen
t Im
paire
d Water
With
in
Appr'd
TMDL
Contains
ORW
/ ER
W
Water
TP Yield Decile
(SPA
RROW
Mod
el) (1)
TN Yield Decile
(SPA
RROW
Mod
el) (1)
Safe
Drinking
Water
Nutrie
nt
Impa
cts
HUC 10
NAM
EHU
C 10
CODE
0706000302
Middle Grant R
iver
817
3:97
1010
710
109
30706000303
Lower Grant River
775
0:100
1010
810
1010
50706000304
Little Platte River
827
2:98
Yes
Yes
Yes
1010
810
1010
80706000305
Platte River
765
1:99
Yes
Yes
Yes
1010
610
109
30706000307
Sny Magill Creek-‐M
ississippi River
385
6:94
Yes
1010
57
88
40706000502
Sinsinaw
a River-‐Mississippi River
857
1:99
Yes
1010
410
1010
70706000503
Galena River
876
6:94
Yes
Yes
1010
410
1010
20706000505
South Fork App
le River-‐App
le River
934
0:100
1010
410
1010
10707000101
Deerskin River
24
11:89
Yes
11
21
11
10707000102
Eagle River
25
14:86
Yes
11
11
12
50707000103
Pion
eer C
reek-‐W
iscon
sin River
25
0:100
Yes
11
21
12
20707000104
Rainbo
w Flow-‐M
ud Creek-‐W
iscon
sin R
44
0:100
Yes
11
31
12
70707000105
Gillm
ore Creek-‐Big St. G
ermain River
06
0:100
Yes
11
21
12
80707000106
Rhinelande
r Flowage-‐Upp
er W
iscon
sin R
45
8:92
Yes
11
11
12
50707000107
Pelican River
44
0:100
Yes
21
31
11
50707000108
Upp
er Tom
ahaw
k River
26
8:92
Yes
11
31
12
50707000109
Middle To
mahaw
k River
22
0:100
Yes
11
21
12
30707000110
Lower Tom
ahaw
k River
24
0:100
Yes
11
11
11
60707000111
Somo River
23
0:100
Yes
22
21
12
20707000112
Spirit R
iver
53
0:100
Yes
Yes
32
52
11
20707000113
Lake M
ohaw
ksin-‐Lake Alice-‐Wisc
onsin
R5
686:14
Yes
21
22
12
20707000201
New
Woo
d River
12
0:100
Yes
32
21
12
0707000202
Copp
er River
122
0:100
Yes
33
53
23
0707000203
Prairie
River
115
4:96
Yes
22
32
22
30707000204
Alexande
r Lake-‐Wisc
onsin
River
155
0:100
Yes
33
43
24
50707000205
Pine
River
243
0:100
Yes
33
33
34
10707000206
Trappe
River
304
0:100
Yes
65
34
44
10707000207
Black Creek
595
7:93
Yes
99
37
56
40707000208
Woo
d Creek-‐Big Rib River
224
1:99
Yes
54
46
52
30707000209
Little Rib River
556
0:100
65
26
56
90707000210
Scotch Creek-‐Big Rib River
609
10:90
87
68
65
80707000211
Sprin
g Broo
k46
630:70
Yes
Yes
43
78
69
100707000212
Black Broo
k-‐Eau Claire River
245
0:100
Yes
32
33
36
90707000213
Big Sand
y Creek-‐Eau Claire River
407
0:100
Yes
54
35
44
90707000214
Eau Claire Flowage-‐Wisc
onsin
River
3518
62:38
Yes
109
45
44
60707000215
Dill Creek-‐Big Eau Pleine
River
726
7:93
Yes
Yes
109
109
85
90707000216
Lake Dub
ay-‐Big Eau Pleine River
565
1:99
Yes
97
88
53
70707000217
Little Eau Pleine River
586
6:94
87
108
65
90707000218
Lake Dub
ay-‐W
iscon
sin River
267
56:44
Yes
76
44
35
60707000301
Plover River
348
0:100
Yes
44
14
47
100707000302
Mill Creek
668
32:68
Yes
88
99
81
20707000303
City of Stevens Point-‐W
iscon
sin River
3611
75:25
Yes
76
95
41
90707000304
Fourmile Creek
5910
0:100
Yes
44
15
510
100707000305
Tenm
ile Creek
635
0:100
Yes
32
15
55
100707000306
Fourteen
mile Creek
469
0:100
22
14
43
60707000307
Petenw
ell Lake
199
88:12
Yes
Yes
87
43
33
60707000308
Big Ro
che a Cri Creek
356
0:100
Yes
22
14
57
6
A-9
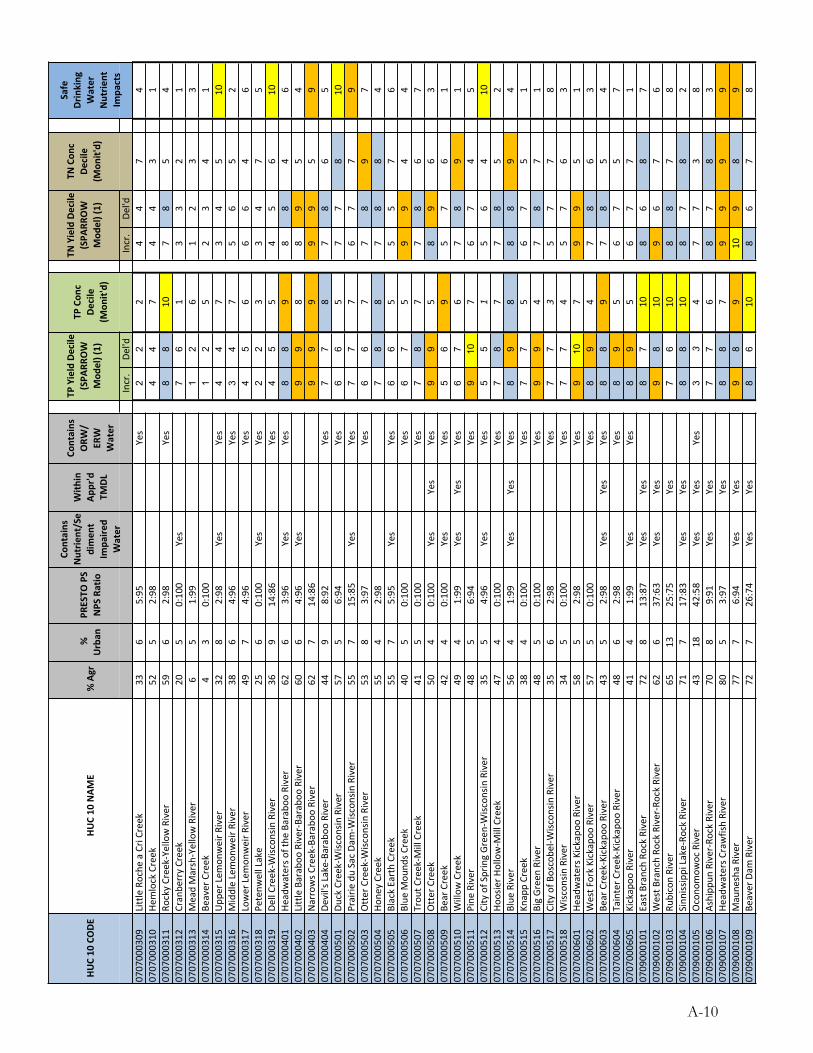
TN Con
c De
cile
(Mon
it'd)
Incr.
Del'd
Incr.
Del'd
TP Con
c De
cile
(Mon
it'd)
% Agr
%
Urban
PR
ESTO
PS
NPS Ratio
Contains
Nutrie
nt/Se
dimen
t Im
paire
d Water
With
in
Appr'd
TMDL
Contains
ORW
/ ER
W
Water
TP Yield Decile
(SPA
RROW
Mod
el) (1)
TN Yield Decile
(SPA
RROW
Mod
el) (1)
Safe
Drinking
Water
Nutrie
nt
Impa
cts
HUC 10
NAM
EHU
C 10
CODE
0707000309
Little Roche
a Cri Creek
336
5:95
Yes
22
24
47
40707000310
Hemlock Creek
525
2:98
44
74
43
10707000311
Rocky Creek-‐Yellow River
596
2:98
Yes
88
107
85
40707000312
Cranbe
rry Creek
205
0:100
Yes
76
13
32
10707000313
Mead Marsh-‐Yellow River
65
1:99
12
61
23
30707000314
Beaver Creek
43
0:100
12
52
34
10707000315
Upp
er Lem
onweir R
iver
328
2:98
Yes
Yes
44
73
45
100707000316
Middle Lemon
weir R
iver
386
4:96
Yes
34
75
65
20707000317
Lower Lem
onweir R
iver
497
4:96
Yes
45
66
64
60707000318
Petenw
ell Lake
256
0:100
Yes
Yes
22
33
47
50707000319
Dell Creek-‐Wisc
onsin
River
369
14:86
Yes
45
54
56
100707000401
Headwaters o
f the
Baraboo
River
626
3:96
Yes
Yes
88
98
84
60707000402
Little Baraboo
River-‐Baraboo
River
606
4:96
Yes
99
88
95
40707000403
Narrows C
reek-‐Baraboo
River
627
14:86
99
99
95
90707000404
Devil's Lake-‐Ba
rabo
o River
449
8:92
Yes
77
87
86
50707000501
Duck Creek-‐W
iscon
sin River
575
6:94
Yes
66
57
78
100707000502
Prairie
du Sac Da
m-‐W
iscon
sin River
557
15:85
Yes
Yes
77
76
77
90707000503
Otter Creek-‐W
iscon
sin River
538
3:97
Yes
66
77
89
70707000504
Hone
y Creek
554
2:98
78
87
88
40707000505
Black Earth Creek
557
5:95
Yes
Yes
66
55
57
60707000506
Blue
Mou
nds C
reek
405
0:100
Yes
67
59
94
40707000507
Trou
t Creek-‐M
ill Creek
415
0:100
Yes
78
77
86
70707000508
Otter Creek
504
0:100
Yes
Yes
Yes
99
58
96
30707000509
Bear Creek
424
0:100
Yes
Yes
56
95
76
10707000510
Willow
Creek
494
1:99
Yes
Yes
Yes
67
67
89
10707000511
Pine
River
485
6:94
Yes
910
76
74
50707000512
City of Spring Green-‐Wisc
onsin
River
355
4:96
Yes
Yes
55
15
64
100707000513
Hoosier H
ollow-‐M
ill Creek
474
0:100
Yes
78
77
85
20707000514
Blue
River
564
1:99
Yes
Yes
Yes
89
88
89
40707000515
Knapp Creek
384
0:100
Yes
77
56
75
10707000516
Big Green River
485
0:100
Yes
99
47
87
10707000517
City of B
oscobe
l-‐Wisc
onsin
River
356
2:98
Yes
77
35
77
80707000518
Wisc
onsin
River
345
0:100
Yes
77
45
76
30707000601
Headwaters K
ickapo
o River
585
2:98
Yes
910
79
95
10707000602
West F
ork Kickapoo
River
575
0:100
Yes
89
47
86
30707000603
Bear Creek-‐Kickapo
o River
435
2:98
Yes
Yes
Yes
88
97
85
40707000604
Tainter C
reek-‐Kickapo
o River
486
2:98
Yes
89
56
75
70707000605
Kickapoo
River
414
1:99
Yes
Yes
89
56
77
10709000101
East Branch Ro
ck River
728
13:87
Yes
Yes
87
108
68
70709000102
West B
ranch Ro
ck River-‐Rock River
626
37:63
Yes
Yes
98
109
67
60709000103
Rubicon River
6513
25:75
Yes
76
108
87
80709000104
Sinn
issippi Lake-‐Ro
ck River
717
17:83
Yes
Yes
88
108
78
20709000105
Ocono
mow
oc River
4318
42:58
Yes
Yes
Yes
33
47
73
80709000106
Ashipp
un River-‐Rock River
708
9:91
Yes
Yes
77
68
78
30709000107
Headwaters C
rawfish River
805
3:97
Yes
88
79
99
90709000108
Maune
sha River
777
6:94
Yes
Yes
98
910
98
90709000109
Beaver Dam
River
727
26:74
Yes
Yes
86
108
67
8
A-10
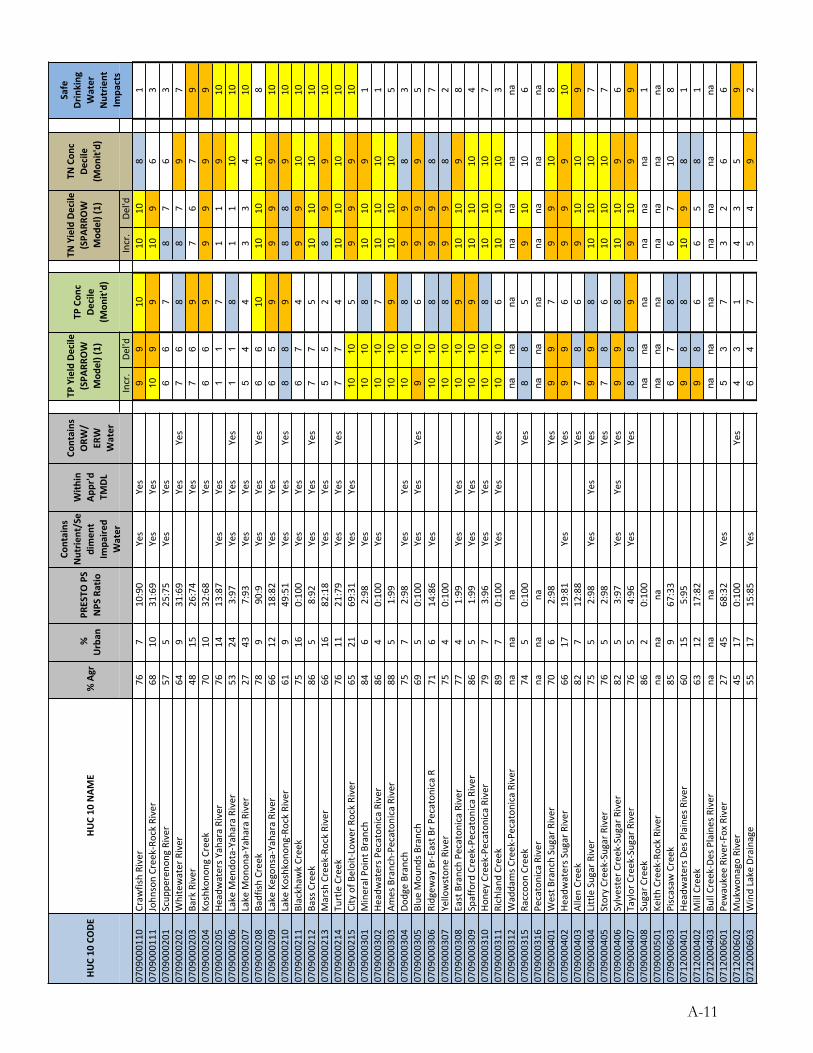
TN Con
c De
cile
(Mon
it'd)
Incr.
Del'd
Incr.
Del'd
TP Con
c De
cile
(Mon
it'd)
% Agr
%
Urban
PR
ESTO
PS
NPS Ratio
Contains
Nutrie
nt/Se
dimen
t Im
paire
d Water
With
in
Appr'd
TMDL
Contains
ORW
/ ER
W
Water
TP Yield Decile
(SPA
RROW
Mod
el) (1)
TN Yield Decile
(SPA
RROW
Mod
el) (1)
Safe
Drinking
Water
Nutrie
nt
Impa
cts
HUC 10
NAM
EHU
C 10
CODE
0709000110
Craw
fish River
767
10:90
Yes
Yes
99
1010
108
10709000111
John
son Creek-‐Ro
ck River
6810
31:69
Yes
Yes
109
910
96
30709000201
Scup
pereno
ng River
575
25:75
Yes
Yes
66
78
76
30709000202
Whitewater River
649
31:69
Yes
Yes
76
88
79
70709000203
Bark River
4815
26:74
Yes
76
97
67
90709000204
Koshkono
ng Creek
7010
32:68
Yes
66
99
99
90709000205
Headwaters Y
ahara River
7614
13:87
Yes
Yes
11
71
19
100709000206
Lake M
endo
ta-‐Yahara River
5324
3:97
Yes
Yes
Yes
11
81
110
100709000207
Lake M
onon
a-‐Yahara River
2743
7:93
Yes
Yes
54
43
34
100709000208
Badfish
Creek
789
90:9
Yes
Yes
Yes
66
1010
1010
80709000209
Lake Kegon
sa-‐Yahara River
6612
18:82
Yes
Yes
65
99
99
100709000210
Lake Koshkon
ong-‐Ro
ck River
619
49:51
Yes
Yes
Yes
88
98
89
100709000211
Blackhaw
k Creek
7516
0:100
Yes
Yes
67
49
910
100709000212
Bass Creek
865
8:92
Yes
Yes
Yes
77
510
1010
100709000213
Marsh Creek-‐Rock River
6616
82:18
Yes
Yes
55
28
99
100709000214
Turtle Creek
7611
21:79
Yes
Yes
Yes
77
410
1010
100709000215
City of B
eloit-‐Lower Rock River
6521
69:31
Yes
Yes
1010
59
99
100709000301
Mineral Point Branch
846
2:98
Yes
1010
810
109
10709000302
Headwaters P
ecaton
ica River
864
0:100
Yes
1010
710
1010
10709000303
Ames Branch-‐Pe
catonica River
885
1:99
1010
910
1010
50709000304
Dodge Branch
757
2:98
Yes
Yes
1010
89
98
30709000305
Blue
Mou
nds B
ranch
695
0:100
Yes
Yes
Yes
910
69
99
50709000306
Ridgew
ay Br-‐East Br P
ecaton
ica R
716
14:86
Yes
1010
89
98
70709000307
Yellowston
e River
754
0:100
1010
89
98
20709000308
East Branch Pe
catonica River
774
1:99
Yes
Yes
1010
910
109
80709000309
Spafford Creek-‐Pecaton
ica River
865
1:99
Yes
Yes
1010
910
1010
40709000310
Hone
y Creek-‐Pe
catonica River
797
3:96
Yes
Yes
1010
810
1010
70709000311
Richland
Creek
897
0:100
Yes
Yes
Yes
1010
610
1010
30709000312
Waddams C
reek-‐Pecaton
ica River
nana
nana
nana
nana
nana
0709000315
Raccoo
n Creek
745
0:100
Yes
88
59
1010
60709000316
Pecatonica River
nana
nana
nana
nana
nana
0709000401
West B
ranch Sugar R
iver
706
2:98
Yes
99
79
910
80709000402
Headwaters S
ugar River
6617
19:81
Yes
Yes
99
69
99
100709000403
Allen Creek
827
12:88
Yes
78
69
1010
90709000404
Little Sugar River
755
2:98
Yes
Yes
Yes
99
810
1010
70709000405
Story Creek-‐Sugar R
iver
765
2:98
Yes
78
610
1010
70709000406
Sylvester C
reek-‐Sugar River
825
3:97
Yes
Yes
Yes
99
810
109
60709000407
Taylor Creek-‐Sugar River
765
4:96
Yes
Yes
88
99
109
90709000408
Sugar C
reek
862
0:100
nana
nana
nana
10709000501
Keith
Creek-‐Rock River
nana
nana
nana
nana
nana
0709000603
Piscasaw
Creek
859
67:33
67
86
710
80712000401
Headwaters D
es Plaines River
6015
5:95
98
810
98
10712000402
Mill Creek
6312
17:82
98
66
58
10712000403
Bull Creek-‐De
s Plaines River
nana
nana
nana
nana
nana
0712000601
Pewaukee River-‐Fox River
2745
68:32
Yes
53
73
26
60712000602
Mukwon
ago River
4517
0:100
Yes
43
14
35
90712000603
Wind Lake Drainage
5517
15:85
Yes
64
75
49
2
A-11
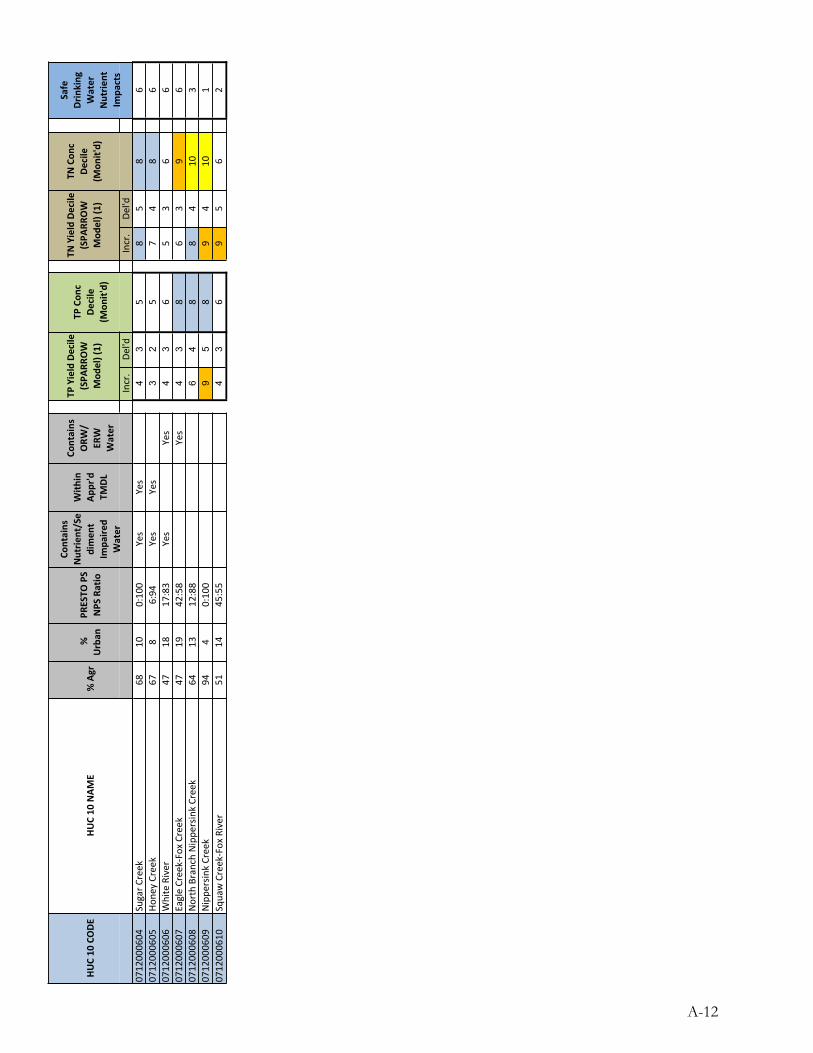
TN Con
c De
cile
(Mon
it'd)
Incr.
Del'd
Incr.
Del'd
TP Con
c De
cile
(Mon
it'd)
% Agr
%
Urban
PR
ESTO
PS
NPS Ratio
Contains
Nutrie
nt/Se
dimen
t Im
paire
d Water
With
in
Appr'd
TMDL
Contains
ORW
/ ER
W
Water
TP Yield Decile
(SPA
RROW
Mod
el) (1)
TN Yield Decile
(SPA
RROW
Mod
el) (1)
Safe
Drinking
Water
Nutrie
nt
Impa
cts
HUC 10
NAM
EHU
C 10
CODE
0712000604
Sugar C
reek
6810
0:100
Yes
Yes
43
58
58
60712000605
Hone
y Creek
678
6:94
Yes
Yes
32
57
48
60712000606
White River
4718
17:83
Yes
Yes
43
65
36
60712000607
Eagle Creek-‐Fox Creek
4719
42:58
Yes
43
86
39
60712000608
North Branch Nippe
rsink Creek
6413
12:88
64
88
410
30712000609
Nippe
rsink Creek
944
0:100
95
89
410
10712000610
Squaw Creek-‐Fox River
5114
45:55
43
69
56
2
A-12

REVIEW DRAFT
Wisconsin’s Nutrient Reduction Strategy B-1
Appendix 2. Wisconsin Watershed Rotation Water Quality Monitoring Data (Pour Point data)
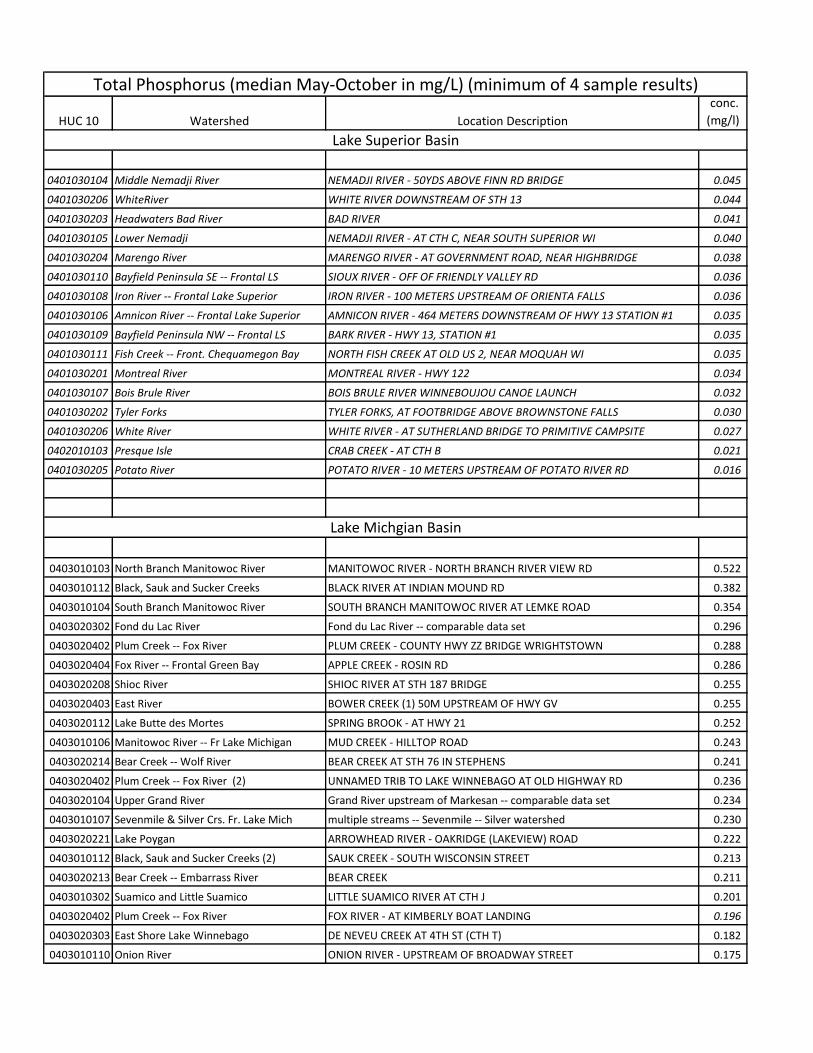
HUC 10 Watershed Location Description
conc.
(mg/l)
0401030104 Middle Nemadji River NEMADJI RIVER - 50YDS ABOVE FINN RD BRIDGE 0.045
0401030206 WhiteRiver WHITE RIVER DOWNSTREAM OF STH 13 0.044
0401030203 Headwaters Bad River BAD RIVER 0.041
0401030105 Lower Nemadji NEMADJI RIVER - AT CTH C, NEAR SOUTH SUPERIOR WI 0.040
0401030204 Marengo River MARENGO RIVER - AT GOVERNMENT ROAD, NEAR HIGHBRIDGE 0.038
0401030110 Bayfield Peninsula SE -- Frontal LS SIOUX RIVER - OFF OF FRIENDLY VALLEY RD 0.036
0401030108 Iron River -- Frontal Lake Superior IRON RIVER - 100 METERS UPSTREAM OF ORIENTA FALLS 0.036
0401030106 Amnicon River -- Frontal Lake Superior AMNICON RIVER - 464 METERS DOWNSTREAM OF HWY 13 STATION #1 0.035
0401030109 Bayfield Peninsula NW -- Frontal LS BARK RIVER - HWY 13, STATION #1 0.035
0401030111 Fish Creek -- Front. Chequamegon Bay NORTH FISH CREEK AT OLD US 2, NEAR MOQUAH WI 0.035
0401030201 Montreal River MONTREAL RIVER - HWY 122 0.034
0401030107 Bois Brule River BOIS BRULE RIVER WINNEBOUJOU CANOE LAUNCH 0.032
0401030202 Tyler Forks TYLER FORKS, AT FOOTBRIDGE ABOVE BROWNSTONE FALLS 0.030
0401030206 White River WHITE RIVER - AT SUTHERLAND BRIDGE TO PRIMITIVE CAMPSITE 0.027
0402010103 Presque Isle CRAB CREEK - AT CTH B 0.021
0401030205 Potato River POTATO RIVER - 10 METERS UPSTREAM OF POTATO RIVER RD 0.016
0403010103 North Branch Manitowoc River MANITOWOC RIVER - NORTH BRANCH RIVER VIEW RD 0.522
0403010112 Black, Sauk and Sucker Creeks BLACK RIVER AT INDIAN MOUND RD 0.382
0403010104 South Branch Manitowoc River SOUTH BRANCH MANITOWOC RIVER AT LEMKE ROAD 0.354
0403020302 Fond du Lac River Fond du Lac River -- comparable data set 0.296
0403020402 Plum Creek -- Fox River PLUM CREEK - COUNTY HWY ZZ BRIDGE WRIGHTSTOWN 0.288
0403020404 Fox River -- Frontal Green Bay APPLE CREEK - ROSIN RD 0.286
0403020208 Shioc River SHIOC RIVER AT STH 187 BRIDGE 0.255
0403020403 East River BOWER CREEK (1) 50M UPSTREAM OF HWY GV 0.255
0403020112 Lake Butte des Mortes SPRING BROOK - AT HWY 21 0.252
0403010106 Manitowoc River -- Fr Lake Michigan MUD CREEK - HILLTOP ROAD 0.243
0403020214 Bear Creek -- Wolf River BEAR CREEK AT STH 76 IN STEPHENS 0.241
0403020402 Plum Creek -- Fox River (2) UNNAMED TRIB TO LAKE WINNEBAGO AT OLD HIGHWAY RD 0.236
0403020104 Upper Grand River Grand River upstream of Markesan -- comparable data set 0.234
0403010107 Sevenmile & Silver Crs. Fr. Lake Mich multiple streams -- Sevenmile -- Silver watershed 0.230
0403020221 Lake Poygan ARROWHEAD RIVER - OAKRIDGE (LAKEVIEW) ROAD 0.222
0403010112 Black, Sauk and Sucker Creeks (2) SAUK CREEK - SOUTH WISCONSIN STREET 0.213
0403020213 Bear Creek -- Embarrass River BEAR CREEK 0.211
0403010302 Suamico and Little Suamico LITTLE SUAMICO RIVER AT CTH J 0.201
0403020402 Plum Creek -- Fox River FOX RIVER - AT KIMBERLY BOAT LANDING 0.196
0403020303 East Shore Lake Winnebago DE NEVEU CREEK AT 4TH ST (CTH T) 0.182
0403010110 Onion River ONION RIVER - UPSTREAM OF BROADWAY STREET 0.175
Total Phosphorus (median May-October in mg/L) (minimum of 4 sample results)
Lake Superior Basin
Lake Michgian Basin
kgenskow
Typewritten Text
B-2
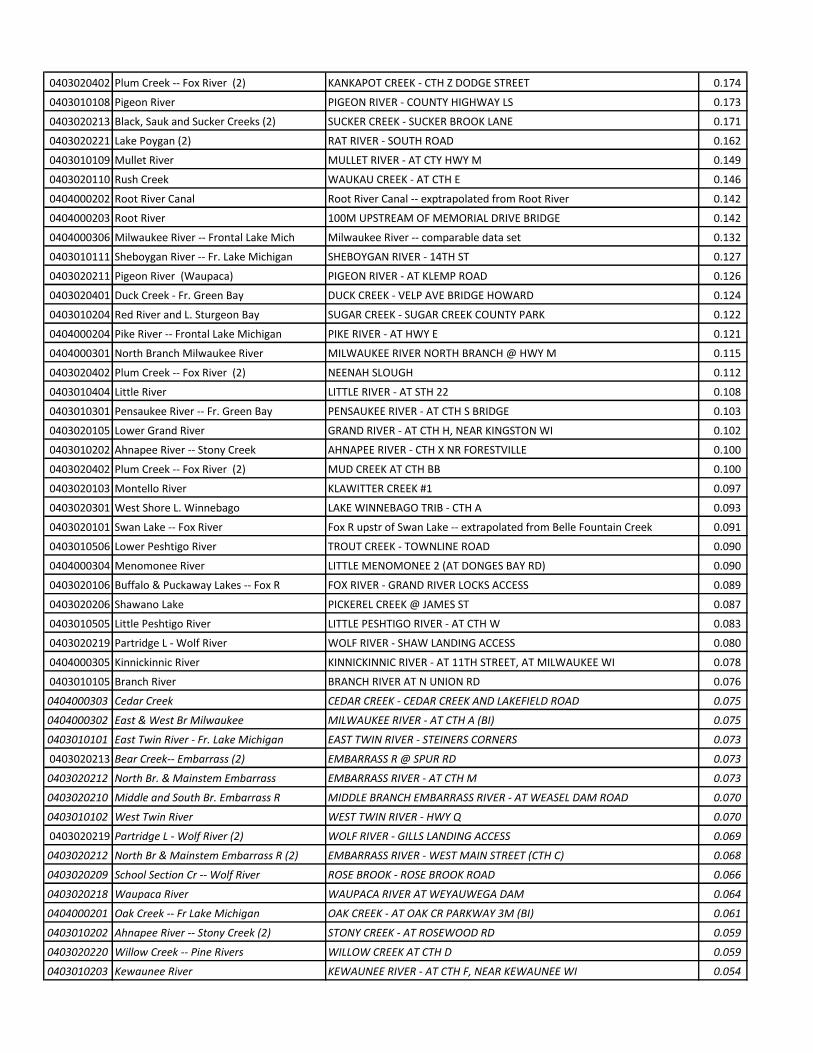
0403020402 Plum Creek -- Fox River (2) KANKAPOT CREEK - CTH Z DODGE STREET 0.174
0403010108 Pigeon River PIGEON RIVER - COUNTY HIGHWAY LS 0.173
0403020213 Black, Sauk and Sucker Creeks (2) SUCKER CREEK - SUCKER BROOK LANE 0.171
0403020221 Lake Poygan (2) RAT RIVER - SOUTH ROAD 0.162
0403010109 Mullet River MULLET RIVER - AT CTY HWY M 0.149
0403020110 Rush Creek WAUKAU CREEK - AT CTH E 0.146
0404000202 Root River Canal Root River Canal -- exptrapolated from Root River 0.142
0404000203 Root River 100M UPSTREAM OF MEMORIAL DRIVE BRIDGE 0.142
0404000306 Milwaukee River -- Frontal Lake Mich Milwaukee River -- comparable data set 0.132
0403010111 Sheboygan River -- Fr. Lake Michigan SHEBOYGAN RIVER - 14TH ST 0.127
0403020211 Pigeon River (Waupaca) PIGEON RIVER - AT KLEMP ROAD 0.126
0403020401 Duck Creek - Fr. Green Bay DUCK CREEK - VELP AVE BRIDGE HOWARD 0.124
0403010204 Red River and L. Sturgeon Bay SUGAR CREEK - SUGAR CREEK COUNTY PARK 0.122
0404000204 Pike River -- Frontal Lake Michigan PIKE RIVER - AT HWY E 0.121
0404000301 North Branch Milwaukee River MILWAUKEE RIVER NORTH BRANCH @ HWY M 0.115
0403020402 Plum Creek -- Fox River (2) NEENAH SLOUGH 0.112
0403010404 Little River LITTLE RIVER - AT STH 22 0.108
0403010301 Pensaukee River -- Fr. Green Bay PENSAUKEE RIVER - AT CTH S BRIDGE 0.103
0403020105 Lower Grand River GRAND RIVER - AT CTH H, NEAR KINGSTON WI 0.102
0403010202 Ahnapee River -- Stony Creek AHNAPEE RIVER - CTH X NR FORESTVILLE 0.100
0403020402 Plum Creek -- Fox River (2) MUD CREEK AT CTH BB 0.100
0403020103 Montello River KLAWITTER CREEK #1 0.097
0403020301 West Shore L. Winnebago LAKE WINNEBAGO TRIB - CTH A 0.093
0403020101 Swan Lake -- Fox River Fox R upstr of Swan Lake -- extrapolated from Belle Fountain Creek 0.091
0403010506 Lower Peshtigo River TROUT CREEK - TOWNLINE ROAD 0.090
0404000304 Menomonee River LITTLE MENOMONEE 2 (AT DONGES BAY RD) 0.090
0403020106 Buffalo & Puckaway Lakes -- Fox R FOX RIVER - GRAND RIVER LOCKS ACCESS 0.089
0403020206 Shawano Lake PICKEREL CREEK @ JAMES ST 0.087
0403010505 Little Peshtigo River LITTLE PESHTIGO RIVER - AT CTH W 0.083
0403020219 Partridge L - Wolf River WOLF RIVER - SHAW LANDING ACCESS 0.080
0404000305 Kinnickinnic River KINNICKINNIC RIVER - AT 11TH STREET, AT MILWAUKEE WI 0.078
0403010105 Branch River BRANCH RIVER AT N UNION RD 0.076
0404000303 Cedar Creek CEDAR CREEK - CEDAR CREEK AND LAKEFIELD ROAD 0.075
0404000302 East & West Br Milwaukee MILWAUKEE RIVER - AT CTH A (BI) 0.075
0403010101 East Twin River - Fr. Lake Michigan EAST TWIN RIVER - STEINERS CORNERS 0.073
0403020213 Bear Creek-- Embarrass (2) EMBARRASS R @ SPUR RD 0.073
0403020212 North Br. & Mainstem Embarrass EMBARRASS RIVER - AT CTH M 0.073
0403020210 Middle and South Br. Embarrass R MIDDLE BRANCH EMBARRASS RIVER - AT WEASEL DAM ROAD 0.070
0403010102 West Twin River WEST TWIN RIVER - HWY Q 0.070
0403020219 Partridge L - Wolf River (2) WOLF RIVER - GILLS LANDING ACCESS 0.069
0403020212 North Br & Mainstem Embarrass R (2) EMBARRASS RIVER - WEST MAIN STREET (CTH C) 0.068
0403020209 School Section Cr -- Wolf River ROSE BROOK - ROSE BROOK ROAD 0.066
0403020218 Waupaca River WAUPACA RIVER AT WEYAUWEGA DAM 0.064
0404000201 Oak Creek -- Fr Lake Michigan OAK CREEK - AT OAK CR PARKWAY 3M (BI) 0.061
0403010202 Ahnapee River -- Stony Creek (2) STONY CREEK - AT ROSEWOOD RD 0.059
0403020220 Willow Creek -- Pine Rivers WILLOW CREEK AT CTH D 0.059
0403010203 Kewaunee River KEWAUNEE RIVER - AT CTH F, NEAR KEWAUNEE WI 0.054
kgenskow
Typewritten Text
B-3

0403020109 Big Green Lake DAKIN CREEK - MAUG ROAD 0.054
0403020215 Flume Creek -- Little Wolf River Flume Creek -- extrapolated from South Branch Little Wolf River 0.051
0403020216 South Branch Little Wolf S BRANCH LITTLE WOLF R 20FT UP STREAM FROM BRIDGE SUNNYVIEW RD 0.051
0403010405 Oconto River SPLINTER CREEK AT STILES ROAD 0.050
0403020111 City of Berlin -- Fox River Barnes Creek -- comparable data set 0.049
0403020219 Partridge Lake -- Wolf River (2) WALLA WALLA CREEK - MARSH ROAD BRIDGE 0.048
0403020102 Neenah Creek HEENAH CREEK-HWY 23 0.042
0403020207 Legend Lake -- Wolf River WOLF RIVER - WOLF RIVER CANOE LAUNCH 1 0.042
0403020217 Blake Creek -- Little Wolf River WHITCOMB CREEK UPSTREAM FROM CTY RD OO 0.037
0403020108 White River WHITE RIVER AT 22 AVE SE OF NESHKORO 0.035
0403010402 North Branch Oconto River OCONTO RIVER - STH 32 BRIDGE-SURING 0.035
0403010809 Menominee River MENOMINEE RIVER - UPPER SCOTT FLOWAGE - ACCESS AT STH 180 0.033
0403010807 Squaw Creek -- Menominee R MENOMINEE RIVER - AT CTH Z 0.030
0403020201 Swamp Creek WOLF RIVER - UPSTREAM FROM CTH B BRIDGE 0.029
0403010402 North Branch Oconto River (2) NORTH BRANCH OCONTO RIVER 0.029
0403010501 Rat River RAT RIVER AT HARPER RD 0.028
0403010502 Upper Peshtigo River Peshtigo River -- extrapolated from Rat River 0.028
0403010403 Peshtigo Brook Peshtigo Brook -- extrapolated from Oconto and N. Br. Oconto 0.027
0403020203 Evergreen River -- Wolf River Evergreen River -- extrapolated from Red River 0.026
0403020204 West Branch Wolf River West Branch Wolf River -- extrapolated from Red River 0.026
0403020205 Red River RED RIVER - AT MAPLE AVENUE 0.026
0403020107 Mecan River CHAFFEE CREEK - CTH Y IBI STATION 1 0.025
0403020202 Lily River LILY RIVER APPROX 50M ABOVE HWY 55 BRIDGE AT LARGE BOULDER ON RIGHT0.024
0403010504 Middle Peshtigo River PESHTIGO RIVER AT HWY W 0.023
0403010506 Lower Peshtigo River (2) PESHTIGO RIVER AT CTH E 0.023
0403010603 Iron River -- Brule River Brule River headwaters -- extrapolated from Brule River 0.022
0403010605 Brule River BRULE RIVER AT US 2/14 0.022
0403010801 Popple River WOODS CREEK - HWY 101 0.019
0403010401 South Branch Oconto River SOUTH BRANCH OCONTO RIVER @ STH 32 0.018
0403010802 Pine River PINE RIVER - AT STH 101 0.018
0403010504 Middle Peshtigo River (2) THUNDER RIVER AT COUNTY PARK FOOT BRIDGE JUST ABOVE VETERANS FALLS 0.016
0403010806 Pike River PIKE RIVER AT PIKE R ROAD 0.016
0403010503 Middle Inlet Creek -- Lake Noquebay MIDDLE INLET CREEK - AT CTH X 0.015
0403010809 Menominee River WAUSAUKEE RIVER AT JAMROS ROAD 0.014
0403010805 Pemebonwon River NORTH BRANCH PEMEBONWON RIVER - AT CTH R 0.012
0403010201 Upper Door Peninsula HIBBARDS CREEK AT CTH A 0.010
0709000213 Marsh Creek -- Rock River ROCK RIVER - AT USH 14 BRIDGE 0.452
0707000217 Little Eau Pleine River LITTLE EAU PLAINE RIVER AT RANGELINE ROAD BRIDGE 0.399
0704000502 Upper Trempeauleau extrapolated from Elk Creek 0.385
0704000503 Elk Creek (Trempealeau) ELK CREEK - SWEDE VALLEY RD, TN RD NENE SEC 14 T22 R9W 0.385
0709000110 Lower Crawfish River CRAWFISH RIVER - AT STH 18 0.371
0709000104 Sinissippi Lake ROCK RIVER AT STH 60 DOWNSTREAM FROM LAKE SINISSIPPI 0.339
0707000215 Upper Big Eau Pleine River BIG EAU PLEINE R - AT STH 97 BRIDGE 0.332
Mississippi River Basin
kgenskow
Typewritten Text
B-4

0705000604 Otter Creek (nr. Eau Claire) OTTER CREEK @ MOROVITZ HOLLOW RD 0.323
0704000501 Pigeon Creek (Tremplealeau) PIGEON CREEK AT STH 53 0.307
0709000111 Middle Rock River ROCK RIVER - AT STH 106 0.304
0704000304 Waumandee Creek WAUMANDEE CREEK AT WAUMANDEE CREEK ROAD 0.297
0704000306 City of Winona -- Mississippi River extrapolated from Waumanee 0.297
0707000311 Upper Yellow (Central Wis.) YELLOW RIVER AT STH 13/73 0.296
0709000109 Beaver Dam River BEAVER DAM RIVER AT CTH J BRIDGE 0.294
0709000208 Badfish Creek BADFISH CREEK - AT CASEY ROAD 0.294
0704000302 Lower Buffalo River BUFFALO RIVER - AT STH 37 0.289
0709000103 Rubicon River RUBICON RIVER - AT CTH EE 0.283
0709000101 East Branch Rock River ROCK RIVER, EAST BRANCH - AT CTH TW BRG 0.278
0705000507 Lowes Creek (nr. Eau Claire) LOWES CREEK - SILVER SPRINGS DR 0.275
0705000506 Elk Creek ELK CREEK AT 960TH STREET / CRESCENT AVE 0.271
0705000508 Muddy Creek -- Chippewa River Extrapolated from Elk Creek 0.271
0705000509 Muddy Creek -- Chippewa River Extrapolated from Elk Creek 0.271
0704000702 Popple River (Black River) POPPLE RIVER AT STATE HWY 73 (FH STA 1) 0.269
0704000712 Lower Black River FLEMING CREEK 0.267
0704000601 Halfway Creek -- Mississippi River extrapolated from Fleming Creek 0.267
0709000111 Lower Koshkonong (on Rock) 05427085 - ROCK RIVER @ STH 12 BRIDGE, FORT ATKINSON 0.264
0704000301 Upper Buffalo River BUFFALO RIVER - SEGERSTROM RD 0.260
0709000102 Upper Rock River ROCK RIVER - AT STH 33 IN HORICON 0.253
0709000109 Beaver Dam River (2) ROCK RIVER - AT CTH B 0.252
0709000203 Bark River BARK RIVER - CTH N, FORT ATKINSON 0.248
0704000504 Middle Trempealeau River TURTON CREEK AT OAK STREET 0.240
0704000711 Beaver Creek & Lake Marinuka BEAVER CREEK AT HWY 53 0.237
0709000109 Calamus Creek (2) CALAMUS CREEK AT HWY S (CTH T) 0.225
0707000509 Bear Creek (Lower Wisconsin) BEAR CREEK AT CTH JJ 0.220
0709000108 Maunesha River MAUNESHA RIVER UPSTREAM STH 19 0.219
0705000504 Duncan Creek DUNCAN CREEK - SPRING STREET (CHIPPEWA FALLS) 0.215
0705000505 Trout Creek -- Chippewa River Extrapolate from Duncan Creek 0.215
0709000309 Spafford Cr -- Pecatonica R PECATONICA RIVER - STH 176 S WAYNE 0.213
0704000704 Cawley and Rock Creeks (Black) ROCK CREEK - ROCK CREEK STATION 0.210
0707000403 Narrows Cr. & Baraboo River BARABOO RIVER - SHAW STREET IN BARABOO 0.208
0709000210 Lake Koshkonong -- Rock River Extrapolated from Koshkonong Creek 0.202
0709000407 Lower Sugar River SUGAR RIVER - AT NELSON ROAD 0.202
0704000712 Big and Douglas Creeks (2) BIG CREEK 0.202
0709000204 Lower Koskonong KOSHKONONG CREEK AT STH 106 0.202
0707000302 Mill Creek (Central Wisc) MILL CREEK - AT CTH PP BRIDGE 0.199
0707000303 City of Stevens Point -- Wisconsin R Extrapolated from Mill Creek 0.199
0704000709 O'Neill and Cunningham Creeks CUNNINGHAM CREEK - AT STH 95/73 BRIDGE 0.197
0709000303 Middle Pecatonica PECATONICA RIVER AT WALNUT ROAD 0.195
0709000209 Yahara R and Lake Kegonsa YAHARA RIVER - AT STH 59 0.194
0704000505 Lower Trempealeau TAMARACK CREEK AT CTH G 0.187
0707000401 Seymour Creek and Upper Baraboo BARABOO RIVER - AT CTH FF IN WONEWOC 0.186
0705000207 Holcombe Flowage MUD CREEK AT CTH D 0.186
0707000603 Middle Kickapoo KICKAPOO RIVER - BANKER PARK IN VIOLA 0.186
0709000308 Lower East Branch Pecatonica EAST BRANCH PECATONICA RIVER AT CISSERVILLE ROAD 0.182
kgenskow
Typewritten Text
B-5
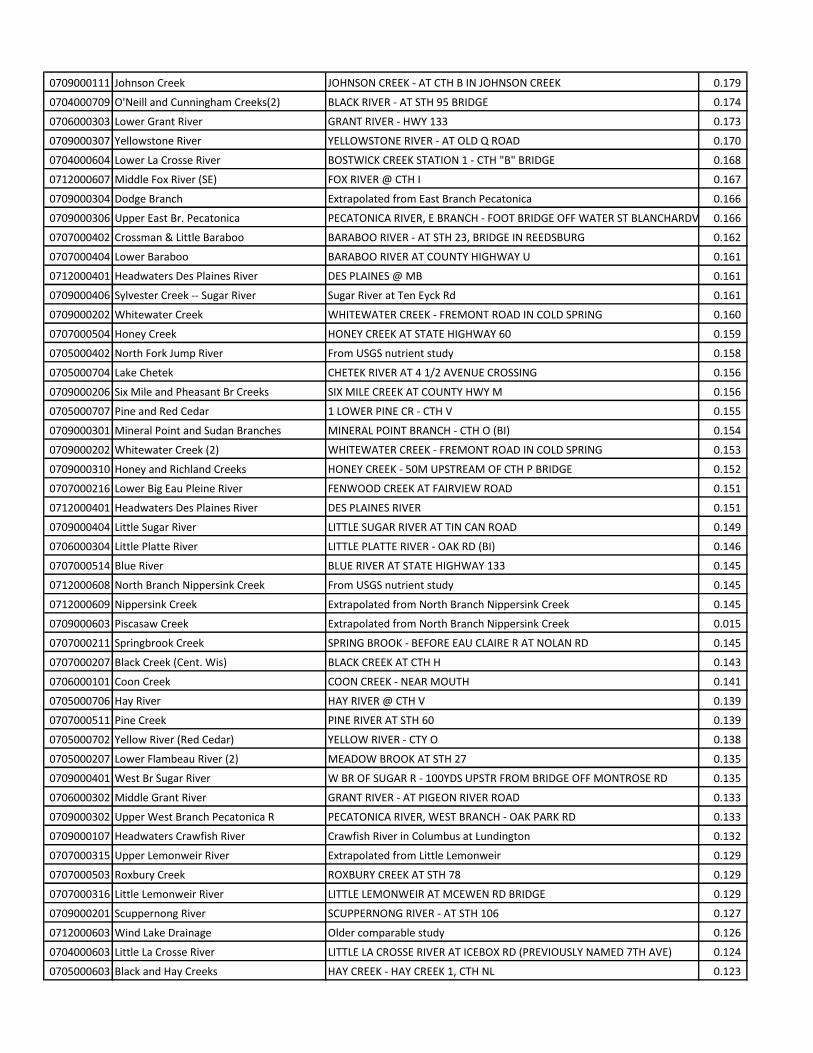
0709000111 Johnson Creek JOHNSON CREEK - AT CTH B IN JOHNSON CREEK 0.179
0704000709 O'Neill and Cunningham Creeks(2) BLACK RIVER - AT STH 95 BRIDGE 0.174
0706000303 Lower Grant River GRANT RIVER - HWY 133 0.173
0709000307 Yellowstone River YELLOWSTONE RIVER - AT OLD Q ROAD 0.170
0704000604 Lower La Crosse River BOSTWICK CREEK STATION 1 - CTH "B" BRIDGE 0.168
0712000607 Middle Fox River (SE) FOX RIVER @ CTH I 0.167
0709000304 Dodge Branch Extrapolated from East Branch Pecatonica 0.166
0709000306 Upper East Br. Pecatonica PECATONICA RIVER, E BRANCH - FOOT BRIDGE OFF WATER ST BLANCHARDVILLE0.166
0707000402 Crossman & Little Baraboo BARABOO RIVER - AT STH 23, BRIDGE IN REEDSBURG 0.162
0707000404 Lower Baraboo BARABOO RIVER AT COUNTY HIGHWAY U 0.161
0712000401 Headwaters Des Plaines River DES PLAINES @ MB 0.161
0709000406 Sylvester Creek -- Sugar River Sugar River at Ten Eyck Rd 0.161
0709000202 Whitewater Creek WHITEWATER CREEK - FREMONT ROAD IN COLD SPRING 0.160
0707000504 Honey Creek HONEY CREEK AT STATE HIGHWAY 60 0.159
0705000402 North Fork Jump River From USGS nutrient study 0.158
0705000704 Lake Chetek CHETEK RIVER AT 4 1/2 AVENUE CROSSING 0.156
0709000206 Six Mile and Pheasant Br Creeks SIX MILE CREEK AT COUNTY HWY M 0.156
0705000707 Pine and Red Cedar 1 LOWER PINE CR - CTH V 0.155
0709000301 Mineral Point and Sudan Branches MINERAL POINT BRANCH - CTH O (BI) 0.154
0709000202 Whitewater Creek (2) WHITEWATER CREEK - FREMONT ROAD IN COLD SPRING 0.153
0709000310 Honey and Richland Creeks HONEY CREEK - 50M UPSTREAM OF CTH P BRIDGE 0.152
0707000216 Lower Big Eau Pleine River FENWOOD CREEK AT FAIRVIEW ROAD 0.151
0712000401 Headwaters Des Plaines River DES PLAINES RIVER 0.151
0709000404 Little Sugar River LITTLE SUGAR RIVER AT TIN CAN ROAD 0.149
0706000304 Little Platte River LITTLE PLATTE RIVER - OAK RD (BI) 0.146
0707000514 Blue River BLUE RIVER AT STATE HIGHWAY 133 0.145
0712000608 North Branch Nippersink Creek From USGS nutrient study 0.145
0712000609 Nippersink Creek Extrapolated from North Branch Nippersink Creek 0.145
0709000603 Piscasaw Creek Extrapolated from North Branch Nippersink Creek 0.015
0707000211 Springbrook Creek SPRING BROOK - BEFORE EAU CLAIRE R AT NOLAN RD 0.145
0707000207 Black Creek (Cent. Wis) BLACK CREEK AT CTH H 0.143
0706000101 Coon Creek COON CREEK - NEAR MOUTH 0.141
0705000706 Hay River HAY RIVER @ CTH V 0.139
0707000511 Pine Creek PINE RIVER AT STH 60 0.139
0705000702 Yellow River (Red Cedar) YELLOW RIVER - CTY O 0.138
0705000207 Lower Flambeau River (2) MEADOW BROOK AT STH 27 0.135
0709000401 West Br Sugar River W BR OF SUGAR R - 100YDS UPSTR FROM BRIDGE OFF MONTROSE RD 0.135
0706000302 Middle Grant River GRANT RIVER - AT PIGEON RIVER ROAD 0.133
0709000302 Upper West Branch Pecatonica R PECATONICA RIVER, WEST BRANCH - OAK PARK RD 0.133
0709000107 Headwaters Crawfish River Crawfish River in Columbus at Lundington 0.132
0707000315 Upper Lemonweir River Extrapolated from Little Lemonweir 0.129
0707000503 Roxbury Creek ROXBURY CREEK AT STH 78 0.129
0707000316 Little Lemonweir River LITTLE LEMONWEIR AT MCEWEN RD BRIDGE 0.129
0709000201 Scuppernong River SCUPPERNONG RIVER - AT STH 106 0.127
0712000603 Wind Lake Drainage Older comparable study 0.126
0704000603 Little La Crosse River LITTLE LA CROSSE RIVER AT ICEBOX RD (PREVIOUSLY NAMED 7TH AVE) 0.124
0705000603 Black and Hay Creeks HAY CREEK - HAY CREEK 1, CTH NL 0.123
kgenskow
Typewritten Text
B-6

0707000513 Mill and Indian Creeks MILL CREEK - AT STATE HIGHWAY 60 0.122
0704000701 Black and L. Black Rivers BLACK RIVER - DIVISION DRIVE 0.121
0705000502 Yellow River YELLOW RIVER AT 350TH ST 0.121
0707000507 Trout and Mill Creeks MILL CREEK AT CTH C 0.120
0709000206 Lake Mendota -- Yahara (2) PHEASANT BRANCH - CTH M EAST BRIDGE 0.116
0712000601 Pewaukee - Fox River FOX RIVER AT RIVER RD (BI SUR) 0.116
0705000707 Lower Pine - Red Cedar (2) RED CEDAR RIVER IBI - STH 64 0.115
0707000601 Headwaters Kickapoo KICKAPOO RIVER - STH 33 IN ONTARIO 0.115
0707000310 Hemlock Creek HEMLOCK CREEK AT NECEDAH ROAD 0.113
0707000502 Prairie du Sac Dam -- Wisconsin R From USGS nutrient study 0.113
0705000710 Lake Menomin -- Red Cedar WILSON CREEK AT 390TH ST BRIDGE 0.113
0709000205 Headwaters Yahara YAHARA RIVER - AT STH 113, AT MADISON WI 0.113
0705000510 Eau Galle River EAU GALLE RIVER - AT CTH P 0.112
0705000511 Plum Creek 1-PLUM CREEK CTH N 0.112
0703000510 Willow River WILLOW RIVER - 160TH AVE 0.111
0704000709 Lake Arbutus - Black River (2) BLACK RIVER - BELOW POWER HOUSE-HATFIELD DAM 0.111
0705000512 Bear Creek BEAR CREEK AT HIGHWAY 85 0.111
0709000311 Richland Creek RICHLAND CREEK - CTH P BRIDGE UPSTREAM 660M TO SHUEYVILLE RD BRIDGE 0.111
0705000503 Lake Wissota YELLOW RIVER - AT CTH XX 0.109
0706000305 Platte River PLATTE RIVER - BANFIELD BRIDGE ACCESS 0.109
0712000606 White River WHITE RIVER 0.109
0709000309 Honey Creek- Pecatonica River (2) SKINNER CREEK - CHEESE COUNTRY RECREATION TRAIL IN BROWNTOWN 0.108
0712000402 Mill Creek Extrapolated from stream in 0712000401 0.108
0707000511 Pine River (2) PINE RIVER @ STH 14 RICHLAND CENTER 0.106
0706000103 Bad Axe BAD AXE RIVER - NEAR MOUTH @ WILLENBERG ROAD BRIDGE 0.106
0707000317 Lower Lemonweir River LOWER LEMONWEIR RIVER AT HWY HH BRIDGE 0.104
0706000301 Upper Grant GRANT RIVER - UNIVERSITY FARM RD 0.103
0709000305 Blue Mounds Branch (2) GORDON CREEK AT COUNTY HIGHWAY H 0.103
0707000313 Mead Marsh -- Yellow River YELLOW RIVER ABOVE NECEDAH TREATMENT PLANT OUTFALL 0.103
0709000402 Headwaters Sugar River Older comparable study 0.103
0705000501 Fisher River -- Chippewa River FISHER RIVER - 240TH AVE 0.102
0705000109 Holcombe Flowage Extrapolated from Fisher River 0.102
0709000106 Ashippun River ASHIPPUN RIVER AT SKI SLIDE ROAD 0.102
0712000610 Squaw Creek -- Fox river FOX RIVER AT WILMOT WI 0.101
0709000403 Allen Creek Extrapolated from Story Creek -- Sugar River 0.100
0709000405 Story Creek -- Sugar River SUGAR RIVER - AT CTH EE 0.100
0707000510 Willow Creek From TMDL study 0.100
0705000605 Eau Claire River EAU CLAIRE RIVER ADJACENT TO CTH QQ - COUNTY LAND 0.099
0707000210 Scotch Creek -- Rib River LOWER RIB RIVER (UW-23) 0.099
0707000505 Black Earth Creek BLACK EARTH CREEK - AT MORRILL ROAD 0.098
0707000319 Dell Cr -- Wisconsin River DELL CREEK AT STATE HIGHWAY 23 0.098
0706000307 Sny Magill Cr -- Mississippi R MCCARTNEY BRANCH - IRISH RIDGE RD 0.097
0707000605 Kickapoo River PINE CREEK STATION 1-1975-NE 1/4 NW 1/4 SEC 18 0.095
0703000507 Beaver Brook -- Apple River BEAVER BROOK - DOWNSTREAM OF 85TH STREET APPROX 10 METERS 0.094
0704000710 Robinson Creek ROBINSON CREEK AT ROBINSON ROAD 0.094
0705000303 South Fork Flambeau R SKINNER CREEK 0.093
0707000515 Knapp Creek KNAPP CREEK @ WINDING WAY DR 0.092
kgenskow
Typewritten Text
B-7

0707000604 Tainter Creek -- Kickapoo R HALLS CREEK-CTY HWY E DOWNSTREAM 0.091
0709000212 Bass Creek BASS CREEK - CTH D, AFTON 0.091
0709000315 Racoon Creek Extrapolated from Bass Creek 0.091
0709000215 City of Beloit -- Lower Rock River Extrapolated from Bass Creek 0.091
0705000108 Deer Tail Creek DEER TAIL CREEK - AT BROKEN ARROW RD 0.090
0707000202 Copper River COPPER RIVER - AT CTH E 0.090
0712000604 Sugar Creek SUGAR CREEK UPSTREAM OF POTTER ROAD 0.090
0712000605 Honey Creek Extrapolated from Sugar Creek 0.090
0703000509 Big Marine L, -- St. Croix R OSCEOLA CREEK APPROX 20 METERS UPSTREAM OF HWY 35 0.090
0703000108 North Fork Clam River NORTH FORK CLAM RIVER - AT MALONE ROAD CROSSING 0.089
0707000508 Otter Creek OTTER CREEK AT HWY C 0.088
0707000501 Duck Cr -- Wisconsin R DUCK CREEK AT DUCK CREEK ROAD 0.087
0707000314 Beaver Creek BEAVER CREEK UPSTREAM OF STH 21 0.085
0707000506 Blue Mounds Creek Comparable study 0.083
0707000112 Spirit River SPIRIT RIVER-BELOW CONFLUENCE WITH SQUAW CREED 0.083
0705000601 North Fork Eau Claire R EAU CLAIRE RIVER - NORTH FORK, NE1/4 OF SE1/4 SEC10 0.081
0704000703 Trappers -- Pine -- Black R BLACK RIVER 0.080
0705000401 South Fork Jump River SOUTH FORK JUMP RIVER ALONG CTH I 0.079
0707000204 Alexander L -- Wisconsin River DEVIL CREEK - SCOTT ROAD 0.078
0709000214 Turtle Creek TURTLE CREEK - COLLEY ROAD IN BELOIT 0.078
0705000705 South Fork Hay River SOUTH FORK HAY RIVER - S FORK HAY RIVER 1, CTH F 0.078
0704000602 Upper LaCrosse River LACROSSE RIVER 0.077
0712000601 Pewaukee River -- Fox River (2) PEWAUNEE RIVER UPSTREAM OF STH 164 AT STEINHAFEL'S ENTRANCE 0.077
0709000207 Lake Monona -- Yahara River YAHARA RIVER - AT USH 51 0.077
0706000107 Rush Creek -- Mississippi River RUSH CREEK ST 1 - BRIDGE ON RUSH CREEK ROAD 0.073
0706000110 Bloody Run -- Mississippi River Extrapolated from Rush Creek 0.073
0707000218 L. Dubay -- Wisconsin River LITTLE EAU CLAIRE RIVER - AT CTH X BRIDGE 0.073
0707000218 L. Dubay -- Wisconsin River JOHNSON CREEK AT CTH C 0.073
0709000105 Oconomowoc River OCONOMOWOC RIVER 0.072
0707000602 West Fork Kickapoo River KICKAPOO RIVER, WEST FORK - SE 1/4 OF NW 1/4 SEC 33 0.071
0705000404 Lower Jump River JUMP RIVER AT HIGHWAY 73 0.070
0703000109 Clam River CLAM RIVER @ LYNCH BRIDGE ROAD 0.069
0706000503 Galena River FEVER (GALENA) RIVER - AT ENSCHE & BUNCOMBE ROADS 0.067
0705000403 Main Creek MAIN CREEK AT BROKEN ARROW ROAD 0.065
0705000703 Brill River-- Red Cedar River RED CEDAR RIVER ACCESS - 19TH ST (N45 26' 41.8" W091 45' 54.2") 0.065
0707000516 Big Green River From USGS reference study 0.065
0707000307 Petenwell Lake MOCCASIN CREEK AT STH 54, STATION 1 0.065
0707000518 Wisconsin River MILLVILLE CREEK AT CTH C 0.064
0703000104 Shell Lake -- Yellow River YELLOW RIVER - DOWNSTREAM OF YELLOW RIVER ROAD APPROX 10 METERS 0.063
0705000107 Soft Maple -- Chippewa River DEVILS CREEK - LOW SITE AT HWY 40 BRIDGE 0.063
0703000508 Balsam Branch -- Apple River BALSAM BRANCH AT 105TH AVE - UPSTREAM OF LAKE WAPPOGASSETT 0.062
0704000705 Wedges Creek WEDGES CREEK AT MIDDLE RD 0.062
0707000208 Wood Creek -- Rib River BIG RIB RIVER AT CTH A 0.062
0709000211 Blackhawk Creek SPRING BROOK - AT MAIN STREET, JANESVILLE 0.061
0703000501 Wood River WOOD RIVER AT WEST RIVER ROAD CROSSING (1MI ABOVE ST CROIX R) 0.059
0703000508 Balsam Branch -- Apple River (2) APPLE RIVER @ CHURCH ROAD 0.059
0707000206 Trappe River TRAPPE RIVER AT SHADY LANE, STATION 1 0.057
kgenskow
Typewritten Text
B-8

0707000214 Eau Claire Flowage -- Wisconsin River Extrapolated from Trappe River 0.057
0703000507 Beaver Brook -- Apple River (2) APPLE RIVER - APPLE RIVER COUNTY PARK (N45 23' 15.5" W092 22' 05.2") 0.057
0707000318 Petenwell Lake WHITE CREEK AT CTH Z 0.057
0707000313 Mead Marsh -- Yellow River (2) LITTLE YELLOW RIVER 0.056
0707000203 Prairie River From USGS nutrient study 0.055
0707000212 Black Brook -- Eau Claire River EAU CLAIRE RIVER AT W BEAR LAKE ROAD 0.055
0703000112 Chases Brook -- St. Croix River ST CROIX RIVER - NORWAY POINT LANDING 0.054
0705000102 East Fork Chippewa River CHIPPEWA RIVER, EAST FORK - CTH B AB FLOWAGE 0.054
0705000404 Lower Jump River JUMP RIVER 0.053
0705000602 south Fork Eau Claire River EAU CLAIRE RIVER, SOUTH FORK - SOUTH FORK EAU CLAIRE RIVER 0.053
0704000706 East Fork Black River BLACK RIVER, EAST FORK - E FORK RD 0.053
0707000108 Upper Tomahawk River TOMAHAWK RIVER - ADJACENT TO CEDAR FALLS RD 0.052
0703000510 Willow River (2) WILLOW RIVER - BELOW LITTLE FALLS 0.051
0707000113 L. Mohawksin -- Lake Alice -- Wis R WISCONSIN RIVER - OFF CAMP 10 RD 0.050
0705000205 Upper Flambeau River NORTH FORK FLAMBEAU RIVER BELOW CROWLEY DAM 0.049
0703000506 Wolf River -- St. Croix River WOLF CREEK @ 275TH STREET 0.049
0707000517 City of Boscobel -- Wisconsin River From USGS nutrient study 0.047
0705000205 Upper Flambeau River SWAMP CREEK AT CTH F 0.047
0705000701 Red Cedar Lake KNUTESON CREEK 0.047
0703000512 Lake St. Croix Lake St. Croix -- extrapolated from Kinnickinnic 0.046
0706000105 Mormon Creek - Mississippi River Mormon Creek -- from USGS nutrient study 0.046
0704000605 Pine Creek -- Mississippi River extrapolated from Mormon Creek 0.046
0707000213 Big Sandy Creek -- Eau Claire River EAU CLAIRE RIVER - AT CAMP PHILLIPS RD 0.046
0703000511 Kinnickinnic River KINNICKINNIC RIVER - CTH F BRIDGE 0.046
0707000104 Rainbow Flowage -- Mud Creek WISCONSIN RIVER - TAILWATER BELOW OTTER RAPIDS DAM 0.045
0707000113 L. Mohawksin -- Lake Alice -- Wis R NOISY CREEK - AT WOODFORD RD 0.045
0707000604 Tainter Creek -- Kickapoo R (2) TAINTER CREEK 0.045
0707000107 Pelican River PELICAN RIVER AT GERMOND RD 0.045
0704000101 Big River -- Mississippi River Big River -- Mississippi River -- extrapolated from Trimbelle R 0.044
0705000106 Thornapple River THORNAPPLE RIVER - CTH A NW LADYSMITH 0.044
0707000205 Pine River From TMDL study 0.044
0704000103 Trimbelle River TRIMBELLE RIVER 1-50' US OF STH 35 0.044
0707000201 New Wood River NEW WOOD RIVER - AT TESCH RD 0.043
0707000105 Gilmore Creek -- Big St. Germain R GILMORE CREEK - AT CTH D 0.042
0705000301 Elk River ELK RIVER 0.041
0705000107 Soft Maple -- Chippewa River CHIPPEWA RIVER AT BOAT LANDING NEAR CTH H AND STH 40 0.040
0707000101 Deerskin River DEERSKIN RIVER AT RANGELINE RD 0.040
0709000213 MarshCreek -- Rock River MARSH CREEK - CTH E 0.040
0703000105 Yellow Lake -- Yellow River YELLOW RIVER DOWNSTREAM OF LOWEST HWY 35 CROSSING APPROX 20 METERS0.040
0703000505 Trade River TRADE RIVER APPROX 100 METERS DWONSTREAM OF EVERGREEN AVENUE 0.040
0705000105 BrunetRiver -- ChippewaRiver BIG WEIRGOR CREEK - DOWNSTREAM OF SHORT CUT ROAD 0.040
0707000103 Pioneer Creek -- Wisconsin R WISCONSIN RIVER AT CTH G EAGLE RIVER 0.040
0704000707 Morrison Creek MORRISON CREEK - AT HWY K 0.039
0707000309 Little Roche Cri Creek LITTLE ROCHE A CREEK AT CTH J 0.038
0717000209 Little Rib River LITTLE RIB, (NORTH OF) STEWART AVE, SITE 1 0.037
0705000204 Butternut Creek BUTTERNUT CREEK 0.036
0707000109 Middle Tomahawk River Tomahawk River at Prairie Rapids Road 0.036
kgenskow
Typewritten Text
B-9

0707000113 L. Mohawksin -- Lake Alice -- Wis R (3) TOMAHAWK RIVER - AT PRAIRIE RAPIDS RD 0.036
0703000112 Goose Creek -- St. Croix Goose Creek -- St. Croix -- extrapolated form 0703000102 0.035
0705000101 West Fork Chippewa River WEST FORK CHIPPEWA RIVER ADJACENT TO COUNTY HIGHWAY S 0.035
0705000206 Middle Flambeau River FLAMBEAU RIVER AT BOAT LANDING UPSTREAM OF STH 70 0.035
0705000302 Headwaters South Fork Flambeau R SOUTH FORK FLAMBEAU RIVER 0.035
0703000102 Moose River - St Croix R ST CROIX RIVER AT CCC BRIDGE 0.035
0707000218 Lake Dubay -- Wisconsin River FOURMILE CREEK - AT CTH KK 0.034
0705000205 Upper Flambeau River NORTH FORK FLAMBEAU RIVER AT HOLTS LANDING 0.034
0703000103 Upper Tamarack River UPPER TAMARACK RIVER - CTH T BRIDGE 0.033
0703000106 Lower Tamarack River Lower Tamarack -- extrapolated from 0703000103 0.033
0707000111 Somo River SOMO RIVER - AT ZENITH TOWER RD 0.033
0705000302 Headwaters Flambeau River FLAMBEAU RIVER - SOUTH FORK, AT STH 13 WAYSIDE SOUTH OF FIFIELD 0.032
0705000206 Middle Flambeau River PINE CREEK AT COUNTY HWY EE 0.031
0703000203 Totagatic River TOTAGATIC RIVER - THOMPSON BRIDGE ROAD CROSSING 0.030
0707000218 Lake Dubay -- Wisconsin River BULL JUNIOR CREEK - AT OLD 51 BRIDGE 0.030
0707000305 Tenmile Creek TENMILE CREEK - AT HWY 13 0.030
0705000203 Headwaters Flambeau River FLAMBEAU RIVER 0.029
0704000105 Rush River 4-RUSH RIVER - 385TH ST 0.029
0704000107 Lake Pepin Lake Pepin -- extrapolated from Rush River 0.029
0707000301 Plover River PLOVER RIVER (UW-12) 0.029
0707000308 Big Roche A Cri Creek BIG ROCHE A CRI CREEK @ 20TH AVE, SITE 1 0.028
0707000512 City of Spring Green -- Wisconsin R From USGS nutrient study 0.028
0703000101 Upper St. Croix -- Eau Claire Rivers ST CROIX RIVER - AT OLD HWY 53 0.027
0707000105 Gilmore Creek -- Big St. Germain R (2) ST GERMAIN RIVER - AT STH 70 0.027
0707000110 Lower Tomahawk River LITTLE RICE CREEK AT CTH N 0.027
0707000102 Eagle River EAGLE RIVER AT STH 70 0.027
0707000306 Fourteenmile Creek FOURTEENMILE CREEK AT CTH Z BRIDGE 0.026
0703000202 Trego Lake -- Namekagon River NAMEKAGON RIVER - DOWNSTREAM OF CTH K BRIDGE APPROX 40 METERS 0.025
0707000113 L. Mohawksin - L Alice- Wis R (3) CRESCENT CREEK - 370 METERS DS FROM FIRE TOWER RD 0.025
0703000201 Upper Namakagon River NAMEKAGON RIVER - AT HOSPITAL ROAD 0.024
0705000103 Lake Chippewa HAY CREEK - AT MOOSE LAKE ROAD 0.024
0707000312 Cranberry Creek CRANBERRY CREEK AT 8TH STREET 0.024
0703000202 Trego Lake -- Namekagon River (2) NAMEKAGON RIVER 0.023
0705000202 Bear River BEAR RIVER - UPSTREAM BRIDGE RD 0.022
0712000602 Mukwanago River MUKWONAGO RIVER - AT CTH I 2M (BI SUR) 0.022
0704000708 Halls Creek Used USGS nutrient study data from Vismal Creek 0.021
0705000104 Couderay River COUDERAY RIVER 0.021
0707000106 Rhinelander Flowage PINE LAKE CREEK AT FOREST LN 0.021
0703000204 Namekagon River NAMEKAGON RIVER DOWNSTREAM OF NAMEKAGON TRAIL APPROX 30 METERS0.020
0705000201 Manitowish River TROUT RIVER - BELOW WILD RICE LAKE 0.018
0707000304 Fourmile Creek Fourmile Creek at Buena Vista at Griffith Ave 0.015
0705000201 Manitowish River MANITOWISH RIVER - AT US 51 0.015
0707000204 Alexander L -- Wisconsin River (2) FOURMILE CREEK AT GRIFFITH AVENUE 0.015
kgenskow
Typewritten Text
B-10

HUC 10 Watershed Location_Description Conc. (mg/L)
0401030104 Middle Nemadji River NEMADJI RIVER - 50YDS ABOVE FINN RD BRIDGE 0.00
0401030105 St. Louis and Lower Nemadji River NEMADJI RIVER - AT CTH C, NEAR SOUTH SUPERIOR WI 0.53 0401030107 Bois Brule River BOISE BRULE RIVER - WINNEBOUJOU CANOE LAUNCH 0.00 0401030108 Iron River IRON RIVER, ABOUT 100M UPSTREAM OF ORIENTA FALLS 0.00 0401030109 Bayfield Peninsula NW -- Frontal Lake Superior BARK RIVER - 15M UPSTREAM, HWY 13, STATION #1 0.03 0401030110 Bayfield Peninsula SE -- Frontal Lake Superior SIOUX RIVER - OFF OF FRIENDLY VALLEY RD 0.02 0401030111 Fish Creek - Frontal Chequamegon Bay NORTH FISH CREEK AT OLD US 2, NEAR MOQUAH WI 0.05 0401030201 Montreal River MONTREAL RIVER HWY 122 0.09 0401030202 Tyler Forks TYLER FORKS, AT FOOTBRIDGE ABOVE BROWNSTONE FALLS IN COPPER FALLS SP0.04
0401030203 Headwaters Bad River BAD RIVER - EAST TYLER RD, BRIDGE ON NE SIDE OF MELLEN 0.75 0401030204 Marengo River MARENGO RIVER-AT GOVERNMENT ROAD, NEAR HIGHBRIDGE 0.06 0401030205 Potato River POTATO RIVER, 10M UPSTREAM OF POTATO RIVER RD 0.00 0401030206 White River WHITE RIVER AT SUTHERLAND BRIDGE TO PRIMITIVE CAMPSITE 0.00 0401030206 White River WHITE RIVER DOWNSTREAM OF STH 13 0.00
0402010103 Presque Isle River CRAB CREEK - AT CTH W 0.45
0403020109 Big Green Lake DAKIN CREEK MAUG ROAD 14.11 0403010204 Red River and Sturgeon Bay SUGAR CREEK-SUGAR CREEK COUNTY PARK-150FT UPSTREAM FROM CREEK MOUTH5.80 0403020302 Fond du Lac River extrapolated from De Nevue Creek 4.88 0403020303 East Shore Lake Winnebago DE NEVEU CREEK AT 4TH ST (CTH T) 4.88 0403020101 Swan Lake -- Fox River extrapolated from Belle Fountain Creek 4.53 0403020105 Lower Grand River BELLE FOUNTAIN CREEK AT CTH B (BI) 4.53 0403020104 Upper Grand River extrapolate from Belle Fountain Creek 4.35 0403010108 Pigeon River PIGEON RIVER - COUNTY HIGHWAY LS 3.76 0403010105 Branch River BRANCH RIVER AT N UNION RD 3.72 0403010109 Mullet River MULLET RIVER - AT CTY HWY M 3.68 0403010104 South Branch Manitowoc River SOUTH BRANCH MANITOWOC RIVER AT LEMKE ROAD 3.65 0403010106 Manitowoc River -- Frontal Lake Michigan MUD CREEK - HILLTOP ROAD 3.43 0403020209 School Section Creek -- Wolf River ROSE BROOK-ROSE BROOK ROAD 3.43 0403010201 Upper Door Peninsula HIBBARDS CREEK AT CTH A 3.42 0403020214 Bear Creek -- Little Wolf River BEAR CREEK AT STH 76 IN STEPHENS 3.28 0403010103 North Branch Manitowoc River MANITOWOC RIVER - NORTH BRANCH RIVER VIEW RD 2.97 0404000301 North Branch Milwaukee River MILWAUKEE RIVER NORTH BRANCH @ HWY M 2.90 0404000304 Menomonee River LITTLE MENOMONEE 2 AT DONGES BAY RD 2.71 0403010101 East Twin River EAST TWIN RIVER-EAST TWIN RIVER-STEINERS CORNERS 2.70 0403010107 Sevenmile & Silver Crs -- Fr Lake Michigan comparable study 2.66 0403020216 South Branch Little Wolf River S BRANCH LITTLE WOLF R, 20FT UPSTREAM FROM BRIDGE SUNNYVIEW RD2.65 0403020219 Partridge Lake -- Wolf River WALLA WALLA CREEK AT MARSH ROAD 2.61 0403020110 Rush Creek WAUKAU CREEK - AT CTH E 2.59 0403020105 Lower Grand River GRAND RIVER - AT CTH H, NEAR KINGSTON WI 2.54 0403020107 Mecan River CHAFFEE CREEK CTH Y IBI STATION 1 2.54 0403010203 Kewaunee River KEWAUNEE RIVER - AT CTH F, NEAR KEWAUNEE WI 2.53 0403020208 Shioc River SHIOC RIVER AT STH 187 BRIDGE 2.45 0403020221 Lake Poygan RAT RIVER - SOUTH ROAD 2.43 0403020402 Plum Creek -- Fox River (2) FOX RIVER - AT KIMBERLY BOAT LANDING 2.40 0404000302 East and West Branches Milwaukee River MILWAUKEE RIVER - AT CTH A (BI) 2.33 0403010202 Ahnapee River and Stony Creek AHNAPEE RIVER - CTH X NR FORESTVILLE 2.32 0403010102 West Twin River WEST TWIN RIVER-HWY Q 2.28
Total Nitrogen (median May - October) (minimum of 4 sample results) (underlined values -- nitrate only)
Lake Superior Basin
Lake Michigan Basin
kgenskow
Typewritten Text
B-11

HUC 10 Watershed Location_Description Conc. (mg/L)
Total Nitrogen (median May - October) (minimum of 4 sample results) (underlined values -- nitrate only)
0403010112 Black R & Sauk and Sucker Creeks -- Fr LM SUCKER CREEK - SUCKER BROOK LANE 2.23 0403020212 North Br & Mainstem Embarrass R (2) EMBARRASS RIVER, WEST MAIN STREET (CTH C) 2.21 0404000204 Pike River PIKE RIVER - PIKE RIVER3 AT HWY E 2.20 0403020108 White River WHITE RIVER AT 2ND AVE SE OF NESHKORO 2.20 0403020402 Plum Creek -- Fox River PLUM CREEK - COUNTY HWY ZZ BRIDGE, WRIGHTSTOWN 2.19 0403020212 North Br & Mainstem Embarrass R (2) BEAR CREEK 2.17 0403020103 Montello River KLAWITTER CREEK #1 - BRIDGE ON CTH B 2.09 0403020112 Lake Butte Des Mortes SPRING BROOK - AT HWY 21 2.07 0403010506 Lower Peshtigo River TROUT CREEK-TOWNLINE ROAD 2.04 0403020215 Flume Creek -- Little Wolf River extrapolated form Waupaca River 2.01 0403020218 Waupaca River WAUPACA RIVER AT WEYAUWEGA DAM 2.01 0403020219 Partridge Lake -- Wolf River (2) WOLF RIVER - GILLS LANDING ACCESS 2.01 0403010302 Suamico and Little Suamico Rivers LITTLE SUAMICO RIVER AT CTH J 1.98 0403020404 Fox River -- Fr Green Bay APPLE CREEK - ROSIN RD 1.92 0403020217 Blake Creek -- Little Wolf River WHITCOMB CREEK UPSTREAM FROM CTY RD OO 1.80 0404000306 Milwaukee River - Frontal Lake Michigan USGS nutrient study 1.71 0403020402 Plum Creek -- Fox River NEENAH SLOUGH 1.69 0403010202 Ahanapee and Stony Creek (2) STONY CREEK - AT ROSEWOOD RD 1.67 0404000303 Cedar Creek CEDAR CREEK - CEDAR CREEK AND LAKEFIELD ROAD 1.66 0403020213 Bear Creek Embarrass River EMBARRASS RIVER - AT SPUR RD 1.62 0403020102 Neenah Creek NEENAH CREEK-HWY 23 1.59 0403020403 East River BOWER CREEK (1) 50M UPSTREAM OF HWY GV 1.57 0403020212 North Br & Mainstem Embarrass R EMBARRASS RIVER AT STONEY HILL ROAD 1.55 0403020402 Plum Creek -- Fox River (2) KANKAPOT CREEK - CTH Z DODGE STREET, 100FT UPSTREAM OF BRIDGE1.47 0403010505 Little Peshtigo River LITTLE PESHTIGO RIVER - AT CTH W 1.41 0403010111 Sheboygan River -- Frontal Lake Michigan SHEBOYGAN RIVER 14TH ST 1.41 0403010112 Black R & Sauk & Sucker Creeks -- Fr LM (2) BLACK RIVER AT INDIAN MOUND RD 1.40 0403020303 East Shore Lake Winnebago UNNAMED TRIB TO LAKE WINNEBAGO AT OLD HIGHWAY RD 1.40 0403020106 Buffalo and Puckaway Lakes FOX RIVER 30FT DOWNSTREAM FROM HISTORICAL MARKER IN COUNTY PARK ON1.38 0403020111 City of Berlin -- Fox River extrapolated from Buffalo -- Puckaway 1.38 0403010403 Peshtigo Brook extrapolated from Oconto River 1.36 0403010405 Oconto River SPLINTER CREEK AT STILES ROAD 1.36 0403020402 Plum Creek -- Fox River (2) FOX RIVER - WRIGHTSTOWN LAUNCH 1.35 0403010112 Black R & Sauk & Sucker Creeks -- Fr LM (2) SAUK CREEK - SOUTH WISCONSIN STREET 1.33 0403020210 Middle & South Br Embarrass R MIDDLE BRANCH EMBARRASS RIVER AT WEASEL DAM ROAD 1.31 0403020219 Partridge Lake -- Wolf River (2) WOLF RIVER - SHAW LANDING ACCESS 1.31 0403020220 Willow Creek -- Pine River WILLOW CREEK AT CTH D 1.24 0403020211 Pigeon River PIGEON RIVER - AT KLEMP ROAD 1.22 0403010404 Little River LITTLE RIVER - AT STH 22 1.16 0403020402 Plum Creek MUD CREEK AT CTH BB 1.09 0403010301 Pensaukee River PENSAUKEE RIVER - CTH S BRIDGE 1.09 0403010110 Onion River ONION RIVER-UPSTREAM OF BROADWAY STREET 1.06 0403020207 Lake Legend -- Wolf River WOLF RIVER - WOLF RIVER CANOE LAUNCH 1 1.02 0403020401 Duck Creek DUCK CREEK - VELP AVE BRIDGE HOWARD 0.99 0403020106 Buffalo and Puckaway Lakes (2) FOX RIVER - GRAND RIVER LOCKS ACCESS 0.97 0404000305 Kinnickinnic River KINNICKINNIC RIVER AT 11TH STREET AT MILWAUKEE WI 0.97 0403020205 Red River RED RIVER AT MAPLE AVENUE 0.96 0403020203 Evergreen River -- Wolf River extrapolate from Red River 0.96 0403020204 West Branch Wolf River extrapolate from Red River 0.96 0404000201 Oak Creek - Fr. Lake Michigan OAK CREEK AT OAK CR PARKWAY 3M (BI) 0.93 0403010402 North Branch Oconto River OCONTO RIVER - STH 32 BRIDGE-SURING 0.91 0403020221 Lake Poygan ARROWHEAD RIVER (0743-B) 0.86
kgenskow
Typewritten Text
B-12

HUC 10 Watershed Location_Description Conc. (mg/L)
Total Nitrogen (median May - October) (minimum of 4 sample results) (underlined values -- nitrate only)
0403010504 Middle Peshtigo River PESHTIGO RIVER AT HWY W 0.63 0403010506 Lower Peshtigo River PESHTIGO RIVER AT CTH E 0.62 0403020206 Shawano Lake PICKEREL CREEK AT JAMES ST 0.62 0403010801 Popple River WOODS CREK - HWY 101 0.62 0404000202 Root River Canal extrapolated from Root River 0.61
0404000203 Root River 100M UPSTREAM OF MEMORIAL DRIVE BRIDGE 0.61
0403010809 Menominee River MENOMINEE RIVER UPPER SCOTT FLOWAGE ACCESS AT STH 180 0.56 0403010402 North Branch Oconto River NORTH BRANCH OCONTO RIVER 0.56 0403010603 Iron River -- Brule River extrapolated from Brule River 0.55 0403010605 Brule River BRULE RIVER AT US 2/14 0.55 0403020201 Swamp Creek WOLF RIVER - UPSTREAM FROM CTH B BRIDGE 0.55 0403010503 Middle Inlet -- Lake Noquebay MIDDLE INLET CREEK - AT CTH X 0.54 0403010807 Pemebonwon and Middle Menominee Rivers MENOMINEE RIVER AT CTH Z 0.53 0403010802 Pine River PINE RIVER - ELECTROFISHING STATION 2, BEGINS AT HWY 101 0.52 0403010805 Pemebonwon River NORTH BRANCH PEMOBONWON RIVER AT CTH R 0.51 0403010401 South Branch Oconto River SOUTH BRANCH OCONTO RIVER @ STH 32 0.46 0403010809 Menominee River WAUSAUKEE RIVER AT JAMROS ROAD 0.44 0403020202 Lily River LILY RIVER LILY RIVER APROX 50M ABOVE HWY 55 BRIDGE 0.44 0403010806 Pike River PIKE RIVER AT PIKE R. ROAD 0.42 0403010504 Middle Peshtigo River THUNDER RIVER AT COUNTY PARK FOOT BRIDGE JUST ABOVE VETERANS FALLS0.39 0403010501 Rat River RAT RIVER AT HARPER RD 0.38 0403010502 Upper Peshtigo River extrapolated from Rat River 0.38 0403020301 West Shore Lake Winnebago LAKE WINNEBAGO TRIB - CTH A 0.37 0404000205 Waukegan River -- Frontal Lake Michigan na0403010601 North Branch Paint River na
0709000211 Blackhawk Creek SPRING BROOK - MAIN STREET IN JANESVILLE 12.85
0709000208 Badfish Creek BADFISH CREEK - CASEY ROAD 12.39 0709000310 Honey Creek-Pecatonica River HONEY CREEK - 50M UPSTREAM OF CTH P BRIDGE 10.08 0709000311 Richland Creek RICHLAND CREEK - CTH P BRIDGE UPSTREAM 660M TO SHUEYVILLE RD BRIDGE9.84 0709000603 Piscasaw Creek extrapolated from N. Br Nippersink 7.78 0712000608 North Branch Nippersink Creek From USGS Nutrient Study -- W Br Nippersink 7.78 0712000609 Nippersink Creek Extrapolated form N. Br Nippersink 7.78 0709000303 Ames Branch-Pecatonica River extrapolated from Pecatonica at Walnut Rd 7.39 0709000309 Spafford Creek-Pecatonica River PECATONICA RIVER AT WALNUT ROAD 7.39 0706000303 Lower Grant River GRANT RIVER - HWY 133 7.33 0706000304 Little Platte River LITTLE PLATTE RIVER - OAK RD (BI) 7.00 0709000309 Spafford Creek-Pecatonica River PECATONICA RIVER - STH 176 SOUTH WAYNE 6.94 0709000212 Bass Creek BASS CREEK - CTH D, AFTON 6.73 0709000315 Raccoon Creek extrapolated from Bass Creek 6.73 0706000301 Upper Grant River GRANT RIVER - UNIVERSITY FARM RD 6.43 0709000403 Allen Creek extrapolated from Sugar River at CTH EE 6.10 0709000405 Story Creek-Sugar River SUGAR RIVER - AT CTH EE 6.10 0709000206 Lake Mendota-Yahara River PHEASANT BRANCH CTH M EAST BRIDGE 6.02 0706000502 Sinsinawa River-Mississippi River extrapolated from Galena River 5.98 0706000503 Galena River GALENA RIVER - AT BEEBE ROAD 5.98 0706000505 South Fork Apple River-Apple River extrapolated from Galena River 5.98 0707000304 Fourmile Creek FOURMILE CREEK AT GRIFFITH AVENUE 5.91 0709000401 West Branch Sugar River WEST BRANCH SUGAR RIVER AT CTH PB 5.90 0709000404 Little Sugar River LITTLE SUGAR RIVER AT TIN CAN ROAD 5.76
Mississippi River Basin
kgenskow
Typewritten Text
B-13

HUC 10 Watershed Location_Description Conc. (mg/L)
Total Nitrogen (median May - October) (minimum of 4 sample results) (underlined values -- nitrate only)
0709000302 Headwaters Pecatonica River PECATONICA RIVER, WEST BRANCH - OAK PARK ROAD 5.58 0709000214 Turtle Creek TURTLE CREEK - COLLEY ROAD IN BELOIT 5.52 0703000511 Kinnickinnic River KINNICKINNIC RIVER - CTH F BRIDGE 5.47 0703000512 Lake Saint Croix extrapolated from Kinnickninnic River 5.47 0709000213 Marsh Creek-Rock River MARSH CREEK - CTH E 5.42 0709000211 Blackhawk Creek SPRING BROOK - MAIN STREET IN JANESVILLE 12.85
0709000208 Badfish Creek BADFISH CREEK - CASEY ROAD 12.39 0709000310 Honey and Richland Creeks HONEY CREEK - 50M UPSTREAM OF CTH P BRIDGE 10.08 0709000311 Honey and Richland Creeks RICHLAND CREEK - CTH P BRIDGE UPSTREAM 660M TO SHUEYVILLE RD BRIDGE9.84 0709000603 Piscasaw Creek extrapolated from N. Br Nippersink 7.78 0712000608 North Branch Nippersink Creek From USGS Nutrient Study -- W Br Nippersink 7.78 0712000609 Nippersink Creek Extrapolated form N. Br Nippersink 7.78 0709000303 Ames Branch -- Pecatonica River extrapolated from Pecatonica at Walnut Rd 7.39 0709000309 Lower Pecatonica River PECATONICA RIVER AT WALNUT ROAD 7.39 0706000303 Lower Grant River GRANT RIVER - HWY 133 7.33 0706000304 Little Platte River LITTLE PLATTE RIVER - OAK RD (BI) 7.00 0709000309 Lower Pecatonica River (2) PECATONICA RIVER - STH 176 SOUTH WAYNE 6.94 0709000212 Bass Creek BASS CREEK - CTH D, AFTON 6.73 0709000315 Racoon Creek extrapolated from Bass Creek 6.73 0706000301 Upper Grant River GRANT RIVER - UNIVERSITY FARM RD 6.43 0709000403 Allen Creek and Middle Sugar River extrapolated from Sugar River at CTH EE 6.10 0709000405 Allen Creek and Middle Sugar River SUGAR RIVER - AT CTH EE 6.10 0709000206 Six Mile and Pheasant Branch Creeks PHEASANT BRANCH CTH M EAST BRIDGE 6.02 0706000502 Sinsinawa River -- Mississippi River extrapolated from Galena River 5.98 0706000503 Galena River GALENA RIVER - AT BEEBE ROAD 5.98 0706000505 South Fork Apple River -- Apple River extrapolated from Galena River 5.98 0707000304 Fourmile and Fivemile Creek FOURMILE CREEK AT GRIFFITH AVENUE 5.91 0709000401 West Branch Sugar River - Mt. Vernon Cre WEST BRANCH SUGAR RIVER AT CTH PB 5.90 0709000404 Little Sugar River LITTLE SUGAR RIVER AT TIN CAN ROAD 5.76 0709000302 Upper West Branch Pecatonica River PECATONICA RIVER, WEST BRANCH - OAK PARK ROAD 5.58 0709000214 Turtle Creek TURTLE CREEK - COLLEY ROAD IN BELOIT 5.52
0703000511 Kinnickinnic River KINNICKINNIC RIVER - CTH F BRIDGE 5.47 0703000512 Lake St. Croix extrapolated from Kinnickninnic River 5.47
0709000213 Marsh Creek MARSH CREEK - CTH E 5.42 0709000215 City of Beloit-Lower Rock River Extrapolated from Marsh Creek 5.42 0706000302 Middle Grant River GRANT RIVER - PIGEON RIVER RD 5.35 0709000402 Headwaters Sugar River SUGAR RIVER - AT STH 69, BELLEVILLE 5.33 0709000210 Lake Koshkonong-Rock River extrapolated from Koshkonong Creek 5.31 0709000204 Koshkonong Creek KOSHKONONG CREEK AT STH 106 5.31 0707000510 Willow Creek From USGS Nutrient Study -- Willow Cr 5.27 0709000204 Koshkonong Creek KOSHKONONG CREEK AT CTH O 5.07 0709000406 Sylvester Creek-Sugar River Sugar Creek at Ten Eyck Road 4.93 0706000305 Platte River PLATTE RIVER - BANFIELD BRIDGE ACCESS 4.91 0709000301 Mineral Point Branch MINERAL POINT BRANCH CTH O (BI) 4.86 0709000205 Headwaters Yahara River YAHARA RIVER AT STH 113 AT MADISON WI 4.82 0709000107 Headwaters Crawfish River CRAWFISH RIVER - IN COLUMBUS-LUDINGTON 4.78 0709000407 Taylor Creek-Sugar River SUGAR RIVER - AT NELSON ROAD 4.71 0709000209 Lake Kegonsa-Yahara River YAHARA RIVER - AT STH 59, NEAR FULTON WI 4.70 0709000308 East Branch Pecatonica River EAST BRANCH PECATONICA RIVER AT CISSERVILLE ROAD 4.62 0709000206 Lake Mendota-Yahara River SIX MILE CREEK AT COUNTY HWY M 4.59 0707000514 Blue River BLUE RIVER AT STATE HIGHWAY 133 4.42 0712000603 Wind Lake Drainage extrapolated from Eagle & Fox Creeks 4.40
kgenskow
Typewritten Text
B-14

HUC 10 Watershed Location_Description Conc. (mg/L)
Total Nitrogen (median May - October) (minimum of 4 sample results) (underlined values -- nitrate only)
0712000607 Eagle Creek-Fox Creek FOX RIVER @ CTY HWY I 4.40 0709000213 Marsh Creek-Rock River ROCK RIVER - AT USH 14 BRIDGE 4.33
0709000305 Blue Mounds Branch GORDON CREEK AT COUNTY HIGHWAY H 4.30 0707000211 Spring Brook SPRING BROOK - BEFORE EAU CLAIRE R AT NOLAN RD 4.26 0709000202 Whitewater River WHITEWATER CREEK - FREMONT ROAD IN COLD SPRING 4.13 0705000707 Lower Pine Creek-Red Cedar River 1 LOWER PINE CREEK - CTH V 4.11 0707000503 Otter Creek-Wisconsin River ROXBURY CREEK AT STH 78 4.09 0712000401 Headwaters Des Plaines River DES PLAINES AT MB 4.03 0712000402 Mill Creek extrapolated from headwaters Des Plaines 4.03 0705000512 Bear Creek-Chippewa River BEAR CREEK AT HIGHWAY 85 4.03 0709000310 Honey Creek-Pecatonica River SKINNER CREEK - CHEESE COUNTRY RECREATION TRAIL IN BROWNTOWN3.95 0709000101 East Branch Rock River ROCK RIVER, EAST BRANCH - AT CTH TW BRIDGE 3.91 0707000501 Duck Creek-Wisconsin River DUCK CREEK AT DUCK CREEK ROAD 3.79 0709000104 Sinnissippi Lake-Rock River ROCK RIVER AT STH 60 DOWNSTREAM FROM LAKE SINISSIPPI 3.78 0712000604 Sugar Creek SUGAR CREEK UPSTREAM OF POTTER ROAD 3.69 0712000605 Honey Creek extrapolated from Sugar Creek 3.69 0706000307 Sny Magill Creek-Mississippi River MCCARTNEY BRANCH - IRISH RIDGE RD 3.64 0709000304 Dodge Branch extrapolated from 0709000306 3.62 0709000306 Ridgeway Br-East Br Pecatonica R PECATONICA RIVER, E BRANCH-FOOTBRIDGE OFF WATER ST IN BLANCHARDVILLE3.62 0703000510 Willow River WILLOW RIVER - 160TH AVE 3.43 0704000101 Big River-Mississippi River extrapolated from Trimbelle River 3.40 0704000103 Trimbelle River TRIMBELLE RIVER 1-50' US OF STH 35 3.40
0704000504 Middle Trempealeau River TURTON CREEK AT OAK STREET 3.35 0709000108 Maunesha River MAUNESHA RIVER UPSTREAM STH 19 3.35 0709000106 Ashippun River-Rock River ASHIPPUN RIVER AT SKI SLIDE ROAD 3.30 0707000504 Honey Creek HONEY CREEK AT STATE HIGHWAY 60 3.10 0709000307 Yellowstone River YELLOWSTONE RIVER AT OLD Q ROAD 3.10 0704000302 Elk Creek-Buffalo River BUFFALO RIVER - AT STH 37 3.07 0704000105 Rush River 4-RUSH RIVER - 385TH ST 3.04 0705000506 Elk Creek ELK CREEK AT 960TH STREET/CRESENT AVE 3.04 0705000508 Muddy Creek-Chippewa River extraplated from Elk Creek 3.04 0705000509 Muddy Creek-Chippewa River extrapolated from Elk Creek 3.04 0709000110 Crawfish River CRAWFISH RIVER - STATE HIGHWAY 18 3.02 0707000502 Prairie du Sac Dam-Wisconsin River From USGS Nutrient Study -- Hinkson Cr 2.93 0707000308 Big Roche a Cri Creek BIG ROCHE A CRI CREEK AT 20TH AVE SITE 1 2.92 0707000309 Little Roche a Cri Creek Bingham Creek at 11th Avenue 2.89 0709000103 Rubicon River RUBICON RIVER - CTH EE 2.88 0709000111 Johnson Creek-Rock River ROCK RIVER - CTH B & US 94 2.83 0709000102 West Branch Rock River-Rock River ROCK RIVER - AT STH 33 IN HORICON 2.83 0707000605 Kickapoo River PINE CREEK STATION STARTS AT WALKER HOLLOW RD BRIDGE CR2.80
0703000510 Willow River WILLOW RIVER - BELOW LITTLE FALLS DAM 2.80 0709000109 Beaver Dam River BEAVER DAM RIVER AT CTH J BRIDGE 2.79 0704000601 Halfway Creek-Mississippi River extrapolated from Fleming Creek 2.79 0704000712 Fleming Creek-Black River FLEMING CREEK 2.79 0704000604 Lower La Crosse River BOSTWICK CREEK STATION 1 - CTH B BRIDGE 2.78 0707000516 Big Green River WISCONSIN RIVER - BIG GREEN RIVER ACCESS 2.77 0704000502 Upper Trempealeau River extrapolated from Elk Creek 2.75 0704000503 Elk Creek ELK CREEK - SWEEDE VALLEY RD 2.75 0704000603 Middle La Crosse River LITTLE LA CROSSE RIVER AT ICEBOX RD (PREVIOUSLY NAMED 7TH AVE)_2.68 0703000509 Big Marine Lake-Saint Croix River OSCEOLA CREEK ST STH 35 2.60 0707000505 Black Earth Creek BLACK EARTH CREEK AT MORRILL ROAD 2.54 0705000511 Plum Creek 1-PLUM CREEK CTH N 2.54
kgenskow
Typewritten Text
B-15

HUC 10 Watershed Location_Description Conc. (mg/L)
Total Nitrogen (median May - October) (minimum of 4 sample results) (underlined values -- nitrate only)
0705000705 South Fork of the Hay River SOUTH FORK HAY RIVER - S FORK HAY RIVER 1, CTH F 2.53 0709000203 Bark River BARK RIVER CTH N FORT ATKINSON 2.52 0707000517 City of Boscobel-Wisconsin River From USGS Nutrient Study -- Crooked Cr 2.51 0707000318 Petenwell Lake WHITE CREEK AT CTH Z 2.51 0707000301 Plover River PLOVER RIVER (UW-12) 2.48 0709000109 Beaver Dam River CALAMUS CREEK AT HWY S (CTH T) 2.45 0705000702 Yellow River YELLOW RIVER - CTY O 2.42 0704000708 Halls Creek HALLS CREEK-CTY HWY E DOWNSTREAM 2.42 0704000301 Harvey Creek-Buffalo River BUFFALO RIVER SEGERSTROM RD 2.40 0704000711 Beaver Creek BEAVER CREEK AT HWY 53 2.34 0709000111 Johnson Creek-Rock River JOHNSON CREEK AT CTH B IN JOHNSON CREEK 2.33 0712000401 Headwaters Des Plaines River DES PLAINS RIVER 2.31 0704000712 Fleming Creek-Black River BIG CREEK 2.31 0712000610 Squaw Creek-Fox River FOX RIVER AT WILMOT WI 2.29 0707000508 Otter Creek OTTER CREEK AT HWY C 2.26 0707000507 Trout Creek-Mill Creek MILL CREEK AT CTH C 2.18 0707000319 Dell Creek-Wisconsin River DELL CREEK AT STATE HIGHWAY 23 2.17 0712000601 Pewaukee River-Fox River FOX RIVER AT RIVER RD (BI SUR) 2.12 0704000501 Pigeon Creek PIGEON CREEK AT STH 53 2.11
0704000304 Waumaundee Creek WAUMANDEE CREEK AT WAUMANDEE CREEK ROAD 2.09
0704000306 City of Winona-Mississippi River extrapolated from Waumandee 2.09
0707000518 Wisconsin River MILLVILLE CREEK AT CTH C 2.06
0706000103 Bad Axe River BAD AXE RIVER NEAR MOUTH AT WILLENBERG ROAD BRIDGE 2.03 0707000404 Devil's Lake-Baraboo River BARABOO RIVER AT COUNTY HIGHWAY U 1.99 0705000710 Lake Menomin-Red Cedar River WILSON CREEK AT 390TH ST BRIDGE 1.89 0707000207 Black Creek BLACK CREEK AT CTH H 1.79 0709000201 Scupperenong River SCUPPERNONG RIVER - AT STH 106 1.77 0707000212 Black Brook-Eau Claire River EAU CLAIRE RIVER AT W BEAR LAKE ROAD 1.76 0707000209 Little Rib River LITTLE RIB, (NORTH OF) STEWART AVE, SITE 1 1.76 0707000602 West Fork Kickapoo River KICKAPOO RIVER, WEST FORK - SE 1/4 OF NW 1/4 SEC 33 1.75 0705000507 Lowes Creek-Chippewa River LOWES CREEK - SILVER SPRINGS DR 1.74 0707000509 Bear Creek BEAR CREEK AT CTH JJ 1.72 0712000606 White River WHITE RIVER 1.66 0707000501 Duck Creek-Wisconsin River PINE RIVER AT STH 60 1.62 0706000101 Coon Creek COON CREEK NEAR MOUTH 1.61 0707000217 Little Eau Pleine River LITTLE EAU PLAINE RIVER AT RANGELINE ROAD BRIDGE 1.57 0705000707 Lower Pine Creek-Red Cedar River RED CEDAR RIVER IBI - STH 64 1.55 0706000107 Rush Creek-Mississippi River RUSH CREEK ST.1 - BRIDGE ON RUSH CREEK ROAD 1.54
0706000110 Bloody Run-Mississippi River extrapolated from Rush Creek 1.54
0707000403 Narrows Creek-Baraboo River BARABOO RIVER - AT SHAW STREET IN BARABOO 1.53 0707000601 Headwaters Kickapoo River KICKAPOO RIVER STH 33 IN ONTARIO 1.52 0707000402 Little Baraboo River-Baraboo River BARABOO RIVER AT STH 23 BRIDGE IN REEDSBURG 1.48 0705000207 Lower Flambeau River MEADOW BROOK AT STH 27 1.47 0707000603 Bear Creek-Kickapoo River KICKAPOO RIVER - BANKER PARK IN VIOLA 1.45 0704000605 Pine Creek-Mississippi River extrapolated from Mormon Creek 1.42 0706000105 Mormon Creek-Mississippi River from USGS nutrient study 1.42 0712000602 Mukwonago River MUKWONAGO RIVER AT CTH I 2M (BI SUR) 1.41 0705000510 Eau Galle River EAU GALLE RIVER @ CTH P 1.40 0705000507 Lowes Creek-Chippewa River LOWER CREEK - SILVER SPRINGS DR 1.40
0707000315 Upper Lemonweir River extrapolated from Little Lemonweir 1.39 0707000316 Middle Lemonweir River LITTLE LEMONWEIR AT MCEWEN RD BRIDGE 1.39 0705000706 Hay River HAY RIVER @ CTH V 1.38
kgenskow
Typewritten Text
B-16

HUC 10 Watershed Location_Description Conc. (mg/L)
Total Nitrogen (median May - October) (minimum of 4 sample results) (underlined values -- nitrate only)
0707000515 Knapp Creek KNAPP CREEK AT WINDING WAY DR 1.35 0707000218 Lake Dubay-Wisconsin River JOHNSON CREEK AT CTH C 1.34 0707000311 Rocky Creek-Yellow River YELLOW RIVER AT STH 13/73 1.34 0707000210 Scotch Creek-Big Rib River LOWER RIB RIVER (UW-23) 1.33 0704000701 Black-Little Black Rivers BLACK RIVER - AT DIVISION DRIVE 1.30 0707000604 Tainter Creek-Kickapoo River TAINTER CREEK 1.30 0712000601 Pewaukee River-Fox River PEWAUNEE RIVER UPSTREAM OF STH 164 AT STEINHAFEL'S ENTRANCE1.27 0704000505 Lower Trempealeau River TAMARACK CREEK AT CTH G 1.23
0705000605 Eau Claire River EAU CLAIRE RIVER, ADJACENT TO CTH QQ - COUNTY LAND 1.21 0707000215 Dill Creek-Big Eau Pleine River BIG EAU PLEINE RIVER AT STH 97 1.21 0703000507 Beaver Brook-Apple River BEAVER BROOK - UPSTREAM OF 85TH STREET, APPROX 10 METERS1.20 0707000513 Hoosier Hollow-Mill Creek MILL CREEK - STATE HIGHWAY 60 1.20 0707000305 Tenmile Creek TENMILE CREEK - AT HWY 13 1.19
0704000702 Popple River POPPLE RIVER AT STATE HWY 73 (FH STA 1) 1.19 0704000709 Lake Arbutus-Black River BLACK RIVER BELOW POWER HOUSE HATFIELD DAM 1.18 0709000207 Lake Monona-Yahara River YAHARA RIVER AT USH 51 1.15 0707000506 Blue Mounds Creek West Br Blue Mounds at Frame Road 1.15 0707000401 Headwaters of the Baraboo River BARABOO RIVER - AT CTH FF IN WONEWOC 1.15 0705000205 Upper Flambeau River SWAMP CREEK AT CTH F 1.14 0707000204 Alexander Lake-Wisconsin River DEVIL CREEK - SCOTT ROAD 1.14 0705000502 Upper Yellow River YELLOW RIVER AT 350TH ST 1.13 0707000512 City of Spring Green-Wisconsin River From USGS Nutrient Study -- Lowery Cr 1.13
0705000507 Lowes Creek-Chippewa River CHIPPEWA RIVER - SHORT ST EAU CLAIRE 1.12 0707000511 Pine River PINE RIVER - AT STH 14 RICHLAND CENTER 1.12 0705000504 Duncan Creek DUNCAN CREEK - SPRING STREET, CHIPPEWA FALLS 1.11 0705000505 Trout Creek-Chippewa River extrapolated from Duncan Creek 1.11 0707000213 Big Sandy Creek-Eau Claire River EAU CLAIRE RIVER - AT CAMP PHILLIPS RD 1.09 0707000317 Lower Lemonweir River LOWER LEMONWEIR RIVER AT HWY HH BRIDGE 1.08 0707000205 Pine River extrapolated form Trappe River 1.08 0707000206 Trappe River TRAPPE RIVER AT SHADY LANE, STATION 1 1.08 0707000214 Eau Claire Flowage-Wisconsin River extrapolated from Trappe River 1.08 0705000207 Lower Flambeau River MUD CREEK AT CTH D 1.06 0704000709 Lake Arbutus-Black River BLACK RIVER - AT STH 95 BRIDGE 1.05 0705000404 Lower Jump River JUMP RIVER AT HIGHWAY 73 1.04 0704000704 Rock Creek-Black River ROCK CREEK ROCK CREEK STATION 1.04 0707000218 Lake Dubay-Wisconsin River BULL JUNIOR CREEK AT OLD 51 BRIDGE 1.02 0707000314 Beaver Creek BEAVER CREEK UPSTREAM OF STH 21 1.02 0705000303 South Fork Flambeau River SKINNER CREEK 1.01 0705000603 Hay Creek-Eau Claire River HAY CREEK - HAY CREEK 1, CTH NL 1.00 0705000109 Holcolmbe Flowage-Chippewa River extrapolated from Fisher River 1.00 0705000501 Fisher River-Chippewa River FISHER RIVER - 240TH AVE 1.00 0707000604 Tainter Creek-Kickapoo River TAINTER CREEK @ WEST POINT ROAD 1.00
0705000601 North Fork Eau Claire River EAU CLAIRE RIVER, NORTH FORK - NE 1/4 OF SE 1/4 SEC 10 0.99 0707000218 Lake Dubay-Wisconsin River FOURMILE CREEK @ CTH KK 0.99 0705000604 Otter Creek OTTER CREEK - STATION 1/SPOONER AVE 0.99
0703000506 Wolf Creek-Saint Croix River WOLF CREEK @ 275TH STREET 0.99 0705000401 South Fork Jump River SOUTH FORK JUMP RIVER ALONG CTH I 0.97 0704000709 Lake Arbutus-Black River CUNNINGHAM CREEK AT STH 95/73 BRIDGE 0.96 0707000307 Petenwell Lake MOCCASIN CREEK MOCASSIN CREEK AT STH 54 STATION 1 0.96 0707000218 Lake Dubay-Wisconsin River LITTLE EAU CLAIRE RIVER - AT CTH X BRIDGE 0.94 0705000703 Brill River-Red Cedar River RED CEDAR RIVER 0.94 0705000108 Deer Tail Creek DEER TAIL CREEK @ BROKEN ARROW RD 0.92
kgenskow
Typewritten Text
B-17
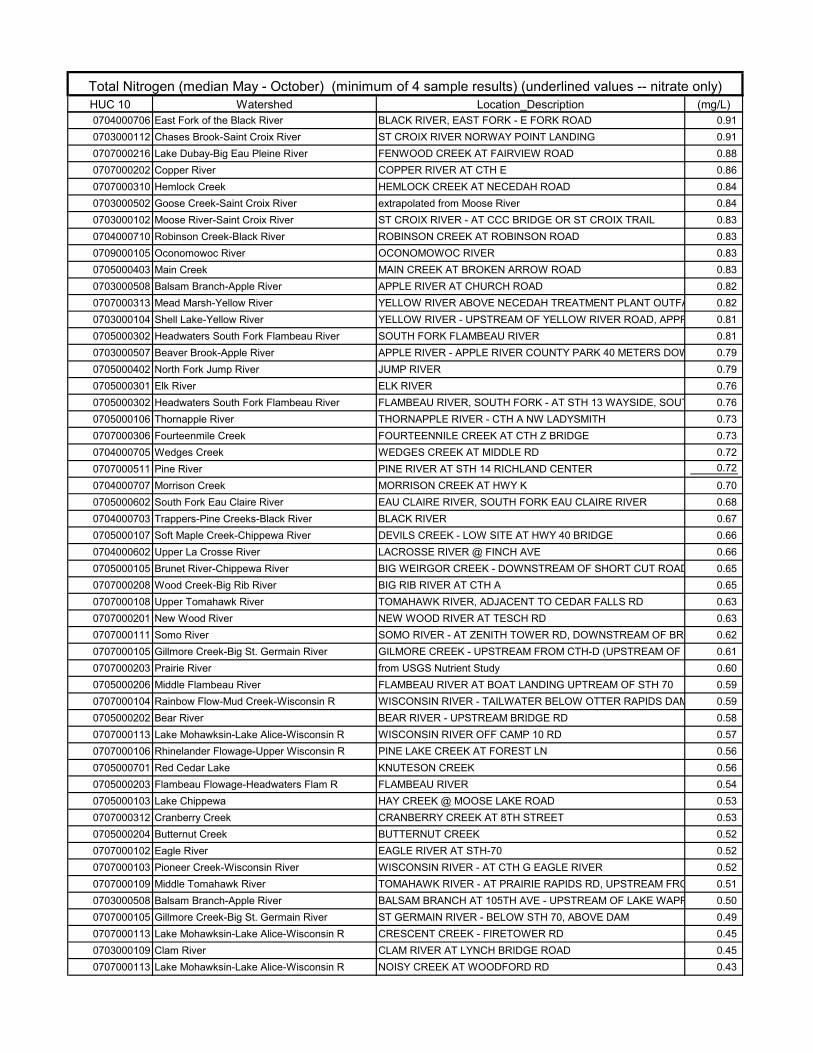
HUC 10 Watershed Location_Description Conc. (mg/L)
Total Nitrogen (median May - October) (minimum of 4 sample results) (underlined values -- nitrate only)
0704000706 East Fork of the Black River BLACK RIVER, EAST FORK - E FORK ROAD 0.91 0703000112 Chases Brook-Saint Croix River ST CROIX RIVER NORWAY POINT LANDING 0.91 0707000216 Lake Dubay-Big Eau Pleine River FENWOOD CREEK AT FAIRVIEW ROAD 0.88 0707000202 Copper River COPPER RIVER AT CTH E 0.86 0707000310 Hemlock Creek HEMLOCK CREEK AT NECEDAH ROAD 0.84 0703000502 Goose Creek-Saint Croix River extrapolated from Moose River 0.84 0703000102 Moose River-Saint Croix River ST CROIX RIVER - AT CCC BRIDGE OR ST CROIX TRAIL 0.83 0704000710 Robinson Creek-Black River ROBINSON CREEK AT ROBINSON ROAD 0.83 0709000105 Oconomowoc River OCONOMOWOC RIVER 0.83 0705000403 Main Creek MAIN CREEK AT BROKEN ARROW ROAD 0.83 0703000508 Balsam Branch-Apple River APPLE RIVER AT CHURCH ROAD 0.82 0707000313 Mead Marsh-Yellow River YELLOW RIVER ABOVE NECEDAH TREATMENT PLANT OUTFALL 0.82 0703000104 Shell Lake-Yellow River YELLOW RIVER - UPSTREAM OF YELLOW RIVER ROAD, APPROX 10 METERS0.81 0705000302 Headwaters South Fork Flambeau River SOUTH FORK FLAMBEAU RIVER 0.81 0703000507 Beaver Brook-Apple River APPLE RIVER - APPLE RIVER COUNTY PARK 40 METERS DOWNSTREAM OF0.79 0705000402 North Fork Jump River JUMP RIVER 0.79 0705000301 Elk River ELK RIVER 0.76 0705000302 Headwaters South Fork Flambeau River FLAMBEAU RIVER, SOUTH FORK - AT STH 13 WAYSIDE, SOUTH OF FIFIELD0.76 0705000106 Thornapple River THORNAPPLE RIVER - CTH A NW LADYSMITH 0.73 0707000306 Fourteenmile Creek FOURTEENNILE CREEK AT CTH Z BRIDGE 0.73 0704000705 Wedges Creek WEDGES CREEK AT MIDDLE RD 0.72 0707000511 Pine River PINE RIVER AT STH 14 RICHLAND CENTER 0.72
0704000707 Morrison Creek MORRISON CREEK AT HWY K 0.70 0705000602 South Fork Eau Claire River EAU CLAIRE RIVER, SOUTH FORK EAU CLAIRE RIVER 0.68 0704000703 Trappers-Pine Creeks-Black River BLACK RIVER 0.67 0705000107 Soft Maple Creek-Chippewa River DEVILS CREEK - LOW SITE AT HWY 40 BRIDGE 0.66 0704000602 Upper La Crosse River LACROSSE RIVER @ FINCH AVE 0.66 0705000105 Brunet River-Chippewa River BIG WEIRGOR CREEK - DOWNSTREAM OF SHORT CUT ROAD 0.65 0707000208 Wood Creek-Big Rib River BIG RIB RIVER AT CTH A 0.65 0707000108 Upper Tomahawk River TOMAHAWK RIVER, ADJACENT TO CEDAR FALLS RD 0.63 0707000201 New Wood River NEW WOOD RIVER AT TESCH RD 0.63 0707000111 Somo River SOMO RIVER - AT ZENITH TOWER RD, DOWNSTREAM OF BRIDGE 0.62 0707000105 Gillmore Creek-Big St. Germain River GILMORE CREEK - UPSTREAM FROM CTH-D (UPSTREAM OF HIGHWAY)0.61 0707000203 Prairie River from USGS Nutrient Study 0.60 0705000206 Middle Flambeau River FLAMBEAU RIVER AT BOAT LANDING UPTREAM OF STH 70 0.59 0707000104 Rainbow Flow-Mud Creek-Wisconsin R WISCONSIN RIVER - TAILWATER BELOW OTTER RAPIDS DAM 0.59 0705000202 Bear River BEAR RIVER - UPSTREAM BRIDGE RD 0.58 0707000113 Lake Mohawksin-Lake Alice-Wisconsin R WISCONSIN RIVER OFF CAMP 10 RD 0.57 0707000106 Rhinelander Flowage-Upper Wisconsin R PINE LAKE CREEK AT FOREST LN 0.56 0705000701 Red Cedar Lake KNUTESON CREEK 0.56 0705000203 Flambeau Flowage-Headwaters Flam R FLAMBEAU RIVER 0.54 0705000103 Lake Chippewa HAY CREEK @ MOOSE LAKE ROAD 0.53 0707000312 Cranberry Creek CRANBERRY CREEK AT 8TH STREET 0.53 0705000204 Butternut Creek BUTTERNUT CREEK 0.52 0707000102 Eagle River EAGLE RIVER AT STH-70 0.52 0707000103 Pioneer Creek-Wisconsin River WISCONSIN RIVER - AT CTH G EAGLE RIVER 0.52 0707000109 Middle Tomahawk River TOMAHAWK RIVER - AT PRAIRIE RAPIDS RD, UPSTREAM FROM BRIDGE0.51 0703000508 Balsam Branch-Apple River BALSAM BRANCH AT 105TH AVE - UPSTREAM OF LAKE WAPPOGASSETT0.50 0707000105 Gillmore Creek-Big St. Germain River ST GERMAIN RIVER - BELOW STH 70, ABOVE DAM 0.49 0707000113 Lake Mohawksin-Lake Alice-Wisconsin R CRESCENT CREEK - FIRETOWER RD 0.45 0703000109 Clam River CLAM RIVER AT LYNCH BRIDGE ROAD 0.45 0707000113 Lake Mohawksin-Lake Alice-Wisconsin R NOISY CREEK AT WOODFORD RD 0.43
kgenskow
Typewritten Text
B-18

HUC 10 Watershed Location_Description Conc. (mg/L)
Total Nitrogen (median May - October) (minimum of 4 sample results) (underlined values -- nitrate only)
0703000501 Wood River WOOD RIVER AT WEST RIVER ROAD CROSSING (1MI ABOVE ST CROIX R)0.40
0705000206 Middle Flambeau River PINE CREEK AT CTY HWY EE 0.40 0703000204 Namekagon River NAMEKAGON RIVER DOWNSTREAM OF NAMEKAGON TRAIL APPROX 30 METERS0.39 0703000105 Yellow Lake-Yellow River YELLOW RIVER DOWNSTREAM OF LOWEST HWY 35 CROSSING APPROX 20 METERS0.38 0707000101 Deerskin River DEERSKIN RIVER AT RANGLINE RD 0.37 0705000201 Manitowish River MANITOWISH RIVER - NEXT TO BENSON LAKE ROAD 0.36 0707000302 Mill Creek MILL CREEK AT CTH PP BRIDGE 0.36
0707000303 City of Stevens Point-Wisconsin River extrapolated from Mill Creek 0.36
0705000201 Manitowish River TROUT RIVER BELOW WILD RICE LAKE 0.35 0703000201 Upper Namekagon River NAMEKAGON RIVER @ HOSPITAL RD 0.33 0707000110 Lower Tomahawk River LITTLE RICE CREEK AT CTH-N 0.33 0705000104 Couderay River COUDERAY RIVER 0.31 0703000505 Trade River TRADE RIVER AT EVERGREEN AVENUE 0.26
0705000704 Lake Chetek CHETEK RIVER AT 4 1/2 AVENUE CROSSING 0.23
0705000503 Lake Wissota YELLOW RIVER AT CTH XX 0.18 0707000112 Spirit River SPIRIT RIVER-BELOW CONFLUENCE WITH SQUAW CREED 0.10
0707000107 Pelican River PELICAN RIVER AT GERMOND RD 0.07
0705000101 West Fork Chippewa River WEST FORK CHIPPEWA RIVER ADJACENT TO COUNTY HIGHWAY S0.06
0705000102 East Fork Chippewa River CHIPPEWA RIVER, EAST FORK - CTH B ABOVE FLOWAGE 0.06
0703000202 Trego Lake-Namekagon River NAMEKAGON RIVER 0.05
0705000205 Upper Flambeau River NORTH FORK FLAMBEAU RIVER AT HOLTS LANDING 0.04
0703000201 Upper Namekagon River NAMEKAGON RIVER 0.03
0705000205 Upper Flambeau River NORTH FORK FLAMBEAU RIVER BELOW CROWLEY DAM 0.03
0703000203 Totagatic River TOTAGATIC RIVER AT THOMPSON BRIDGE ROAD CROSSING 0.02
0703000101 Upper St. Croix-Eau Claire Rivers ST CROIX RIVER AT OLD HWY 53 0.00
0703000103 Upper Tamarack River UPPER TAMARACK RIVER AT CTH T BRIDGE 0.00
0703000108 North Fork of the Clam River NORTH FORK CLAM RIVER AT MALONE ROAD CROSSING 0.00
0704000104 Hay Creek-Mississippi River na na0709000409 Keith Creek-Rock River na na0703000106 Lower Tamarack River na na0704000107 Lake Pepin na na0709000312 Waddams Creek-Pecatonica River na na0709000316 Pecatonica River na na0709000408 Sugar Creek na na0712000403 Bull Creek-Des Plaines River na na
kgenskow
Typewritten Text
B-19