Wisconsin Public Health Profiles
13
Births Deaths Hospitalizations Population, Employment and Poverty Estimates Cancer Communicable Disease Motor Vehicle Crashes Technical Notes Normal birthweight babies: 93% of live births Wisconsin: 92.6% of live births Preventable hospitalizations: 11.8 per 1,000 population Wisconsin: 13.2 per 1,000 population 186.5 per 100,000 population Wisconsin: 179.3 per 100,000 population Public Health Profiles, Wisconsin 2017, presents selected data on population characteristics, natality, mortality, morbidity, local health departments, long-term care, and hospitalizations for Wisconsin residents for calendar year 2015. Data were selected to profile important aspects of public health for the state as a whole, each of the 72 counties, the five Division of Public Health regions, the seven perinatal regions, all sub-county local health departments, and cities with a population over 35,000. Wisconsin Public Health Profiles 2017 | SHEBOYGAN COUNTY Deaths related to alcohol and other drugs: (For conditions where timely and effective ambulatory care can reduce likelihood of hospitalization) (Alcohol, tobacco, or other drugs listed on death certificate as underlying or contributing cause. May reflect mention of multiple substances.) (2,500+ grams) Table of Contents BIRTH OUTCOMES ACCESS TO HIGH QUALITY HEALTH SERVICES SUBSTANCE ABUSE Office of Health Informatics Division of Public Health Wisconsin Department of Health Services
Transcript of Wisconsin Public Health Profiles

Births
Deaths
Hospitalizations
Population, Employment and Poverty Estimates
Cancer
Communicable Disease
Motor Vehicle Crashes
Technical Notes
Normal birthweight babies: 93% of live births
Wisconsin: 92.6% of live births
Preventable hospitalizations: 11.8 per 1,000 population
Wisconsin: 13.2 per 1,000 population
186.5 per 100,000 population
Wisconsin: 179.3 per 100,000 population
Public Health Profiles, Wisconsin 2017, presents selected data on population characteristics, natality, mortality, morbidity, local health departments, long-term care, and
hospitalizations for Wisconsin residents for calendar year 2015. Data were selected to profile important aspects of public health for the state as a whole, each of the 72
counties, the five Division of Public Health regions, the seven perinatal regions, all sub-county local health departments, and cities with a population over 35,000.
Wisconsin Public Health Profiles2017 | SHEBOYGAN COUNTY
Deaths related to alcohol and other drugs:
(For conditions where timely and effective
ambulatory care can reduce likelihood of
hospitalization)
(Alcohol, tobacco, or other drugs listed on death
certificate as underlying or contributing cause. May
reflect mention of multiple substances.)
(2,500+ grams)
Table of Contents
BIRTH OUTCOMES
ACCESS TO HIGH QUALITY HEALTH SERVICES
SUBSTANCE ABUSE
Office of Health Informatics Division of Public Health Wisconsin Department of Health Services

Marital Births %
Married 846 65.0
Not 464 35.0
1,310 Unknown 0 0.0
11.4
66.1 Elementary or less 25 2.0Some high school 89 7.0High school graduate 412 31.0
Births % Some college 414 32.0
24 2.0 College graduate 366 28.0
908 69.0 Unknown 4 0.3
171 13.0 Smoking
153 12.0 Smoker 263 20.0
2 0.2 Nonsmoker 1,025 78.0
48 4.0 Unknown 22 0.0
4 0.3
0 0.0 INFANT CHARACTERISTICS
Birthweight Births %
3 0.2 < 1,500 gm 9 0.7
1-4 21 2.0 1,500-2,499 gm 83 6.3
5-9 150 11.0 2,500+ gm 1,218 93.0
10-12 513 39.0 Unknown 0 0.0
13+ 581 44.0 Birth Order
42 3.0 First 443 34.0Second 396 30.0
1,054 80.0 Third 276 21.0
198 15.0 Fourth or higher 193 15.0
34 3.0 Unknown 2 0.2
3 0.2
21 2.0 Reported congenital anomalies ¹ 11 0.8
Race/Ethnicity Births % Births % Births % Births % Births %
White 997 76.0 56 5.6 842 84.0 116 12.0 39 4.0
Black/African-American 24 2.0 2 8.3 16 67.0 6 25.0 2 8.0
American Indian 2 0.2 0 0.0 0 0.0 0 0.0 0 0.0
Hispanic/Latino 114 9.0 14 12.3 82 72.0 23 20.0 9 8.0
Asian 137 10.0 16 11.7 85 62.0 46 34.0 6 4.0
Two or more races 28 2.0 3 10.7 23 82.0 3 11.0 2 7.0
Other/Unknown 8 1.0 1 12.5 5 63.0 3 38.0 0 0.0
Fertility rate
Age Births (per 1,000) Births % Births % Births % Births %
< 15 0 -- 0 0.0 0 0.0 0 0.0 0 0.0
15-17 17 . 2 11.8 9 53 6 35.0 2 12.0
18-19 54 38.0 7 13.0 38 70 14 26.0 2 4.0
20-24 279 89.0 23 8.2 208 75 56 20.0 15 5.0
25-29 418 136.0 25 6.0 334 80 69 17.0 15 4.0
30-34 376 108.0 23 6.1 327 87 31 8.0 18 5.0
35-39 140 43.0 9 6.4 119 85 17 12.0 4 3.0
40+ 26 8.0 3 11.5 19 73 5 19.0 2 8.0
Unknown 0 -- 0 0.0 0 0.0 0 0.0 0 0.0
Teen Births 71 20.0
Unknown
Trimester of First Prenatal Visit
All Births LBW First Second Other/Unk.
Other/Unknown
BIRTHS
MATERNAL CHARACTERISTICS
TOTAL BIRTHS
PREGNANCY CHARACTERISTICS
Vaginal after prev. cesarean
Other vaginal
Primary cesarean
Repeat cesarean
Delivery Type
Education
2017 Profile for Sheboygan County
MATERNAL CHARACTERISTICS AND BIRTH OUTCOMES
Crude live birth rate (per 1,000)
General fertility rate (per 1,000)
Cesarean (unk. repeat/primary)
No visits
Unknown
First Prenatal Care Visit
First trimester
Second trimester
Third trimester
No visits
Prenatal Care Visits
Total live births
Vaginal vacuum
Forceps
DEFINITIONS
Birthweight - infant weight at time of delivery (reported here in grams).
Live birth - complete expulsion or extraction of an infant from its mother, irrespective of the duration of pregnancy, which after such separation breathes or shows any other evidence of life, such as beating of the heart, pulsation of the umbilical cord, or definite movement of voluntary muscles.
Low birthweight (LBW) - birthweight of a liveborn infant of less than 2,500 gm (5lbs, 8oz) regardless of gestational age.
Smoking status - a mother is defined as a smoker if she reports smoking cigarettes at any time during or three months prior to the pregnancy. This is not comparable to Wisconsin data on maternal smoking for births prior to 2011.
Teen birth - births in which the mother was less than 20 years old.
MEASURES
Crude live birth rate - number of live births per 1,000 population.
General fertility rate - number of live births per 1,000 women of childbearing age (15-44).
Age-specific fertility rate - number of births to women in an age category, per 1,000 women of that age.
Teen fertility rate - number of live births to females under 20 years of age per 1,000 females age 15-19.
NOTES
¹ Live births with reported congenital anomalies. Due to the change in Wisconsin birth data collection beginning in 2011, the number of live births with reported congenital anomalies in 2011 and subsequent years cannot be compared with the number in 2010 and earlier years.
Natality data are drawn from birth certificates maintained by the Vital Records Section, Division of Public Health. This report presents data from the calendar year 2015.
DATA DETAILS
These data include characteristics of the infant and pregnancy (birthweight, delivery method, birth order, trimester of first prenatal care visit, and number of prenatal care visits) and attributes of the mother (age, marital status, education, race/ethnicity, and smoking status).
Data include records on all births to state residents, including those that occur outside Wisconsin. Out-of-state records are obtained from the state of occurrence. Thus, county birth data include all births to county residents regardless of where the births occurred.
DEATHS
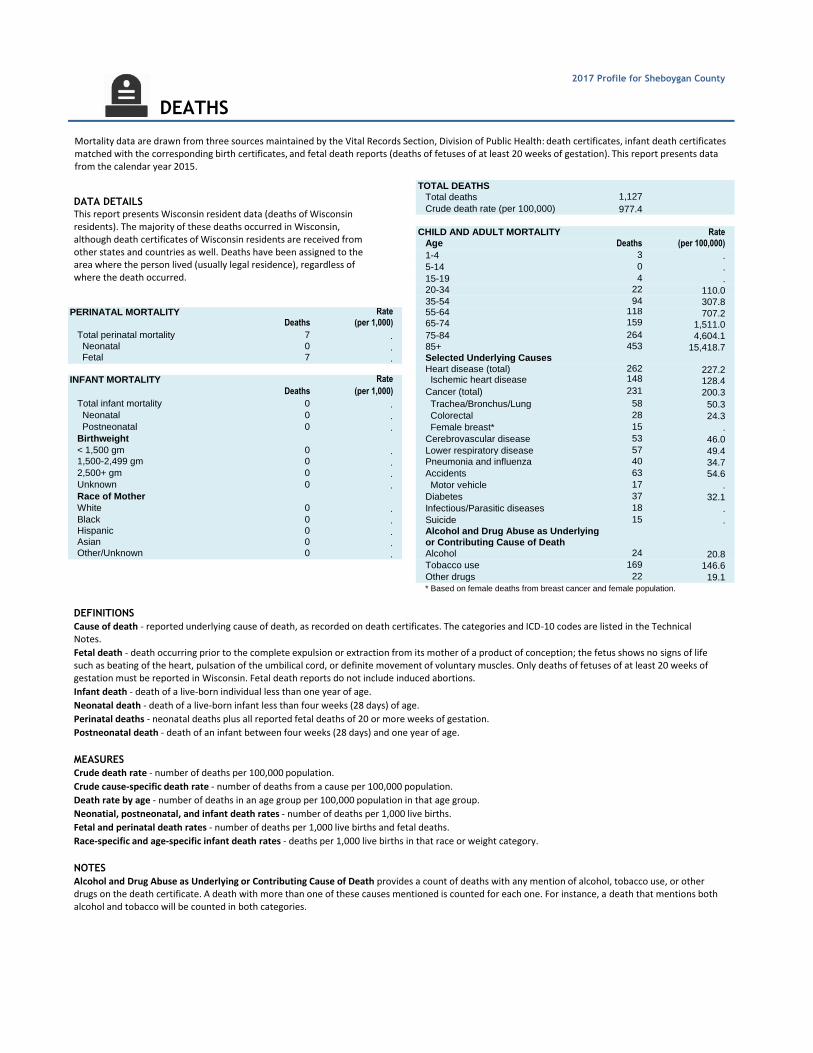
TOTAL DEATHS
Total deaths 1,127
Crude death rate (per 100,000) 977.4
CHILD AND ADULT MORTALITY Rate
Age Deaths (per 100,000)
1-4 3 .
5-14 0 .
15-19 4 .20-34 22 110.035-54 94 307.8
Rate 55-64 118 707.2Deaths (per 1,000) 65-74 159 1,511.0
Total perinatal mortality 7 . 75-84 264 4,604.1 Neonatal 0 . 85+ 453 15,418.7 Fetal 7 . Selected Underlying Causes
Heart disease (total) 262 227.2INFANT MORTALITY Rate Ischemic heart disease 148 128.4
Deaths (per 1,000) Cancer (total) 231 200.3Total infant mortality 0 . Trachea/Bronchus/Lung 58 50.3 Neonatal 0 . Colorectal 28 24.3 Postneonatal 0 . Female breast* 15 .Birthweight Cerebrovascular disease 53 46.0< 1,500 gm 0 . Lower respiratory disease 57 49.41,500-2,499 gm 0 . Pneumonia and influenza 40 34.72,500+ gm 0 . Accidents 63 54.6Unknown 0 . Motor vehicle 17 .Race of Mother Diabetes 37 32.1White 0 . Infectious/Parasitic diseases 18 .Black 0 . Suicide 15 .Hispanic 0 . Alcohol and Drug Abuse as UnderlyingAsian 0 . or Contributing Cause of DeathOther/Unknown 0 . Alcohol 24 20.8
Tobacco use 169 146.6
Other drugs 22 19.1
2017 Profile for Sheboygan County
PERINATAL MORTALITY
* Based on female deaths from breast cancer and female population.
Mortality data are drawn from three sources maintained by the Vital Records Section, Division of Public Health: death certificates, infant death certificates matched with the corresponding birth certificates, and fetal death reports (deaths of fetuses of at least 20 weeks of gestation). This report presents data from the calendar year 2015.
DATA DETAILS This report presents Wisconsin resident data (deaths of Wisconsin residents). The majority of these deaths occurred in Wisconsin, although death certificates of Wisconsin residents are received from other states and countries as well. Deaths have been assigned to the area where the person lived (usually legal residence), regardless of where the death occurred.
DEFINITIONS
Cause of death - reported underlying cause of death, as recorded on death certificates. The categories and ICD-10 codes are listed in the Technical Notes.
Fetal death - death occurring prior to the complete expulsion or extraction from its mother of a product of conception; the fetus shows no signs of life such as beating of the heart, pulsation of the umbilical cord, or definite movement of voluntary muscles. Only deaths of fetuses of at least 20 weeks of gestation must be reported in Wisconsin. Fetal death reports do not include induced abortions.
Infant death - death of a live-born individual less than one year of age.
Neonatal death - death of a live-born infant less than four weeks (28 days) of age.
Perinatal deaths - neonatal deaths plus all reported fetal deaths of 20 or more weeks of gestation.
Postneonatal death - death of an infant between four weeks (28 days) and one year of age.
MEASURES
Crude death rate - number of deaths per 100,000 population.
Crude cause-specific death rate - number of deaths from a cause per 100,000 population.
Death rate by age - number of deaths in an age group per 100,000 population in that age group.
Neonatial, postneonatal, and infant death rates - number of deaths per 1,000 live births.
Fetal and perinatal death rates - number of deaths per 1,000 live births and fetal deaths.
Race-specific and age-specific infant death rates - deaths per 1,000 live births in that race or weight category.
NOTES
Alcohol and Drug Abuse as Underlying or Contributing Cause of Death provides a count of deaths with any mention of alcohol, tobacco use, or other drugs on the death certificate. A death with more than one of these causes mentioned is counted for each one. For instance, a death that mentions both alcohol and tobacco will be counted in both categories.

TOTAL HOSPITALIZATIONS Rate Average Charge
Cases (per 1,000) LOS charge per capita Cause by selected age group Rate Average Charge
Total 8,407 72.9 3.8 $30,459 $2,221 Cases (per 1,000) LOS charge per capita
Age
<18 1,375 53.1 3.5 $14,262 $757 Total 114 1.0 3.0 $23,608 $23
18-44 2,181 59.4 3.1 $19,936 $1,184 65+ 27 1.4 3.9 $31,639 $45
45-64 2,051 61.2 4.1 $40,684 $2,491 CARDIOVASCULAR DISEASE
65+ 2,800 145.9 4.2 $39,118 $5,706 Coronary Heart Disease
Total 355 3.1 4.0 $74,092 $228
Cause by selected age group Rate Average Charge 45-64 129 3.9 3.1 $71,402 $275
Cases (per 1,000) LOS charge per capita 65+ 213 11.1 4.5 $75,700 $840
Injury: All Total 225 2.0 3.8 $38,277 $75
Total 764 6.6 4.3 $45,007 $298 45-64 67 2.0 4.1 $46,932 $94
<18 28 1.1 4.0 $33,225 $36 65+ 150 7.8 3.7 $33,077 $258
18-44 127 3.5 4.2 $45,300 $157 CHRONIC PULMONARY DISEASE45-64 226 6.7 4.4 $48,872 $330 Asthma65+ 383 20.0 4.3 $43,490 $868 Total 47 0.4 2.5 $13,918 $6
Injury: Hip Fracture <18 3 .
Total 123 1.1 4.2 $43,559 $46 18-44 16 .
65+ 114 5.9 4.2 $43,212 $257 45-64 20 0.6 2.7 $14,277 $9
Injury: Poisonings 65+ 8 .
Total 77 0.7 2.6 $21,436 $14
18-44 35 1.0 2.3 $20,640 $20 Total 94 0.8 3.3 $18,982 $15
DRUG and ALCOHOL USE 45-64 26 0.8 2.8 $17,893 $14
Alcohol-Related 65+ 68 3.5 3.5 $19,399 $69
Total 343 3.0 3.5 $14,849 $44
18-44 116 3.2 3.3 $12,233 $39 Total 333 2.9 4.0 $21,727 $63
45-64 211 6.3 3.6 $16,388 $103 <18 24 0.9 3.8 $22,839 $21
45-64 65 1.9 4.4 $25,237 $49
Total 70 0.6 3.7 $11,579 $7 65+ 222 11.6 4.1 $21,025 $243
18-44 59 1.6 3.8 $11,632 $19
Malignant Neoplasms (Cancers): All
Total 999 8.7 5.7 $15,291 $132 Total 337 2.9 5.5 $62,714 $183
<18 184 7.1 6.6 $18,100 $129 18-44 18 .
18-44 538 14.7 4.8 $12,601 $185 45-64 135 4.0 4.4 $56,335 $227
45-64 240 7.2 6.2 $17,498 $125 65+ 176 9.2 6.0 $61,828 $567
65+ 37 1.9 10.7 $26,130 $50
Total 17 .
Total 1,356 11.8 4.2 $27,570 $324
<18 77 3.0 2.9 $23,939 $71 Total 48 0.4 6.6 $48,895 $20
18-44 164 4.5 3.7 $24,075 $108 65+ 31 1.6 6.7 $45,212 $73
45-64 363 10.8 4.8 $31,339 $340
65+ 752 39.2 4.2 $26,885 $1,053 Total 8 . 3.8 $48,179 $12
PNEUMONIA and INFLUENZA
Other Chronic Obstructive Pulmonary Disease
Drug-related
Neoplasms: Colorectal
MENTAL DISORDERS
Neoplasms: Lung
Cerebrovascular Disease
DIABETES
PREVENTABLE HOSPITALIZATIONS
2017 Profile for Sheboygan County
NEOPLASMS
Neoplasms: Female Breast (rates for female population)
Hospitalizations
INJURY-RELATED
Hospitalization data are obtained from hospital inpatient discharge files prepared by the Health Analytics Section, Division of Public Health (DPH), from data collected by the Wisconsin Hospital Association Information Center. This report presents data from the calendar year 2015.
DEFINITIONS
Length of stay (LOS) - average duration, in days, of a single episode of hospitalization for an individual with the specified condition.
Preventable hospitalizations - Hospitalizations for conditions where timely and effective ambulatory care can reduce the likelihood of hospitalization (see Technical Notes).
MEASURES
Average charge - total charges within a particular diagnostic category and age group divided by the number of discharges with reported charges in that group.
Charge per capita - total charges divided by the estimated total population (within age groups: age-specific charges divided by the estimated age-specific population).
Rate of discharge - number of discharges in that diagnostic category and age group per 1,000 population in that age group.
Rate of discharge for female breast neoplasms - number of discharges in that diagnostic category per 1,000 women.
NOTES
Length of stay and charge outliers were defined as values below the first percentile or above the 99th percentile (i.e., the highest 1 percent and the lowest 1 percent). In these cases, the length of stay or charge was set to the first or 99th percentile value. Since reporting of charges is optional for lengths of stay over 100 days, the charges for those cases with a missing charge and length of stay over 100 days were also set to the 99th percentile value.
DATA DETAILS Diagnostic definitions used for the categories are based on the principal diagnosis. Hospitalizations are measured as inpatient discharges. Hospitalizations for an individual can occur more than once due to multiple admissions and transferring between hospitals. The diagnoses most affected by transfers are malignant neoplasms, mental disorders, cerebrovascular disease, coronary heart disease, and injury-related diagnoses. Between 2011 and 2013, the Public Health Profiles included records for Wisconsin residents treated in Minnesota hospitals. From 2014 on, the Public Health Profiles include records for Wisconsin residents treated in both Minnesota and Iowa hospitals. Therefore, counts and rates of hospitalizations in the affected counties changed substantially and caution is advised when comparing across data years. Counts and rates remain underestimated for those counties whose residents receive a significant amount of care in Michigan or Illinois hospitals. From Quarter 4, 2015, the hospital inpatient discharge data starts to report all diagnoses with ICD-10 code. The Wisconsin Hospital Association Information Center provided the translation of the ICD-10 code for Quarter 4, 2015 to ICD-9 codes to get the data for the whole year. They used the CMS standard described at http://www.nber.org/gem/GEMs-CrosswalksBasicFAQ.pdf. This report used their translated codes. Due to definition changes for some diagnoses between ICD-9 and ICD-10 codes (asthma for example), caution is advised when comparing 2015 and forward data with previous years of data.

Estimate (%) (C.I. ±)Total 2015 115,310 All ages 9% 1.3%
13 Ages 0-17 11.8% 2.3%
224
12
-114
59
(place of work)Female Male Total
Total 57,320 57,985 115,310 Annual
Age Average
0-14 10,390 10,950 21,340 Civilian labor force 61,368
15-17 2,180 2,378 4,560 Unemployment rate 3.8%
18-19 1,430 1,550 2,980 five-year avg. unemployment rate (2010-2014) 5.72%
20-24 3,120 3,310 6,430
25-44 13,100 14,210 27,310 Median household income $58,190
45-64 16,490 17,000 33,500 14
65-84 8,660 7,600 16,260
85+ 1,950 993 2,940
Race/Ethnicity
White 49,720 49,170 98,890
African American 860 1,610 2,470
American Indian 230 270 500
Hispanic 3,360 3,760 7,120
Asian 3,150 3,180 6,330
Rank in median household income (1-72)
LABOR FORCE ESTIMATES
Population growth 2011-2015 Average wage for jobs covered
County rank in 5-year population growth (1-72) by unemployment compensation
$44,732
County population rank (1-72)
Population per square mile
County rank in population density (1-72) EMPLOYMENT
POVERTY ESTIMATESPOPULATION ESTIMATES
2017 Profile for Sheboygan County
Population
The population by age, sex, race, and ethnicity was estimated for July 1, 2015, by the Health Analytics Section, Division of Public Health. Estimates of poverty and median household income in Wisconsin were obtained from the U.S. Census Bureau's Small Area Income and Poverty Estimates (SAIPE) program website. Employment statistics (civilian labor force, unemployment rate, and average wage) were obtained from the Division of Workforce Solutions, Wisconsin Department of Workforce Development.
DEFINITIONS Civilian labor force - includes all persons 16 years of age or over who are either working or looking for work. This statistic does not include members of the armed forces; "discouraged workers" who are not actively seeking employment, about to start a new job, or waiting to be called back from a layoff; or other people (such as students or retired persons) not working or looking for work. Employed persons - individuals 16 years or older who worked for pay anytime during the week that includes the 12th day of the month, or who worked unpaid for 15 hours or more in a family-owned business, or who were temporarily absent from their jobs due to illness, bad weather, vacation, labor dispute, or personal reasons. Unemployed persons - individuals 16 years or older who had no employment, were available for work, and either actively seeking employment, about to start a new job, or waiting to be called back from a layoff. NOTES Estimated populations are reported rounded to the nearest 10. The race/ethnicity categories are mutually exclusive (racial categories exclude Hispanics). Estimated populations are reported rounded to the nearest 10. Poverty Estimates - A 90 percent confidence interval (C.I. ±) is printed in a column next to each estimated value; this means that 90 percent of similar surveys would obtain an estimated value within the confidence interval specified.

Crude incidence rate Age-adjusted rate Lower CI for Upper CI for
Cases (per 100,000) (per 100,000)
Age-Adjusted
rate
Age-Adjusted
rate
Female breast*
112 195.2 151.2 123.5 183.5
Melanoma 38 33 26.7 18.6 37.3
Colorectal 56 48.6 36.5 27.4 47.9
Lung and bronchus 73 63.3 45.9 35.8 58.2Prostate
*73 126 97.3 75.8 123.5
Total 667 578.5 458.7 423.6 496.2
*Rates include cases per 100,000 sex-specific population
Cancer
2017 Profile for Sheboygan County
PRIMARY SITE
Cancer incidence data are compiled from reports submitted by Wisconsin hospitals, clinics, and physicians to the Wisconsin Cancer Reporting System (WCRS), Health Analytics Section, Division of Public Health, as mandated under Wis. Stat. § 255.04. This report presents cancer incidence data for cases diagnosed in the calendar year 2014 (the latest data available).
DATA DETAILS The data presented are for primary invasive cancers (excluding noninvasive cases), except for premalignant bladder cancers, among Wisconsin residents. Primary cancers are defined by the site from which cancer originates; metastatic cancers that have spread from other original sites are not included. The county designation is based on a patient’s residence at the time of diagnosis. WCRS currently has interstate data exchange with 46 other states to capture resident cases diagnosed or treated in other states. (Minnesota does not participate in the interstate exchange system, so cancer cases from counties on the Minnesota border may not be reported, unless voluntarily reported by Minnesota facilities.) Late reporting from facilities result in those cases being added retrospectively and therefore the most recent year (2015) may be less complete than previous years. A high degree of variation is expected among counties, and counties with smaller populations (under 20,000) and fewer cases (under 20) have rates that are unstable over time. Case counts less than 6 are suppressed to protect patient confidentiality.
MEASURES Cancer Incidence – newly diagnosed cancer cases during a specific time period, as reported to the Wisconsin Cancer Reporting System (WCRS). Age adjusted Lower and Upper Confidence intervals - the upper and lower limits of a 95% confidence interval. Crude incidence rate – the number of cancer cases per 100,000 population for the population at risk for developing the disease. Crude rates are useful in determining the actual number of cases within a local population. Age-adjusted incidence rate – the incidence rate adjusted to a standard 2000 U.S. population, to account for different age distributions between populations. Age-adjusted incidence rates are better indicators of relative burden than unadjusted (crude) rates for comparing rates across geographic areas or between subgroups of the population that have different age distributions. Case counts – each cancer case is reported, so if one patient has two primary cancers, two cases are counted as incidence, although the number of patients with multiple cancers is very small. Reports from multiple facilities for the same case are consolidated into one final case report. Confidence Intervals - Confidence intervals are shown for age-adjusted rates and contains upper and lower limits with 95% probability of the incidence rate. The larger the confidence interval, the less precise the estimate and overlapping confidence intervals indicate the difference between rates is not statistically significant. Resource: Detailed, mapped data for additional cancer sites by county in Wisconsin are available at Cancer-Rates. Infohttp://www.cancer-rates.info/wi/

Cases
Babesiosis 0
Blastomycosis <5
Campylobacter enteritis 24
Cryptosporidiosis 9
E.coli, shiga toxin-producing (STEC) <5
Ehrlichiosis/Anaplasmosis 0
Giardiasis <5
Haemophilus influenzae, invasive <5
Yersiniosis 0
Listeriosis 0
Hepatitis B* 9
Hepatitis C 56
Influenza-associated hospitalization 5
Legionnaires' <5
Lyme <5
Measles 0
N. meningitidis (Meningococcal disease) 0
Meningitis, other bacterial 0
Mumps 0
Pertussis <5
Salmonellosis 16
Shigellosis 0
Streptococcus pneumoniae, invasive 7
Streptococcal diseases, all other 16
Tuberculosis <5
Sexually Transmitted Disease
Chlamydia trachomatis 332
Gonorrhea 28
Syphilis <5
*Includes all positive HBsAg test results.
Communicable Diseases
DISEASE
2017 Profile for Sheboygan County
Data for communicable diseases are shown for selected reportable diseases. Numbers of confirmed cases were obtained from the Bureau of Communicable Diseases, Division of Public Health. Wisconsin Stat. ch. 252 and Wis. Admin. Code ch. DHS 145 require the surveillance and control of certain communicable diseases. This report presents data from the calendar year 2015.
DATA DETAILS Completeness of reporting varies by disease. The figures for a county or region refer to reported cases among residents of that county or region, regardless of where the disease was contracted. Specific counts for a year are subject to some slight changes over time as medical tests reveal previously unidentified cases or change previous diagnoses.
NOTES
The symbol "<5" denotes that the number of reported cases is between 1 and 4. The exact number is suppressed to maintain confidentiality.
HepC: The totals for HepC include 25 cases with unknown county, and 252 cases from Department of Correction.

Persons Injured Persons Killed
All crashes 514 13
Alcohol-related 36 2
With citation for OWI 41 0
With citation for speeding 33 1
Motorcyclist 24 2
Bicyclist 23 1
Pedestrian 19 2
2017 Profile for Sheboygan County
Motor Vehicle Crashes
TYPE OF MOTOR VEHICLE CRASH
Data on injuries and fatalities in motor vehicle crashes are obtained from the WisDOT-DMV Traffic Accident Database of the Wisconsin Department of Transportation (DOT). This report presents data from the calendar year 2015.
DATA DETAILS These data are based on location of crash, not on residence. Motor vehicle crash data are occurrence data from the county in which the crash took place. (Most other data in the Profiles are based on the county of residence.) County statistics on persons injured and killed therefore do not include county residents who were injured or killed outside the county, and may include persons who are residents of other counties or other states.
DEFINITIONS Persons injured - persons who were physically harmed or complained of physical harm from injuries received in the crash, but did not die within 30 days of the crash. Persons killed - were all persons who died within 30 days from injuries received in the crash. Alcohol-related crash - a crash in which either a driver, bicyclist, or pedestrian is listed on a police or coroner report as drinking alcohol before the crash. Crashes with a citation for OWI - crashes in which a law enforcement official has issued a citation for violation of Wis. Stat. § 346.63, "operating under influence of intoxicant or other drug." NOTES These data are reported by state and local law enforcement agencies. Because crash data are from a different source, the number of "Persons Killed" in motor vehicle crashes will not match the number of deaths from "Accidents, Motor Vehicle" in the profile's Child and Adult Mortality section.

Suggested citation:
Wisconsin Department of Health Services, Division of Public Health, Office of Health Informatics, Health Analytics Section. Public Health Profiles,
Wisconsin 2016 (P-45358-17). August 2017.
Employment data were provided by the Bureau of Workforce Information, Division of Workforce Solutions, Wisconsin Department of Workforce
Development.
Motor vehicle crash data are maintained by the Wisconsin Department of Transportation (DOT), Division of Motor Vehicles, Traffic Accident Section.
Figures were compiled from that source by the Bureau of Transportation Safety in DOT's Division of State Patrol.
Comments, suggestions, and requests for information may be addressed to:
Health Analytics Section
Division of Public Health
P.O. Box 2659
Madison, WI 53701-2659
Email: [email protected]
Nursing home data were provided by the Division of Quality Assurance. Community Options Program data and Medicaid Waiver data were provided
by the Bureau of Long-Term Support, Division of Long Term Care. Data for eligible and waiting clients were also provided by this bureau. Family Care
data were derived from the Wisconsin Managed Care database. All of these entities are in the Department of Health Services.
2017 Profile for Sheboygan County
ABOUT THE DATA: DOCUMENTATION
Public Health Profiles, Wisconsin 2017, presents select data on population characteristics, births, deaths, morbidity, local health departments, long-
term care, and hospitalizations in Wisconsin for calendar year 2015. The data were selected to profile important aspects of public health for the state
as a whole, each of the 72 counties, the five Division of Public Health (DPH) regions, the seven perinatal regions, as well as 34 additional sub-county
local health departments and municipalities. Local public health professionals and others seeking general information about the health of Wisconsin’s
population use these data to establish yearly goals, conduct community health assessments, write grant proposals, and develop education and
outreach programs.
The Wisconsin Department of Health Services (DHS) provided funds for developing and disseminating this report. This report is produced by the Health
Analytics Section.
Most of the statistics included in this report came from data systems maintained in DPH. The DPH Health Analytics section provided mortality, birth,
and infant mortality data; 2015 population estimates; cancer incidence for 2014 (latest available); and prepared hospitalization data from the
inpatient discharge files, with data collected by the Wisconsin Hospital Association Information Center. The DPH Office of Policy and Practice
Alignment compiled Local Health Department Survey data for 2015 collected online via Select Survey. The Bureau of Communicable Diseases provided
morbidity data and immunization data. The Bureau of Community Health Promotion, Special Supplemental Nutrition Program for Women, Infants and
Children (WIC), provided WIC participant data. The Bureau of Environmental and Occupational Health provided licensed establishment data.

Crude live birth rate = 1,000 x Number of resident live births
Total resident population
General fertility rate = 1,000 x Number of resident live births
Number of females ages 15-44
Age-specific fertility rate = 1,000 x Number of resident live births in age category
Number of females in age category
Teen fertility rate = 1,000 x Number of resident live births to females under 20 years of age
Number of females under 20 years of age
Deaths
Crude death rate = 100,000 x Number of resident deaths
Total resident population
Crude cause-specific death rate = 100,000 x Number of resident deaths from cause
Total resident population
Fetal death rate = 1,000 x Number of resident fetal deaths
Total resident live births and fetal deaths
Neonatal death rate = 1,000 x Number of resident neonatal deaths
Total resident live births
Postneonatal death rate = 1,000 x Number of resident postneonatal deaths
Total resident live births
Perinatal death rate = 1,000 x Number of resident fetal and neonatal deaths
Total resident live births and fetal deaths
Infant death rate = 1,000 x Number of resident infant deaths
Total resident live births
Race-specific infant death rate = 1,000 x Number of infant deaths to mothers in race category
Number of live births to mothers in race category
Weight-specific infant death rate = 1,000 x Number of infant deaths in birthweight category
Number of live births in birthweight category
Formulas for Birth and Death Rates
Births

Description ICD-10 CODE
Infectious and Parasitic Diseases A00-B99
Total Malignant Neoplasms C00-C97
Trachea, bronchus, lung cancer C33-C34
Breast cancer C50
Colorectal cancer C18-C21
Diabetes E10-E14
Diseases of the Heart I00-I09, I11, I13, I20-I51
Ischemic heart disease I20-I25
Cerebrovascular Disease I60-I69
Pneumonia and Influenza J09-J18
Chronic Lower Respiratory Disease J40-J47
Total Accidents V01-X59, Y85-Y86
Motor vehicle accidents (crashes) V02-V04, V09.0-V09.2, V12-V14, V19.0-V19.2, V19.4-V19.6, V20-V79,
V80.3-V80.5,V81.0-V81.1, V82.0-V82.1, V83-V86,
V87.0-V87.8, V88.0-V88.8, V89.0,V89.2
Intentional self-harm (suicide) U-03, X60-X84, Y87.0
Alcohol F10-F10.9, G31.2, G62.1, I42.6, K29.2, K70, R78.0, X45, X65, Y15
Tobacco F17.9
Other Drugs F11.0-F11.5, F11.7-F11.9, F12.0-F12.5,
F12.7-F12.9, F13.0-F13.5, F13.7-F13.9,
F14.0-F14.5, F14.7-F14.9, F15.0-F15.5,
F15.7-F15.9, F16.0-F16.5, F16.7-F16.9,
F17.0, F17.3-F17.5, F17.7-F17.8, F18.0-F18.5, F18.7-F18.9, F19.0-F19.5,
F19.7-F19.9, X40-X44, X60-X64, X85, Y10-Y14
Categories of Underlying Cause of Death
Drugs Listed as Underlying or Contributory Cause of Death
Rates
Most rates per population included in the Public Health Profiles were calculated using 2014 population data. A crude rate is the number of events per
1,000 (or 10,000 or 100,000) people. It is called "crude" because its magnitude may be affected by the population's age distribution. In contrast, an age-
specific or age-standardized rate considers age distribution, and would be preferred over a crude rate for comparisons between populations with
different age distributions.
Rates for some events were not calculated. For most measures numerators of fewer than 20 events (indicated by ".") were judged to be too small to
calculate rates that are meaningful; such rates would be misleadingly unstable over time because small annual fluctuations in the number of events
can create large changes in a rate. Calculation of other rates was not done for other reasons (indicated by "--"); for example, the population base for a
fertility rate for females under 15 years old cannot be estimated accurately.

Description ICD-9-CM CODE
Malignant neoplasms 140.0-208.9, 230.0-234.9
Lung cancer 162.0-162.9
Female breast cancer 174.0-174.9
Colorectal cancer 153.0-154.8
Diabetes 250.0-250.9
Alcohol-related
Alcohol psychoses 291.0-291.9
Alcohol dependence syndrome 303.0-303.03
Alcohol abuse 305.00-305.03
Alcoholic polyneuropathy 357.5
Alcoholic cardiomyopathy 425.5
Alcoholic gastritis 535.3
Chronic liver disease and cirrhosis 571.0-571.3
Excessive blood level of alcohol 790.3
Drug-related
Drug psychoses 292.0-292.9
Drug dependency 304.00-304.93
Nondependent abuse of drugs 305.10-305.93
290.0-319
Coronary heart disease
Ischemic heart disease 410.0-414.9
Unspecified cardiovascular disease 429.2
Cerebrovascular disease 430-438
Pneumonia and influenza 480.0-487.8
Other chronic obstructive pulmonary disease 490-492, 494-496
Asthma 493
Osteoporosis 733.00-733.09
All injuries 800-999
Hip fracture 820.00-820.9
Poisonings 960.0-989.9
First-Listed Diagnoses Associated With Hospitalizations
Mental Disorders (excluding those related to alcohol or drugs)

Description ICD-9-CM CODE
Congenital syphilis 090.0-090.9 (includes secondary diagnosis for newborns)
Immunization-preventable conditions 033.0-033.9, 390, 391.0-391.9, 037, 045.00-045.93, (320.0 - age 1-5)
345.0-345.9
Convulsions 780.3 (age >5)
Severe ear, nose, and throat infections 382.0-382.9, 462, 463, 465.0-465.9, 472.1 (except with a procedure of
20.01)Pulmonary tuberculosis 011.00-011.96
Other tuberculosis 012.00-018.96
Chronic obstructive pulmonary disease 491.0-492.8, 494, 496, (466.0 with secondary diagnosis of 491.0-
492.8, 494, 496)Bacterial pneumonia 481, 482.2, 482.3, 482.9, 483, 485, 486 (except when there is a
secondary diagnosis of 282.6 or patient is less than two months old)
Asthma 493.00-493.91
Congestive heart failure 428.0-428.9, 402.01, 402.11, 402.91, 518.4 (except with a procedure
of 36.01-36.02, 36.05, 36.1, 37.5, 37.7)Hypertension 401.0, 401.9, 402.00, 402.1, 402.90 (except with a procedure 36.01-
36.02, 36.05, 36.1, 37.5, 37.7)Angina 411.1, 411.8, 413.0-413.9 (except with any procedure 01.01-86.99)
Cellulitis 681.00-683, 686.0-686.9 (except with any procedure 01.01-86.99
unless only listed procedure is 86.0)Skin grafts with cellulitis DRG 263 and 264 (except if admitted from an SNF)
Diabetes A 250.10-250.31
Diabetes B 250.80-250.91
Diabetes C 250.00-250.01
Hypoglycemia 251.2
Gastroenteritis 558.9
Kidney/urinary infection 590.0-590.9, 599.0, 599.9
Dehydration–volume depletion 276.5
Iron deficiency anemia 280.1, 280.8, 280.9 (age 0-5 only; either principal or secondary
diagnosis)Nutritional deficiencies 260-262, 268.0, 268.1 (either principal or secondary diagnosis)
Failure to thrive 783.4 (age <1)
Pelvic inflammatory disease 614.0-614.9 (except with a procedure 68.3-68.8)
Dental conditions 521.0-523.9, 525.0-525.9, 528.0-528.9
Cancer of the cervix 180.0-180.9
Grand mal status and other epileptic convulsions
Diagnoses Defining Preventable Hospitalizations(Principal Diagnosis only except where noted)
The list of conditions included in preventable hospitalizations was adapted with some modification from a study done between 1991 and 1994 by
the United Hospital Fund of New York (Billings J., Anderson G.M. and Newman L.S. "Recent Findings on Preventable Hospitalizations." Health
Affairs, 15(3): 239–249, 1996). The diagnoses were defined by a medical panel of internists and pediatricians, and included conditions where
timely and effective ambulatory care can reduce the likelihood of hospitalization by preventing the onset of an illness or condition, controlling an
acute episodic illness or condition, or managing a chronic disease or condition. The descriptions and ICD-9-CM diagnostic codes for each
preventable hospitalization category are listed below.