Authors: McCarthy et al., ASCO 2010 Abstract: 807 Reviewed by: Dr. Tom Kouroukis
Upload
flora-pearsonCategory
view
215download
0
Wisconsin Education Challenges
Tom McCarthy, Communications Officer Wisconsin Department of Public Instruction

Changing Faces of Wisconsin
Poverty is Growing in WisconsinChange in Free & Reduced Lunch (2001-2012)
Source: Wisconsin Department of Public Instruction. School Finance Maps. http://dpi.wi.gov/sfs/maps.html
In many rural districts, more than half the students are eligible for free-and-reduced lunch.
Wisconsin FRL Rate Doubles
2001: 21%2012: 43%

Students are in Fewer DistrictsChange Student Membership (2001-2012)
In 2001, 1/3rd of districts were in declining enrollment.
By 2012, over 2/3rds districts were in declining enrollment.
Today, 75% of our students are located in just 30% of our districts.
Wisconsin FRL Rate Doubles
2001: 21%2012: 43%
Cumulativ
e Enrollment
Percentile
# of District
s
% of District
s 209,535 25% 8 2% 419,387 50% 41 11% 626,834 75% 114 30% 871,551 100% 424 100%
Source: Wisconsin Department of Public Instruction. School Finance Maps. http://dpi.wi.gov/sfs/maps.html
District Enrollment % of DistrictsUnder 1,000 55%Under 3,000 83%Under 10,000 98%

Which Means Rural Districts Have Fewer Kids & Greater Poverty
Wisconsin FRL Rate Doubles
2001: 21%2012: 43%
Source: Wisconsin Department of Public Instruction. School Finance Maps. http://dpi.wi.gov/sfs/maps.html
Why Does it Matter?
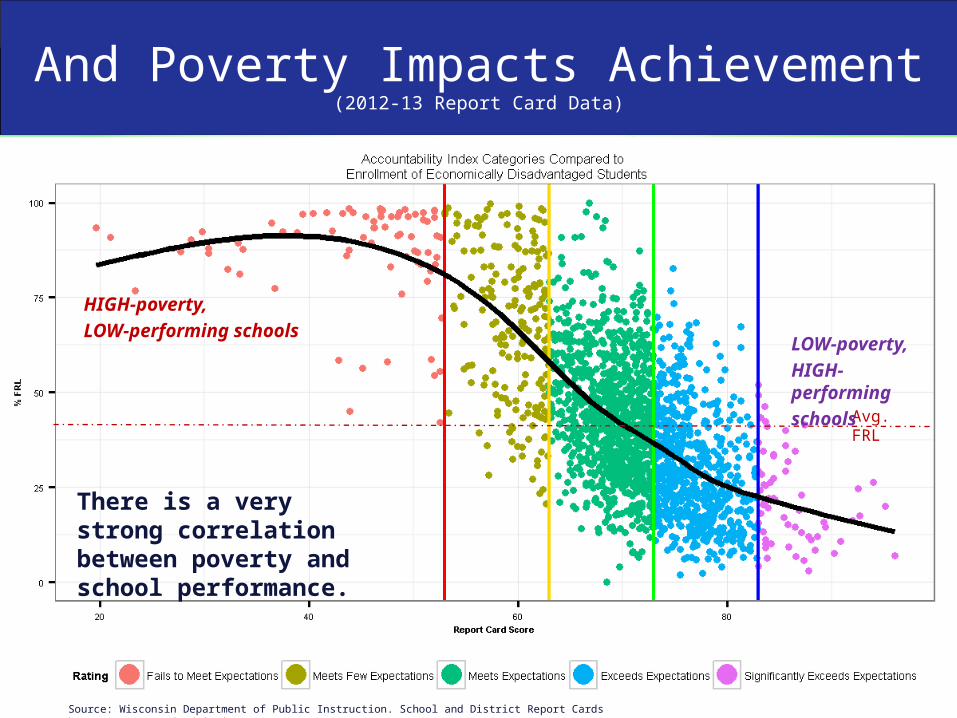
And Poverty Impacts Achievement(2012-13 Report Card Data)
There is a very strong correlation between poverty and school performance.
Avg. FRL
HIGH-poverty, LOW-performing schools
LOW-poverty, HIGH-performing schools
Source: Wisconsin Department of Public Instruction. School and District Report Cards http://reportcards.dpi.wi.gov/

But Poverty Can’t Explain Any the Racial Achievement Gap
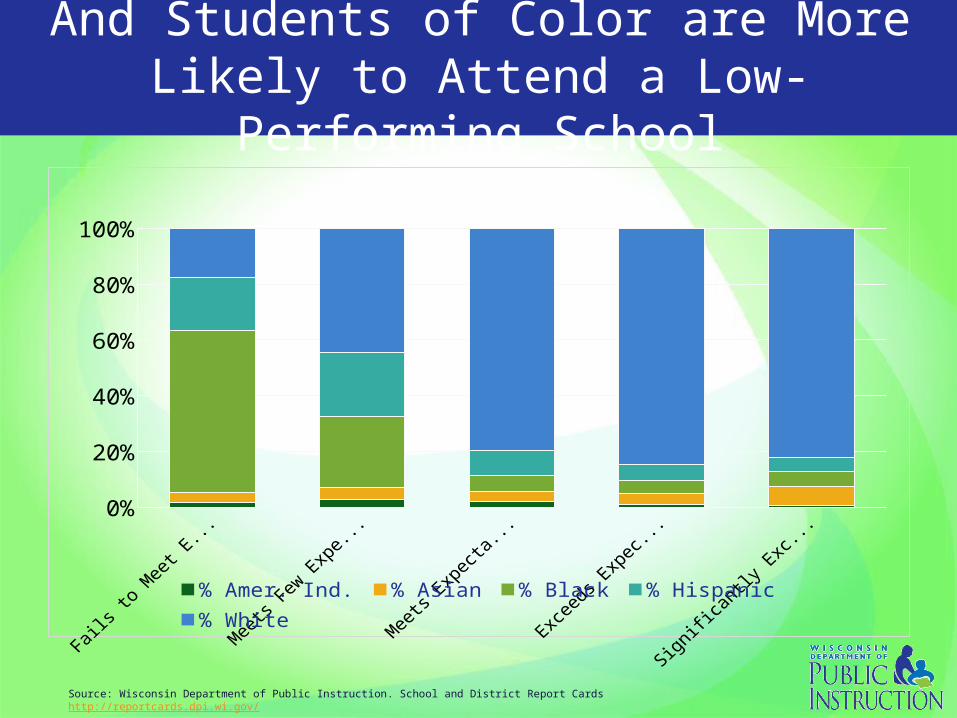
And Students of Color are More Likely to Attend a Low-Performing
School
0%10%20%30%40%50%60%70%80%90%
100%
% Amer. Ind. % Asian % Black % Hispanic % White
Source: Wisconsin Department of Public Instruction. School and District Report Cards http://reportcards.dpi.wi.gov/
Vouchers & Charters Expansion
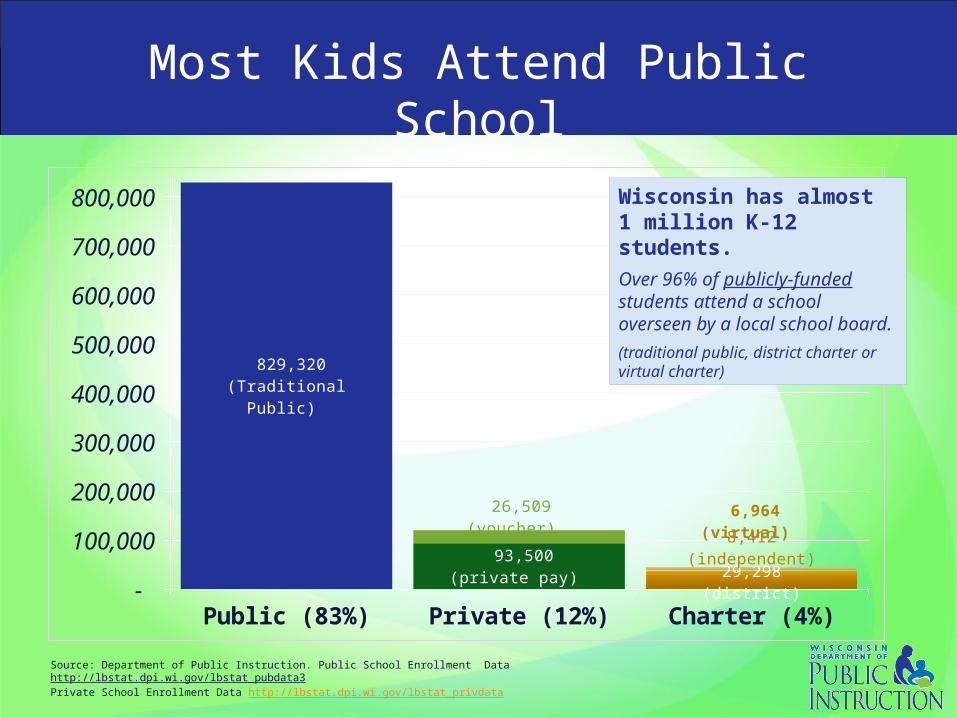
Most Kids Attend Public School
Public (83%) Private (12%) Charter (4%) -
100,000
200,000
300,000
400,000
500,000
600,000
700,000
800,000
829,320(Traditional
Public)
93,500 (private pay) 29,298 (district)
26,509 (voucher) 8,412 (inde-
pendent)
6,964 (virtual)
Source: Department of Public Instruction. Public School Enrollment Data http://lbstat.dpi.wi.gov/lbstat_pubdata3 Private School Enrollment Data http://lbstat.dpi.wi.gov/lbstat_privdata
Wisconsin has almost 1 million K-12 students.Over 96% of publicly-funded students attend a school overseen by a local school board.
(traditional public, district charter or virtual charter)
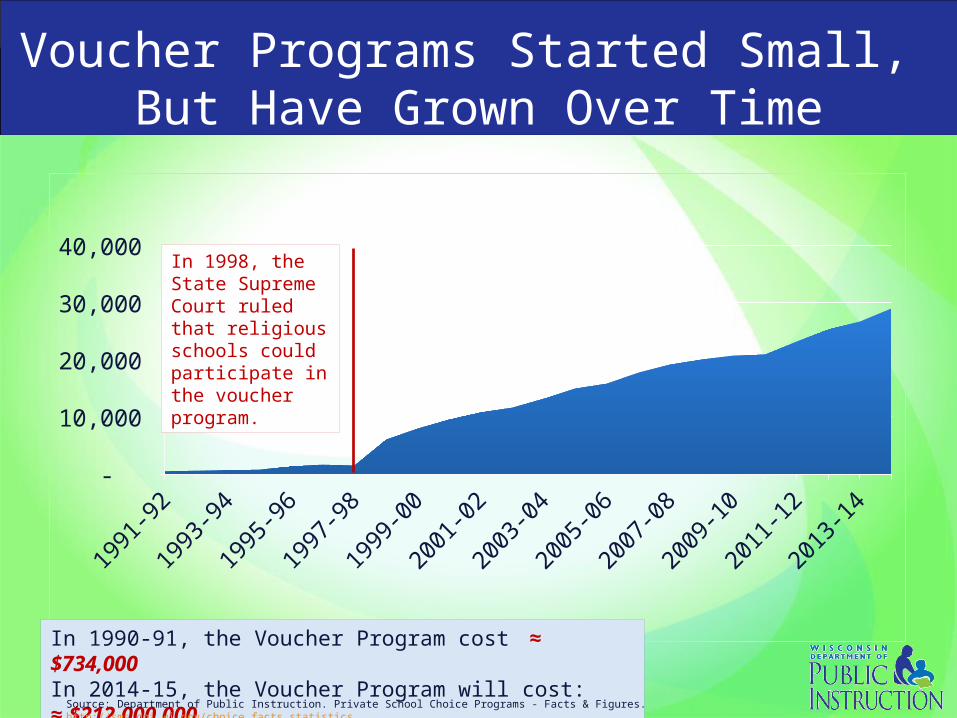
Voucher Programs Started Small, But Have Grown Over Time
1991
-92
1993
-94
1995
-96
1997
-98
1999
-00
2001
-02
2003
-04
2005
-06
2007
-08
2009
-10
2011
-12
2013
-14
- 5,000
10,000 15,000 20,000 25,000 30,000 35,000
341
In 1998, the State Supreme Court ruled that religious schools could participate in the voucher program.
In 1990-91, the Voucher Program cost ≈ $734,000In 2014-15, the Voucher Program will cost: ≈ $212,000,000
Source: Department of Public Instruction. Private School Choice Programs - Facts & Figures. http://sms.dpi.wi.gov/choice_facts_statistics
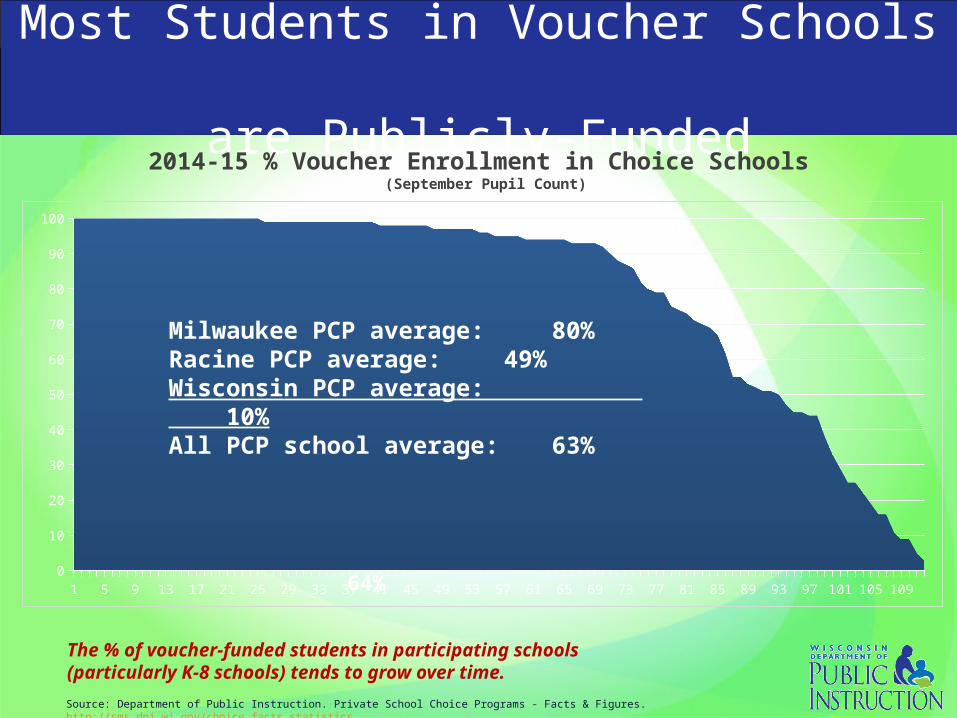
Most Students in Voucher Schools are Publicly-Funded
Milwaukee PCP average: 79%
Racine PCP average: 44%
Wisconsin PCP average: 4%
All PCP schools average:64%
The % of voucher-funded students in participating schools (particularly K-8 schools) tends to grow over time.
Source: Department of Public Instruction. Private School Choice Programs - Facts & Figures. http://sms.dpi.wi.gov/choice_facts_statistics
1 4 7 10 13 16 19 22 25 28 31 34 37 40 43 46 49 52 55 58 61 64 67 70 73 76 79 82 85 88 91 94 97 100 103 106 109 1120
10
20
30
40
50
60
70
80
90
100
2014-15 % Voucher Enrollment in Choice Schools (September Pupil Count)
Milwaukee PCP average: 80%
Racine PCP average: 49%Wisconsin PCP average: 10%All PCP school average:
63%
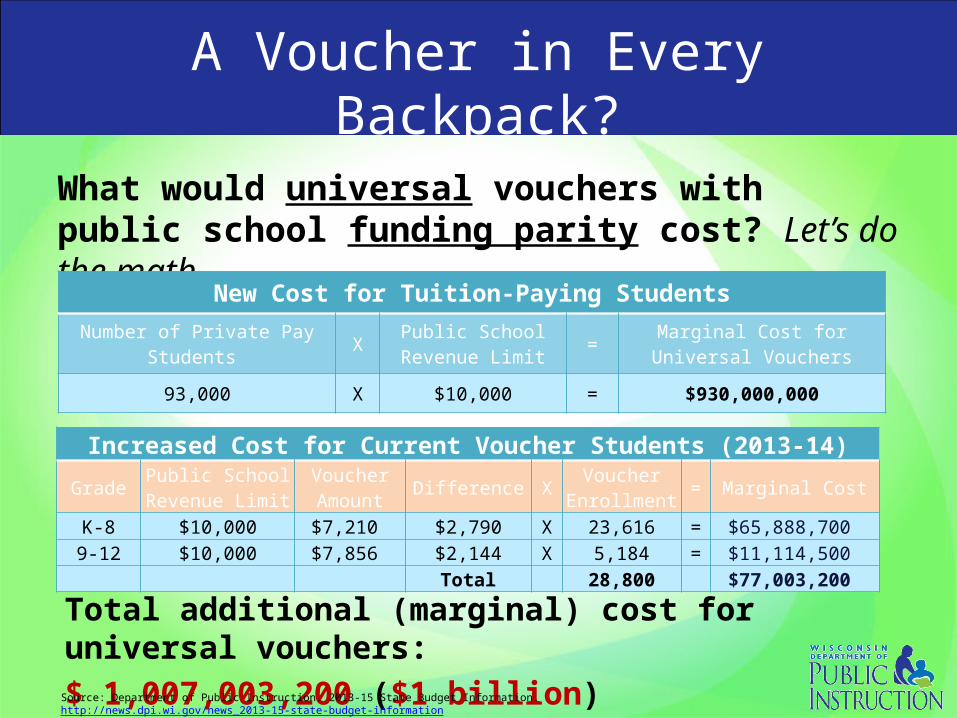
A Voucher in Every Backpack?
What would universal vouchers with public school funding parity cost? Let’s do the math…
New Cost for Tuition-Paying StudentsNumber of Private Pay
Students X
Public SchoolRevenue Limit
=Marginal Cost for
Universal Vouchers
93,000 X $10,000 = $930,000,000
Increased Cost for Current Voucher Students (2013-14)
GradePublic School Revenue Limit
Voucher Amount
Difference XVoucher
Enrollment= Marginal Cost
K-8 $10,000 $7,210 $2,790 X 23,616 = $65,888,700 9-12 $10,000 $7,856 $2,144 X 5,184 = $11,114,500
Total 28,800 $77,003,200
Total additional (marginal) cost for universal vouchers:$ 1,007,003,200 ($1 billion)Source: Department of Public Instruction. 2013-15 State Budget Information. http://news.dpi.wi.gov/news_2013-15-state-budget-information
Note: calculations are updated to determine marginal, rather than total program costs.
School Finance Challenges

School Funding – Simplified!
Property Tax Levy
State Equalization
Aid
Revenue Limit
Categorical AidFederal FundsOther Revenue
Outside the Revenue Limit
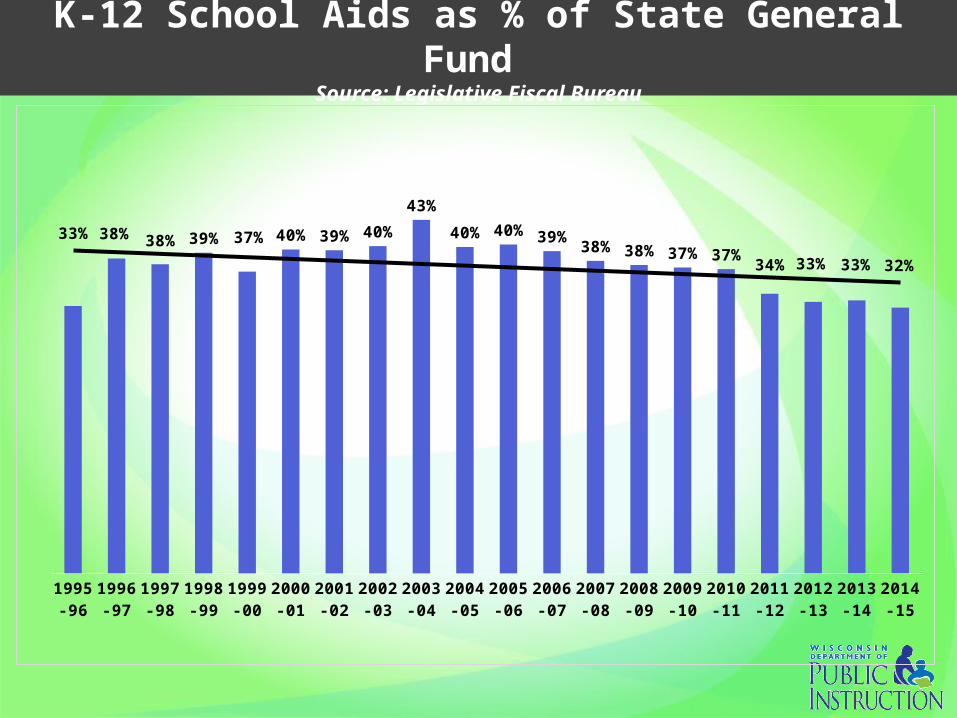
K-12 School Aids as % of State General Fund Source: Legislative Fiscal Bureau
1995-96
1996-97
1997-98
1998-99
1999-00
2000-01
2001-02
2002-03
2003-04
2004-05
2005-06
2006-07
2007-08
2008-09
2009-10
2010-11
2011-12
2012-13
2013-14
2014-15
33% 38% 38% 39% 37% 40% 39% 40%
43%
40% 40% 39%38% 38% 37% 37%
34% 33% 33% 32%
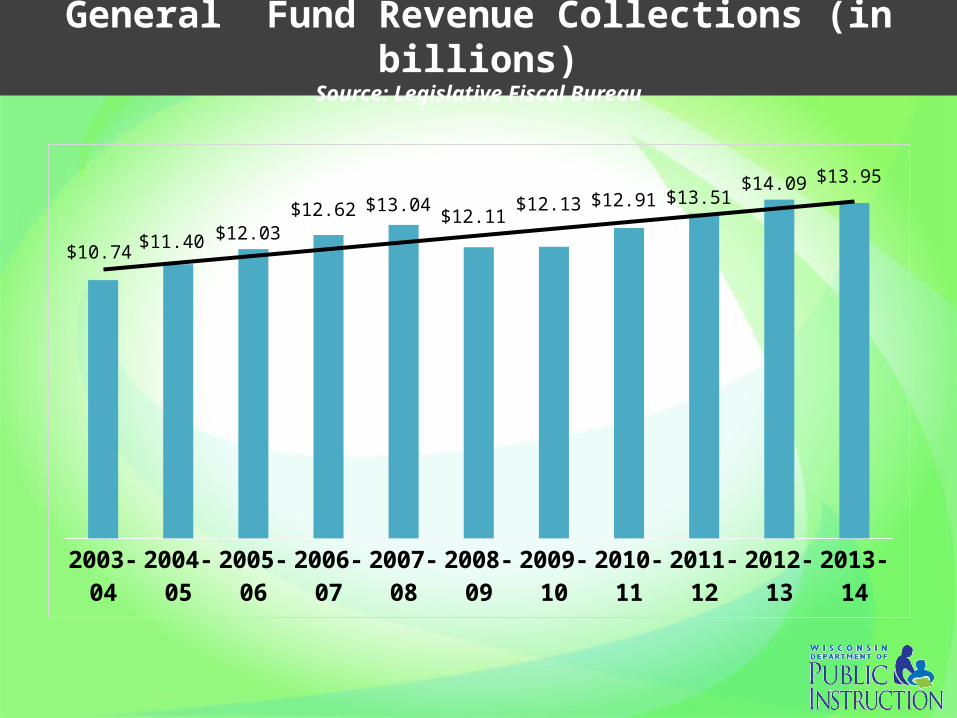
General Fund Revenue Collections (in billions)Source: Legislative Fiscal Bureau
2003-04
2004-05
2005-06
2006-07
2007-08
2008-09
2009-10
2010-11
2011-12
2012-13
2013-14
$10.74 $11.40 $12.03
$12.62 $13.04 $12.11
$12.13 $12.91 $13.51 $14.09 $13.95

During the Great Recession, Revenue Limits Were Cut …
1993
-94
1994
-95
1995
-96
1996
-97
1997
-98
1998
-99
1999
-00
2000
-01
2001
-02
2002
-03
2003
-04
2004
-05
2005
-06
2006
-07
2007
-08
2008
-09
2009
-10
2010
-11
2011
-12*
2012
-13
2013
-14
2014
-15
$(600)
$(500)
$(400)
$(300)
$(200)
$(100)
$-
$100
$200
$300
$400
Change in Per-Pupil Revenue Over Time
Pep-Pupil Aid Revenue Limit Change
Source: Department of Public Instruction. 2011-13 State Budget. http://pb.dpi.wi.gov/pb_11-13_budget 2013-15 State Budget. http://news.dpi.wi.gov/news_2013-15-state-budget-information
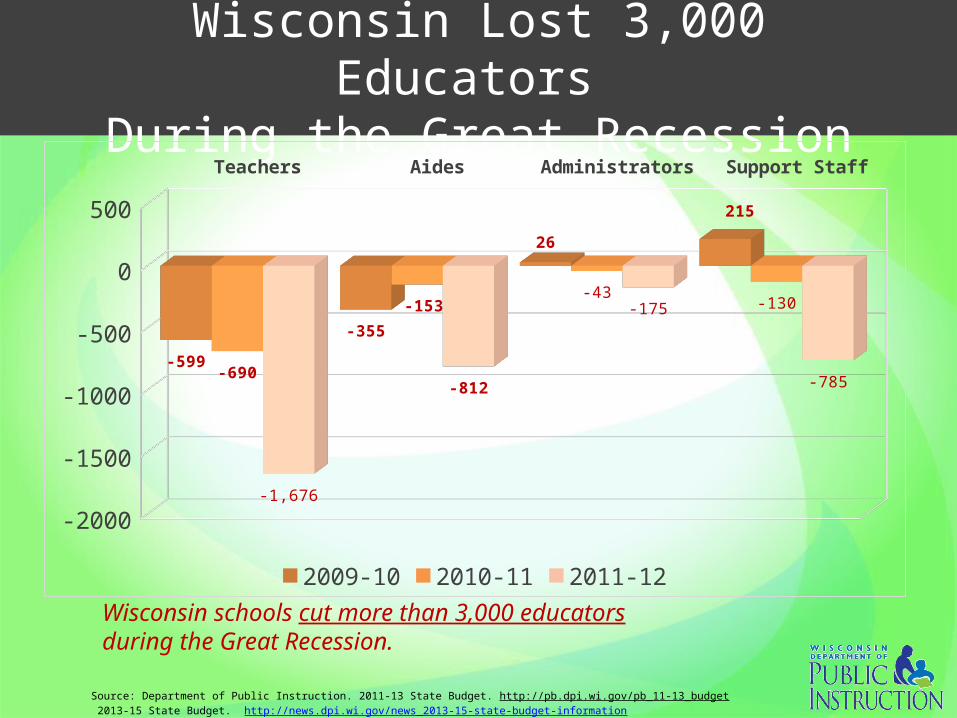
Wisconsin Lost 3,000 Educators During the Great Recession
Teachers Aides Administrators Support Staff
-2000
-1500
-1000
-500
0
500
-599
-355
26
215
-690
-153-43
-130
-1,676
-812
-175
-785
2009-10 2010-11 2011-12Wisconsin schools cut more than 3,000 educators during the Great Recession.
Source: Department of Public Instruction. 2011-13 State Budget. http://pb.dpi.wi.gov/pb_11-13_budget 2013-15 State Budget. http://news.dpi.wi.gov/news_2013-15-state-budget-information
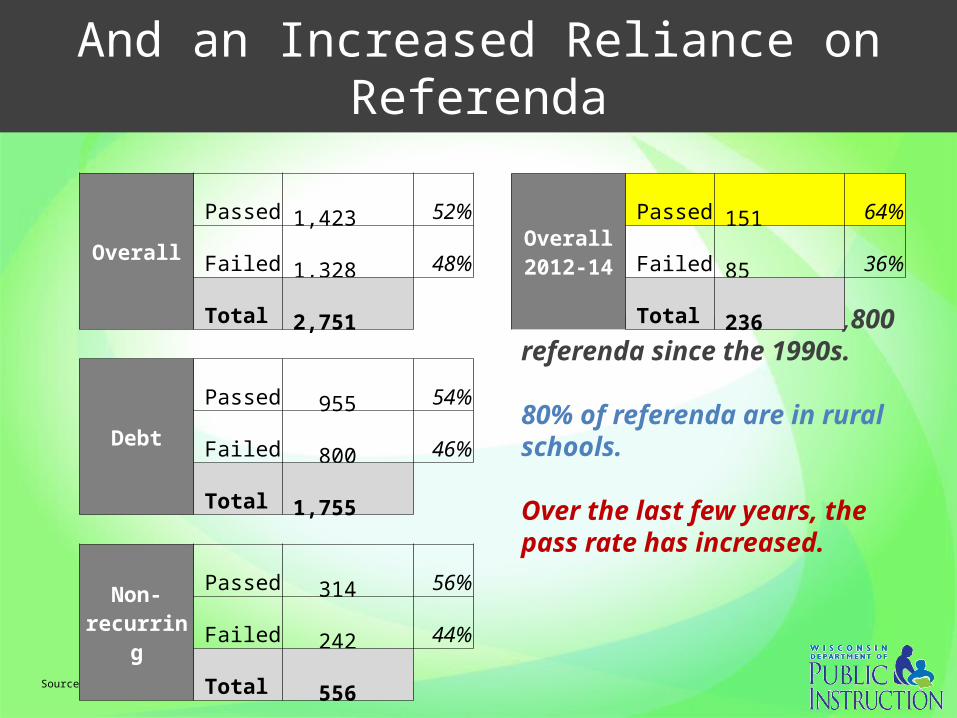
And an Increased Reliance on Referenda
Source: Legislative Fiscal Bureau
Overall
Passed 1,423 52%
Failed 1,328 48%
Total 2,751
Debt
Passed 955 54%
Failed 800 46%
Total 1,755
Non-recurring
Passed 314 56%
Failed 242 44%
Total 556
Recurring
Passed 154 35%
Failed 286 65%
Total 440
There have been almost 2,800 referenda since the 1990s.
80% of referenda are in rural schools.
Over the last few years, the pass rate has increased.
Overall2012-14
Passed 151 64%Failed 85 36%
Total 236
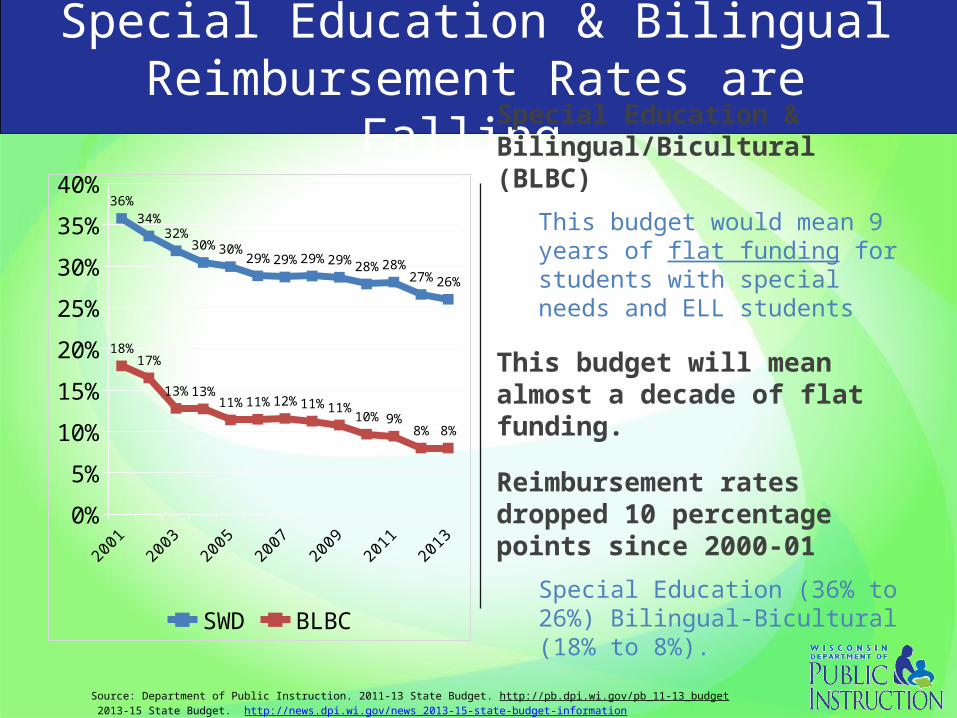
Special Education & Bilingual Reimbursement Rates are Falling
2001
2003
2005
2007
2009
2011
2013
0%
5%
10%
15%
20%
25%
30%
35%
40%36%
34%32%
30%30%29%29%29%29%28%28%
27%26%
18%17%
13%13%11%11%12%11%11%
10%9%8% 8%
SWD BLBC
Special Education & Bilingual/Bicultural (BLBC)
This budget would mean 9 years of flat funding for students with special needs and ELL students
This budget will mean almost a decade of flat funding.
Reimbursement rates dropped 10 percentage points since 2000-01
Special Education (36% to 26%) Bilingual-Bicultural (18% to 8%).
Source: Department of Public Instruction. 2011-13 State Budget. http://pb.dpi.wi.gov/pb_11-13_budget 2013-15 State Budget. http://news.dpi.wi.gov/news_2013-15-state-budget-information
2015-17 Executive Budget Proposal
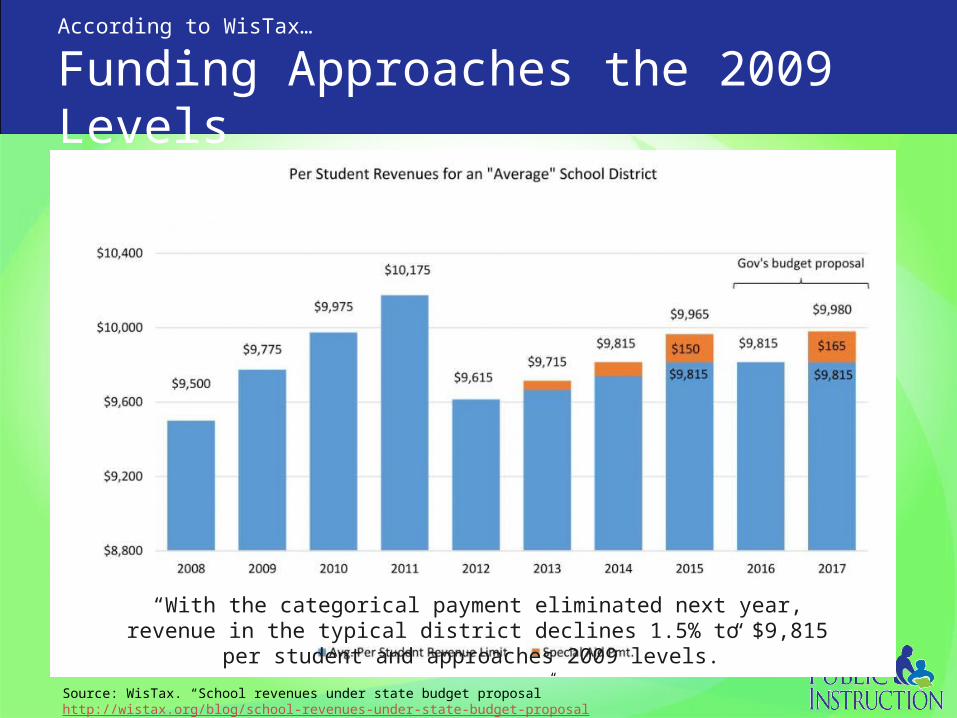
According to WisTax…
Funding Approaches the 2009 Levels
“With the categorical payment eliminated next year, revenue in the typical district declines 1.5% to $9,815 per student and approaches 2009 levels.”
Source: WisTax. “School revenues under state budget proposal” http://wistax.org/blog/school-revenues-under-state-budget-proposal
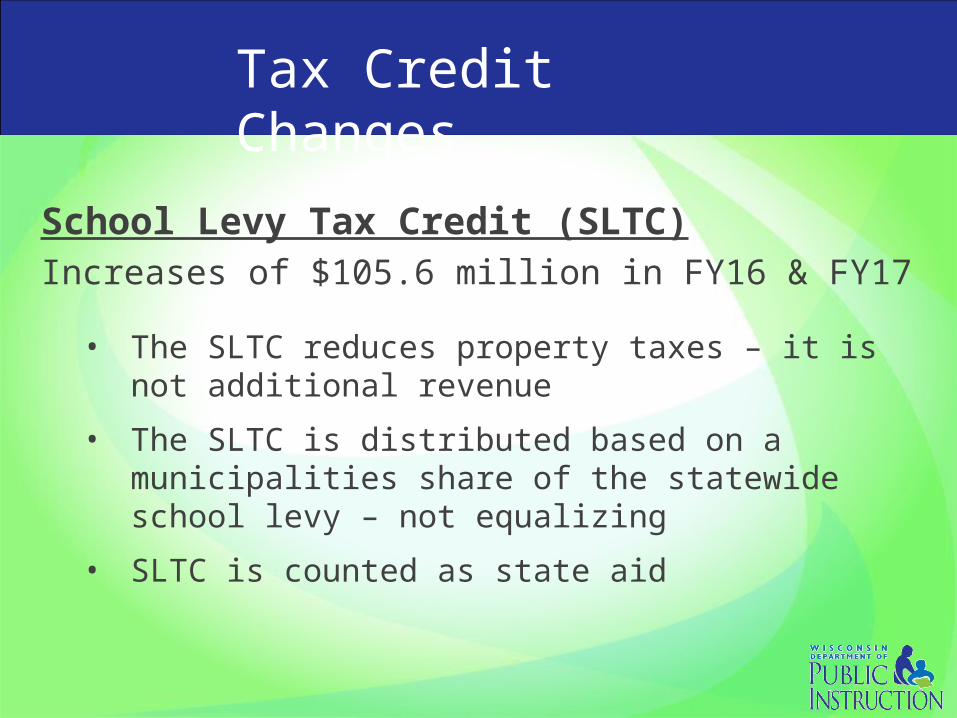
School Levy Tax Credit (SLTC)Increases of $105.6 million in FY16 & FY17
• The SLTC reduces property taxes – it is not additional revenue
• The SLTC is distributed based on a municipalities share of the statewide school levy – not equalizing
• SLTC is counted as state aid
Tax Credit Changes
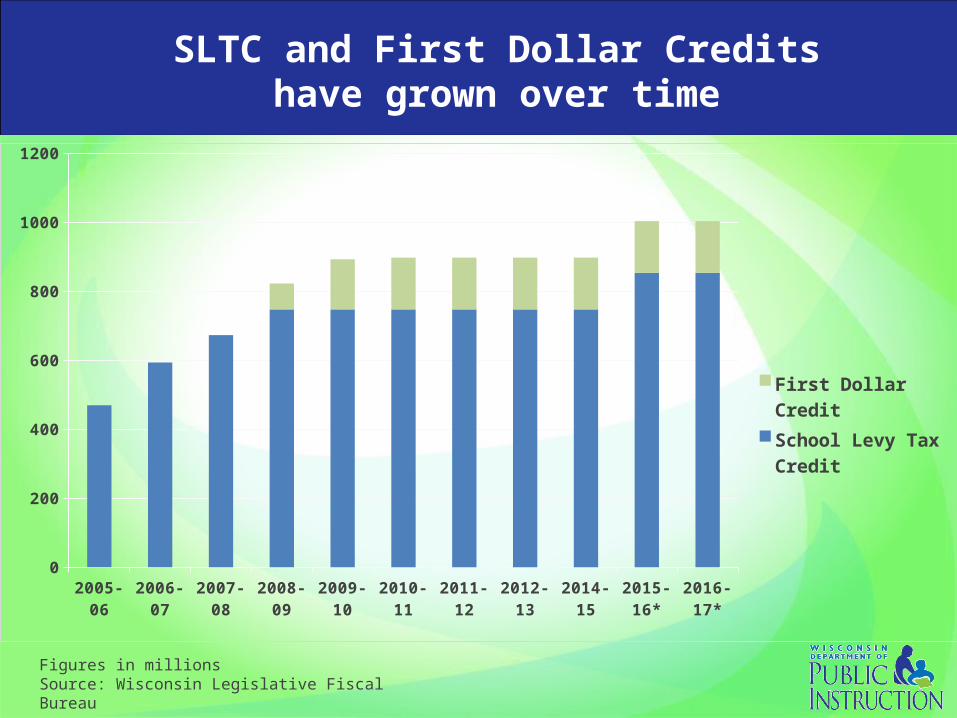
SLTC and First Dollar Credits have grown over time
Figures in millionsSource: Wisconsin Legislative Fiscal Bureau
2005-06
2006-07
2007-08
2008-09
2009-10
2010-11
2011-12
2012-13
2014-15
2015-16*
2016-17*
0
200
400
600
800
1000
1200
First Dollar Credit
School Levy Tax Credit

Increased General School Aid All Goes to Property Tax Relief
2009
-10
2010
-11
2011
-12
2012
-13
2013
-14
2014
-15
2015
-16
2016
-17
$4.00
$4.10
$4.20
$4.30
$4.40
$4.50
$4.60
$4.70
$4.6
5
$4.6
5
$4.2
6
$4.2
9
$4.3
8
$4.4
8
$4.4
8 $
4.5
8
General School Aids (in billions $)
General Equalization Aids*$0/+$108M (all property tax reduction)
School Levy Tax Credit+$105.6M/+$105.6M (all property tax reduction)
*Without an increase in the revenue limit, additional general aid will reduce property taxes, but not enable additional spending.
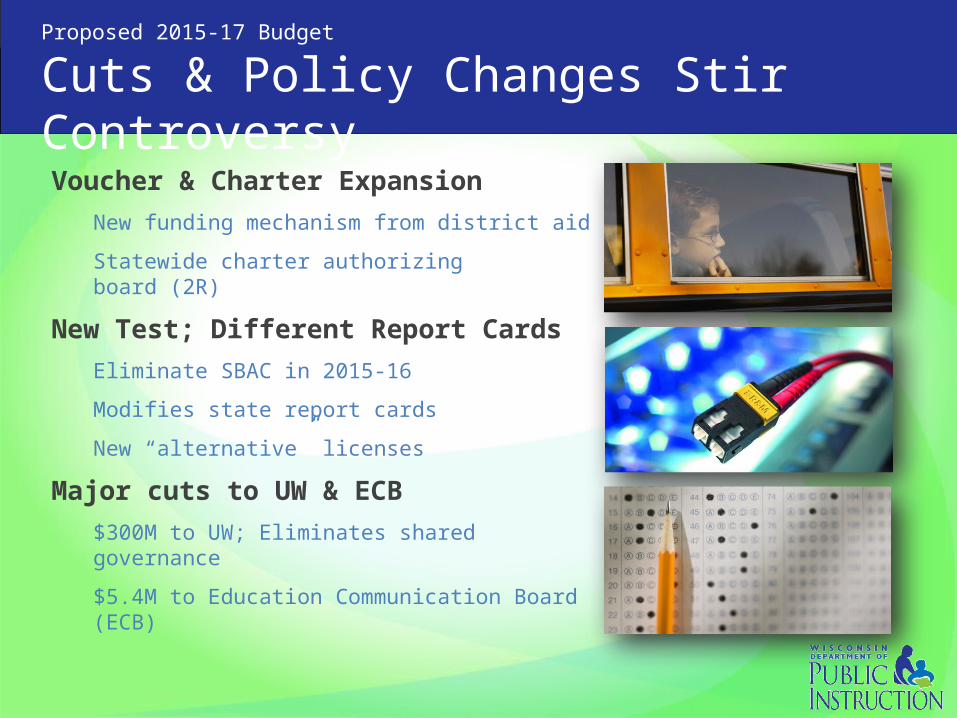
Proposed 2015-17 Budget
Cuts & Policy Changes Stir ControversyVoucher & Charter Expansion
New funding mechanism from district aid
Statewide charter authorizing board (2R)
New Test; Different Report Cards
Eliminate SBAC in 2015-16
Modifies state report cards
New “alternative” licenses
Major cuts to UW & ECB
$300M to UW; Eliminates shared governance
$5.4M to Education Communication Board (ECB)
A Better Path Forward
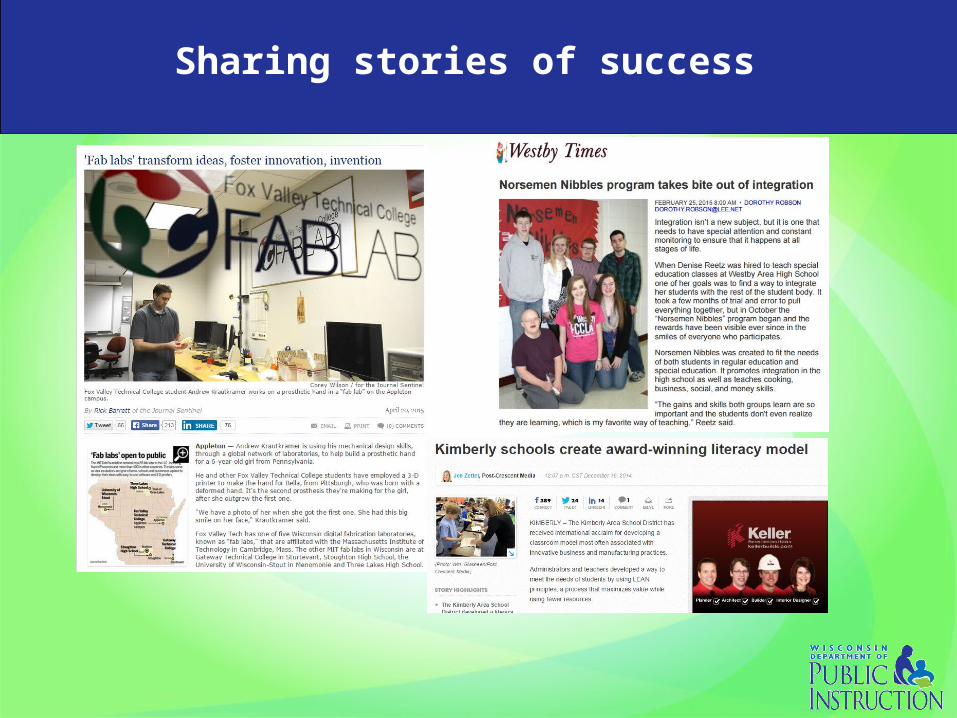
Sharing stories of success