WISCONSIN DOT CFIRE - WisTrans · WISCONSIN DOT Wisconsin Department ... Teresa Adams, Kaushik...
101
WISCONSIN DOT Wisconsin Department of Transportation Research & Library Unit C FIRE National Center for Freight & Infrastructure Research & Education Wisconsin Transportation Center University of Wisconsin, Madison Operational Resiliency of Beloit-Hudson Interstate Highway Corridor Teresa Adams, Kaushik Bekkem, Vicki Bier University of Wisconsin, Madison WisDOT 0092-09-10, CFIRE 01-09 May 2010
Transcript of WISCONSIN DOT CFIRE - WisTrans · WISCONSIN DOT Wisconsin Department ... Teresa Adams, Kaushik...

WISCONSIN DOTWisconsin Department of Transportation Research & Library Unit
CFIRENational Center for Freight & Infrastructure Research & EducationWisconsin Transportation CenterUniversity of Wisconsin, Madison
Operational Resiliency of Beloit-Hudson Interstate Highway Corridor
Teresa Adams, Kaushik Bekkem, Vicki Bier University of Wisconsin, Madison
WisDOT 0092-09-10, CFIRE 01-09
May 2010

2
3
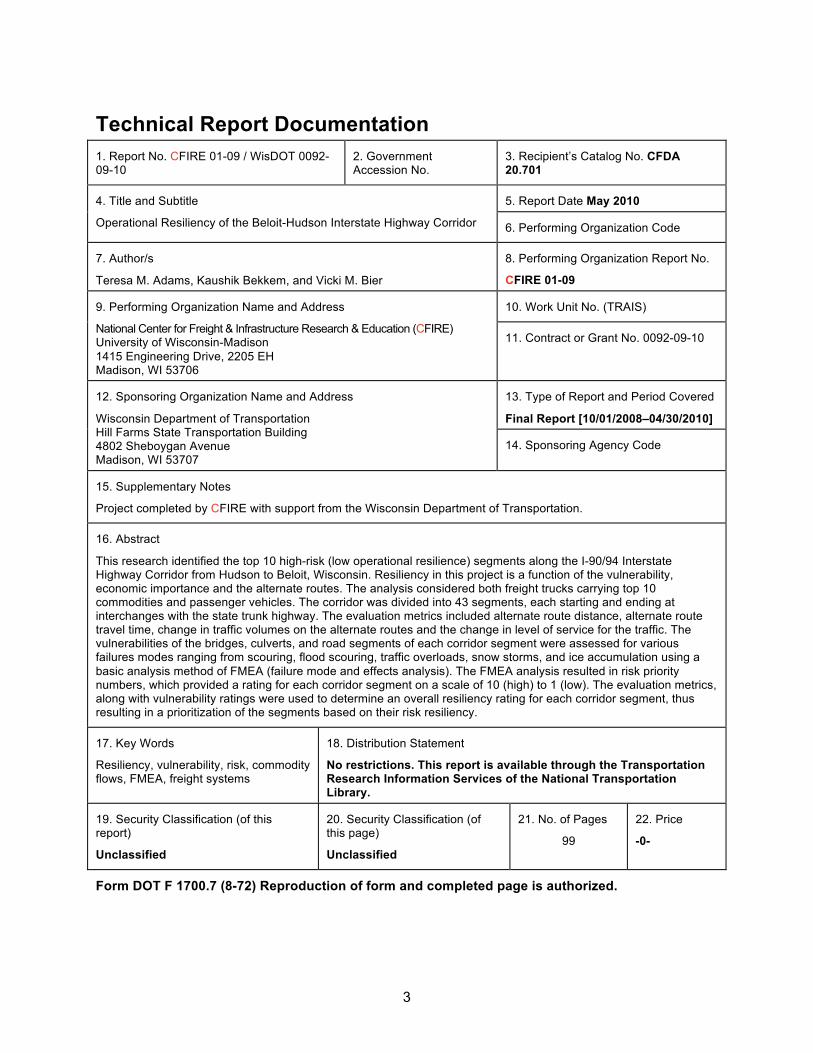
Technical Report Documentation 1. Report No. CFIRE 01-09 / WisDOT 0092-09-10
2. Government Accession No.
3. Recipient’s Catalog No. CFDA 20.701
5. Report Date May 2010 4. Title and Subtitle
Operational Resiliency of the Beloit-Hudson Interstate Highway Corridor 6. Performing Organization Code
7. Author/s
Teresa M. Adams, Kaushik Bekkem, and Vicki M. Bier
8. Performing Organization Report No.
CFIRE 01-09
10. Work Unit No. (TRAIS) 9. Performing Organization Name and Address
National Center for Freight & Infrastructure Research & Education (CFIRE) University of Wisconsin-Madison 1415 Engineering Drive, 2205 EH Madison, WI 53706
11. Contract or Grant No. 0092-09-10
13. Type of Report and Period Covered
Final Report [10/01/2008–04/30/2010]
12. Sponsoring Organization Name and Address
Wisconsin Department of Transportation Hill Farms State Transportation Building 4802 Sheboygan Avenue Madison, WI 53707
14. Sponsoring Agency Code
15. Supplementary Notes
Project completed by CFIRE with support from the Wisconsin Department of Transportation.
16. Abstract
This research identified the top 10 high-risk (low operational resilience) segments along the I-90/94 Interstate Highway Corridor from Hudson to Beloit, Wisconsin. Resiliency in this project is a function of the vulnerability, economic importance and the alternate routes. The analysis considered both freight trucks carrying top 10 commodities and passenger vehicles. The corridor was divided into 43 segments, each starting and ending at interchanges with the state trunk highway. The evaluation metrics included alternate route distance, alternate route travel time, change in traffic volumes on the alternate routes and the change in level of service for the traffic. The vulnerabilities of the bridges, culverts, and road segments of each corridor segment were assessed for various failures modes ranging from scouring, flood scouring, traffic overloads, snow storms, and ice accumulation using a basic analysis method of FMEA (failure mode and effects analysis). The FMEA analysis resulted in risk priority numbers, which provided a rating for each corridor segment on a scale of 10 (high) to 1 (low). The evaluation metrics, along with vulnerability ratings were used to determine an overall resiliency rating for each corridor segment, thus resulting in a prioritization of the segments based on their risk resiliency.
17. Key Words
Resiliency, vulnerability, risk, commodity flows, FMEA, freight systems
18. Distribution Statement
No restrictions. This report is available through the Transportation Research Information Services of the National Transportation Library.
19. Security Classification (of this report)
Unclassified
20. Security Classification (of this page)
Unclassified
21. No. of Pages
99
22. Price
-0-
Form DOT F 1700.7 (8-72) Reproduction of form and completed page is authorized.

4
DISCLAIMER
The Wisconsin Department of Transportation funded this research. The contents of this report reflect the views of the authors, who are responsible for the facts and the accuracy of the information presented herein. This document is disseminated under the sponsorship of the Department of Transportation, University Transportation Centers Program, in the interest of information exchange. The U.S. Government assumes no liability for the contents or use thereof. The contents do not necessarily reflect the official views of the National Center for Freight and Infrastructure Research and Education, the University of Wisconsin, Wisconsin Department of Transportation, or the USDOT’s RITA at the time of publication.
The United States Government assumes no liability for its contents or use thereof. This report does not constitute a standard, specification, or regulation.
The United States Government does not endorse products or manufacturers. Trade and manufacturers names appear in this report only because they are considered essential to the object of the document.

5
Table of Contents Technical Report Documentation ................................................................................................. 3 Executive Summary...................................................................................................................... 5 Introduction ................................................................................................................................. 11 Literature Review........................................................................................................................ 13
Defining Resiliency of the Freight Transportation System ...................................................... 13 Measuring Resiliency .............................................................................................................. 15 Statewide Freight System Resiliency Planning....................................................................... 16 Freight Network Models .......................................................................................................... 17
Methodology ............................................................................................................................... 21 Objectives and Focus.............................................................................................................. 21 TRANSEARCH Commodity Flows.......................................................................................... 21 Analysis of Alternate Routes ................................................................................................... 24 Vulnerability Analysis .............................................................................................................. 28
Alternate Routes, Vulnerability and Resiliency Assessments..................................................... 34 The Corridor ............................................................................................................................ 34 Alternate Routes ..................................................................................................................... 36 Vulnerability Assessment ........................................................................................................ 37 Resiliency Assessment ........................................................................................................... 38
Summary and Suggested Next Steps......................................................................................... 46 Summary................................................................................................................................. 46 Recommendations for Next Steps .......................................................................................... 47
References ................................................................................................................................. 48 Appendix A: Operational Characteristics of the Corridor Segments ……………...………………50
Appendix B: Analysis of Alternate Routes for the Corridor Segments ……………………………52
Appendix C: Bridges and Culverts on the Corridor …………………………………………………67
Appendix D: Vulnerability Ratings of Corridor Segments…………………………………………..76

6
List of Figures Figure 1: Flood Covering the Interstate Highways in June 2008 ................................................ 12 Figure 2: Resiliency Defined as Performance with Time (Sheffi, 2005) ..................................... 15 Figure 3: Three Phases of Freight Resiliency Planning.............................................................. 16 Figure 4: Freight 4-step Network Assignment Model (Cambridge Systematics, 1997) .............. 18 Figure 5: A Multi-modal Network for Resiliency Analysis (Goodchild et al., 2009) ..................... 19 Figure 6: A Vulnerability Assessment Metrics (Bråthen et al., 2004).......................................... 20 Figure 7: Calculated Flows of Farm Products along the Network............................................... 22 Figure 8: Truck Traffic Volumes for two of Wisconsin’s High Valued Commodities ................... 24 Figure 9: The Wisconsin Highway Network for use in ArcGIS® .................................................. 24 Figure 10: ArcGIS Screenshot of the Network for Analyzing Alternate Routes .......................... 25 Figure 11: Algorithm for Finding Alternate Routes for O-D pairs along the Interstate Corridor .. 26 Figure 12: GIS Illustration of Alternate Routes ........................................................................... 27 Figure 13: Vulnerability Assessment Process (SAIC, 2002)....................................................... 29 Figure 14: Vulnerability Rating Procedure (NYSDOT, 1996)...................................................... 29 Figure 15: FMEA Procedure for Calculating the Risk Priority Number ....................................... 31 Figure 16: Natural Disaster Events in Wisconsin by County 1990-2002 .................................... 32 Figure 17: Locations of Bodies of Water along the Corridor....................................................... 33 Figure 18: Segment Numbering along the Hudson to Beloit Interstate Corridor ........................ 34 Figure 19: Top 10 High Priority Segments.................................................................................. 45
List of Tables Table 1: Elements in the Freight Transportation System (Goodchild et al., 2009) ..................... 13 Table 2: Properties of Freight Transportation System Resiliency (Goodchild et al., 2009) ........ 13 Table 3: Truck Loads, Tonnage, and Value of Top 15 Commodities by Economic Value.......... 23 Table 4: Sample Output and Analysis of an Alternate Route ..................................................... 28 Table 5: Vulnerability Ratings used in New York State .............................................................. 30 Table 6: Attributes of the Corridor Segments ............................................................................. 35 Table 7: Evaluation of Alternate Routes ..................................................................................... 37 Table 8: Resiliency Performance Measures for Corridor Segments........................................... 38 Table 9: Resiliency Value and Risk Priority Segments............................................................... 41 Table 10: Ten Least Resilient Segments on the I-90/94 Hudson to Beloit Interstate Corridor ... 44 Table 11: Operational Characteristics of the Corridor Segments………………………………….50 Table 12: Corridor Segments and Corresponding Alternate Routes………………………………52 Table 13: Bridges on the Study Corridors…………………………………………………………….67 Table 14: The Corridor Segments with Vulnerability Assessment…………………………………76

7
Executive Summary On February 6, 2008, a severe winter storm hit Wisconsin and dropped more than 13 inches of snow and ice. As the weather deteriorated, more than a thousand vehicles became stranded on a 17-mile segment of I-90 and brought movement through the corridor to a standstill. The National Guard was mobilized to deliver food and water to stranded drivers. In June of the same year excessive rains caused flooding and long detours along the I-90/94 corridor.
In 2008, Wisconsin’s freight transportation system moved more than $300 billion in goods. Freight volumes in Wisconsin are projected to increase another 70 percent by 2025. Disruptions to freight movements caused by unplanned emergencies, disruptions, and disasters in the state’s transportation systems have a direct and immediate effect on the economy of Wisconsin, the Midwest, and the nation as a whole by constraining the efficient flow of commodities.
These disruptions and their potential economic impact clearly demonstrate both the vulnerability of sections of the corridor and the need for a recovery strategy that includes freight system resiliency plans.
The Operational Resilience of the I-90/94 Corridor project, conducted by CFIRE in conjunction with the Wisconsin Department of Transportation, aims to provide information that will help the State of Wisconsin ensure reliable function of the major corridor between Hudson and Beloit, Wisconsin, while maintaining the normal pass-through capacity for the entire corridor. The corridor supports high volumes of freight and passenger travel and serves as a critical backbone for both freight and passenger mobility and accessibility in Wisconsin, Illinois, and Minnesota.
Transportation infrastructure resilience provides a method for mitigating vulnerabilities in transportation systems, for fortifying against disruptions, and for recovering from major natural or man-induced disasters. Resiliency measures assess the availability of alternate routes, the reduction in total delay, the adaptive use of high occupancy vehicle lanes, and the ability to transfer passenger travel to other non-single occupancy vehicles to free highway capacity and maintain freight mobility. In a freight context, resiliency is defined as the ability for the transportation system to absorb the consequences of disruptions, to reduce the impact of disruptions, and to maintain freight mobility in the face of such disruptions.
In order to study the resiliency of the I-90/94 corridor, CFIRE researchers divided the corridor into 45 segments based on the location of major state highway truck network interchanges. Each segment is the stretch of road between two such interchanges and is assigned the following attributes: route sign, length, one-way, county, annual average daily traffic, percentage of trucks, the direction or heading, and the commodity flows of the segment.
Commodity flows through the I-90/94 corridor and through each segment were ranked according to the number of truckloads per year, the number of truck tons per year and the total goods value per year. The top ten commodities were selected for further study based on value and the number of trucks flowing through the corridor. These commodities included non-metallic minerals; farm products; wood and lumber products; food and kindred products; clay, concrete, glass, or stone; pulp, paper, or allied products; petroleum or coal products; rubber or plastic products; primary metal products; and, chemicals.
Researchers performed a network analysis using ArcGIS to identify alternate routes and then scripted the analysis process to generate alternate routes for multiple segment disruptions. Alternate routes were generated for both contiguous and non-contiguous disruptions.
The project team then assessed the vulnerability of each segment by analyzing the segment’s bridges, culverts, and roadway and probable failure modes (hydrologic, overload, and weather)

8
and the probable severity of disruption in order to compute a Risk Priority Number (RPN) on a scale of 1-10. This study considered hydraulic factors such as scouring, scouring due to floods, overload factors such as traffic volumes and bridge functional classifications, and functional factors such as snow and ice accumulation, snowstorms, tornadoes, and severe winter storms.
The resiliency score for each segment was calculated using three variables: the value of the economic activity of the top ten commodities flowing through the segment; the segment’s RPN; and, the availability, length, and volumes of alternate routes. Based on these calculations, CFIRE researchers identified the ten most vulnerable segments of the I-90/94 corridor.
The 10 Most Vulnerable Segments of the I-90/94 Corridor
Rank To Intersection From Intersection
1 I90E: 60E, M108A, Columbia Co. I90E: 39N, M115, Columbia Co.
2 I90E: 60E, M108A, Columbia Co. I90E: 12N, Lake Delton, Sauk Co.
3 I90E: 19E, Windsor, Dane Co. Lodi: E, M115, Columbia Co.
4 I90E: 12E, New Lisbon, Juneau Co. I94E: I90E, Tomah, Monroe Co.
5 I90E: 51N, M156, Dane Co. I90E: 12E, M142, Dane Co.
6 I90E: 73N, M157, Dane County I90E: 51N, M156, Dane County
7 I94E: 10E, M098, Jackson Co. I94E: 121E, Osseo, Trempealeau Co.
8 I94E: 12E, M90, Eau Claire Co. I94E: 12E, M059, Elk Mound, Dunn Co.
9 I94E: 12E, M041, Menomonie, Dunn Co. I94E: 128N, M028, Spring Valley, St. Croix Co.
10 I90E: I94E, M142, Madison, Dane Co. I90E: 12E, M138, Madison, Dane Co.
CFIRE researchers presented a draft report of these results to the Wisconsin DOT in February 2010. In the light of these results, the working group will: review existing and pending agency plans and the emergency procedures of trucking companies; open a discussion with agency personnel at traffic management and emergency response centers; and, identify strategically weak sections of the corridor for future network enhancements.
This project also forms the basis for future research on the operational resiliency of the I-90/94 corridor and other freight transportation corridors. Some possible future research directions include: a comparison of commodity flow data with real-time data provided by the American Transport Research Institute (ATRI) during major disruption events; traffic routing models that account for origin-destination data and the actual flow of vehicles through the corridor; and, an analysis of the transfer of response to recovery to provide strategies for re-routing traffic during disruptions.
Implementation of the research results will require the Wisconsin DOT to define infrastructure countermeasure and partnerships with local governments to satisfy six properties of freight system resiliency. Redundancy promotes flexibility and supports the robustness of the freight transportation system. The autonomy of components supports system operability when individual system components fail. Collaboration supports innovative problem solving, reduces miscommunication, spreads risk across stakeholder groups, and promotes network

9
optimization. Efficiency allows resources to be spent on activities or projects that provide the most benefit to system users. Adaptability also promotes flexibility and the robustness of the transportation system. Interdependence spreads risk across the entire system, promotes smooth transitions across parts of the system, and promotes system efficiency.

10

11
Introduction Transportation systems are susceptible to unplanned emergencies, disruptions, and disasters. There is often a time lag, sometimes significant, between the disruption’s occurrence and the system’s return to equilibrium. Transportation disruptions affect the overall economy by constraining the free and efficient flow of raw materials, work in process, and finished goods. Indirect impacts from disruptions may adversely affect the economy for years.
Very little research has been conducted on how transportation agencies should plan to facilitate economic recovery after a disaster, and few states have resiliency plans for their freight systems. The 2004 National Response Plan (NRP) calls for each state to have a full complement of plans for response to domestic incidents that encompass all hazards. Specific to transportation, it defines Emergency Support Functions (ESF) in ESF#1–Transportation and ESF#14–Long-term Community Recovery and Mitigation (MIT, 2008). But, the ESF documents only provide a general framework for recovery studies. In order to study the freight system resiliency, it is incumbent upon the states to define the resiliency studies and detailed response plan for their transportation system’s recovery.
Disruptions that affect the transportation infrastructure systems ultimately constrain freight movements, and without freight movement economic productivity stops. Wisconsin’s freight transportation system moves over $300 billion in goods and is critical for linking local, national, and international consumers and producers (Cambridge Systematics, 2009). Freight demand has grown significantly over the last few decades and freight is projected to further increase another 70 percent by 2025. While this level of growth is slightly lower than in other areas of the country, the projected increased usage of the state’s freight system may present significant transportation challenges, particularly while revenues are down and construction costs are increasing.
Transportation infrastructure resilience is a way to mitigate vulnerabilities in transportation networks and to guide investment in transportation infrastructure to fortify against disruptions and speed recovery after a major natural or man-induced disaster (Giuliano & Golob, 1998; Chang et al., 2003). Resiliency analyses can assess the availability of alternate routes, potential total delay, the adaptive use of high occupancy vehicle lanes, and the ability to transfer passenger travel to other non-single occupancy vehicle modes in order to free highway and roadway capacity to maintain freight mobility (Giuliano & Golob, 1998).
This report presents a resiliency study of the Hudson to Beloit Interstate Highway Corridor (referred to as the “Hudson to Beloit Corridor” or simply the “corridor”) that runs along I-94 in Wisconsin from Hudson to Tomah and continues along I-90 to Beloit. The corridor supports high volumes of freight and passenger travel. Recent events have shown us how truly fragile sections of the corridor can be. On February 6, 2008, a severe winter storm hit Wisconsin and resulted in over 13 inches of snow and ice. As the weather deteriorated, 1050 stranded vehicles on a 17-mile segment of I-90 severely impaired movement through the corridor. Similarly in June 2008, excessive rains caused flooding and long detours along the corridor (Figure 1). Such events plainly demonstrate the importance of understanding the resiliency of this corridor. This study is a key step for preparedness for and resiliency to unanticipated events.

12
Figure 1: Flood Covering the Interstate Highways in June 2008

13
Literature Review
Defining Resiliency of the Freight Transportation System The “ability for the system to absorb the impacts from a disruption and continue moving traffic in an uninhibited manner” is one definition of freight transportation system resilience (Bruneau et al., 2003). This simple definition is derived from the dictionary definition of resilience, which defines resilience as “an ability to recover from or adjust easily to misfortune or change.” Goodchild et al. (2009) defined freight transportation system resilience as the ability for the system to absorb the consequences of disruptions, to reduce the impacts of disruptions, and maintain freight mobility.
Table 1 lists the broad freight system elements to be considered in a study of freight transportation resiliency (Goodchild et al., 2009). The physical freight infrastructure consists of the network of nodes and links (e.g. port facilities, freight distribution centers, warehouses, intermodal yards, bridges, rail lines, and roadways) that support freight transportation and travel. The physical network is supported by an information infrastructure connecting shippers, carriers, and customers. It must be recognized that the decisions and actions of shippers, carriers and operators affect the overall system resiliency. Various properties of resiliency are specific to the elements of a freight transportation system. The framework in Table 2 defines those properties of resiliency.
Table 1: Elements in the Freight Transportation System (Goodchild et al., 2009)
Elements Classification Definition
Physical Infrastructure The system of network of nodes and links (e.g., port facilities, distribution centers, warehouses, intermodal yards, bridges, rail lines, and roadways) sensors, and information technology infrastructure that support freight transportation and travel.
Managing Organization The unit that oversees the construction, maintenance, and performance of the freight transportation physical infrastructure.
System Users Business enterprises that move goods on the transportation infrastructure and utilize roadway information.
Table 2: Properties of Freight Transportation System Resiliency (Goodchild et al., 2009)
Properties Physical Infrastructure Dimension
Managing Organization Dimension
User Dimension Contribution to Freight Transportation System Resilience
Redundancy Availability of multiple and alternate routing options.
Multiple information sources and points of delivery.
Multiple parts and materials suppliers; information backed up on distributed servers.
Promotes flexibility; supports robustness.

14
Properties Physical Infrastructure Dimension
Managing Organization Dimension
User Dimension Contribution to Freight Transportation System Resilience
Autonomy of Components
The ability of highway system to function when air space closed; independent signal controls for each intersection.
Independence of functional units in an organization, e.g. approvals and decision making can be independent of established hierarchies.
Independence of functional units in an enterprise, e.g. procurement, billing, manufacturing, and distribution.
Supports system operability despite the failure of individual system components; supports robustness.
Collaboration Working partnership between federal, state, regional and local public agencies to plan, construct and operate the full freight transportation network to optimize system use.
Good internal communication across divisions and external communication with system users; leadership across all levels of the organization.
Public-private partnerships to build relationships between organizations.
Supports innovative problem solving, reduces miscommunications, spreads risk across groups Promotes network, versus local, freight system optimization and resiliency.
Efficiency Network designs that reduce travel time between origin and destination.
Use of effective mechanisms to prioritize spending within the organization and on infrastructure.
Coordination across the supply chain with relationships built across the different parties.
Allows resources to be spent on activities or projects that provide most benefit to the users.
Adaptability Designed with short life-spans and the intent for regular replacement or for the capability to expand capacity without total facility.
Familiarity of roles and responsibilities across levels of the organization; cross-trained employees; leadership can be engaged at all levels.
Ability to postpone decision making and shipping; build-to order business model.
Promotes flexibility and system efficiency; supports robustness.

15
Properties Physical Infrastructure Dimension
Managing Organization Dimension
User Dimension Contribution to Freight Transportation System Resilience
Interdependence Seamless mode transfers; intermodal facilities.
Relationships are established across separate, but related agencies and within agencies; mutual understanding of the value and benefit from interaction.
Standardization of parts and interchangeability.
Exhibits smooth connections and transitions across parts of the system; promotes system efficiency; spreads risk across the system to reduce risk.
Measuring Resiliency Within the literature, there are several concepts for measuring resiliency. The resilience triangle quantifies the loss of functionality from damage and disruption emerges from disaster research (Tierney & Bruneau, 2007). The resilience triangle helps to visualize the magnitude of the impacts of a disruption on the infrastructure. The depth of the triangle shows the severity of damage and the length of the triangle shows the time to recovery. One representation of the resilience triangle is shown in Figure 2 (Sheffi, 2005).
Figure 2: Resiliency Defined as Performance with Time (Sheffi, 2005)
The R4 framework of resiliency (Bruneau et al., 2003) defined four measures for resiliency.
• Robustness. The ability of systems, system elements and other units of analysis to withstand disaster forces without significant degradation or loss of performance.
• Redundancy. The extent to which systems, system elements, or other units are substitutable if significant degradation or loss of functionality occurs.
• Resourcefulness. The ability to diagnose and prioritize problems and to initiate solutions by identifying and mobilizing material, monetary, informational, technological, and human resources.

16
• Rapidity. The capacity to restore functionality in a timely way, containing losses and avoiding disruptions.
For transportation infrastructure, resiliency measures assess the availability of alternate routes, the reduction in total delay, the adaptive use of high occupancy vehicle lanes, and the ability to transfer passenger travel to other non-single occupancy vehicle modes so as to free highway and roadway capacity to maintain freight mobility (Giuliano & Golob, 1998).
Statewide Freight System Resiliency Planning A process for developing a statewide freight system resiliency plan was developed for the Washington DOT (Caplice et al., 2008). The tasks for creating a resiliency plan may be grouped under three general phases, as shown in Figure 3. The phases consist of specific steps that vary from state to state.
Figure 3: Three Phases of Freight Resiliency Planning
The first step is to identify and quantify the freight flows. Central players in the freight shipping community include the carriers, freight forwarders, and other agents that facilitate the movement of freight and use of the freight transportation system.
The economic cost of any disruption is conceptually measured as the time that the level of service is below the established benchmark. It is necessary to segment the study area such that the resiliency objectives for each segment can be articulated. The metrics should focus on the transportation network capabilities, not on the economic output that is out of state DOT’s control. The choice of the metrics depends on the scope of the application. Caplice et al. (2008) provides examples of potential metrics which include:
• Return total commodity flow through the corridor up to X percent of the previous level within 3 days of the event.
• Identify detours that are available that will not exceed route miles or time by more than Y percent.
Or:
• Restore truck access across the entire state to X percent of the previous level. • Restore truck access within each region of the state to X percent of previous level. • Restore traffic congestion levels on the corridor segments within a certain service limits.
Identification • Identify and segment customers of the tranportation system • Quantify the objectives of the resiliency plan
Assessment • Develop the network inventory for the critical sections of the network. • Conduct a vulnerability assessment of the transportation network
Implementation
• Recommend the responding strategies in terms of traffic control and incident management
• Conduct a small scale simulation for a few customer groups

17
The vulnerability assessment should focus on the consequences of failure instead of the causes of the disruption. The tasks for the vulnerability assessment are:
• Identify the segments that are more vulnerable for becoming a bottleneck in the case of any disruption.
• Estimate cost of countermeasures. • Develop a network analysis for alternate routes. • Analyze traffic on the alternate routes and measure the resiliency along the respective
segment.
George et al. (2005) suggest the following procedure for assigning risk priority numbers to the infrastructure components:
1. Brainstorm a list of potential ways that the freight system can fail. These are called failure modes. This should focus on the specific infrastructure failures, not root causes.
2. For each failure mode, identify the potential failure effects. Failure effects are simply consequences of a specific failure.
3. For each failure mode assign three rankings on a scale of 1 to 10 where 10 is most severe, most likely, and the least detectable: a) Severity of failure. b) Likeliness of failure. c) Detect-ability of failure.
4. Calculate a risk priority number (RPN) for each failure mode by multiplying the three rankings together. The RPN for the failure modes range from 1000 to 1, which are then converted to a range of 10 to 1.
5. Prioritize the failure modes by ranking them from highest to lowest RPN.
Freight Network Models The resiliency for this project focuses on the restoration or recovery of the state’s economy as it is affected, enabled, or disabled by the performance of the freight system. The users of the freight system include the shippers, carriers, and consumers. The Identification Phase of the Freight System Resiliency Planning process requires the profiles of freight movements segmented by mode and flow of various materials and commodities shipped (Caplice et al., 2008). A freight network model can be used to compute the flow of goods along the transportation infrastructure, and the resiliency is measured based on the specified metrics considered. Horowitz (1999) details the involved in defining the freight network model:
1. Obtain Freight Modal Networks. Networks are required for freight models. Networks consisting of mathematical descriptions of routes, links, and intersections are required for each mode receiving complete analysis. Networks are drawn from scratch or modified from existing sources.
2. Develop Commodity Groups. Vehicle traffic levels are derived from the movement of commodities. Thus, a good understanding of commodities is necessary. Because there are a very large number of commodity categories, commodities are grouped to facilitate the analysis. A large number of groups gives precision, but increases the complexity of the modeling process.
3. Relate Commodity Groups to Industrial Sectors or Economic Indicators. Separate economic indicators should be adopted for production and consumption of each commodity. It is easier to relate commodities to industrial indicators at the production end of the shipment. Input-output (I-O) tables can bridge the relationship to consumption of commodities.

18
4. Find Base Year Commodity Flows. Origin and destination data for commodities must be obtained to build a factual model.
5. Forecast Growth in Industrial Sectors. Forecasts can be obtained from a variety of governmental, private, and educational organizations.
6. Factor Commodity Flows. Industry forecasts can be used to forecast commodities. These forecasts can be applied to production, to consumption or to a whole commodity flow table.
7. Develop Modal Cost for Commodities and Split Commodities by Mode. Mode split is determined, to a large extent, by cost considerations. A cost model is the primary way to determine the impact of public policies on modal choice.
8. Assign Vehicles to Modal Networks. Flow matrices, by themselves, are of limited value for planning. More important are the number of vehicles that use each link, intersection, and terminal. A traffic assignment algorithm provides this information.
Figure 4 shows the structure of most freight network model methodologies (Cambridge Systematics, 1997). State level freight models provide outputs ranging from the assigned truck flow volumes by commodity to the forecasted volumes for future years. Other sources of commodity flows are the commodity flow data obtained from the US census bureau, a private freight database (TRANSEARCH ®), and input-output (I-O) coefficients (Sorratini & Smith, 2000).
Figure 4: Freight 4-step Network Assignment Model (Cambridge Systematics, 1997)
A framework for storing and representing the flow of goods, and for considering the impact of changes to the infrastructure is necessary for a vulnerability assessment. Goodchild et al. (2008) selected a GIS framework, shown in Figure 5, for which shape files were obtained for all modes. In order to understand the economic consequences of disruption it is necessary to understand the nature of goods moving on a transportation link at a fairly detailed level.

19
Figure 5: A Multi-modal Network for Resiliency Analysis (Goodchild et al., 2009)
Transportation network vulnerability assessment is a complex and non-linear problem (Srinivasan, 2004). The factors that affected the link level assessment are network attributes, threat attributes, flow attributes, and neighborhood attributes. It is therefore essential to obtain data quantifying the nature and extent of failure on links under the various types of failures (i.e., whether failure is defined in terms of capacity reduction or complete blockage/disruption).
Data on available alternatives to the given link is also necessary. The extent of redundancy in the system and network design configuration (e.g., the role of a link as a connector in a hub and spoke system) is also critical data elements. Further, information on the number of paths that share the given link and the availability of alternative links for certain origin-destination pairs is needed to assess the extent of disruption on the given link. A “hubs, corridors, and connectors” analysis can be used to identify the elements of the transportation system and methods for measuring vulnerability for the network links (Caplice et al., 2008). This analysis has the following steps:
1. Collect available truck count data for various highway routes and the volumes of various agricultural commodities transferred and then map them in order to find out the truck volumes for each agricultural commodity type.
2. Find the detour paths (shortest paths) where alternate paths are determined by the resiliency metrics, such as by limiting the length of shortest path with respect to original path, or restricting the percentage commodity flow.
3. Based on suitable algorithm, to find the alternate routes for each segmented corridor disruption event.
A similar methodology by Bråthen et al. (2004) revealed some of the effects of a sudden and unforeseeable incident that led to the closure of two routes.

20
Figure 6: A Vulnerability Assessment Metrics (Bråthen et al., 2004)
In Figure 6, the evaluation metrics (A–Z) are listed on the rows. The metrics are weighted on a 0-1 scale, such that the sum of the category weights equals 1. Each weight is multiplied with the impact value 1-5. The average annual daily traffic serves as the first criteria of demand, to assess the number of users that is affected. The third and fourth criteria are waiting time or delay time, or the time it takes to drive the detour for light and heavy-duty vehicles. These categories roughly account for the difference in time values for business and leisure trips. The fifth category is the lost value of perishable goods if they are not delivered on time. Sixth, some businesses may experience a loss of profit, because important deliveries or shipments are not made. Finally, combined with the other criteria, the time (and cost) of reconstruction of this particular link serves as an additional criterion. The number of evaluation criteria must be adapted to the scenario that is investigated. With this approach it is possible to compare and evaluate a number of vulnerabilities and to find the most critical link or most vulnerable point according to the criteria used.

21
Methodology The research approach is based on the framework for preparing a Statewide Freight System Resiliency plan (Caplice et al., 2008) described in Section 2.3. The approach for evaluating resiliency adapts various methods for vulnerability assessment and ranking for other literature sources. This section presents details on the research approach and intermediate results of the analysis.
Objectives and Focus The study focuses on resiliency along the Hudson to Beloit Interstate Highway Corridor while considering the four major types of commodity flows through the corridor (E=external; I=internal):
• E-E traffic: Originates from and is destined to locations outside the corridor. • I-E traffic: Originates along the corridor but is destined for locations outside the corridor. • E-I traffic: Originates outside the corridor but is destined for a location along the corridor. • I-I traffic: Starts and ends at locations along the corridor.
The objectives of the study are to evaluate the freight system resiliency along the corridor. The research recognizes the state’s dependence on certain freight movements to maintain basic sustenance and the importance of the corridor to the state’s economy. The study follows from the ranking of the freight commodities according to their economic importance to the state.
TRANSEARCH Commodity Flows Regional freight modeling makes use of network models that have been populated with aggregated data to represent the modal share of freight at a certain geographic level. Network models take into account the logistics decisions of shippers and carriers for moving freight based on the commodity type and network characteristics. In practice the use of a network model requires some tradeoff decisions regarding availability of data and complexity of the models.
This research used the REEBIE TRANSEARCH® database of freight flows for the state of Wisconsin, obtained for the project analysis from the Wisconsin DOT. TRANSEARCH is a database of freight traffic flows. It utilizes a multitude of mode-specific data sources to create a picture of the nation’s freight traffic flows on a market-to-market commodity basis. TRANSEARCH further refines the geographic market identification to the county level.
TRANSEARCH’s county-to-county market detail is developed through the use of the Global Insight® Motor Carrier Data Exchange inputs and the Global Insight® Freight Locator database of shipping establishments. The Global Insight® proprietary Motor Carrier Data Exchange program provides information on actual market-to-market trucking industry movement activity. The Data Exchange program includes carriers from both the private and for-hire segments of the industry and both the truckload (TL) and less-than-truckload (LTL) sectors. The truckload sample covers about six percent of the market, and the Global Insight® LTL sample is about 40 percent. The samples represent over 75 million individual truck shipments. By way of comparison, the government’s Commodity Flow Survey covers about 12 million shipments, spread across all modes, and the Rail Waybill’s sample rate is about 2.5 percent of all rail freight movements.
The network used for this study is FHWA’s National Highway Planning Network (NHPN), which is compatible with TRANSEARCH. The observed truck counts data from the Wisconsin DOT were mapped to the NHPN for Wisconsin using ArcGIS.

22
The research study requires the tonnage between various origins and destinations to be converted to daily trucks and then mapped to Wisconsin’s roadways. TRANSEARCH has the assigned freight truck volumes that are consistent with the pattern of observed truck counts. Beagan & Grenzeback (2002), in a study for the Ohio DOT, favorably compared the pattern of truck volumes estimated by TRANSEARCH and the pattern of observed truck counts. For example, Figure 7 shows the GIS map of the calculated overall flows of ‘farm products’ along the network.
Figure 7: Calculated Flows of Farm Products along the Network
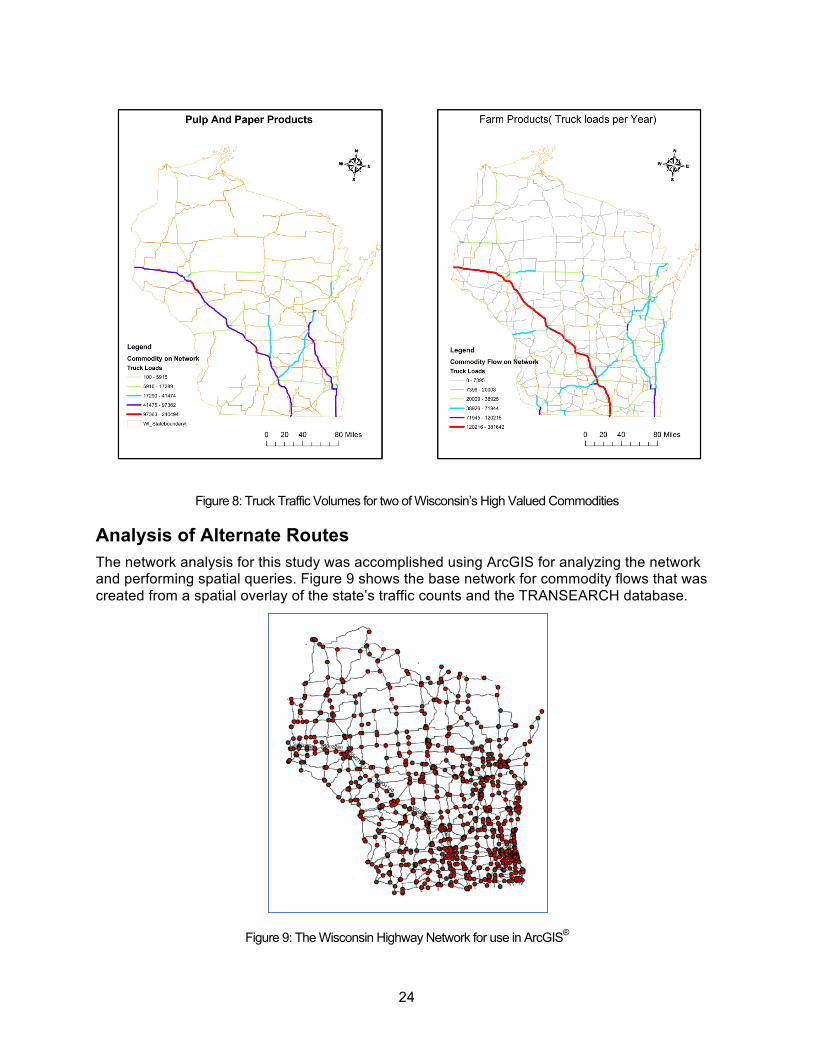
Queries extracted from the TRANSEARCH database the total value of goods carried on the trucks throughout the state of Wisconsin. Using these queries, Table 3 lists the truckloads, tonnage, and value of the top commodities for the state. Figure 8 shows the truck volume flows for two of the commodities. The maps clearly show the Hudson to Beloit Interstate Corridor is an important freight route. It carries large volumes of the state’s high valued commodities.

23
Table 3: Truck Loads, Tonnage, and Value of Top 15 Commodities by Economic Value
STCC 2 Commodity Name Sum of Truck Loads
Truck Tons (000's per year)
Total Goods Value (Million $/year)
50 Drayage 2260882.951 46358.24 359820.00
36 Electrical Mach/Equip/Su 458953.7947 7096.14 94212.06
35 Machinery Exc Electrical 547980.3376 7363.05 77647.52
37 Transportation Equipment 817759.0634 11314.39 64225.84
34 Fabricated Metal 630061.8202 11289.72 52601.61
33 Primary Metal 737504.4575 18053.15 48355.54
28 Chemicals/Allied 840104.3512 17221.74 46552.25
39 Miscellaneous Manufacturing 94836.63851 1837.30 38271.33
20 Food/Kindred 1513431.054 34360.09 38152.50
01 Farm 2461333.174 39363.78 23705.93
38 Instr/Optical/Watches/Clo 54796.46441 690.55 21897.00
27 Printed Matter 224022.6771 3991.55 20773.25
24 Lumber/Wood 1015926.954 26027.18 20366.98
30 Rubber/Plastics 394560.2823 5251.62 20069.18
26 Pulp/Paper/Allied 556480.0698 13172.84 17656.65
24
Figure 8: Truck Traffic Volumes for two of Wisconsin’s High Valued Commodities
Analysis of Alternate Routes The network analysis for this study was accomplished using ArcGIS for analyzing the network and performing spatial queries. Figure 9 shows the base network for commodity flows that was created from a spatial overlay of the state’s traffic counts and the TRANSEARCH database.
Figure 9: The Wisconsin Highway Network for use in ArcGIS®

25
This network has commodity flows on the individual links but does not contain enough information for network analysis to find alternate freight routes.
Figure 10 shows a screenshot of the network for route analysis built using ArcCatalog®. This network incorporates various connectivity factors and constraints of one-way, minutes/meters based shortest path, and hierarchy of roads based on the functional classes. The ArcGIS Network Analyst was used for routing considering travel directions, closest facility, and the service area origin-destination cost matrix (ArcGIS Network Analyst, ArcGIS® extensions).
Figure 10: ArcGIS Screenshot of the Network for Analyzing Alternate Routes
Figure 11 shows the Network Analyst algorithm used for finding the alternate routes for the highway segments along the corridor. The algorithm, when provided with a list of disrupted route segments, finds the shortest path between given pairs of origin and destination points. This process creates a route layer, which depicts the shortest paths. The next step is to perform a spatial join of these route layers and the Wisconsin highways shape file, so that the highway attributes are joined to the alternate shortest path. These generated shortest alternate route shape files were then exported to MS Excel for analysis of the path length and travel time. Python scripts were written to batch process the analysis of alternative routes along the corridor. The Python scripting was also used to automate the output of the analysis results into an MS Excel worksheet.

26
Figure 11: Algorithm for Finding Alternate Routes for O-D pairs along the Interstate Corridor
Figure 12 shows three alternate routes found using the algorithm shown in Figure 11, for the origin-destination end points of a single segment on the corridor.

27
Figure 12: GIS Illustration of Alternate Routes
This analysis looked for two satisfactory alternate routes for each segment along the corridor in order to re-route the heavy volumes of traffic. Multiple detour routes improve the corridor resiliency because there is less chance of a bottleneck on the detour. Heuristics were used to find the second shortest alternate route. Both the first and second shortest alternate routes were checked against the resiliency metrics. The heuristic approach disabled each adjacent highway link progressively and checked for the shortest distance among them. This is a common method used for a sparse network.
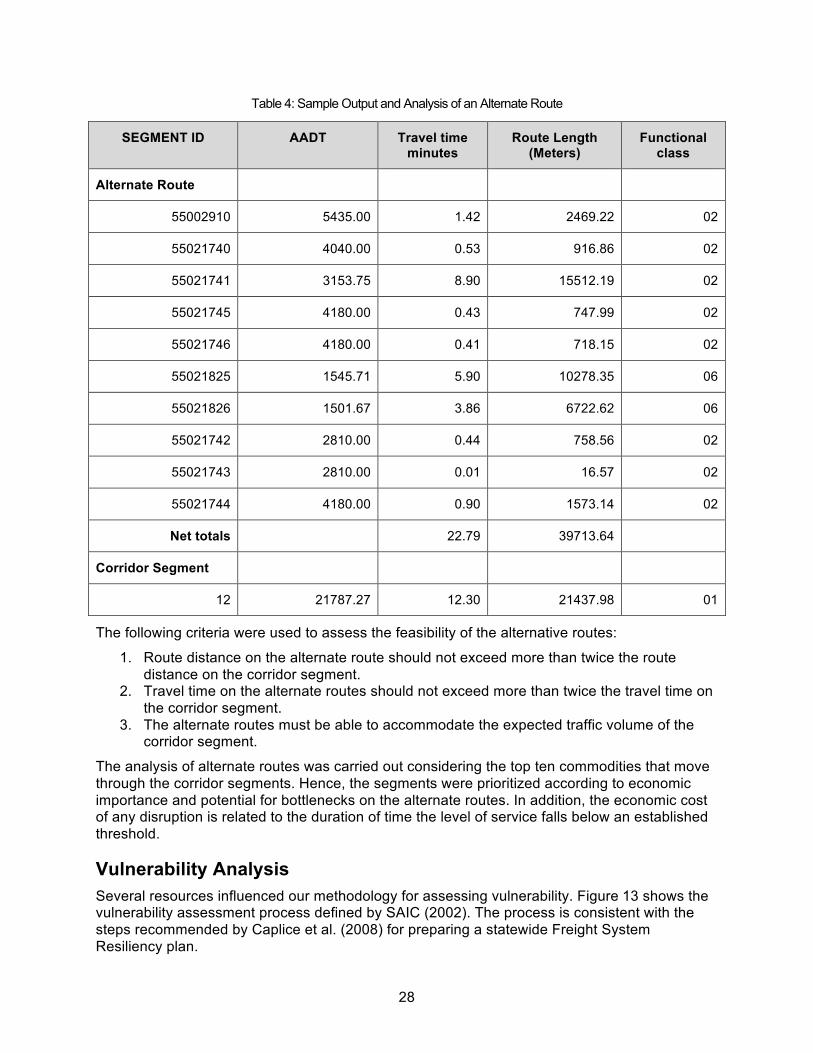
Table 4 shows a sample analysis and output of an alternate route. The output data was analyzed to evaluate the total length and the travel time based on average speeds over the corridor segments (see Appendix B for the complete table).
28
Table 4: Sample Output and Analysis of an Alternate Route
SEGMENT ID AADT Travel time minutes
Route Length (Meters)
Functional class
Alternate Route
55002910 5435.00 1.42 2469.22 02
55021740 4040.00 0.53 916.86 02
55021741 3153.75 8.90 15512.19 02
55021745 4180.00 0.43 747.99 02
55021746 4180.00 0.41 718.15 02
55021825 1545.71 5.90 10278.35 06
55021826 1501.67 3.86 6722.62 06
55021742 2810.00 0.44 758.56 02
55021743 2810.00 0.01 16.57 02
55021744 4180.00 0.90 1573.14 02
Net totals 22.79 39713.64
Corridor Segment
12 21787.27 12.30 21437.98 01
The following criteria were used to assess the feasibility of the alternative routes:
1. Route distance on the alternate route should not exceed more than twice the route distance on the corridor segment.
2. Travel time on the alternate routes should not exceed more than twice the travel time on the corridor segment.
3. The alternate routes must be able to accommodate the expected traffic volume of the corridor segment.
The analysis of alternate routes was carried out considering the top ten commodities that move through the corridor segments. Hence, the segments were prioritized according to economic importance and potential for bottlenecks on the alternate routes. In addition, the economic cost of any disruption is related to the duration of time the level of service falls below an established threshold.
Vulnerability Analysis Several resources influenced our methodology for assessing vulnerability. Figure 13 shows the vulnerability assessment process defined by SAIC (2002). The process is consistent with the steps recommended by Caplice et al. (2008) for preparing a statewide Freight System Resiliency plan.

29
Figure 13: Vulnerability Assessment Process (SAIC, 2002)
Each segment on the corridor consists of components including bridges, culverts, and paved highway segments. Various literature resources suggest methods to assess the vulnerability of these components, especially the bridges.
The vulnerability assessment for the bridges provides a uniform measure of the structures’ vulnerability to failure on the basis of the likelihood of failure occurring and consequences of the failure. The New York State DOT developed vulnerability assessment screening and evaluation procedures for its bridges as shown in Figure 14 (NYSDOT, 1996).
Figure 14: Vulnerability Rating Procedure (NYSDOT, 1996)
The New York State DOT uses a vulnerability rating (VR), which is the sum of likelihood and consequence scores (O’Conner, 2000). The subjective measures for likelihood (high, medium, low, or not vulnerable) are based on a classifying process that is specific to the type of vulnerability being considered. For example, if a bridge’s vulnerability is low, the likelihood score is 2. The consequence score is based on the type of bridge failure (catastrophic, partial collapse, or structural damage) and the exposure to the public from that failure. Table 5 lists five vulnerability ratings used in New York State. A more detailed description of VR is available in NCHRP Report 590 (Patidar et al., 2007).
Step 4: Identify Countermeasures
Step 5: Estimate Countermeasures Cost
Step 6: Operational Security Planning
Step 1: Identify Critical Assets
Step 2: Assess Vulnerabilities
Step 3: Assess Consequences

30
Table 5: Vulnerability Ratings used in New York State
Vulnerability Rating Definition
1 Designates a vulnerability to failure resulting from loads or events that are likely to occur. Remedial work to reduce the vulnerability is an immediate priority.
2 Designates a vulnerability to failure resulting from load or events that may occur. Remedial work to reduce the vulnerability is not an immediate priority but may be needed in the near future.
3 Designates a vulnerability to failure resulting from load or events that are possible but not likely. This risk can be tolerated until a normal capital project can be implemented.
4 Designates a vulnerability to failure presenting minimal risk providing that anticipated conditions do not change. Unexpected failure can be avoided during the remaining service life of the bridge by performing normal scheduled inspections, with attention to factors influencing the vulnerability.
5 Designates a vulnerability to failure that is less than or equal to the vulnerability of a structure built to the current design standards. Likelihood of failure is remote.
The National Bridge Inventory (NBI) condition ratings for the decks, superstructures, substructures, and the culverts, as well as vulnerabilities to floods and scour and weather events were used to determine the vulnerability ratings for bridges and culverts. Each corridor segment was assigned a vulnerability rating considering the failure modes and disruption effects.
The procedure adopted from NYSDOT report as described above, was applied to the bridges in the Wisconsin. The final vulnerability rating was calculated using the bridge vulnerability classification (specific to vulnerability type) and exposure ratings from the historic traffic flows. The data was collected from the highway structures information (HIS) inventory of the bridges in Wisconsin. The Wisconsin DOT maintains the inventory of the bridges along the corridors of Wisconsin, and it also calculates indexes for the bridges. Bridge load ratings are performed for specific purposes, such as: NBI reporting, overweight permit load checks, and bridge maintenance planning.
Some hazardous events occur on an almost annual basis while others may not happen within the space of a lifetime. Additionally, not every hazardous event occurs with notable damage. For bridges or other critical assets, factors contributing to each of the different failure modes are generally so unique and diverse that no meaningful relations exist between them (NYSDOT, 1996). Therefore, it is necessary to rate the vulnerability of structures across different failure modes based on the type of action needed. For this reason, we used a Failure Mode and Effect Analysis (FMEA) approach to analyze the potential impacts that may result from a failure. This general method, described below, can be used for all critical assets and components. The process of conducting a vulnerability assessment is based on a review of the intensity and frequency of hazards and an analysis of the physical, economic dimensions of vulnerability and exposure, while taking into account the coping capabilities pertinent to the risk scenarios (ISDR, 2004).

31
The priority of each segment is based on a normalized risk priority rating. The risk priority number (RPN) is calculated by using standard FMEA, which analyzes a design by identifying individual components, determining potential failure modes of these components, determining the effects, and then determining the cost of these effects. The procedure is shown in Figure 15.
Figure 15: FMEA Procedure for Calculating the Risk Priority Number
For this project, we analyzed the segments of the corridor considering different type of disruptions that might occur including the following:
1. Hydraulic Factors a. Scouring b. Flood scouring
2. Bridge Overload a. Traffic volumes b. Functional class
3. Weather a. Snow or ice b. Snow storms c. Tornadoes d. Severe storms
The Wisconsin State Emergency Response Management Center maintains a map showing the historic frequency of environmental emergencies at the county level (Figure 16).

32
Figure 16: Natural Disaster Events in Wisconsin by County 1990-2002
Shanely et al. (2006) describe a methodology for vulnerability assessment due to flooding disruptions in Wisconsin. The research follows Shanely et al.’s methodology to perform the vulnerability assessment for the corridor. The most important spatial data sets for the analysis are flood hazard maps from the Federal Emergency Management Administration (FEMA, 2004), digital elevation models (DEMs), road centerlines, and bridges.
Figure 17 shows the location of major water bodies along the corridor. Flooding is one of the major causes of disruption along the corridor. The data was utilized along with DEM maps to perform the vulnerability assessment.

33
Figure 17: Locations of Bodies of Water along the Corridor
For snow related failures, winter severity data was used. The data was obtained from the Wisconsin DOT’s Annual Winter Maintenance Report (2008). Developed in 1995, the severity index is a function of:
• Number of snow events • Number of freezing rain events • Total snow amount

34
Alternate Routes, Vulnerability and Resiliency Assessments The methodology described in Section 3 was the basis for assessing the corridor segments. This section provides detailed results of the overall resiliency assessment.
The Corridor Figure 18 shows the study consisting of 44 corridor segments, numbered from 0 to 43, occurring between consecutive interchanges.
Figure 18: Segment Numbering along the Hudson to Beloit Interstate Corridor

35
Table 6 lists the attributes of each segment (see Appendix A for additional attributes of each corridor segment).
Table 6: Attributes of the Corridor Segments
Corridor Segment ID Wisconsin Segment ID County
0 55000570 St Croix
1 55000591 St Croix
2 55000595 St Croix
3 55000490 St Croix
4 55021480 St Croix
5 55002280 Dunn
6 55021691 Dunn
7 55002410 Eau Claire
8 55002461 Eau Claire
9 55002474 Eau Claire
10 55021701 Eau Claire
11 55021834 Trempealeau
12 55021834 Jackson
13 55004130 Jackson
14 55004100 Jackson
15 55004140 Jackson
16 55021836 Jackson
17 55010750 Monroe
18 55004170 Monroe
19 55021892 Juneau
20 55005070 Juneau
21 55005080 Juneau
22 55005090 Juneau
23 55009970 Juneau
24 55009980 Sauk
25 55005200 Sauk

36
Corridor Segment ID Wisconsin Segment ID County
26 55021999 Columbia
27 55006680 Columbia
28 55006830 Columbia
29 55022066 Columbia
30 55007870 Dane
31 55008801 Dane
32 55007894 Dane
33 55008020 Dane
34 55008211 Dane
35 55008218 Dane
36 55008220 Dane
37 55022097 Dane
38 55008561 Rock
39 55008580 Rock
40 55009190 Rock
41 55008931 Rock
42 55008931 Rock
43 55008780 Rock
Alternate Routes Table 7 shows an excerpt of the assessment of alternative routes along the corridor. This table was obtained from GIS analysis of Wisconsin’s highway network model as described in Section 3.3 (see Appendix C for the full table of alternate routes). The percent change rows contain the results from evaluating an alternative route according the assessment criteria described above. The table columns include:
• Truck %. Percentage of trucks in the traffic stream. • AADT. Average Annual Daily Traffic. • Length. Length of the highway feature, in feet • Travel Time. Time in minutes required to travel per the posted average speed. • Total Truck Tons, Total Truck Loads, and Total Truck Value of the top ten commodities
passing over the highway segment.
The analysis of alternate routes was carried out considering the top ten commodities on each of the corridor segments. The alternate routes are considered for resiliency assessment using the metrics designated in the methodology section. The segment is defined as the section of the corridor in between two consecutive interchanges.

37
Table 7: Evaluation of Alternate Routes
Corridor Segment
ID Alternate
Route Alternate Route ID Truck % AADT
Length (ft)
Travel Time (min)
Total Truck Tons
Total Truck Loads
Total Truck Value ($)
0.127 40201 9041.762 5.188 42876487
2254299
2.40E+11
55000581 0.0988 18557 11648.05 6.684 0 0 0
55010960 0.0505 11395 3481.624 1.997 626956 34469 2611872993
1
2 0.0842 31032 802.2121 0.460 43653928
2300945
2.42E+11
Alternative 1 0.0988 31032 15931.88 9.142
Difference 0.02813 9169 -6890.12 -3.953
% change 22.808 -76.203 -76.203
55000601 0.17066 28773 10601.1 6.0833 289593 19426 183623158 2
55011690 0.08422 13306 11338.74 6.506 39502 2694 8557139
Alternative 2 0.171 28773 21939.84 12.590
Difference -0.0437 11428 -142.65 -7.401
1
% change 28.427 -142.65 -142.65
Vulnerability Assessment A vulnerability rating was computed for each corridor segment following the methodology described in the Section 3.4. The vulnerability rating is expressed as a risk priority number (RPN) on a relative scale of 1-10.
The vulnerability assessment considered a range of failure modes that might occur on the roadway and bridge/culvert elements comprising the corridor segments. The following is a list of the failures modes considered.
• Scouring • Scouring due to Floods • Traffic volumes • Functional classification and traffic exposure of bridge • Snow and ice accumulation • Tornadoes • Severe winter storms
The vulnerability assessment of the bridges considered the Sufficiency and NBI ratings (FHWA, 1995), which were extracted from Wisconsin DOT Highway Structures Inventory (HIS). Appendix C lists the bridges and culverts along the corridor that were included in the vulnerability assessment.
The vulnerability assessment of the roadways considered the potential for flooding and severe winter storms. The roadway along the corridor was divided into 350 one-mile sections. The

38
location of the center point of each roadway section determined the corridor segments to which it was assigned. The vulnerability to flooding considered the elevation and distance from nearby rivers, creeks or lakes. The vulnerability for snow events considered the Winter Severity Index.
The net rating for each corridor segment was calculated by averaging the risk priority number for the individual elements on the segment.
Average Risk Priority Number = Average (Ratings of Bridges + Rating of Roadway Elements
The average priority numbers for the corridor segments, based on the vulnerability of the bridges and roadway elements, are listed in column 4 of Table 8.
Resiliency Assessment The resiliency assessment depends on disruption-related risks. The risk assessment is based on both the vulnerability and the exposure of the infrastructure. The analysis entails identification of the various elements of the transportation system, and the corresponding vulnerabilities and the disruption effects.
Table 8 summarizes the assessment characteristics for each segment on the corridor including: economic activity on the segment, risk priority number (RPN) obtained from the vulnerability assessment, segment length, and length of the alternative routes available for the segments.
Table 8: Resiliency Performance Measures for Corridor Segments
Corridor Segment ID
(1)
STHN Segment ID
(2)
Economic Activity ($M/day)
(3)
Risk Priority Number
(10=High)
(4)
Length (meters)
(5)
Alternative Route
(6)
Alternative Length (m)
(7)
1 15931.88 1 55000591 658.1086 6.00 9041.76
2 21939.84
1 22642.17 2 55000595 653.8179 6.15 14400.91
2 40621.96
1 19102.88 3 55000490 654.5898 6.33 13270.44
2 31223.85
1 25162.36 4 55021480 686.8686 8.43 15530.74
2 31225.26
1 18229.42 5 55002280 646.4308 9.40 15682.98
2 92843.24
1 42929.77 6 55021691 646.7793 7.33 6751.91
2 51933.58
1 11860.57 7 55002410 620.8091 4.42 8856.70
2 19247.55

39
Corridor Segment ID
(1)
STHN Segment ID
(2)
Economic Activity ($M/day)
(3)
Risk Priority Number
(10=High)
(4)
Length (meters)
(5)
Alternative Route
(6)
Alternative Length (m)
(7)
8 55002461 615.8543 4.57 5812.90 1 9441.00
9 55002474 613.6574 3.75 2777.78 1 5984.99
1 29089.78 10 55021701 813.2806 4.75 24562.05
2 43787.84
1 51822.02 11 55021834 751.8051 6.07 10437.98
2 62793.05
1 51822.02 12 55021834 751.8051 5.00 10938.98
2 62793.05
13 55004130 664.0051 6.11 14676.90 1 31006.43
14 55004100 665.9607 6.00 2035.43 1 3476.31
1 20734.57 15 55004140 663.7934 6.21 17705.87
2 87783.78
1 22265.11 16 55021836 716.4767 7.00 16242.63
2 90626.66
17 55010750 809.5292 7.25 620.80 1 946.40
18 55004170 671.9690 7.50 5205.97 1 10143.02
1 19403.27 19 55021892 766.0396 7.17 11217.61
2 62162.38
1 10424.79 20 55005070 713.3563 6.31 9684.36
2 68836.82
1 13165.99 21 55005080 707.2032 6.33 11511.64
2 30046.58
1 28160.93 22 55005090 703.4161 6.25 24766.06
2 37807.48
23 55009970 833.4282 7.91 1837.26 1 4685.01
24 55009980 833.5560 8.14 3874.80 1 6690.89
25 55005200 700.6581 7.78 3508.66 1 3997.45

40
Corridor Segment ID
(1)
STHN Segment ID
(2)
Economic Activity ($M/day)
(3)
Risk Priority Number
(10=High)
(4)
Length (meters)
(5)
Alternative Route
(6)
Alternative Length (m)
(7)
2 25835.09
1 31257.16 26 55021999 795.5134 7.94 14051.63
2 28619.70
27 55006680 695.1750 8.00 3615.54 1 7110.23
1 34117.18 28 55006830 724.1036 7.68 16741.60
2 57056.98
1 24425.29 29 55022066 753.1934 7.08 11932.91
2 31817.22
30 55007870 730.0630 6.86 2255.44 1 3189.42
1 8710.95 31 55008801 817.9029 6.40 4897.48
2 15947.14
1 6852.58 32 55007894 760.5846 6.75 2306.47
2 8758.51
1 11273.55 33 55008020 649.5510 6.35 5954.11
2 21039.71
1 9222.95 34 55008211 633.0614 6.53 7861.24
2 30335.48
35 55008218 633.0614 6.50 13624.77 1 34468.08
36 55008220 633.0614 6.60 5636.59 1 28831.48
37 55022097 650.6523 5.69 3263.99 1 7752.96
1 17918.30 38 55008561 650.6523 5.04 12389.06
2 18950.31
39 55008580 712.5319 4.86 1197.02 1 1701.69
1 8745.71 40 55009190 727.2971 5.14 4760.61
2 9485.03
1 25440.18 41 55008931 699.1768 4.56 3053.27
2 27848.72

41
Corridor Segment ID
(1)
STHN Segment ID
(2)
Economic Activity ($M/day)
(3)
Risk Priority Number
(10=High)
(4)
Length (meters)
(5)
Alternative Route
(6)
Alternative Length (m)
(7)
1 25440.18 42 55008931 699.1762 4.56 12053.36
2 27848.72
The corridor segments were ranked according to their Inverse Resiliency Value. The inverse resiliency value for each segment, cs, is a dimensionless measure computed as follows:
€
Resiliency Value( )cs−1
= RPNcs ∗$day⎛
⎝ ⎜
⎞
⎠ ⎟ cs
∗ ΔVMTii∑
Where,
€
ΔVMTi is the extra vehicle miles travelled on each alternate route, i,
€
ΔVMTi = AADTcs − AADTi( )∗ Li − Lcs( )
And
€
$day⎛
⎝ ⎜
⎞
⎠ ⎟ cs
is the average economic activity on the Corridor segment, cs,
€
$day⎛
⎝ ⎜
⎞
⎠ ⎟ cs
=total annual value of commodities flowing on segment cs
365
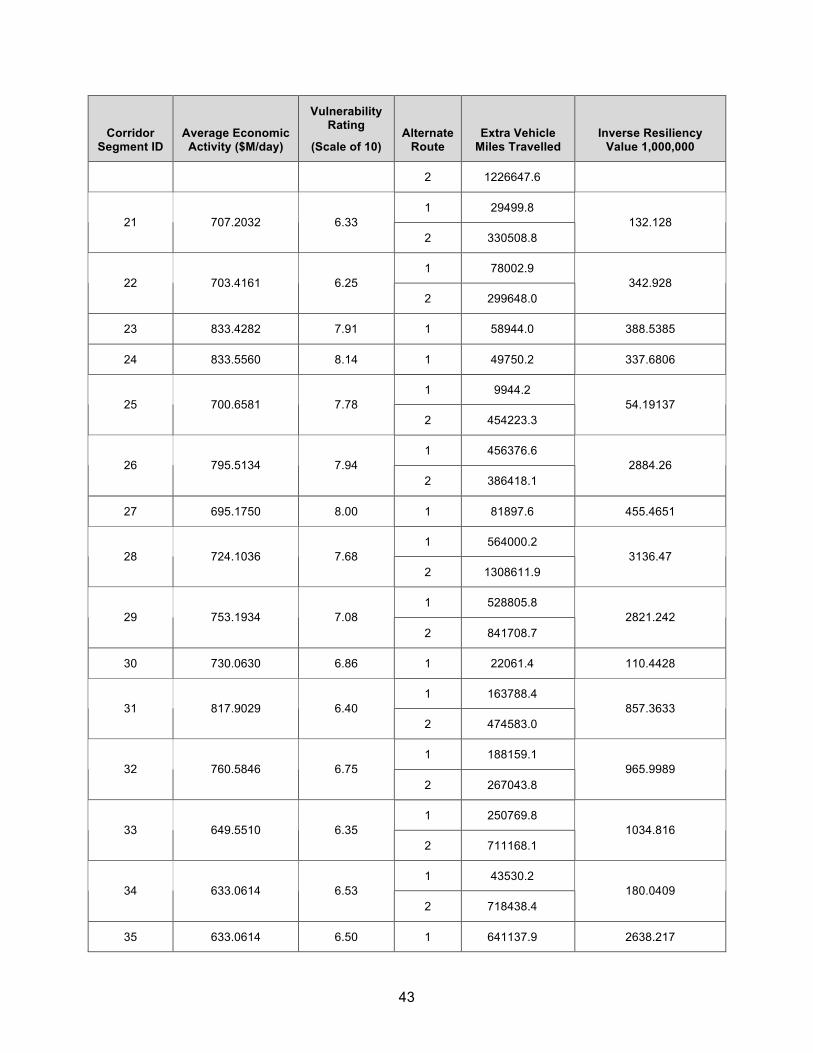
Table 9 lists the inverse resiliency value for each segment. The higher the inverse resiliency value, the more resilient the segment is. The ten segments with lowest inverse resiliency value, and thus classified as high priority, are highlighted in Table 10. These top ten high-risk segments are identified in Table 10 by their end point intersections on the Hudson to Beloit Interstate Corridor. The relative magnitudes of the inverse resiliency values indicate the relative priority. For example, the top ranked segment has an inverse resiliency value more than three times greater than the lowest ranked segment. This indicates a wide range of resiliency among these least resilient segments. Note that corridor segments 12 and 41 are not shown in Table 9 due to the lack of commodity flow information (TRANSEARCH) for highway segments along STH-121 and a recently constructed southern bypass of WI-11 around Janesville.
Table 9: Resiliency Value and Risk Priority Segments
Corridor Segment ID
Average Economic Activity ($M/day)
Vulnerability Rating
(Scale of 10) Alternate
Route Extra Vehicle
Miles Travelled Inverse Resiliency
Value 1,000,000
1 173120.9 1 658.1086 6.00
2 324076.5 683.5943
1 195762.8 2 653.8179 6.15
2 622854.2 787.6505
3 654.5898 6.33 1 128454.2 532.5372

42
Corridor Segment ID
Average Economic Activity ($M/day)
Vulnerability Rating
(Scale of 10) Alternate
Route Extra Vehicle
Miles Travelled Inverse Resiliency
Value 1,000,000
2 395407.9
1 190244.6 4 686.8686 8.43
2 309999.6 1101.387
1 57690.6 5 646.4308 9.40
2 1748093.3 350.5541
1 333198.1 6 646.7793 7.33
2 416123.1 1580.375
1 22670.8 7 620.8091 4.42
2 78422.0 62.22296
8 615.8543 4.57 1 67165.2 189.0924
9 613.6574 3.75 1 41924.4 96.47699
1 77104.9 10 813.2806 4.75
2 327404.9 297.8625
1 413741.0 11 751.8051 6.07
2 563134.0 1888.533
13 664.0051 6.11 1 241549.5 980.1618
14 665.9607 6.00 1 22979.5 91.82064
1 50049.2 15 663.7934 6.21
2 1158037.4 206.4532
1 78989.8 16 716.4767 7.00
2 975606.8 396.1603
17 809.5292 7.25 1 4270.6 25.06431
18 671.9690 7.50 1 70860.1 357.1182
1 193829.7 19 766.0396 7.17
2 1206329.7 1064.116
20 713.3563 6.31 1 15354.2 69.08832
43
Corridor Segment ID
Average Economic Activity ($M/day)
Vulnerability Rating
(Scale of 10) Alternate
Route Extra Vehicle
Miles Travelled Inverse Resiliency
Value 1,000,000
2 1226647.6
1 29499.8 21 707.2032 6.33
2 330508.8 132.128
1 78002.9 22 703.4161 6.25
2 299648.0 342.928
23 833.4282 7.91 1 58944.0 388.5385
24 833.5560 8.14 1 49750.2 337.6806
1 9944.2 25 700.6581 7.78
2 454223.3 54.19137
1 456376.6 26 795.5134 7.94
2 386418.1 2884.26
27 695.1750 8.00 1 81897.6 455.4651
1 564000.2 28 724.1036 7.68
2 1308611.9 3136.47
1 528805.8 29 753.1934 7.08
2 841708.7 2821.242
30 730.0630 6.86 1 22061.4 110.4428
1 163788.4 31 817.9029 6.40
2 474583.0 857.3633
1 188159.1 32 760.5846 6.75
2 267043.8 965.9989
1 250769.8 33 649.5510 6.35
2 711168.1 1034.816
1 43530.2 34 633.0614 6.53
2 718438.4 180.0409
35 633.0614 6.50 1 641137.9 2638.217

44
Corridor Segment ID
Average Economic Activity ($M/day)
Vulnerability Rating
(Scale of 10) Alternate
Route Extra Vehicle
Miles Travelled Inverse Resiliency
Value 1,000,000
36 633.0614 6.60 1 549815.5 2297.242
37 650.6523 5.69 1 118200.1 437.7793
1 156987.7 38 650.6523 5.04
2 186288.8 514.8078
39 712.5319 4.86 1 13837.3 47.88903
1 113603.2 40 727.2971 5.14
2 134679.0 424.9195
1 294083.3 42 699.1762 4.56
2 362276.5 936.6953
Table 10: Ten Least Resilient Segments on the I-90/94 Hudson to Beloit Interstate Corridor
Rank
Corridor Segment
ID
Inverse Resiliency Value
1,000,000 To Intersection From Intersection
1 28 3136.5 I90E: 60E, M108A, Columbia Co. I90E: 39N, M115, Columbia Co.
2 26 2884.3 I90E: 60E, M108A, Columbia Co. I90E: 12N, Lake Delton, Sauk Co.
3 29 2821.2 I90E: 19E, Windsor, Dane Co. Lodi: E, M115, Columbia Co.
4 35 2638.2 I90E: 12E, New Lisbon, Juneau Co. I94E:I90E, Tomah, Monroe Co.
5 36 2297.2 I90E: 51N, M156, Dane Co. I90E: 12E, M142, Dane Co.
6 11 1888.5 I90E: 73N,M157, Dane County I90E: 51N, M156, Dane County
7 6 1580.4 I94E: 10E,M098, Jackson Co. I94E: 121E, Osseo, Trempealeau Co.
8 4 1101.4 I94E: 12E, M90, Eau Claire Co. I94E: 12E, M059, Elk Mound, Dunn Co.
9 19 1064.1 I94E: 12E, M041, Menomonie, Dunn Co.
I94E: 128N, M028 Spring Valley, St. Croix Co.
10 33 1034.8 I90E:I94E, M142 Madison, Dane Co. I90E: 12E, M138 Madison, Dane Co.

45
Figure 19: Top 10 High Priority Segments

46
Summary and Suggested Next Steps
Summary Various transportation systems, including the corridors that support high volumes of freight and passenger vehicles, are faced with unplanned emergencies, disruptions, and disasters. These disruptions affect the overall economy by constraining the free and efficient flow of commodities, and have a significant impact on travelers. Transportation system resilience analysis provides a way to assess the vulnerabilities in transportation networks and improve recovery after the natural or man-made disasters guiding investment plans to fortify against disruptions. This research provides decision makers with operational resilience information that will help ensure reliable function of the Beloit to Hudson Interstate Highway Corridor while maintaining the normal pass through capacity.
Recent examples of disruptions in Wisconsin along an interstate corridor from Hudson to Beloit include a severe winter storm (February 2008) and flooding (June 2008). On February 6, 2008, a severe winter storm hit Wisconsin and resulted in over 13 inches of snow and ice. Difficult travel conditions caused multiple tractor-trailers to lose traction and block the road. The conditions proved difficult for the cleanup personnel, and traffic backed up to over 1050 vehicles. This 17-mile backup brought movement through this region to a standstill. Such events demonstrate the importance of studying the corridor.
The corridor’s operational impacts—including both economic and service level—are measured for the critical segment disruptions along the corridor, based on resilience metrics including travel distance, travel times, traffic volumes, and level of service. The more resilient an affected highway segment is, the less significant the disruption will be and the quicker the area economy can return to business as usual.
The project followed a framework for developing a statewide freight system resiliency plan to identify the top ten high-risk (low operational resilience) segments along the I-90/94 Interstate Highway Corridor from Hudson to Beloit, Wisconsin. Resiliency in this project is a function of the vulnerability, economic importance, and the alternate routes. The analysis considered both freight trucks carrying top ten commodities and passenger vehicles. The corridor was divided into 43 segments, each starting and ending at interchanges with state trunk highways. The evaluation metrics included alternate route distance and travel time, change in traffic volumes on the alternate routes, and the change in level of service for the traffic. The vulnerabilities of the bridges, culverts, and road segments of each corridor segment were assessed for various failures modes ranging from scouring, flood scouring, traffic overloads, snow storms, and ice accumulation using a basic failure mode and effects (FMEA) analysis. The FMEA analysis resulted in risk priority numbers, which provided a rating for each corridor segment on a scale of 10 (high) to 1 (low). The evaluation metrics, along with vulnerability ratings, were used to determine an overall resiliency rating for each corridor segment, thus resulting in a prioritization of the segments based on their resiliency risk.
The resiliency assessment in this project calculates the resiliency risk using the vulnerability rating, economic rating related to top ten commodity traffic, and the alternate routes, all bound to the resiliency metrics developed for the project’s resiliency objectives. A segment with a high vulnerability rating could be highly risky (less resilient) even though it carries modest freight traffic and there are feasible alternate routes. The resulting relative risk assessment was used to prioritize the corridor segments.

47
Recommendations for Next Steps This project provided the preliminary research for prioritizing the corridor segments according to their resiliency ratings. These resiliency rates can be used by the Wisconsin DOT to review the response plans for the high-risk corridor segments.
This study might be extended with an analysis of the transfer of response to recovery. This includes recommended strategies for directing traffic onto the alternate routes. The impact on the urban and rural systems and the corresponding responding strategies in terms of traffic control and incident management might also be studied. Mixing these study results with the regulatory and policy procedures, including public/private partnerships, will help reduce the economic impact of disruptions on the transportation system of Wisconsin.
The response would be at two different levels: operational and strategic planning. The former deals with advance traffic information deployment along the corridors, and the latter deals with policy issues for consideration of alternative capacities for high priority and vulnerable regions for a future network development plan.
The results of this research suggest several basic mitigation actions. At the operational level, the Wisconsin DOT could implement the traffic management and communication plans with the help of agency personnel at the regional traffic management and emergency response centers. These plans should include advance traffic information deployment using intelligent transportation systems (ITS) and traffic navigation information. At the strategic level, the Wisconsin DOT could review regulatory and policy procedures for communicating with local jurisdictions along the high-risk corridor segments. At the investment level, the Wisconsin DOT should consider mitigation strategies to be included in the future network development plans.

48
References ArcGIS Network Analyst® ArcGIS Network Analyst Extension, http://www.esri.com/software/arcgis/extensions/networkanalyst/index.html. (Accessed: Aug. 2009)
Beagan, D. and L. Grenzeback. (2002). Freight Impacts on Ohio’s Roadway Systems. FHWA/OH-2002/026. Ohio Department of Transportation. http://www.dot.state.oh.us/Divisions/TransSysDev/ProgramMgt/Freight/Pages/FreightImpactsFinalReport.aspx (Accessed: March 2010)
Brathen, S., J. Husdal, and S. Laegran. (2004). Bottlenecks in Long-Distance Road Freight Transport, Project Report No, 245701, Sweco Groner, Oslo, Norway.
Bruneau, M., S. E. Chang, R. T. Eguchi, G. C. Lee, T. D. O’Rourke, A. M. Reinhorn, M. Shinozuka, K. Tierney, W.A. Wallace, and D. von Winterfeldt. (2003). “A framework to quantitatively assess and enhance the seismic resilience of communities.” Earthquake Spectra, Vol. 19, No. 4, pp.733–752.
Cambridge Systematics. (1997). A Guidebook for Forecasting Freight Transportation Demand. NCHRP Report 388, TRB. National Academy Press. Washington, D.C.
Cambridge Systematics. (2009). Wisconsin Truck Size and Weight Study. Final Report, Prepared for Wisconsin Department of Transportation, WI
Caplice, C., J.B. Rice, Jr., B. Ivanov and E. Stratton. (2008). Development of a State Wide Freight System Resiliency Plan. Prepared for the WSDOT, MIT Center for Transportation and Logistics, Massachusetts Institute of Technology, Cambridge, MA.
Chang, S.E., D. Ericson and L. Pearce. (2003). Airport Closures in Natural and Human-Induced Disasters: Business Vulnerability and Planning, Office of Critical Infrastructure Protection and Emergency Preparedness, Ontario, Canada.
FEMA. (2004). National Incident Management System. U.S. Department of Homeland Security, Federal Emergency Management Agency, March.
FHWA. (1995). Recording and Coding Guide for the Structure Inventory and Appraisal of the Nation’s Bridges. Report FHWA-PD-96-001, Federal Highway Administration. http://www.fhwa.dot.gov/BRIDGE/mtguide.pdf (Accessed: April 2009)
George, M., D. Rowlands, M. Price and J. Maxey. (2005). The Lean Six Sigma Pocket Toolbook, McGraw-Hill Press. New York, NY.
Goodchild A., E. Jessup, E. McCormack, C. Ta, K. Pitera, and D. Andreoli. (2009). Washington State Freight System Resiliency. Prepared for Washington State Dept of Transportation. University of Washington, Seattle, WA.
Giuliano, G., and J. Golob. (1998). “Impacts of the Northridge Earthquake on transit and highway use,” Journal of Transportation Statistics, 1(2):1-20. May.
Horowitz, A.J., (1999). “Freight Forecasting,” Chap. 4, In, Guidebook on Statewide Travel Forecasting, Report FHWA-HEP-99-007, Federal Highway Administration, Washington, D.C.
ISDR. (2004). “Basic terms of disaster risk reduction.” International Secretariat for Disaster Reduction: Terminology. http://www.unisdr.org/eng/library/lib-terminology-eng%20home.htm(Accessed: Dec. 2009).

49
Mileage Calculation for 2007 Commodity Flow Survey. http://www.bts.gov/publications/ commodity_flow_survey/methodology/index.html#mileage_calculation> (Accessed: July 2009)
National Response Plan (2004). U.S. Department of Homeland Security. December
NYSDOT. (1996). Hydraulic Vulnerability Manual. Bridge Safety Assurance Program, New York State Department of Transportation, N.Y.
O'Conner, J. S. (2000). “Bridge safety assurance measures taken in New York State.” TRR: Journal of the Transportation Research Board, No. 1696. pp. 187–292.
Patidar V., S. Labi, K.C. Sinha, and P. Thompson. (2007). Multi-Objective Optimization for Bridge Management Systems. NCHRP Report 590, TRB. Washington D.C.
SAIC. (2002). A Guide to Highway Vulnerability Assessment for Critical Asset Identification and Protection, Science Applications International Corporation.
SAIC. (2004). Concept of Operations for Emergency Transportation Operations. Science applications International Corporation.
Shanely, L.A., T. Bellovary, P. Amanda, L. Schwoegler-Boos, A. Lulloff. (2006). “GIS data sharing and flood hazards in Wisconsin.” Wisconsin Land Information Association Emergency Management Task Force White Paper. http://www.wlia.org/resources/datasharingfloods.pdf (Accessed: April 2010).
Sheffi, Y., and J. Rice. (2005). “A supply chain view of the resilient enterprise,” Sloan Management Review, 47(1):41–48.
Sorratini, J.A and R.L. Smith, Jr. (2000). “Development of a statewide truck trip forecasting model based on commodity flows and input-output coefficients,” TRR 1707, pp.49-55.
Srinivasan, K. (2004). “Transportation network vulnerability assessment: A quantitative framework.” Transportation Security Papers 2002, TRIS p.63-82 http://stc.utk.edu/STCresearch/completed/PDFs/web/webcomstc.pdf (Accessed: April 2010)
Tierney, K. and M. Bruneau. (2007). “Conceptualizing and measuring resilience: a key to disaster loss reduction.” TR News. 2006. Vol. 250, No. 14, 2007, pp. 15.
Wisconsin Department of Transportation (WISDOT). (2008). Annual Winter Maintenance Report. Bureau of Highway Operations Winter Operations Unit.
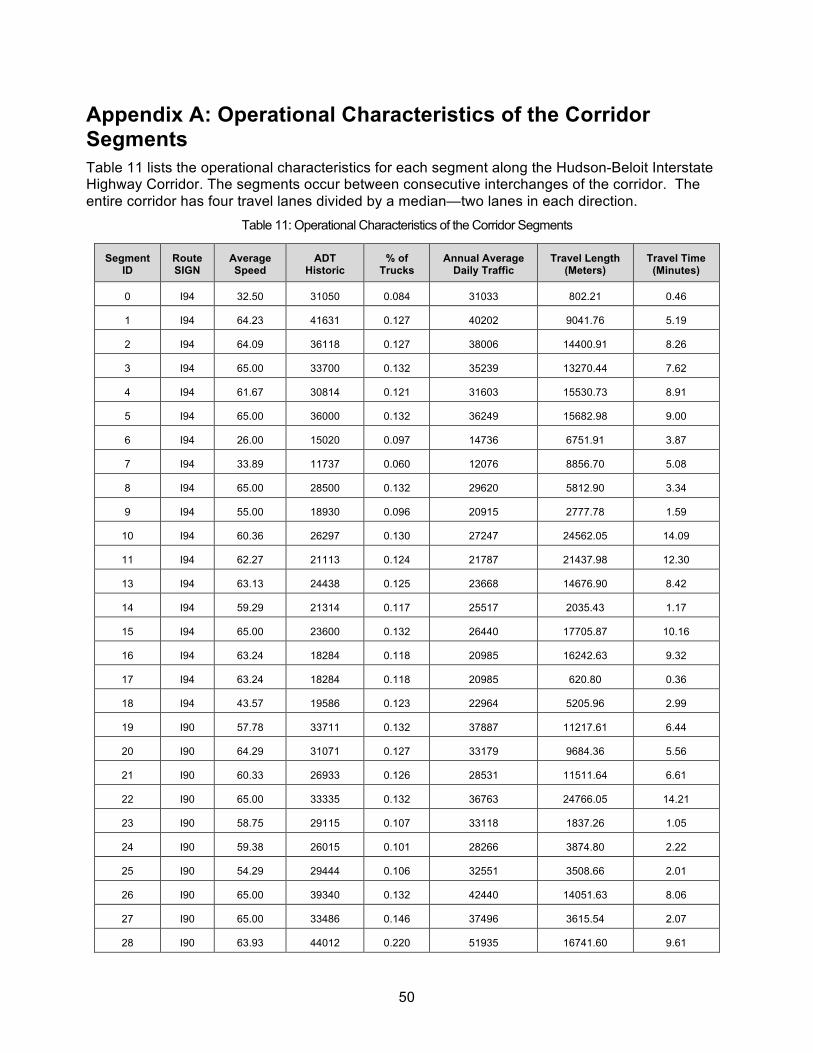
50
Appendix A: Operational Characteristics of the Corridor Segments Table 11 lists the operational characteristics for each segment along the Hudson-Beloit Interstate Highway Corridor. The segments occur between consecutive interchanges of the corridor. The entire corridor has four travel lanes divided by a median—two lanes in each direction.
Table 11: Operational Characteristics of the Corridor Segments
Segment ID
Route SIGN
Average Speed
ADT Historic
% of Trucks
Annual Average Daily Traffic
Travel Length (Meters)
Travel Time (Minutes)
0 I94 32.50 31050 0.084 31033 802.21 0.46
1 I94 64.23 41631 0.127 40202 9041.76 5.19
2 I94 64.09 36118 0.127 38006 14400.91 8.26
3 I94 65.00 33700 0.132 35239 13270.44 7.62
4 I94 61.67 30814 0.121 31603 15530.73 8.91
5 I94 65.00 36000 0.132 36249 15682.98 9.00
6 I94 26.00 15020 0.097 14736 6751.91 3.87
7 I94 33.89 11737 0.060 12076 8856.70 5.08
8 I94 65.00 28500 0.132 29620 5812.90 3.34
9 I94 55.00 18930 0.096 20915 2777.78 1.59
10 I94 60.36 26297 0.130 27247 24562.05 14.09
11 I94 62.27 21113 0.124 21787 21437.98 12.30
13 I94 63.13 24438 0.125 23668 14676.90 8.42
14 I94 59.29 21314 0.117 25517 2035.43 1.17
15 I94 65.00 23600 0.132 26440 17705.87 10.16
16 I94 63.24 18284 0.118 20985 16242.63 9.32
17 I94 63.24 18284 0.118 20985 620.80 0.36
18 I94 43.57 19586 0.123 22964 5205.96 2.99
19 I90 57.78 33711 0.132 37887 11217.61 6.44
20 I90 64.29 31071 0.127 33179 9684.36 5.56
21 I90 60.33 26933 0.126 28531 11511.64 6.61
22 I90 65.00 33335 0.132 36763 24766.05 14.21
23 I90 58.75 29115 0.107 33118 1837.26 1.05
24 I90 59.38 26015 0.101 28266 3874.80 2.22
25 I90 54.29 29444 0.106 32551 3508.66 2.01
26 I90 65.00 39340 0.132 42440 14051.63 8.06
27 I90 65.00 33486 0.146 37496 3615.54 2.07
28 I90 63.93 44012 0.220 51935 16741.60 9.61

51
Segment ID
Route SIGN
Average Speed
ADT Historic
% of Trucks
Annual Average Daily Traffic
Travel Length (Meters)
Travel Time (Minutes)
29 I90 65.00 63646 0.243 67728 11932.91 6.85
30 I90 58.33 35067 0.114 37793 2255.44 1.29
31 I90 65.00 71400 0.243 68720 4897.48 2.81
32 I90 62.50 60925 0.169 66223 2306.47 1.32
33 I90 62.50 70700 0.205 75428 5954.11 3.42
34 I90 63.75 47175 0.225 51148 7861.24 4.51
35 I90 64.17 48617 0.229 49216 13624.77 7.82
36 I90 61.67 37868 0.189 37927 5636.59 3.23
37 I90 61.67 37633 0.181 42130 3263.99 1.87
38 I90 64.41 44453 0.232 45428 12389.06 7.11
39 I90 52.50 38700 0.146 43870 1197.02 0.69
40 I90 52.22 40933 0.173 45611 4760.61 2.73
42 I90 58.00 39785 0.213 45301 15053.36 8.64
43 I90 52.00 34240 0.194 40464 3707.79 2.13

52
Appendix B: Analysis of Alternate Routes for the Corridor Segments Table 12 lists the available alternate routes for each of the corridor segments, along with the respective calculated metrics for each route.
The major fields of interest for each highway feature are:
1. TRKYR. The percentage of trucks per year in the traffic. 2. AADT. Average Annual Daily Traffic. 3. Length. The length of the highway feature, in feet. 4. Minutes. The expected travel time based on the average speed. 5. Total Truck Tons, Truck Loads, and Truck Val are the annual amounts for the top ten
commodities using the highway segment.
The additional measures calculated are:
1. Alternate 1. The sum of lengths of individual highway segments that make up the alternative, the sum of travel time for those individual highway segments, the maximum AADT among the segments, and the maximum TRKYR percentage among the segments.
2. Difference. The calculated difference in the net measures between the corridor segment and the alternate routes considered.
3. % change. • Percentage change in the AADT relative to the original corridor segment; the value is
positive for decrease in maximum AADT and negative for increase in maximum AADT. • Percentage change in the detour length relative to the original corridor segment; positive
values for decrease, negative values for increase in length. Table 12: Corridor Segments and Corresponding Alternate Routes
Alternate Route
Cor
ridor
Se
gmen
t ID
Routes Segment
ID %
Trucks AADT Length
Travel time (min)
Total Truck Tons
Total Truck Loads Total Value ($)
0.127 40202 9041.76 5.19 42876487 2254300 2.40E+11
55000581 0.099 18558 11648.05 6.68 0 0 0
55010960 0.051 11395 3481.62 2.00 626956 34469 2611872993 Alternate 1
2 0.084 31033 802.21 0.46 43653928 2300946 2.42E+11
Total 1 0.099 31033 15931.88 9.14
Difference 0.028 9169 -6890.12 -3.95
% change 23 -76.20 -76.20
55000601 0.171 28773 10601.10 6.08 289593 19426 183623158.3 Alternate 2
55011690 0.084 13307 11338.74 6.51 39502 2694 8557139.485
Total 2 0.171 28773 21939.84 12.59
Difference -0.044 11428 12898.84 -7.40
1
% change 28 -142.65 -142.65
0.127 38006 14400.91 8.26 42750322 2249404 2.39E+11
55010960 0.051 11395 3481.62 2.00 626956 34469 2611872993
55000583 0.053 9530 1534.89 0.88 356810 18335 2084708675
2
Alternate 1
55000587 0.087 3413 13397.41 7.69 0 0 0

53
Alternate Route C
orrid
or
Segm
ent
ID
Routes Segment
ID %
Trucks AADT Length
Travel time (min)
Total Truck Tons
Total Truck Loads Total Value ($)
55000677 0.090 6070 921.86 0.53 12737 753 40481260.58
55000500 0.095 19868 3306.39 1.90 12737 753 40481260.58
Total 1 0.095 19868 22642.17 12.99
Difference 0.032 18138 -8241.26 -4.73
% change 48 -57.23 -57.23
55011690 0.084 13307 11338.74 6.51 39502 2694 8557139.485
55021486 0.049 6870 1981.85 1.14 329096 22120 192180297.8
55000639 0.097 6680 1488.70 0.85 13349 880 13583944.81
55000610 0.114 3297 17918.67 10.28 0 0 0
Alternate 2
55021484 0.170 3978 7894.00 4.53 76597 4344 319638266.9
Total 2 0.170 13307 40621.96 23.31
Difference -0.043 24700 -26221.00 -15.05
% change 65 -182.08 -182.08
0.132 35239 13270.44 7.62 42801127 2252066 2.39E+11
55000500 0.095 19868 3306.39 1.90 12737 753 40481260.58
55000482 0.060 2818 13540.68 7.77 0 0 0 Alternate 1
55012290 0.088 3320 2255.81 1.29 0 0 0
Total 1 0.095 19868 19102.88 10.96
Difference 0.037 15371 -5832.44 -3.35
% change 44 -44 -44
55021484 0.170 3978 7894.00 4.53 76597 4344 319638266.9
55000520 0.163 2757 1531.55 0.88 76597 4344 319638266.9
55021476 0.104 2585 13177.07 7.56 0 0 0
55021477 0.112 2310 2081.33 1.19 0 0 0
Alternate 2
55012240 0.124 17960 6539.90 3.75 0 0 0
Total 2 0.170 17960 31223.85 17.92
Difference -0.038 17279 -17953.40 -10.30
3
% change 49 -135 -135
0.121 31603 15530.73 8.91 44286796 2325227 2.51E+11
55012290 0.088 3320 2255.81 1.29 0 0 0
55021482 0.063 1570 4802.12 2.76 0 0 0
55021483 0.063 2247 12887.12 7.40 0 0 0
55000487 0.081 14870 4566.18 2.62 0 0 0
Alternate 1
55000458 0.093 29490 651.13 0.37 27704 1835 26708941.2
Total 1 0.093 51497 25162.36 14.44
Difference 0.028 19893 -9631.62 -5.53
% change 63 -62 -62
55012240 0.124 17960 6539.90 3.75 0 0 0
4
Alternate 2
55021478 0.137 1725 4636.76 2.66 0 0 0

54
Alternate Route C
orrid
or
Segm
ent
ID
Routes Segment
ID %
Trucks AADT Length
Travel time (min)
Total Truck Tons
Total Truck Loads Total Value ($)
55021479 0.096 3245 17044.64 9.78 0 0 0
55000453 0.055 21685 2352.85 1.35 27704 1835 26708941.2
55000458 0.093 29490 651.13 0.37 27704 1835 26708941.2
Total 2 0.137 74105 31225.26 17.92
Difference -0.015 42502 -15694.50 -9.01
% change 134 -101 -101
0.132 36249 15682.98 9.00 41883168 2200212 2.36E+11
55000458 0.093 29490 651.13 0.37 27704 1835 26708941.2
55000453 0.055 21685 2352.85 1.35 27704 1835 26708941.2 Alternate 1
55002290 0.074 12934 15225.45 8.74 0 0 0
Total 1 0.093 29490 18229.42 10.46
Difference 0.039 6759 -2546.44 -1.46
% change 19 -16 -16
55000458 0.093 29490 651.13 0.37 27704 1835 26708941.2
55000453 0.055 21685 2352.85 1.35 27704 1835 26708941.2
55000384 0.065 10610 1621.02 0.93 27704 1835 26708941.2
55021472 0.175 4035 19466.45 11.17 27704 1835 26708941.2
55021473 0.219 2390 6403.32 3.67 27704 1835 26708941.2
55000390 0.102 6675 2500.17 1.43 144152 7334 593381454.6
55011680 0.069 7315 1211.33 0.70 814683 38909 2460217502
55022261 0.091 3294 10571.74 6.07 694386 33236 1874797229
55022263 0.095 2950 1689.94 0.97 694386 33236 1874797229
55022264 0.093 3080 17141.83 9.84 694386 33236 1874797229
55022265 0.080 4905 6656.80 3.82 694386 33236 1874797229
55002481 0.078 17097 3376.77 1.94 795407 39994 1933975904
7 0.060 12076 8856.71 5.08 39410469 2073615 2.27E+11
55021692 0.044 10390 3636.82 2.09 57360968 2950667 2.91E+11
Alternate 2
6 0.097 14736 6751.91 3.87 41742464 2190608 2.36E+11
Total 2 0.219 29490 92888.78 53.30
Difference -0.087 6759 -77205.80 -44.30
5
% change 19 -492 -492
0.097 14736 6751.91 3.87 41742464 2190608 2.36E+11
55002300 0.219 11340 539.23 0.31 509366 28061 831069809.2
55021680 0.034 2057 5667.54 3.25 462460 25413 683344518.2
55021681 0.110 12947 18259.96 10.48 462460 25413 683344518.2
55004770 0.098 21085 3444.15 1.98 2807465 140559 11709230690
55004781 0.049 5990 4089.59 2.35 5180420 259992 20574472675
55021873 0.049 5990 1076.83 0.62 5180420 259992 20574472675
6
Alternate 1
55004785 0.097 25780 855.12 0.49 5180420 259992 20574472675

55
Alternate Route C
orrid
or
Segm
ent
ID
Routes Segment
ID %
Trucks AADT Length
Travel time (min)
Total Truck Tons
Total Truck Loads Total Value ($)
55012540 0.097 25780 4741.17 2.72 2331995 116994 9479124886
55002434 0.073 15855 1187.27 0.68 2331995 116994 9479124886
55002432 0.049 10275 3068.91 1.76 2331995 116994 9479124886
Total 1 0.219 25780 42929.77 24.64
Difference -0.122 -11044 -36177.90 -20.76
% change -75 -535.82 -535.82
55002300 0.219 11340 539.23 0.31 509366 28061 831069809.2
55021680 0.034 2057 5667.54 3.25 462460 25413 683344518.2
55021681 0.110 12947 18259.96 10.48 462460 25413 683344518.2
55004770 0.098 21085 3444.15 1.98 2807465 140559 11709230690
55004781 0.049 5990 4089.59 2.35 5180420 259992 20574472675
55021873 0.049 5990 1076.83 0.62 5180420 259992 20574472675
55004785 0.097 25780 855.12 0.49 5180420 259992 20574472675
55004786 0.097 25780 2330.20 1.34 2848424 142998 11095347777
55012610 0.097 21500 2214.17 1.27 0 0 0
55012640 0.000 0 1087.31 0.62 0 0 0
55002441 0.073 23560 1433.24 0.82 1156011 59508 3736697146
55002420 0.081 12800 2079.55 1.19 1156011 59508 3736697146
Alternate 2
7 0.060 12076 8856.71 5.08 39410469 2073615 2.27E+11
Total 2 0.219 25780 51933.58 29.80
Difference -0.122 -11044 -45181.70 -25.93
%change -75 -669.17 -669.17
0.060 12076 8856.71 5.08 39410469 2073615 2.27E+11
55002432 0.049 10275 3068.91 1.76 2331995 116994 9479124886
55002434 0.073 15855 1187.27 0.68 2331995 116994 9479124886
55002436 0.097 29173 4134.28 2.37 0 0 0
55002438 0.049 15220 1390.56 0.80 0 0 0
Alternate 1
55002420 0.081 12800 2079.55 1.19 1156011 59508 3736697146
Total 1 0.097 29173 11860.57 6.81
Difference -0.037 -17097 -3003.86 -1.72
% change -142 -33.92 -33.92
55002432 0.049 10275 3068.91 1.76 2331995 116994 9479124886
55002434 0.073 15855 1187.27 0.68 2331995 116994 9479124886
55012540 0.097 25780 4741.17 2.72 2331995 116994 9479124886
55004786 0.097 25780 2330.20 1.34 2848424 142998 11095347777
55012610 0.097 21500 2214.17 1.27 0 0 0
55012640 0.000 0 1087.31 0.62 0 0 0
55012770 0.073 23560 1105.73 0.63 0 0 0
7
Alternate 2
55002441 0.073 23560 1433.24 0.82 1156011 59508 3736697146

56
Alternate Route C
orrid
or
Segm
ent
ID
Routes Segment
ID %
Trucks AADT Length
Travel time (min)
Total Truck Tons
Total Truck Loads Total Value ($)
55002420 0.081 12800 2079.55 1.19 1156011 59508 3736697146
Total 2 0.097 25780 19247.55 11.05
Difference -0.037 -13704 -10390.80 -5.96
% change -113 -117.32 -117.32
0.132 29620 5812.91 3.34 39025339 2052457 2.25E+11
55002420 0.081 12800 2079.55 1.19 1156011 59508 3736697146
55002441 0.073 23560 1433.24 0.82 1156011 59508 3736697146
55002445 0.064 33280 2589.61 1.49 1156011 59508 3736697146
55002521 0.072 18597 2586.90 1.48 123957 7060 419018440.2
Alternate 1
55002451 0.064 33280 751.72 0.43 2252488 109966 9110208404
Total 1 0.081 33280 9441.00 5.42
Difference 0.051 -3660 -3628.10 -2.08
8
%c hange -12 -62.41 -62.41
0.096 20915 2777.78 1.59 38520965 2027209 2.24E+11
55002521 0.072 18597 2586.90 1.48 123957 7060 419018440.2 Alternate 1
55002454 0.105 17862 3397.89 1.95 3656115 176895 18051012684
Total 1 0.105 18597 5984.79 3.43
Difference -0.009 2318 -3207.01 -1.84
9
% change 11 -115.45 -115.45
0.130 27247 24562.05 14.09 57795584 2964164 2.97E+11
55021699 0.065 3112 21234.67 12.19 0 0 0
55021700 0.069 1240 2790.81 1.60 0 0 0
55002890 0.079 4193 3658.92 2.10 136049 6737 588604291.7 Alternate 1
55002900 0.090 13888 1405.39 0.81 151700 7514 682211313.2
Total 1 0.090 13888 29089.78 16.69
Difference 0.040 13359 -4527.73 -2.60
% change 49 -18.43
9 0.096 20915 2777.78 1.59 38520965 2027209 2.24E+11
55021697 0.115 7700 18121.25 10.40 628331 32308 1220900772
55021698 0.160 4220 2160.12 1.24 628331 32308 1220900772
55002870 0.086 3460 6206.10 3.56 136049 6737 588604291.7
55002880 0.105 2593 9458.28 5.43 136049 6737 588604291.7
55002890 0.079 4193 3658.92 2.10 136049 6737 588604291.7
Alternate 2
55002900 0.090 13888 1405.39 0.81 151700 7514 682211313.2
Total 2 0.160 20915 43787.84 25.13
Difference -0.031 6332 -19225.80 -11.03
10
% change 23 -78.27 -78.27
0.124 21787 21437.98 12.30 46309953 2455449 2.74E+11 11
Alternate 1 55002910 0.101 5435 2469.22 1.42 327748 16298 1881092923

57
Alternate Route C
orrid
or
Segm
ent
ID
Routes Segment
ID %
Trucks AADT Length
Travel time (min)
Total Truck Tons
Total Truck Loads Total Value ($)
55021741 0.206 3154 15512.19 8.90 274130 13817 1672470171
55021744 0.161 4180 1573.14 0.90 274130 13817 1672470171
55021825 0.135 1546 10278.35 5.90 0 0 0
55021826 0.138 1502 6722.62 3.86 0 0 0
55004060 0.109 2303 15266.50 8.76 122111 6680 174119000
Total 1 0.206 5435 51822.02 29.74
Difference -0.082 16352 -30384.00 -17.44
% change 75 -141.73 -141.73
55002900 0.090 13888 1405.39 0.81 151700 7514 682211313.2
55004201 0.082 6046 27991.61 16.06 15651 776 93607021.48
55004206 0.077 4273 8874.24 5.09 15320 762 92968394.83
55004790 0.081 4123 2467.10 1.42 603855 33517 1579162746
55021837 0.084 4053 6867.91 3.94 652640 35427 1571865476
Alternate 2
55021838 0.102 6299 15186.80 8.71 652640 35427 1571865476
Total 2 0.102 13888 62793.05 36.03
Difference 0.023 7899 -41355.10 -23.73
% change 36 -192.91 -192.91
0.125 23668 14676.90 8.42 42440799 2216434 2.42E+11
55004060 0.109 2303 15266.50 8.76 122111 6680 174119000 Alternate 1
55004070 0.085 3723 15739.93 9.03 42064 2622 95428732.76
Total 1 0.109 3723 31006.43 17.79
Difference 0.016 19945 -16329.50 -9.37
13
%change 84 -111.26 -111.26
0.117 25517 2035.43 1.17 42709270 2232732 2.43E+11
55004080 0.097 16885 1596.05 0.92 0 0 0
55004090 0.101 20020 1580.78 0.91 123740 6726 508188610.1 Alternate 1
55004753 0.079 16970 299.50 0.17 5076 314 7773721.38
Total 1 0.101 20020 3476.32 1.99
Difference 0.016 5497 -1440.89 -0.83
14
% change 22 -70.79 -70.79
0.132 26440 17705.87 10.16 42470235 2218964 2.42E+11
55004090 0.101 20020 1580.78 0.91 123740 6726 508188610.1
55004381 0.085 947 18348.82 10.53 0 0 0 Alternate 1
55004757 0.074 7597 804.98 0.46 128816 7039 515962331.5
Total 1 0.132 20020 20734.57 11.90
Difference -0.031 6420 -3028.70 -1.74
%change 24 -17.11 -17.11
55004090 0.101 20020 1580.78 0.91 123740 6726 508188610.1
15
Alternate 2
55004757 0.074 7597 804.98 0.46 128816 7039 515962331.5

58
Alternate Route C
orrid
or
Segm
ent
ID
Routes Segment
ID %
Trucks AADT Length
Travel time (min)
Total Truck Tons
Total Truck Loads Total Value ($)
55021855 0.206 3110 13773.71 7.90 128816 7039 515962331.5
55021856 0.195 3338 11344.03 6.51 128816 7039 515962331.5
55004413 0.163 4176 12576.16 7.22 128816 7039 515962331.5
55004513 0.070 5030 3400.95 1.95 0 0 0
55004515 0.065 8127 22038.07 12.65 0 0 0
55009110 0.076 7926 6759.18 3.88 0 0 0
55021854 0.076 1064 10380.01 5.96 0 0 0
55021853 0.083 870 5125.92 2.94 0 0 0
Total 2 0.206 20020 87783.78 50.37
Difference -0.074 6420 -70077.90 -40.21
% change 24 -395.79 -395.79
0.118 20985 16242.63 9.32 45309300 2389938 2.62E+11
55021853 0.083 870 5125.92 2.94 0 0 0
55021854 0.076 1064 10380.01 5.96 0 0 0 Alternate 1
55009110 0.076 7926 6759.18 3.88 0 0 0
Total 1 0.083 7926 22265.11 12.78
Difference 0.035 13059 -6022.49 -3.46
%change 62 -37.08 -37.08
55004090 0.101 20020 1580.78 0.91 123740 6726 508188610.1
55004757 0.074 7597 804.98 0.46 128816 7039 515962331.5
55021855 0.206 3110 13773.71 7.90 128816 7039 515962331.5
55021856 0.195 3338 11344.03 6.51 128816 7039 515962331.5
55004413 0.163 4176 12576.16 7.22 128816 7039 515962331.5
55004515 0.065 8127 22038.07 12.65 0 0 0
55009110 0.076 7926 6759.18 3.88 0 0 0
55004381 0.085 947 18348.82 10.53 0 0 0
Alternate 2
55004513 0.070 5030 3400.95 1.95 0 0 0
Total 2 0.206 20020 90626.66 52.01
Difference -0.088 965 -74384.00 -42.69
16
% change 5 -457.96 -457.96
0.118 20985 620.80 0.36 57341641 2948124 2.95E+11
55009120 0.132 22930 353.37 0.20 0 0 0 Alternate 1
55010740 0.132 22930 593.04 0.34 0 0 0
Total 1 0.132 22930 946.40 0.54
Difference -0.014 -1945 -1404.36 -0.54
17
% change -9 -52.45
0.123 22964 5205.96 2.99 43301295 2262732 2.45E+11
55010740 0.132 22930 593.04 0.34 0 0 0
18
Alternate 1
55010031 0.062 15915 1771.70 1.02 0 0 0

59
Alternate Route C
orrid
or
Segm
ent
ID
Routes Segment
ID %
Trucks AADT Length
Travel time (min)
Total Truck Tons
Total Truck Loads Total Value ($)
55010035 0.052 13983 3014.22 1.73 0 0 0
55010050 0.112 10631 2405.71 1.38 0 0 0
55010020 0.169 17154 2358.35 1.35 7944458 423816 26424349317
Total 1 0.169 22930 10143.02 5.82
Difference -0.047 34 -4937.06 -2.83
% change 0 -94.83 -94.83
0.132 37887 11217.61 6.44 51112261 2709167 2.80E+11
55010020 0.169 17154 2358.35 1.35 7944458 423816 26424349317
55022238 0.057 3814 12939.20 7.43 0 0 0
55022239 0.058 1870 3442.34 1.98 0 0 0 Alternate 1
55005102 0.057 3055 663.39 0.38 0 0 0
Total 1 0.169 17154 19403.27 11.13
Difference -0.037 20732 -8185.67 -4.70
% change 55 -72.97 -72.97
55010020 0.169 17154 2358.35 1.35 7944458 423816 26424349317
55010760 0.243 16380 2882.10 1.65 7944458 423816 26424349317
55011080 0.084 3799 13503.11 7.75 21217 1184 58753802.53
55021890 0.101 2723 14753.61 8.47 21217 1184 58753802.53
55005120 0.065 1471 15826.12 9.08 6136 398 5547412.535
55005106 0.056 2378 8886.77 5.10 0 0 0
Alternate 2
55021891 0.100 2750 3952.32 2.27 21217 1184 58753802.53
Total 2 0.243 17154 62162.38 35.67
Difference -0.111 20732 -50944.80 -29.23
19
% change 55 -454.15 -454.15
0.127 33179 9684.37 5.56 48273195 2538193 2.60E+11
55005106 0.056 2378 8886.77 5.10 0 0 0 Alternate 1
55005110 0.086 16078 1538.02 0.88 6136 398 5547412.535
Total 1 0.086 16078 10424.79 5.98
Difference 0.041 17101 -10878.90 -5.98
% change 52 -7.65
55022239 0.058 1870 3442.34 1.98 0 0 0
55022238 0.057 3814 12939.20 7.43 0 0 0
55010760 0.243 16380 2882.10 1.65 7944458 423816 26424349317
55011080 0.084 3799 13503.11 7.75 21217 1184 58753802.53
55021890 0.101 2723 14753.61 8.47 21217 1184 58753802.53
55021891 0.100 2750 3952.32 2.27 21217 1184 58753802.53
55005120 0.065 1471 15826.12 9.08 6136 398 5547412.535
Alternate 2
55005110 0.086 16078 1538.02 0.88 6136 398 5547412.535
20
Total 2 0.243 16380 68836.82 39.50
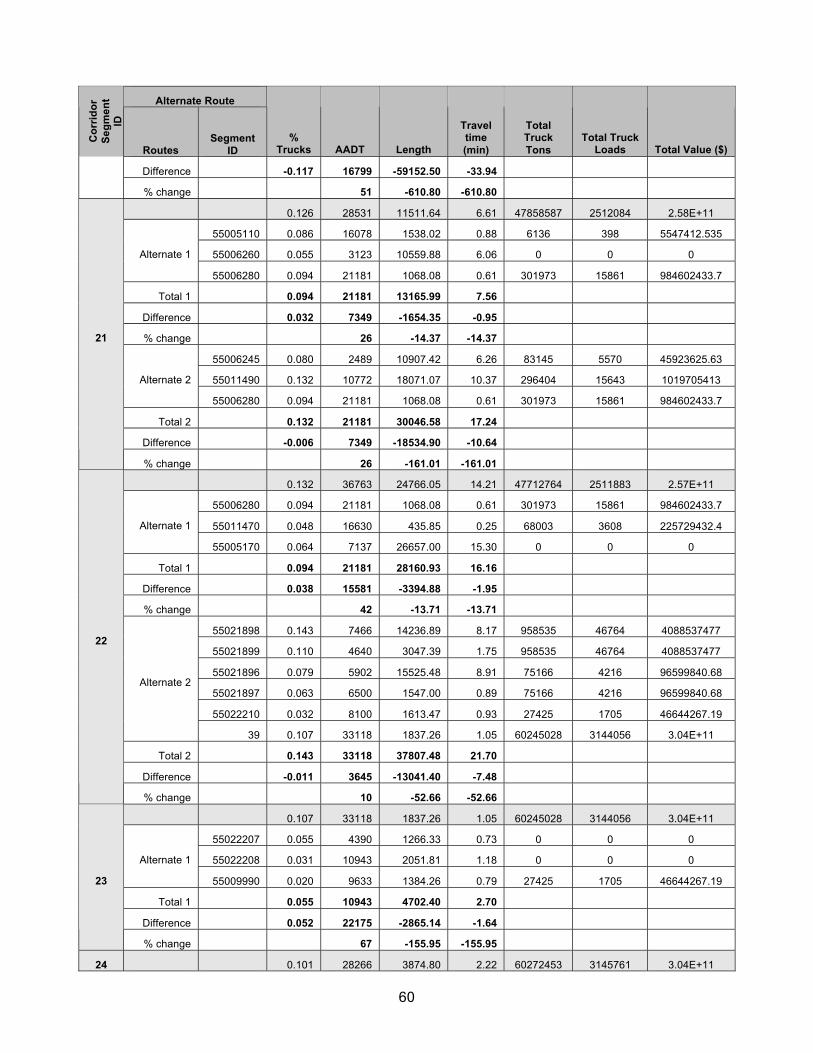
60
Alternate Route C
orrid
or
Segm
ent
ID
Routes Segment
ID %
Trucks AADT Length
Travel time (min)
Total Truck Tons
Total Truck Loads Total Value ($)
Difference -0.117 16799 -59152.50 -33.94
% change 51 -610.80 -610.80
0.126 28531 11511.64 6.61 47858587 2512084 2.58E+11
55005110 0.086 16078 1538.02 0.88 6136 398 5547412.535
55006260 0.055 3123 10559.88 6.06 0 0 0 Alternate 1
55006280 0.094 21181 1068.08 0.61 301973 15861 984602433.7
Total 1 0.094 21181 13165.99 7.56
Difference 0.032 7349 -1654.35 -0.95
% change 26 -14.37 -14.37
55006245 0.080 2489 10907.42 6.26 83145 5570 45923625.63
55011490 0.132 10772 18071.07 10.37 296404 15643 1019705413 Alternate 2
55006280 0.094 21181 1068.08 0.61 301973 15861 984602433.7
Total 2 0.132 21181 30046.58 17.24
Difference -0.006 7349 -18534.90 -10.64
21
% change 26 -161.01 -161.01
0.132 36763 24766.05 14.21 47712764 2511883 2.57E+11
55006280 0.094 21181 1068.08 0.61 301973 15861 984602433.7
55011470 0.048 16630 435.85 0.25 68003 3608 225729432.4 Alternate 1
55005170 0.064 7137 26657.00 15.30 0 0 0
Total 1 0.094 21181 28160.93 16.16
Difference 0.038 15581 -3394.88 -1.95
% change 42 -13.71 -13.71
55021898 0.143 7466 14236.89 8.17 958535 46764 4088537477
55021899 0.110 4640 3047.39 1.75 958535 46764 4088537477
55021896 0.079 5902 15525.48 8.91 75166 4216 96599840.68
55021897 0.063 6500 1547.00 0.89 75166 4216 96599840.68
55022210 0.032 8100 1613.47 0.93 27425 1705 46644267.19
Alternate 2
39 0.107 33118 1837.26 1.05 60245028 3144056 3.04E+11
Total 2 0.143 33118 37807.48 21.70
Difference -0.011 3645 -13041.40 -7.48
22
% change 10 -52.66 -52.66
0.107 33118 1837.26 1.05 60245028 3144056 3.04E+11
55022207 0.055 4390 1266.33 0.73 0 0 0
55022208 0.031 10943 2051.81 1.18 0 0 0 Alternate 1
55009990 0.020 9633 1384.26 0.79 27425 1705 46644267.19
Total 1 0.055 10943 4702.40 2.70
Difference 0.052 22175 -2865.14 -1.64
23
% change 67 -155.95 -155.95
24 0.101 28266 3874.80 2.22 60272453 3145761 3.04E+11

61
Alternate Route C
orrid
or
Segm
ent
ID
Routes Segment
ID %
Trucks AADT Length
Travel time (min)
Total Truck Tons
Total Truck Loads Total Value ($)
55009990 0.020 9633 1384.26 0.79 27425 1705 46644267.19
55009960 0.024 10565 4036.03 2.32 0 0 0 Alternate 1
55005190 0.054 11538 1270.60 0.73 0 0 0
Total 1 0.054 11538 6690.89 3.84
Difference 0.047 16729 -2816.09 -1.62
% change 59 -72.68 -72.68
0.106 32551 3508.66 2.01 47487191 2499673 2.56E+11
55005190 0.054 11538 1270.60 0.73 0 0 0 Alternate 1
55005210 0.073 22885 2726.85 1.56 0 0 0
Total 1 0.073 22885 3997.45 2.29
Difference 0.032 9666 -488.79 -0.28
% change 30 -13.93 -13.93
55005320 0.105 15041 11028.13 6.33 283738 15940 1075861514
55005330 0.086 12580 8947.66 5.13 0 0 0 Alternate 2
55005340 0.106 32551 5859.31 3.36 471959 24658 2060667186
Total 2 0.106 32551 25835.09 14.83
Difference 0.000 0 -22326.40 -12.81
25
% change 0 -636.32
0.132 42440 14051.63 8.06 51921550 2768066 2.90E+11
55005340 0.106 32551 5859.31 3.36 471959 24658 2060667186
55005350 0.069 20705 4227.88 2.43 471959 24658 2060667186
55006723 0.060 18029 3822.67 2.19 0 0 0
55022001 0.058 7628 11278.30 6.47 0 0 0
Alternate 1
55022002 0.077 18116 6068.99 3.48 0 0 0
Total 1 0.106 32551 31257.16 17.94
Difference 0.026 9889 -17205.50 -9.87
% change 23 -122.45 -122.45
55009960 0.024 10565 4036.03 2.32 0 0 0
55002209 #N/A #N/A #N/A #N/A #N/A #N/A #N/A
55006700 0.091 6439 21983.49 12.62 60541 3263 76279742.48
55006660 0.190 17005 3672.65 2.11 3333737 152795 11748648470
Alternate 2
55006690 0.141 14003 2963.57 1.70 813659 42564 3281769684
Total 2 0.190 17005 28619.70 16.42
Difference -0.058 25435 -14568.10 -8.36
26
% change 60 -103.68 -103.68
0.146 37496 3615.54 2.07 46874902 2468782 2.54E+11
55006670 0.189 13770 4146.67 2.38 3161733 144455 10558927666 Alternate 1
55006690 0.141 14003 2963.57 1.70 813659 42564 3281769684
27
Total 1 0.189 14003 7110.24 4.08

62
Alternate Route C
orrid
or
Segm
ent
ID
Routes Segment
ID %
Trucks AADT Length
Travel time (min)
Total Truck Tons
Total Truck Loads Total Value ($)
Difference -0.043 23493 -3494.70 -2.01
% change 63 -96.66 -96.66
0.220 51935 16741.60 9.61 50036635 2613237 2.64E+11
55006670 0.189 13770 4146.67 2.38 3161733 144455 10558927666
55006794 0.072 12963 3896.18 2.24 761294 40927 2589567707
55006798 0.071 4950 2435.13 1.40 761294 40927 2589567707
55006800 0.070 5022 17027.74 9.77 0 0 0
Alternate 1
55006820 0.057 2342 6611.46 3.79 218528 10537 1173578934
Total 1 0.189 13770 34117.18 19.58
Difference 0.032 38165 -17375.60 -9.97
% change 73 -103.79 -103.79
55022279 0.145 9435 12853.58 7.38 0 0 0
55022277 0.138 450 1872.63 1.07 0 0 0
55022276 0.111 2613 19081.15 10.95 0 0 0
55022006 0.082 3470 16907.36 9.70 6202 380 9612751.657
Alternate 2
55006849 0.107 21420 6342.27 3.64 6202 380 9612751.657
Total 2 0.145 21420 57056.98 32.74
Difference 0.075 30515 -40315.40 -23.13
28
% change 59 -240.81 -240.81
0.243 67728 11932.91 6.85 51309978 2676242 2.75E+11
55006820 0.057 2342 6611.46 3.79 218528 10537 1173578934
55006810 0.063 4467 3426.24 1.97 212326 10157 1163966183
55022067 0.060 7945 5348.88 3.07 1105658 62822 1172095378 Alternate 1
55022068 0.071 15034 9038.71 5.19 1105658 62822 1172095378
Total 1 0.071 15034 24425.29 14.02
Difference 0.173 52694 -12492.40 -7.17
% change 78 -104.69 -104.69
55006849 0.107 21420 6342.27 3.64 6202 380 9612751.657
55022280 0.064 6000 2318.77 1.33 0 0 0
55022281 0.064 4931 13903.13 7.98 0 0 0
55007725 0.063 16343 3501.23 2.01 780228 38296 3469992054
Alternate 2
55007722 0.073 20225 5751.82 3.30 780228 38296 3469992054
Total 2 0.107 21420 31817.22 18.26
Difference 0.136 46308 -19884.30 -11.41
29
% change 68 -166.63 -166.63
0.114 37793 2255.44 1.29 50580386 2640146 2.66E+11
55007730 0.060 18515 1544.36 0.89 24152 1231 130850135.5 Alternate 1
55007860 0.056 21380 1645.06 0.94 1105658 62822 1172095378
30
Total 1 0.060 21380 3189.42 1.83

63
Alternate Route C
orrid
or
Segm
ent
ID
Routes Segment
ID %
Trucks AADT Length
Travel time (min)
Total Truck Tons
Total Truck Loads Total Value ($)
Difference 0.054 16413 -933.98 -0.54
% change 43 -41.41 -41.41
0.243 68720 4897.48 2.81 54784751 2897235 2.99E+11
55007858 0.120 37253 2955.74 1.70 1134281 62453 2452278839
55007853 0.000 0 1119.08 0.64 1134281 62453 2452278839
55007852 0.049 41780 1602.73 0.92 1134281 62453 2452278839 Alternate 1
55007880 0.087 52050 3033.39 1.74 869577 47586 2423264607
Total 1 0.120 52050 8710.95 5.00
Difference 0.123 16670 -3813.47 -2.19
% change 24 -77.87 -77.87
55007860 0.056 21380 1645.06 0.94 1105658 62822 1172095378
55007740 0.070 18068 7169.15 4.11 24152 1231 130850135.5
55010230 0.076 29235 1716.90 0.99 4009086 202306 14843855519 Alternate 2
55010221 0.079 52880 5416.04 3.11 4009086 202306 14843855519
Total 2 0.079 52880 15947.14 9.15
Difference 0.164 15840 -11049.70 -6.34
31
% change 23 -225.62 -225.62
0.169 66223 2306.48 1.32 53691271 2795235 2.78E+11
55007880 0.087 52050 3033.39 1.74 869577 47586 2423264607
55007900 0.094 37740 1280.26 0.73 0 0 0 Alternate 1
55007920 0.127 55490 2538.93 1.46 758748 37856 1923911275
Total 1 0.127 55490 6852.58 3.93
Difference 0.042 10733 -4546.11 -2.61
% change 16 -197.10 -197.10
55007880 0.087 52050 3033.39 1.74 869577 47586 2423264607
55007840 0.064 34600 1473.03 0.85 2003858 110039 4875543457
55007910 0.095 37655 1713.16 0.98 758748 37856 1923911275 Alternate 2
55007920 0.127 55490 2538.93 1.46 758748 37856 1923911275
Total 2 0.127 55490 8758.51 5.03
Difference 0.042 10733 -6452.04 -3.70
32
% change 16 -279.74 -279.74
0.205 75428 5954.12 3.42 48563973 2541173 2.37E+11
55007920 0.127 55490 2538.93 1.46 758748 37856 1923911275
55008010 0.077 49819 6391.00 3.67 0 0 0 Alternate 1
55008030 0.122 85400 2343.62 1.34 5124002 259622 15947519837
Total 1 0.127 85400 11273.55 6.47
Difference 0.079 -9973 -5319.43 -3.05
% change -13 -89.34 -89.34
33
Alternate 2 55007931 0.148 64240 969.38 0.56 7121726 353795 49228002230

64
Alternate Route C
orrid
or
Segm
ent
ID
Routes Segment
ID %
Trucks AADT Length
Travel time (min)
Total Truck Tons
Total Truck Loads Total Value ($)
55007932 0.100 51050 5612.09 3.22 7121726 353795 49228002230
55017630 0.079 11280 8262.22 4.74 0 0 0
55008043 0.196 14700 3856.39 2.21 0 0 0
55008041 0.134 25985 2339.64 1.34 0 0 0
Total 2 0.196 64240 21039.71 12.07
Difference 0.009 11188 -15085.60 -8.66
% change 15 -253.36 -253.36
0.225 51148 7861.24 4.51 48593182 2547737 2.31E+11
55008041 0.134 25985 2339.64 1.34 0 0 0
55008043 0.196 14700 3856.39 2.21 0 0 0 Alternate 1
55016960 0.196 14700 3026.93 1.74 0 0 0
Total 1 0.196 25985 9222.95 5.29
Difference 0.029 25163 -1361.71 -0.78
% change 49 -17.32 -17.32
55008030 0.122 85400 2343.62 1.34 5124002 259622 15947519837
55008201 0.059 39218 3604.96 2.07 0 0 0
55008204 0.069 11093 11968.67 6.87 0 0 0
55017310 0.243 53240 8632.71 4.95 0 0 0
Alternate 2
55008207 0.069 14487 3785.52 2.17 0 0 0
Total 2 0.243 85400 30335.48 17.41
Difference -0.018 -34253 -22474.20 -12.90
34
% change -67 -285.89 -285.89
0.229 49216 13624.77 7.82 48593182 2547737 2.31E+11
55016960 0.196 14700 3026.93 1.74 0 0 0
55008044 0.078 8847 9815.38 5.63 0 0 0
55011560 0.094 3841 15989.18 9.18 0 0 0 Alternate 1
31 0.189 37927 5636.59 3.23 48593182 2547737 2.31E+11
Total 1 0.196 37927 34468.08 19.78
Difference 0.033 11289 -20843.30 -11.96
35
% change 23 -152.98 -152.98
0.189 37927 5636.59 3.23 48593182 2547737 2.31E+11
30 0.229 49216 13624.77 7.82 48593182 2547737 2.31E+11
55011560 0.094 3841 15989.18 9.18 0 0 0
55016960 0.196 14700 3026.93 1.74 0 0 0 Alternate 1
55008044 0.078 8847 9815.38 5.63 0 0 0
Total 1 0.229 49216 28831.48 24.36
Difference -0.040 -11289 -23194.90 -21.13
36
% change -30 -411.51 -411.51
37 0.181 42130 3263.99 1.87 48887950 2559186 2.37E+11

65
Alternate Route C
orrid
or
Segm
ent
ID
Routes Segment
ID %
Trucks AADT Length
Travel time (min)
Total Truck Tons
Total Truck Loads Total Value ($)
55022099 0.160 32058 2751.47 1.58 1190900 61714 5361039638
55022100 0.085 9485 1704.00 0.98 1190900 61714 5361039638 Alternate 1
55008250 0.121 23760 3297.50 1.89 0 0 0
Total 1 0.160 32058 7752.97 4.45
Difference 0.021 10073 -4488.98 -2.58
% change 24 -137.53 -137.53
0.232 45428 12389.06 7.11 48887950 2559186 2.37E+11
55008260 0.069 6620 11098.11 6.37 0 0 0
55008575 0.050 17953 5161.91 2.96 669355 36994 1373983085 Alternate 1
55008571 0.048 32840 1658.73 0.95 669355 36994 1373983085
Total 1 0.069 32840 17918.75 10.28
Difference 0.163 12588 -5529.68 -3.17
% change 28 -44.63
55008250 0.121 23760 3297.50 1.89 0 0 0
55008550 0.070 8881 11951.19 6.86 1190900 61714 5361039638
55008874 0.048 28800 3010.72 1.73 192920 11776 347945981.3 Alternate 2
55011550 0.113 35107 691.54 0.40 192920 11776 347945981.3
Total 2 0.121 35107 18950.94 10.87
Difference 0.111 10321 -6561.88 -3.77
38
% change 23 -52.97 -52.97
0.146 43870 1197.02 0.69 52111704 2767962 2.60E+11
55011550 0.113 35107 691.54 0.40 192920 11776 347945981.3 Alternate 1
55008877 0.146 41938 1010.16 0.58 0 0 0
Total 1 0.146 41938 1701.69 0.98
Difference 0.000 1933 -504.67 -0.29
39
% change 4 -42.16 -42.16
0.173 45611 4760.61 2.73 55531091 2928349 2.65E+11
55009181 0.048 15579 6397.85 3.67 757096 38395 4874829858
55008905 0.061 5768 767.16 0.44 0 0 0 Alternate 1
55008901 0.065 4760 1580.95 0.91 0 0 0
Alternate 1 0.065 15579 8745.96 5.02
Difference 0.108 30032 -3985.35 -2.29
% change -353559 20844.47 20844.5
55008877 0.146 41938 1010.16 0.58 0 0 0
55010640 0.055 24611 4307.11 2.47 0 0 0
55008737 0.068 14030 895.47 0.51 1391748 74170 5706540798
55008896 0.162 37413 2400.61 1.38 0 0 0
Alternate 2
55008893 0.059 18780 871.62 0.50 0 0 0
40
Alternate 2 0.162 41938 9484.96 5.44

66
Alternate Route C
orrid
or
Segm
ent
ID
Routes Segment
ID %
Trucks AADT Length
Travel time (min)
Total Truck Tons
Total Truck Loads Total Value ($)
Difference 0.011 3674 -4724.36 -2.71
% change 8 -99.24 -99.24
0.213 45301 15053.36 8.64 51354608 2729567 2.55E+11
55021100 0.243 52460 5848.56 3.36 1165589 58369 3946550957
55008743 0.061 17415 2550.37 1.46 1165589 58369 3946550957
55008744 0.074 11583 6270.26 3.60 2015204 112128 7162224675
55008746 0.086 9670 3443.11 1.98 2015204 112128 7162224675
55020070 0.086 9670 2148.47 1.23 2015204 112128 7162224675
55016920 0.000 0 2286.89 1.31 2015204 112128 7162224675
Alternate 1
55020860 0.066 13193 2919.99 1.68 2015204 112128 7162224675
Total 1 0.243 52460 25467.66 14.61
Difference -0.030 -7159 -10414.30 -5.98
% change -16 -69.18 -69.18
55009731 0.203 18075 10104.64 5.80 3520381 174875 11205119318
55009710 0.129 6126 9084.99 5.21 0 0 0
55008886 0.085 8733 6399.31 3.67 1922685 96765 8821380822
55008901 0.065 4760 1580.95 0.91 0 0 0
Alternate 2
55008905 0.061 5768 767.16 0.44 0 0 0
Total 2 0.203 18075 27937.06 16.03
Difference 0.011 27226 -12883.70 -7.39
42
% change 60 -85.59 -85.59

67
Appendix C: Bridges and Culverts on the Corridor Table 13 shows the information related to the bridges along the corridor. All the information was obtained from WisDOT’s Highway Structures Information (Source: http://on.dot.wi.gov/dtid_bos/extranet/structures/LRFD/index.htm).
Table 13: Bridges on the Study Corridors
NBI Rating
Cor
ridor
Segm
ent I
D
Bridge ID
Year built Feature on Feature Under Sc
our C
ode
(N=N
/A)
Suffi
cien
cy
Rat
ing
ADT TRU
CK
%
DEC
K
SUPE
R
SUB
CU
LV
B550147 2000 IH 94 EB STH 35 N 98 16280 13 7 7 7 N 0
B550148 2000 IH 94 WB STH 35 N 96 40080 13 7 7 7 N
B550031 1958 IH 94 WB KINNEY RD N 97 28000 26 6 6 7 N
B550032 1958 IH 94 EB KINNEY RD N 97 26420 13 6 6 7 N
B550033 1958 IH 94 WB TWIN LAKE RD N 90.50 28000 26 6 6 7 N 1
B550034 1958 IH 94 EB TWIN LAKE RD N 97 26420 13 6 6 7 N
B550036 1958 IH 94 WB 3RD AVE S N 97 19060 13 6 6 7 N
B550037 1958 IH 94 EB 3RD AVE SOUTH N 97 19060 13 6 6 7 N
B550038 1958 IH 94 WB KINNICKINNIC RIVER 8 87 19060 13 7 6 5 N
B550039 1958 IH 94 EB KINNICKINNIC RIVER 8 87 19060 13 7 6 5 N
B550044 1958 IH 94 WB RUSH RIVER 5 87 17970 14 6 6 5 N
B550045 1958 IH 94 EB RUSH RIVER 5 87 17970 14 6 6 5 N
2
B550202 2004 USH 63N IH 94 E N 96 0 0 7 8 8 N
B550012 1958 IH 94 EB CARR CREEK 8 86 22900 26 5 5 6 N
B550013 1958 IH 94 WB CARR CREEK 8 86 22900 26 5 5 6 N
B550015 1958 IH 94 EB EAU GALLE RIVER 5 87 16840 14 6 6 5 N
B550016 1958 IH 94 WB EAU GALLE RIVER 8 87 16840 14 7 6 5 N
B550017 1958 IH 94 EB NN N 96 16840 14 6 6 6 N
3
B550018 1958 IH 94 WB NN N 96 16840 14 6 6 6 N
B550019 1958 IH 94 EB NORSEMAN DR N 93.10 20730 14 5 6 7 N
B550020 1959 IH 94 WB NORSEMAN DR N 95 20730 14 5 6 7 N
B550022 1958 IH 94 EB WILSON RD N 84 20730 14 5 5 6 N
B550023 1958 IH 94 WB WILSON RD N 93 20730 14 5 6 7 N
B170051 1959 IH 94 E BR WILSON CREEK 8 76.60 27470 14 N N N 6
B170174 2006 IH 94 WB WILSON CREEK 8 93.90 21800 26 8 8 8 N
B170175 2004 IH 94 EB WILSON CREEK 8 93.90 21800 26 8 8 8 N
B170054 1959 IH 94 WB USH 12 N 89.50 21800 26 6 6 6 N
B170055 1958 IH 94 EB USH 12 N 97 21800 26 6 6 6 N
B170018 1958 IH 94 EB Q N 89.50 21800 26 7 7 7 N
B170019 1958 IH 94 WB Q N 91.40 21800 26 7 7 6 N
B170021 1959 IH 94 EB VALLEY RD N 92.50 21800 26 7 7 7 N
B170022 1959 IH 94 WB VALLEY RD N 96 21800 26 7 7 7 N
B170023 1959 IH 94 EB K N 97 21800 26 7 7 7 N
B170024 1959 IH 94 WB K N 97 21800 26 7 7 7 N
4
B170025 1959 IH 94 EB STEWARD RD N 97 21800 26 7 7 7 N

68
NBI Rating C
orrid
or
Segm
ent I
D
Bridge ID
Year built Feature on Feature Under Sc
our C
ode
(N=N
/A)
Suffi
cien
cy
Rat
ing
ADT TRU
CK
%
DEC
K
SUPE
R
SUB
CU
LV
B170026 1959 IH 94 WB STEWARD RD N 86.10 21800 26 6 6 7 N
B170027 1958 IH 94 EB RUDINGER RD N 96 21800 26 6 6 6 N
B170028 1958 IH 94 WB RUDINGER RD N 90.50 21800 26 7 7 7 N
B170059 1959 IH 94 WB USH 12-STH 29 N 95.30 21800 26 6 6 6 N
B170060 1959 IH 94 EB USH 12-STH 29 N 95.50 16060 14 6 6 6 N
B170063 1959 IH 94 MUDDY CREEK 8 63.70 30530 14 N N N 5
B170052 1958 IH 94 BR MUDDY CREEK 8 76 30530 14 N N N 6
B170032 1957 IH 94 WB RED CEDAR RIVER 8 78.10 16800 26 6 5 7 N
B170033 1957 IH 94 EB RED CEDAR RIVER 8 62.10 19201 37 6 4 7 N
B170034 1958 IH 94 WB ELK MOUND MARSH EQUALIZR 5 98 24100 26 6 6 6 N
B170035 1958 IH 94 EB ELK MOUND MARSH EQUALIZR 5 98 24100 26 6 6 6 N
B170036 1958 IH 94 WB ELK MOUND MARSH EQUALIZR 8 98 24100 26 6 6 6 N
B170037 1959 IH 94 EB ELK MOUND MARSH EQUALIZR 8 98 24100 26 6 6 6 N
B170038 1958 IH 94 WB ELK MOUND MARSH EQUALIZR 8 98 24100 26 6 6 6 N
5
B170039 1958 IH 94 EB ELK MOUND MARSH EQUALIZR 8 97 24100 26 6 6 6 N
B170050 1959 IH 94 E BR MUDDY CREEK 8 74 26420 14 N N N 6
B170057 1958 IH 94 WB EVERGREEN RD N 33 32200 26 6 6 3 N
B170058 1960 IH 94 EB EVERGREEN RD N 33 32200 26 6 6 3 N
B180011 1959 IH 94 WB ELK CREEK 5 98 13700 26 6 7 7 N
B180012 1959 IH 94 EB ELK CREEK 5 98 14300 26 6 7 7 N
6
B180015 1967 CONNECTOR USH 12-IH 94 IH 94 N 93.50 9960 3 5 6 6 N
B270039 1967 IH 94 EB BLACK RIVER 8 91 17340 16 6 7 7 N
B270040 1967 IH 94 WB BLACK RIVER 8 91 13220 15 6 7 7 N
B270041 1968 IH 94 EB WINNEBAGO AVE N 88 13220 15 7 6 7 N
B270042 1968 IH 94 WB WINNEBAGO AVE N 81 32000 0 7 6 7 N
B180151 1996 IH 94 EB OTTER CREEK 8 98 14260 15 7 8 8 N
B180152 1996 IH 94 WB OTTER CREEK 8 98 11960 15 7 8 8 N
B180203 2008 IH 94 EB LOWE CREEK 8 93.40 32400 0 9 8 9 N
B180204 2008 IH 94 Lowes Creek 94.40 32400 0 9 9 9 N
B270021 1966 IH 94 EB TREMPEALEAU RIVER 8 98 10950 16 6 6 7 N
B270022 1966 IH 94 WB TREMPEALEAU RIVER 8 98 10950 16 6 6 7 N
B270024 1966 IH 94 EB STH 95 N 90.80 17340 16 7 7 6 N
B270025 1966 IH 94 WB STH 95 N 94.90 5000 16 7 7 6 N
B270027 1966 IH 94 EB CHARCOAL RD N 92.50 17340 16 6 6 7 N
B270028 1966 IH 94 WB CHARCOAL RD N 91.50 9300 36 6 6 7 N
B270029 1966 IH 94 EB F N 92.50 17340 16 6 6 7 N
B270030 1966 IH 94 WB F N 93 17340 16 6 6 7 N
7
B270031 1966 IH 94 EB MCNULTY RD N 93 17340 16 6 6 7 N

69
NBI Rating C
orrid
or
Segm
ent I
D
Bridge ID
Year built Feature on Feature Under Sc
our C
ode
(N=N
/A)
Suffi
cien
cy
Rat
ing
ADT TRU
CK
%
DEC
K
SUPE
R
SUB
CU
LV
B270032 1966 IH 94 WB MCNULTY RD N 85 9750 43 6 6 7 N
B180019 1965 IH 94 EB E N 97 11900 26 5 6 7 N
B180020 1965 IH 94 WB E N 97 11300 26 5 6 7 N
B180021 1965 IH 94 EB C N 84 11900 26 5 5 7 N
B180022 1965 IH 94 WB C N 84 11300 26 5 5 7 N
B180023 1965 IH 94 EB CHIPPEWA RIVER 04 5 86.50 11900 26 5 6 6 N
B180024 1965 IH 94 WB CHIPPEWA RIVER 05 5 87.50 11300 26 6 6 6 N
B180025 1966 IH 94 EB STH 37-STH 85 N 96.40 11900 15 6 6 6 N
B180026 1966 IH 94 WB STH 37-STH 85 N 98 11300 15 7 6 6 N
B180029 1965 IH 94 EB F N 97 13100 15 6 6 6 N
B180030 1965 IH 94 WB F N 97 12800 15 6 6 6 N
B180032 1965 IH 94 WB LOWE CREEK 5 96 12800 15 6 6 7 N
B180033 1965 IH 94 EB LOWE CREEK 5 98 13100 15 6 6 7 N
B180044 1965 IH 94 WB CHIPPEWA RIVER OVERFLOW 8 75.50 11300 26 5 5 7 N
B180045 1965 IH 94 EB CHIPPEWA RIVER OVERFLOW 5 86.50 11900 26 5 7 7 N
B610041 1965 IH 94 EB NN N 94.50 12470 14 7 7 7 N
B610042 1965 IH 94 WB NN N 91.50 15690 14 7 7 7 N
B610043 1965 IH 94 EB BUFFALO RIVER 5 94 12470 14 7 7 7 N
B180051 1966 IH 94 EB J N 96 20700 26 6 7 7 N
B180052 1966 IH 94 WB J N 96 20700 26 6 7 7 N
B180053 1966 IH 94 EB D N 96 20700 26 6 6 7 N
B180054 1966 IH 94 WB D N 96 20700 26 6 6 7 N
B180055 1966 IH 94 EB OTTER CREEK 5 96.10 20700 26 6 6 7 N
B180056 1966 IH 94 WB OTTER CREEK 5 95.10 20700 26 6 6 7 N
B180057 1966 IH 94 EB E MALLARD RD N 94.10 20700 26 6 7 7 N
B180058 1966 IH 94 WB E MALLARD RD N 94.10 20700 26 6 7 7 N
B180063 1966 IH 94 EB HH N 96.10 19900 26 6 6 6 N
10
B180064 1966 IH 94 WB HH N 96.30 15690 14 6 6 6 N
B270148 2005 IH 94 EB PIGEON CREEK 8 93.60 23325 37 8 8 7 N
B270149 2005 IH 94 WB PIGEON CREEK 8 93.60 23325 37 7 7 7 N
B270035 1966 IH 94 EB S FK BUFFALO RIVER 8 79.50 10900 16 6 5 6 N
B270036 1966 IH 94 WB S FK BUFFALO RIVER 8 70.80 10300 16 8 5 7 N
B270037 1966 IH 94 EB B N 79.80 10900 16 6 6 7 N
11
B270038 1966 IH 94 WB B N 79.80 10300 16 7 7 7 N
B270043 1968 IH 94 EB Union Pacific RR N 95 11935 15 6 6 7 N
B270044 1968 IH 94 WB Union Pacific RR N 95 11935 15 6 6 7 N
B270054 1968 IH 94 EB LAMBERT RD N 95.30 11935 15 7 7 7 N
B270055 1968 IH 94 WB LAMBERT RD N 96 27000 15 7 7 7 N
B270059 1968 IH 94 EB O N 96.40 12650 15 8 6 6 N
15
B270060 1968 IH 94 WB O N 62 25300 15 9 6 7 N

70
NBI Rating C
orrid
or
Segm
ent I
D
Bridge ID
Year built Feature on Feature Under Sc
our C
ode
(N=N
/A)
Suffi
cien
cy
Rat
ing
ADT TRU
CK
%
DEC
K
SUPE
R
SUB
CU
LV
B270063 1968 IH 94 EB GLENN CREEK 8 92.80 11935 15 N N N 6 B270064 1968 IH 94 WB GLENN CREEK 8 92.80 11935 15 N N N 6
B410033 1968 IH 94 WB USH 12 N 97.50 10500 16 7 7 6 N
B410032 1968 IH 94 EB USH 12 N 78.50 9800 16 4 7 5 N
B410059 1963 IH 94 MUD CREEK 8 74.70 23300 15 N N N 6
B410062 1968 IH 94 EB UP RR N 96 10650 15 7 7 6 N
B410063 1968 IH 94 WB UP RR N 94 10650 15 9 9 9 N
B410064 1968 IH 94 EB ABBEY LANE N 96 10800 15 8 8 8 N
B410065 1968 IH 94 WB ASPEN ROAD N 65 10650 15 9 9 9 N
B410066 1968 IH 94 EB CTH EW N 97.50 10650 16 8 8 7 N
B410067 1968 IH 94 WB CTH EW N 82.40 10800 16 9 9 9 N
B410070 1968 IH 94 EB USH 12 N 78.60 10800 16 7 5 7 N
B410071 1968 IH 94 WB USH 12 N 78.50 9090 16 7 5 7 N
B410072 1968 IH 94 EB MILL CREEK 5 91.50 10800 16 6 6 7 N
B410073 1968 IH 94 WB MILL CREEK 5 91.50 10800 16 6 6 7 N
B410074 1968 IH 94 EB EMPIRE AVENUE N 81 10800 16 5 5 7 N
16
B410075 1968 IH 94 WB SIDE RD M N 81 10650 16 5 5 7 N
B410028 1963 IH 94 EB Foley Avenue N 86.30 11650 15 7 6 5 N 17
B410029 1963 IH 94 WB Foley Avenue N 67 11650 15 7 5 7 N
B410245 2003 NW RAMP IH 94 LEMONWEIR RIVER 5 99.80 970 0 8 9 9 N
B410044 1963 IH 94 EB IH 90 WB N 93 15100 22 7 6 7 N
B410055 1963 IH 94 EB KREYER CREEK 8 92.80 11650 22 N N N 7
B410024 1963 IH 94 EB RAMP IH 90EB-IH 94WB N 94.90 1800 22 7 7 7 N
B410056 1964 IH 94 WB KREYER CREEK 8 92.30 14440 15 N N N 7
B410057 1963 IH 94 EB LEMONWEIR CREEK 5 97.30 15100 15 8 7 7 N
18
B410058 1963 IH 94 WB LEMONWEIR CREEK 5 97.30 15100 15 8 8 7 N
B410045 1963 IH 90 EB-IH 94 EB BR ALLEN CREEK 8 91.80 17300 14 N N N 7
B410046 1963 IH 90 WB-IH 94 WB BR ALLEN CREEK 8 91.80 17300 41 N N N 6
B410049 1963 IH 90 EB-IH 94 EB ALLEN CREEK 8 91.80 17300 14 N N N 7
B410050 1963 IH 90 WB-IH 94 WB ALLEN CREEK 8 91.80 16850 41 N N N 7
B410051 1963 IH 90-IH 94 BEAR CREEK 8 72.30 33700 14 N N N 7
B410053 1963 IH 90-IH 94 W FK BEAR CREEK 8 72.30 33700 14 N N N 7
B410035 1963 IH 90 WB-IH 94 WB MILL BLUFF RD N 78.80 16850 41 5 5 6 N
B290051 1964 IH 90 EB-IH 94 EB C N 89.60 16600 14 4 6 7 N
B290052 1964 IH 90 WB-IH 94 WB C N 78.60 16600 14 4 5 5 N
B290053 1964 IH 90 EB-IH 94 EB CTH H/UP RR/WIS ST N 97.30 16600 14 7 8 7 N
19
B290054 1964 IH 90 WB-IH 94 WB H N 95.10 16600 14 6 8 6 N

71
NBI Rating C
orrid
or
Segm
ent I
D
Bridge ID
Year built Feature on Feature Under Sc
our C
ode
(N=N
/A)
Suffi
cien
cy
Rat
ing
ADT TRU
CK
%
DEC
K
SUPE
R
SUB
CU
LV
B290058 1964 IH 90-IH 94 BR LEMONWEIR RIVER 8 72.10 34600 14 N N N 7
B290044 1964 IH 90 EB-IH 94 EB HOG ISLAND RD/UP RR N 97 16600 27 7 7 7 N
B290045 1964 IH 90 WB-IH 94 WB HOG ISLAND RD/UP RR N 98 16600 27 7 7 8 N
B290046 1964 IH 90 EB-IH 94 EB LEMONWEIR RIVER 5 98 16600 27 7 7 6 N
20
B290047 1964 IH 90 WB-IH 94 WB LEMONWEIR RIVER 5 87 16600 27 7 6 5 N
B290032 1964 IH 90 EB-IH 94 EB LEMONWEIR RIVER 5 98 17800 27 7 7 6 N
B290033 1964 IH 90 WB-IH 94 WB LEMONWIER RIVER 5 98 17000 14 7 7 6 N
B290034 1964 IH 90 EB-IH 94 EB STH 82 N 92.70 15450 27 7 6 7 N
B290035 1964 IH 90 WB-IH 94 WB STH 82 N 92.70 15450 14 7 7 7 N
B290036 1964 IH 90 EB-IH 94 EB CTH G N 97.30 15450 27 7 8 7 N
21
B290037 1964 IH 90 WB-IH 94 WB G N 97.30 15450 27 7 7 7 N
B290016 1964 IH 90 EB-IH 94 EB USH 12-STH 16 N 95.10 18050 27 7 7 7 N
B290017 1964 IH 90 WB-IH 94 WB USH 12-STH 16 N 97.20 18050 27 7 7 7 N
B290018 1964 IH 90 EB-IH 94 EB CP RR N 96.10 17800 27 7 7 7 N
B290019 1964 IH 90 WB-IH 94 WB CP RR N 96.10 18050 14 7 7 7 N
B290029 1964 IH 90 EB-IH 94 EB SEVEN MILE CREEK 8 94.70 17800 27 N N N 7
22
B290030 1964 IH 90 WB-IH 94 WB SEVEN MILE CREEK 8 91.80 17000 14 N N N 7
B560037 1960 IH 90 EB-IH 94 EB H N 96 19500 20 7 7 6 N
B560038 1961 IH 90 WB-IH 94 WB H N 94 18200 13 7 7 7 N
B560039 1961 IH 90 EB-IH 94 EB STH 13 NB 8 77.60 19500 20 6 7 5 N
23
B560040 1961 IH 90 WB-IH 94 WB STH 13 NB 8 91 18720 13 7 7 7 N
B560042 1961 IH 90 EB-IH 94 EB SPRING BROOK 8 98 18900 20 7 7 6 N
B560043 1961 IH 90 WB-IH 94 WB SPRING BROOK 8 98 17600 13 7 7 7 N
B560044 1961 IH 90 EB-IH 94 EB STH 23 N 95.10 17300 13 7 7 7 N
B560045 1961 IH 90 WB-IH 94 WB STH 23 N 95.20 16100 13 7 7 7 N
B560047 1961 IH 90 EB-IH 94 EB MIRROR LAKE 8 91 19300 13 6 6 6 N
24
B560048 1961 IH 90 WB-IH 94 WB MIRROR LAKE 8 91 18900 13 6 6 6 N
B560049 1961 IH 90 EB-IH 94 EB ISHNALA RD N 96 19300 13 7 7 7 N 25
B560050 1961 IH 90 WB-IH 94 ISHNALA RD N 96 18900 13 7 7 7 N

72
NBI Rating C
orrid
or
Segm
ent I
D
Bridge ID
Year built Feature on Feature Under Sc
our C
ode
(N=N
/A)
Suffi
cien
cy
Rat
ing
ADT TRU
CK
%
DEC
K
SUPE
R
SUB
CU
LV
WB
B560030 1960 IH 90 EB-IH 94 EB USH 12 N 96.10 16600 14 6 7 7 N
B560031 1960 IH 90 WB-IH 94 WB USH 12 N 93.20 17100 20 7 7 7 N
B560024 1961 IH 90 EB-IH 94 EB SCHEPPS RD N 97 17500 18 7 7 7 N
B560025 1961 IH 90 WB-IH 94 WB SCHEPPS RD N 96 21800 18 7 7 7 N 26
B110138 2004 IH 90 WB-IH 94 WB BARABOO RIVER 5 92.10 16700 18 8 8 7 N
B110015 1961 IH 90 EB-IH 94 EB STH 60 N 65.00 27300 16 4 4 6 N
B110016 1961 IH 90 WB-IH 94 WB STH 60 N 83.00 35500 16 5 5 5 N
B110022 1961 IH 90 EB-IH 94 EB WISCONSIN RIVER 10 5 80.50 26900 17 5 5 6 N
B110023 1961 IH 90 WB-IH 94 WB WISCONSIN RIVER 11 5 80.50 26900 17 5 5 6 N
B110024 1961 IH 90 EB-IH 94 EB SMOKEY HOLLOW RD N 78.60 33050 16 5 6 5 N
B110040 1961 IH 90 EB-IH 94 EB ROWAN CREEK 5 98.00 26900 17 6 6 7 N
B110041 1961 IH 90 WB-IH 94 WB ROWAN CREEK 5 98.00 26900 17 6 6 7 N
B110042 1961 IH 90 WB-IH 94 WB BR ROWAN CREEK 8 74.40 24700 17 N N N 7
B110043 1961 IH 90 WB-IH 94 WB BR ROWAN CREEK 8 74.40 24700 17 N N N 7
B110044 1961 IH 90 WB-IH 94 WB BR ROWAN CREEK 8 74.40 24700 17 N N N 8
28
B110045 1961 IH 90 WB-IH 94 WB BR ROWAN CREEK 8 74.50 24300 17 N N N 7
B130297 1971 RAMP STH 19-IH 90EB CMSTPP RR N 70.60 6400 16 5 5 7 N
B130119 1959 IH 90-IH 94 BR YAHARA RIVER 8 67.00 63800 17 N N N 8
B130087 1960 IH 90 EB-IH 94 EB CUBA VALLEY RD N 67.00 33200 16 4 4 4 N
B130088 1960 IH 90 WB-IH 94 WB CUBA VALLEY RD N 67.00 30600 16 4 4 5 N
B130090 1959 IH 90-IH 94 YAHARA RIVER 8 67.00 63800 17 N N N 6
B130091 1960 IH 90 EB-IH 94 EB STH 19 N 80.20 33200 17 5 5 5 N
B130092 1960 IH 90 WB-IH 94 WB STH 19 N 80.30 30600 16 5 5 6 N
B130093 1959 IH 90 EB-IH 94 EB CMSTPP RR N 80.60 29900 16 5 7 5 N
29
B130094 1959 IH 90 WB-IH 94 WB CMSTPP RR N 81.50 24300 16 6 5 6 N
B130095 1959 IH 90-IH 94 TOKEN CREEK 8 67.00 66900 16 N N N 6
B130098 1960 IH 90 EB-IH 94 EB USH 51 N 80.50 34600 17 6 7 5 N 30
B130099 1960 IH 90 WB-IH 94 WB USH 51 N 78.00 24700 16 4 6 5 N
31 B130102 1961 IH 90 EB-IH 94 EB USH 151 N 75.50 49300 16 5 8 5 N

73
NBI Rating C
orrid
or
Segm
ent I
D
Bridge ID
Year built Feature on Feature Under Sc
our C
ode
(N=N
/A)
Suffi
cien
cy
Rat
ing
ADT TRU
CK
%
DEC
K
SUPE
R
SUB
CU
LV
B130103 1961
IH 90 WB-IH 94 WB USH 151 N 76.60 34000 17 5 6 5 N
B130289 1997 IH 90 WB-IH 94 WB T N 97.00 37100 10 7 8 7 N
B130307 1997 IH 90 EB STH 30 WB N 94.80 24200 10 7 8 8 N
B130308 1997 IH 90 WB STH 30 WB N 93.90 23100 11 7 8 7 N
B130309 1997 IH 90 WB STH 30 EB N 96.30 35700 11 7 8 7 N
B130334 1997 IH 90 EB STH 30 EB N 90.40 30800 0 8 8 8 N
B130400 1994 RAMP IH 90 WB-STH 30 WB IH 90 EB N 93.60 5300 21 8 8 8 N
B130438 1996 IH 94 EB IH 90 WB N 95.60 6600 17 7 8 6 N
B130448 1997 IH 90 EB T N 97 37100 10 7 8 8 N
B130450 1996 IH 94 EB T N 98 42100 17 7 8 8 N
B130104 1960 IH 90 EB-IH 94 EB CMSTPP RR N 98.00 42100 17 7 8 8 N
B130105 1960 IH 90 WB-IH 94 WB CMSTPP RR N 98.00 37100 17 8 8 7 N
B130107 1961 IH 90 EB-IH 94 EB LIEN RD N 63.50 42100 17 4 4 5 N
B130108 1961 IH 90 WB-IH 94 WB LIEN RD N 63.50 37100 17 4 4 7 N
32
B130118 1959 IH 90-IH 94 STARKWEATHER CREEK 8 69.00 79200 17 N N N 6
B130458 1997 IH 90 EB CNW RR N 83 42700 11 8 8 7 N
B130459 1997 IH 90 WB CNW RR N 93.70 4300 11 8 8 8 N
B130460 1997 RAMP USH 12 EB-IH 90 WB USH 12 WB-USH 18 WB N 97.90 2700 0 8 8 8 N
B130461 1997 IH 90 EB RAMP IH 90WB-USH 12WB N 97.20 17000 11 8 8 8 N
B130462 1997 IH 90 EB FEMRITE RD N 85 42700 11 8 8 8 N
B130463 1997 IH 90 WB FEMRITE RD N 84 43000 11 7 8 8 N
B130464 1997 IH 90 EB USH 12 WB-USH 18 WB N 96.10 17300 11 7 8 8 N
B130465 1997 IH 90 WB USH 12 WB-USH 18 WB N 94.60 26470 16 8 8 8 N
B130466 1997 IH 90 EB USH 12 EB-USH 18 EB N 96.10 17460 11 7 8 8 N
33
B130467 1997 IH 90 WB USH 12 EB-USH 18 EB N 96.80 26470 16 8 8 8 N
B130160 1961 IH 90 EB DOOR CREEK 8 96.60 27200 15 8 7 7 N
B130161 1962 IH 90 WB DOOR CREEK 8 96.80 24600 15 8 7 7 N
B130137 1961 IH 90 EB SIGGELKOW RD N 78.60 27200 16 5 5 6 N
B130138 1961 IH 90 WB SIGGELKOW RD N 79.50 24600 15 6 5 6 N
B130140 1961 IH 90 EB MN N 97.00 27200 15 6 6 7 N
34
B130141 1961 IH 90 WB MN N 97.00 24600 15 6 7 7 N
B130146 1961 IH 90 EB DROTNING RD N 96.00 27200 17 7 7 7 N
B130147 1961 IH 90 WB DROTNING RD N 96.00 25300 15 6 7 6 N
B130148 1961 IH 90 EB W N 97.00 27200 17 7 8 7 N
B130149 1961 IH 90 WB W N 97.00 25300 15 7 8 6 N
B130164 1961 IH 90 EB B N 96.00 18100 17 6 8 7 N
B130165 1961 IH 90 WB B N 96.00 16500 15 5 8 7 N
35
B130168 1961 IH 90 EB CHURCH RD N 85.00 18100 17 5 5 6 N

74
NBI Rating C
orrid
or
Segm
ent I
D
Bridge ID
Year built Feature on Feature Under Sc
our C
ode
(N=N
/A)
Suffi
cien
cy
Rat
ing
ADT TRU
CK
%
DEC
K
SUPE
R
SUB
CU
LV
B130169 1961 IH 90 WB CHURCH RD N 85.00 16500 15 5 5 5 N
B130171 1961 IH 90 EB USH 51 NB N 82.00 27680 17 5 5 5 N
B130172 1961 IH 90 WB USH 51 NB N 94.00 25800 15 6 6 6 N
B130208 1961 IH 90 EB-USH 51 SB BR SAUNDERS CREEK 5 93.50 29100 17 6 6 6 N
36
B130209 1961 IH 90 WB-USH 51 NB BR SAUNDERS CREEK 5 79.50 25800 15 4 5 6 N
B530088 1961 IH 90 EB ELLENDALE RD--ROCK RIVER 5 91 19000 16 6 7 7 N
B530089 1961 IH 90 WB ELLENDALE RD--ROCK RIVER 5 91 19700 16 6 7 7 N
B130176 1961 IH 90 EB LAKE DRIVE RD N 88.50 28200 17 3 6 6 N
37
B130177 1961 IH 90 WB LAKE DRIVE RD N 79.10 24500 16 3 6 5 N
B530072 1961 IH 90 EB NEWVILLE RD N 83 23000 16 4 6 5 N
B530073 1961 IH 90 WB NEWVILLE RD N 97 19700 17 6 7 6 N
B530074 1961 IH 90 EB M N 97 19000 16 6 6 7 N
B530075 1961 IH 90 WB M N 97 19700 19 6 6 6 N
B530076 1961 IH 90 EB CMSTPP RR N 98 23000 16 6 6 6 N
B530077 1961 IH 90 WB WSOR Railroad N 54 19700 16 7 6 3 N
B530079 1961 IH 90 EB TOWN LINE RD N 97 19000 14 7 7 7 N
B530080 1961 IH 90 WB TOWN LINE RD N 97 19700 19 7 7 7 N
B530081 1962 IH 90 EB KENNEDY RD N 94 19000 14 8 7 8 N
B530082 1962 IH 90 WB KENNEDY RD N 97 19700 19 8 7 8 N
B530083 1961 IH 90 EB WIS & CALUMET RR N 97 19000 14 8 8 8 N
B530084 1961 IH 90 WB WIS & CALUMET RR N 98 19000 19 8 8 7 N
B530085 1962 IH 90 EB STH 26-MILTON AVE N 83.60 25200 14 7 6 5 N
38
B530086 1962 IH 90 WB STH 26-MILTON AVE N 91 21200 14 6 6 6 N
B530065 1961 IH 90 EB USH 14 N 56.40 19700 17 5 5 4 N 39
B530066 1961 IH 90 WB USH 14 N 80.90 19700 17 5 5 5 N
B530214 2003 IH 90 EB MILWAUKEE STREET N 92.30 30500 0 8 8 8 N
B530215 2004 IH 90 WB MILWAUKEE STREET N 89.90 32000 0 8 9 9 N
B530059 1959 IH 90 EB MT ZION AVE N 92.50 30500 16 8 8 7 N
B530060 1959 IH 90 WB MT ZION AVE N 94 32000 16 8 8 8 N
B530061 1959 IH 90 EB PALMER PARK DR N 94.50 30500 16 7 7 7 N
B530062 1959 IH 90 WB PALMER PARK DR N 94 32000 16 8 7 7 N
B530063 1959 IH 90 EB SPRING BROOK 8 96.50 30500 16 8 8 8 N
B530064 1959 IH 90 WB SPRING BROOK 8 98 32000 16 8 8 8 N
B530029 1959 IH 90 EB RUGER ST N 96.30 30500 16 7 6 7 N
40
B530030 1959 IH 90 WB RUGER ST N 96.30 32000 16 7 6 6 N
B530036 1958 IH 90 EB CNW RR N 96.30 23900 16 8 7 8 N
B530037 1958 IH 90 WB CNW RR N 92 22800 16 7 7 7 N
B530039 1959 IH 90 EB TOWN LINE RD N 92.80 23900 16 8 8 8 N
42
B530040 1959 IH 90 WB TOWN LINE RD N 96 22800 16 7 8 8 N

75
NBI Rating C
orrid
or
Segm
ent I
D
Bridge ID
Year built Feature on Feature Under Sc
our C
ode
(N=N
/A)
Suffi
cien
cy
Rat
ing
ADT TRU
CK
%
DEC
K
SUPE
R
SUB
CU
LV
B530042 1959 IH 90 EB TURTLE CREEK 8 96.90 23900 16 7 8 7 N
B530043 1959 IH 90 WB TURTLE CREEK 8 98 22800 16 8 8 8 N
B530056 1958 IH 90 BR ROCK RIVER 8 69 48400 0 N N N 6
B530048 1959 IH 90 EB CMSTPP RR 8 94.60 27000 14 8 8 8 N
B530051 1959 IH 90 WB CMSTPP RR 8 98 24600 14 7 8 8 N
B530216 2003 IH 90 EB COLLEY ROAD N 92.90 27000 0 8 7 8 N 43
B530217 2004 IH 90 WB COLLEY RD N 93.40 24600 0 8 9 9 N

76
Appendix D: Vulnerability Ratings of Corridor Segments Table 14 lists the vulnerability ratings for each corridor segment.
• Segment ID. The ID of individual corridor segment being studied.
• Bridge ID. The WisDOT bridge number.
• Point FID. The ID given to the equal length highway segments, other than bridge structures along the selected corridor segment.
• Winter Severity Index. The severity values used for snow/ice functional failure mode.
Table 14: The Corridor Segments with Vulnerability Assessment
Corridor Segment
ID Bridge ID Point
FID RPN
Floods RPN
Storms RPN
Tornadoes Winter
Severity Index
Rating Combined
Rating Snow
Net Rating
0 70 90 230 0 0 0 0
1 70 70 90 36.43 3 3 6
2 70 70 90 36.43 3 3 6
B550147 42 42 54 36.43 3 3 6
0
B550148 42 42 54 36.43 3 3 6
3 70 70 90 36.43 3 3 6
4 70 70 90 36.43 3 3 6
5 70 70 90 36.43 3 3 6
6 70 70 90 36.43 3 3 6
13 70 70 90 36.43 3 3 6
B550031 42 51 66 36.43 3 3 6
B550032 42 51 66 36.43 3 3 6
B550033 42 51 66 36.43 3 3 6
1
B550034 42 51 66 36.43 3 3 6
14 70 70 90 36.43 3 3 6
15 70 70 90 36.43 3 3 6
16 70 70 90 36.43 3 3 6
17 70 70 90 36.43 3 3 6
18 70 70 90 36.43 3 3 6
19 70 70 90 36.43 3 3 6
2
B550036 42 51 66 36.43 3 3 6

77
Corridor Segment
ID Bridge ID Point
FID RPN
Floods RPN
Storms RPN
Tornadoes Winter
Severity Index
Rating Combined
Rating Snow
Net Rating
B550037 42 51 66 36.43 3 3 6
B550038 70 56 72 36.43 3 3 6
B550039 70 56 72 36.43 3 3 6
B550044 70 61 78 36.43 4 3 7
B550045 70 61 78 36.43 4 3 7
B550202 28 33 42 36.43 3 3 6
8 70 70 90 36.43 3 3 6
9 70 70 90 36.43 3 3 6
10 70 70 90 36.43 3 3 6
B550012 56 65 84 36.43 4 3 7
B550013 56 65 84 36.43 4 3 7
B550015 70 61 78 36.43 4 3 7
B550016 70 56 72 36.43 3 3 6
B550017 56 56 72 36.43 3 3 6
3
B550018 56 56 72 36.43 3 3 6
11 70 70 90 36.43 3 3 6
12 70 70 90 36.43 3 3 6
20 140 70 135 36.43 3 3 6
21 140 70 135 66.9 5 5 10
22 140 70 135 66.9 5 5 10
23 140 70 135 66.9 5 5 10
24 140 70 135 66.9 5 5 10
25 140 70 135 66.9 5 5 10
26 140 70 135 66.9 5 5 10
B170018 84 42 81 66.9 4 5 9
B170019 112 47 90 66.9 4 5 9
B170021 84 42 81 66.9 4 5 9
4
B170022 84 42 81 66.9 4 5 9

78
Corridor Segment
ID Bridge ID Point
FID RPN
Floods RPN
Storms RPN
Tornadoes Winter
Severity Index
Rating Combined
Rating Snow
Net Rating
B170023 84 42 81 66.9 4 5 9
B170024 84 42 81 66.9 4 5 9
B170025 84 42 81 66.9 4 5 9
B170026 84 51 99 66.9 4 5 9
B170027 112 56 108 66.9 4 5 9
B170028 84 42 81 66.9 4 5 9
B170051 112 56 108 66.9 4 5 9
B170054 112 56 108 66.9 4 5 9
B170055 112 56 108 66.9 4 5 9
B170174 56 28 54 66.9 3 5 8
B170175 56 28 54 66.9 3 5 8
B550019 42 56 72 36.43 3 3 6
B550020 42 56 72 36.43 3 3 6
B550022 56 65 84 36.43 4 3 7
B550023 42 56 72 36.43 3 3 6
27 140 70 135 66.9 5 5 10
28 140 70 135 66.9 5 5 10
29 140 70 135 66.9 5 5 10
30 140 70 135 66.9 5 5 10
31 140 70 135 66.9 5 5 10
32 140 70 135 66.9 5 5 10
33 140 70 135 66.9 5 5 10
34 140 70 135 66.9 5 5 10
B170032 84 56 108 66.9 4 5 9
B170033 84 61 117 66.9 4 5 9
B170034 112 56 108 66.9 4 5 9
B170035 112 56 108 66.9 4 5 9
5
B170036 112 56 108 66.9 4 5 9

79
Corridor Segment
ID Bridge ID Point
FID RPN
Floods RPN
Storms RPN
Tornadoes Winter
Severity Index
Rating Combined
Rating Snow
Net Rating
B170037 112 56 108 66.9 4 5 9
B170038 112 56 108 66.9 4 5 9
B170039 112 56 108 66.9 4 5 9
B170052 112 56 108 66.9 4 5 9
B170059 112 56 108 66.9 4 5 9
B170060 112 56 108 66.9 4 5 9
B170063 140 70 135 66.9 4 5 9
35 140 70 135 66.9 5 5 10
36 140 70 135 66.9 5 5 10
37 140 70 135 66.9 5 5 10
38 140 70 135 66.9 5 5 10
39 35 105 45 66.9 5 5 10
40 35 105 45 26.71 2 2 4
41 35 105 45 26.71 2 2 4
42 35 105 45 26.71 2 2 4
47 35 105 45 29.31 2 2 4
B170050 112 56 108 66.9 4 5 9
B170057 196 70 135 66.9 5 5 10
B170058 196 70 135 66.9 5 5 10
B180011 21 70 30 26.71 3 2 5
B180012 21 70 30 26.71 3 2 5
6
B180015 28 91 39 26.71 3 2 5
43 35 105 45 26.71 2 2 4
44 35 105 45 26.71 2 2 4
45 35 105 45 26.71 2 2 4
46 35 105 45 26.71 2 2 4
48 35 105 45 26.71 2 2 4
7
49 35 105 45 26.71 2 2 4

80
Corridor Segment
ID Bridge ID Point
FID RPN
Floods RPN
Storms RPN
Tornadoes Winter
Severity Index
Rating Combined
Rating Snow
Net Rating
57 35 105 45 26.71 2 2 4
B180019 21 84 36 26.71 3 2 5
B180020 21 84 36 26.71 3 2 5
B180021 21 91 39 26.71 3 2 5
B180022 21 91 39 26.71 3 2 5
B180023 28 91 39 26.71 3 2 5
B180024 28 84 36 26.71 3 2 5
B180025 28 84 36 26.71 3 2 5
B180026 28 77 33 26.71 3 2 5
B180044 21 91 39 26.71 3 2 5
B180045 21 77 33 26.71 3 2 5
B180203 7 28 12 26.71 1 2 3
B180204 7 21 9 26.71 1 2 3
54 35 105 45 26.71 2 2 4
55 35 105 45 26.71 2 2 4
56 35 105 45 26.71 2 2 4
B180029 28 84 36 26.71 3 2 5
B180030 28 84 36 26.71 3 2 5
B180032 21 77 33 26.71 3 2 5
8
B180033 21 77 33 26.71 3 2 5
50 35 105 45 26.71 2 2 4
51 35 105 45 26.71 2 2 4
52 35 105 45 26.71 2 2 4
53 35 105 45 26.71 2 2 4
58 35 105 45 26.71 2 2 4
59 35 105 45 26.71 2 2 4
B180151 14 49 21 26.71 1 2 3
9
B180152 14 49 21 26.71 1 2 3

81
Corridor Segment
ID Bridge ID Point
FID RPN
Floods RPN
Storms RPN
Tornadoes Winter
Severity Index
Rating Combined
Rating Snow
Net Rating
60 35 105 45 26.71 2 2 4
61 35 105 45 26.71 2 2 4
62 35 105 45 26.71 2 2 4
63 35 105 45 26.71 2 2 4
64 35 105 45 26.71 2 2 4
65 35 105 45 26.71 2 2 4
66 35 105 45 26.71 2 2 4
67 35 105 45 26.71 2 2 4
68 35 105 45 26.71 2 2 4
69 35 105 45 26.71 2 2 4
72 140 105 45 33.37 3 3 6
B180051 21 70 30 26.71 3 2 5
B180052 21 70 30 26.71 3 2 5
B180053 21 77 33 26.71 3 2 5
B180054 21 77 33 26.71 3 2 5
B180055 21 77 33 26.71 3 2 5
B180056 21 77 33 26.71 3 2 5
B180057 21 70 30 26.71 3 2 5
B180058 21 70 30 26.71 3 2 5
B180063 28 84 36 26.71 3 2 5
B180064 28 84 36 26.71 3 2 5
B610041 21 63 27 32.41 3 3 6
B610042 21 63 27 32.41 3 3 6
10
B610043 21 63 27 32.41 3 3 6
71 35 105 45 32.41 3 3 6
73 140 105 45 32.41 3 3 6
74 140 105 45 33.37 3 3 6
11
75 140 105 45 33.37 3 3 6

82
Corridor Segment
ID Bridge ID Point
FID RPN
Floods RPN
Storms RPN
Tornadoes Winter
Severity Index
Rating Combined
Rating Snow
Net Rating
76 140 105 45 33.37 3 3 6
77 140 105 45 33.37 3 3 6
78 140 105 45 33.37 3 3 6
79 140 105 45 33.37 3 3 6
B270035 112 91 39 33.37 4 3 7
B270036 84 70 30 33.37 3 3 6
B270037 84 77 33 33.37 3 3 6
B270038 84 63 27 33.37 3 3 6
B270148 84 49 21 33.37 3 3 6
B270149 84 63 27 33.37 3 3 6
80 140 105 45 33.37 3 3 6
81 140 105 45 33.37 3 3 6
82 140 105 45 33.37 3 3 6
83 140 105 45 33.37 3 3 6
84 140 105 45 33.37 3 3 6
85 140 105 45 33.37 3 3 6
86 140 105 45 34.98 3 3 6
90 140 105 45 33.37 3 3 6
B270021 84 77 33 33.37 3 3 6
B270022 84 77 33 33.37 3 3 6
B270024 112 70 30 33.37 4 3 7
B270025 112 70 30 33.37 4 3 7
B270027 84 77 33 33.37 3 3 6
B270028 84 77 33 33.37 3 3 6
B270029 84 77 33 33.37 3 3 6
B270030 84 77 33 33.37 3 3 6
B270031 84 77 33 33.37 3 3 6
13
B270032 84 77 33 33.37 3 3 6

83
Corridor Segment
ID Bridge ID Point
FID RPN
Floods RPN
Storms RPN
Tornadoes Winter
Severity Index
Rating Combined
Rating Snow
Net Rating
87 140 105 45 33.37 3 3 6
88 140 105 45 33.37 3 3 6
89 140 105 45 33.37 3 3 6
93 140 105 45 33.37 3 3 6
B270039 84 70 30 33.37 3 3 6
B270040 84 70 30 33.37 3 3 6
B270041 84 70 30 33.37 3 3 6
14
B270042 84 70 30 33.37 3 3 6
91 140 105 45 33.37 3 3 6
92 140 105 45 33.37 3 3 6
94 140 105 45 33.37 3 3 6
95 140 105 45 33.37 3 3 6
96 140 105 45 33.37 3 3 6
97 140 105 45 33.37 3 3 6
B270043 84 77 33 33.37 3 3 6
B270044 84 77 33 33.37 3 3 6
B270054 84 63 27 33.37 3 3 6
B270055 84 63 27 33.37 3 3 6
B270059 112 70 30 33.37 4 3 7
B270060 84 56 24 33.37 3 3 6
B270063 112 84 36 33.37 4 3 7
15
B270064 112 84 36 33.37 4 3 7
98 140 105 45 33.37 3 3 6
99 140 105 45 33.37 3 3 6
100 140 105 45 33.37 3 3 6
144 175 70 45 34.98 3 3 6
145 175 70 45 37.05 4 4 8
16
146 175 70 45 37.05 4 4 8

84
Corridor Segment
ID Bridge ID Point
FID RPN
Floods RPN
Storms RPN
Tornadoes Winter
Severity Index
Rating Combined
Rating Snow
Net Rating
147 175 70 45 37.05 4 4 8
148 175 70 45 37.05 4 4 8
149 175 70 45 37.05 4 4 8
150 175 70 45 37.05 4 4 8
151 175 70 45 37.05 4 4 8
152 175 70 45 37.05 4 4 8
153 175 70 45 37.05 4 4 8
154 175 70 45 37.05 4 4 8
155 175 70 45 37.05 4 4 8
156 175 70 45 32.89 3 3 6
158 175 70 45 37.05 4 4 8
B410032 140 98 42 37.05 4 4 8
B410033 140 47 30 37.05 4 4 8
B410059 140 56 36 37.05 4 4 8
B410062 112 70 30 37.05 4 4 8
B410063 28 21 9 37.05 1 4 5
B410064 56 42 18 37.05 3 4 7
B410065 28 21 9 37.05 1 4 5
B410066 84 49 21 37.05 3 4 7
B410067 28 21 9 37.05 1 4 5
B410070 84 77 33 37.05 3 4 7
B410071 84 77 33 37.05 3 4 7
B410072 84 77 33 37.05 3 4 7
B410073 84 77 33 37.05 3 4 7
B410074 84 91 39 37.05 4 4 8
B410075 84 91 39 37.05 4 4 8
157 175 70 45 37.05 4 4 8 17
164 175 70 45 33.37 3 3 6

85
Corridor Segment
ID Bridge ID Point
FID RPN
Floods RPN
Storms RPN
Tornadoes Winter
Severity Index
Rating Combined
Rating Snow
Net Rating
B410028 175 56 36 37.05 4 4 8
B410029 105 51 33 37.05 3 4 7
159 175 70 45 37.05 4 4 8
160 175 70 45 37.05 4 4 8
161 175 70 45 37.05 4 4 8
162 175 70 45 37.05 4 4 8
163 175 70 45 37.05 4 4 8
165 175 70 45 37.05 4 4 8
166 175 70 45 37.05 4 4 8
167 175 70 45 37.05 4 4 8
168 175 70 45 37.05 4 4 8
169 175 70 45 37.05 4 4 8
170 175 70 45 37.05 4 4 8
B410024 105 42 27 37.05 3 4 7
B410044 105 47 30 37.05 3 4 7
B410055 105 42 27 37.05 3 4 7
B410056 105 42 27 37.05 3 4 7
B410057 105 37 24 37.05 3 4 7
B410058 105 33 21 37.05 3 4 7
18
B410245 35 19 12 37.05 1 4 5
101 245 70 90 33.37 3 3 6
102 245 70 90 37.05 4 4 8
103 245 70 90 34.98 3 3 6
104 245 70 90 34.98 3 3 6
171 175 70 45 37.05 4 4 8
172 175 70 45 37.05 4 4 8
B290051 147 61 78 34.98 4 3 7
19
B290052 245 75 96 34.98 5 3 8

86
Corridor Segment
ID Bridge ID Point
FID RPN
Floods RPN
Storms RPN
Tornadoes Winter
Severity Index
Rating Combined
Rating Snow
Net Rating
B290053 147 37 48 34.98 4 3 7
B290054 196 47 60 34.98 4 3 7
B290058 147 42 54 34.98 4 3 7
B410035 140 65 42 37.05 4 4 8
B410045 105 42 27 37.05 3 4 7
B410046 140 56 36 37.05 4 4 8
B410049 105 42 27 37.05 3 4 7
B410050 105 42 27 37.05 3 4 7
B410051 105 42 27 37.05 3 4 7
B410053 105 42 27 37.05 3 4 7
105 245 70 90 34.98 3 3 6
106 245 70 90 34.98 3 3 6
107 245 70 90 26.71 2 2 4
108 245 70 90 34.98 3 3 6
109 245 70 90 34.98 3 3 6
110 245 70 90 34.98 3 3 6
111 245 70 90 34.98 3 3 6
112 245 70 90 34.98 3 3 6
118 245 70 90 37.05 4 4 8
B290044 147 42 54 34.98 4 3 7
B290045 98 37 48 34.98 3 3 6
B290046 196 47 60 34.98 4 3 7
20
B290047 245 56 72 34.98 5 3 8
113 245 70 90 34.98 3 3 6
114 245 70 90 34.98 3 3 6
115 245 70 90 34.98 3 3 6
116 245 70 90 34.98 3 3 6
21
117 245 70 90 34.98 3 3 6

87
Corridor Segment
ID Bridge ID Point
FID RPN
Floods RPN
Storms RPN
Tornadoes Winter
Severity Index
Rating Combined
Rating Snow
Net Rating
119 245 70 90 34.98 3 3 6
120 245 70 90 34.98 3 3 6
121 245 70 90 34.98 3 3 6
122 245 70 90 34.98 3 3 6
123 245 70 90 34.98 3 3 6
124 245 70 90 34.98 3 3 6
125 245 70 90 34.98 3 3 6
B290032 196 47 60 34.98 4 3 7
B290033 196 47 60 34.98 4 3 7
B290034 147 47 60 34.98 4 3 7
B290035 147 42 54 34.98 4 3 7
B290036 147 37 48 34.98 4 3 7
B290037 147 42 54 34.98 4 3 7
126 245 70 90 34.98 3 3 6
127 245 70 90 34.98 3 3 6
128 245 70 90 34.98 3 3 6
129 245 70 90 34.98 3 3 6
130 245 70 90 34.98 3 3 6
131 245 70 90 34.98 3 3 6
132 245 70 90 34.98 3 3 6
133 245 70 90 34.98 3 3 6
134 245 70 90 34.98 3 3 6
135 245 70 90 34.98 3 3 6
136 245 70 90 34.98 3 3 6
137 245 70 90 34.98 3 3 6
138 245 70 90 34.98 3 3 6
139 245 70 90 34.98 3 3 6
22
140 245 70 90 34.98 3 3 6
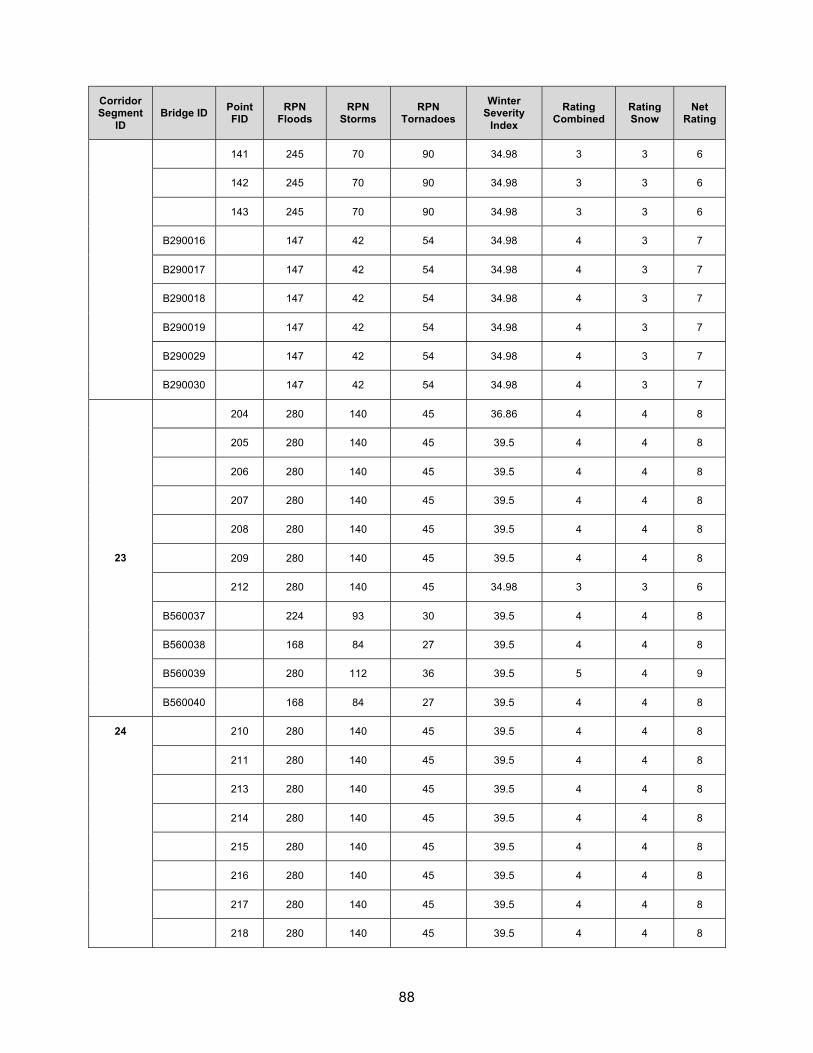
88
Corridor Segment
ID Bridge ID Point
FID RPN
Floods RPN
Storms RPN
Tornadoes Winter
Severity Index
Rating Combined
Rating Snow
Net Rating
141 245 70 90 34.98 3 3 6
142 245 70 90 34.98 3 3 6
143 245 70 90 34.98 3 3 6
B290016 147 42 54 34.98 4 3 7
B290017 147 42 54 34.98 4 3 7
B290018 147 42 54 34.98 4 3 7
B290019 147 42 54 34.98 4 3 7
B290029 147 42 54 34.98 4 3 7
B290030 147 42 54 34.98 4 3 7
204 280 140 45 36.86 4 4 8
205 280 140 45 39.5 4 4 8
206 280 140 45 39.5 4 4 8
207 280 140 45 39.5 4 4 8
208 280 140 45 39.5 4 4 8
209 280 140 45 39.5 4 4 8
212 280 140 45 34.98 3 3 6
B560037 224 93 30 39.5 4 4 8
B560038 168 84 27 39.5 4 4 8
B560039 280 112 36 39.5 5 4 9
23
B560040 168 84 27 39.5 4 4 8
210 280 140 45 39.5 4 4 8
211 280 140 45 39.5 4 4 8
213 280 140 45 39.5 4 4 8
214 280 140 45 39.5 4 4 8
215 280 140 45 39.5 4 4 8
216 280 140 45 39.5 4 4 8
217 280 140 45 39.5 4 4 8
24
218 280 140 45 39.5 4 4 8

89
Corridor Segment
ID Bridge ID Point
FID RPN
Floods RPN
Storms RPN
Tornadoes Winter
Severity Index
Rating Combined
Rating Snow
Net Rating
B560042 224 93 30 39.5 4 4 8
B560043 168 84 27 39.5 4 4 8
B560044 168 84 27 39.5 4 4 8
B560045 168 84 27 39.5 4 4 8
B560047 224 112 36 39.5 5 4 9
B560048 224 112 36 39.5 5 4 9
174 175 105 45 34.98 3 3 6
219 280 140 45 39.5 4 4 8
220 280 140 45 39.5 4 4 8
221 280 140 45 39.5 4 4 8
222 280 140 45 39.5 4 4 8
B560030 168 93 30 39.5 4 4 8
B560031 168 84 27 39.5 4 4 8
B560049 168 84 27 39.5 4 4 8
25
B560050 168 84 27 39.5 4 4 8
173 175 105 45 37.05 4 4 8
175 175 105 45 36.86 4 4 8
176 175 105 45 36.86 4 4 8
177 175 105 45 36.86 4 4 8
178 175 105 45 36.86 4 4 8
180 175 105 45 36.86 4 4 8
223 280 140 45 39.5 4 4 8
224 280 140 45 39.5 4 4 8
225 280 140 45 39.5 4 4 8
226 280 140 45 39.5 4 4 8
227 280 140 45 39.5 4 4 8
228 280 140 45 39.5 4 4 8
26
229 280 140 45 39.5 4 4 8

90
Corridor Segment
ID Bridge ID Point
FID RPN
Floods RPN
Storms RPN
Tornadoes Winter
Severity Index
Rating Combined
Rating Snow
Net Rating
230 280 140 45 39.5 4 4 8
231 280 140 45 39.5 4 4 8
B110138 105 49 21 36.86 3 4 7
B560024 168 84 27 39.5 4 4 8
B560025 168 84 27 39.5 4 4 8
179 175 105 45 36.86 4 4 8
181 175 105 45 36.86 4 4 8
182 175 105 45 36.86 4 4 8
183 175 105 45 36.86 4 4 8
184 175 105 45 36.86 4 4 8
27
191 175 105 45 39.5 4 4 8
185 175 105 45 36.86 4 4 8
186 175 105 45 36.86 4 4 8
187 175 105 45 29.31 2 2 4
188 175 105 45 36.86 4 4 8
189 175 105 45 36.86 4 4 8
190 175 105 45 36.86 4 4 8
192 175 105 45 36.86 4 4 8
193 175 105 45 36.86 4 4 8
194 175 105 45 36.86 4 4 8
195 175 105 45 36.86 4 4 8
196 175 105 45 36.86 4 4 8
197 175 105 45 36.86 4 4 8
198 175 105 45 36.86 4 4 8
199 175 105 45 36.86 4 4 8
B110015 140 112 48 36.86 4 4 8
B110016 175 105 45 36.86 4 4 8
28
B110022 140 98 42 36.86 4 4 8

91
Corridor Segment
ID Bridge ID Point
FID RPN
Floods RPN
Storms RPN
Tornadoes Winter
Severity Index
Rating Combined
Rating Snow
Net Rating
B110023 140 98 42 36.86 4 4 8
B110024 175 98 42 36.86 4 4 8
B110040 105 77 33 36.86 4 4 8
B110041 105 77 33 36.86 4 4 8
B110042 105 63 27 36.86 3 4 7
B110043 105 63 27 36.86 3 4 7
B110044 70 42 18 36.86 3 4 7
B110045 105 63 27 36.86 3 4 7
200 175 105 45 36.86 4 4 8
201 175 105 45 36.86 4 4 8
202 175 105 45 36.86 4 4 8
203 175 105 45 36.86 4 4 8
232 210 140 135 39.5 4 4 8
233 210 140 135 32.89 3 3 6
234 210 140 135 32.89 3 3 6
235 210 140 135 32.89 3 3 6
236 210 140 135 32.89 3 3 6
237 210 140 135 32.89 3 3 6
238 210 140 135 32.89 3 3 6
239 210 140 135 32.89 3 3 6
240 210 140 135 32.89 3 3 6
241 210 140 135 32.89 3 3 6
242 210 140 135 32.89 3 3 6
B130087 252 168 162 32.89 5 3 8
B130088 210 159 153 32.89 5 3 8
B130090 168 112 108 32.89 5 3 8
B130091 210 140 135 32.89 5 3 8
29
B130092 168 131 126 32.89 5 3 8

92
Corridor Segment
ID Bridge ID Point
FID RPN
Floods RPN
Storms RPN
Tornadoes Winter
Severity Index
Rating Combined
Rating Snow
Net Rating
B130093 210 121 117 32.89 5 3 8
B130094 168 121 117 32.89 5 3 8
B130119 84 56 54 32.89 3 3 6
B130297 126 121 117 32.89 5 3 8
243 210 140 135 32.89 3 3 6
244 210 140 135 32.89 3 3 6
245 210 140 135 32.89 3 3 6
246 210 140 135 32.89 3 3 6
B130095 168 112 108 32.89 5 3 8
B130098 210 112 108 32.89 5 3 8
30
B130099 210 140 135 32.89 5 3 8
247 210 140 135 32.89 3 3 6
248 210 140 135 32.89 3 3 6
249 210 140 135 32.89 3 3 6
250 210 140 135 32.89 3 3 6
251 210 140 135 32.89 3 3 6
252 210 140 135 32.89 3 3 6
253 210 140 135 32.89 3 3 6
254 210 140 135 32.89 3 3 6
B130102 210 112 108 32.89 5 3 8
31
B130103 210 131 126 32.89 5 3 8
255 210 140 135 32.89 3 3 6
256 210 140 135 32.89 3 3 6
257 210 140 135 32.89 3 3 6
258 210 140 135 32.89 3 3 6
259 210 140 135 32.89 3 3 6
260 210 140 135 32.89 3 3 6
32
B130104 84 65 63 32.89 4 3 7

93
Corridor Segment
ID Bridge ID Point
FID RPN
Floods RPN
Storms RPN
Tornadoes Winter
Severity Index
Rating Combined
Rating Snow
Net Rating
B130105 126 65 63 32.89 4 3 7
B130107 210 159 153 32.89 5 3 8
B130108 126 140 135 32.89 5 3 8
B130118 168 112 108 32.89 5 3 8
B130289 126 75 72 32.89 4 3 7
B130307 84 65 63 32.89 4 3 7
B130308 126 75 72 32.89 4 3 7
B130309 126 75 72 32.89 4 3 7
B130334 84 56 54 32.89 3 3 6
B130400 84 56 54 32.89 3 3 6
B130438 168 84 81 32.89 4 3 7
B130448 84 65 63 32.89 4 3 7
B130450 84 65 63 32.89 4 3 7
261 210 140 135 32.89 3 3 6
262 210 140 135 32.89 3 3 6
263 210 140 135 32.89 3 3 6
264 210 140 135 32.89 3 3 6
265 210 140 135 32.89 3 3 6
266 210 140 135 32.89 3 3 6
273 210 140 135 36.86 4 4 8
B130458 126 65 63 32.89 4 3 7
B130459 84 56 54 32.89 3 3 6
B130460 84 56 54 32.89 3 3 6
B130461 84 56 54 32.89 3 3 6
B130462 84 56 54 32.89 3 3 6
B130463 84 65 63 32.89 4 3 7
B130464 84 65 63 32.89 4 3 7
33
B130465 84 56 54 32.89 3 3 6

94
Corridor Segment
ID Bridge ID Point
FID RPN
Floods RPN
Storms RPN
Tornadoes Winter
Severity Index
Rating Combined
Rating Snow
Net Rating
B130466 84 65 63 32.89 4 3 7
B130467 84 56 54 32.89 3 3 6
267 210 140 135 32.89 3 3 6
268 210 140 135 32.89 3 3 6
269 210 140 135 32.89 3 3 6
270 210 140 135 32.89 3 3 6
271 210 140 135 32.89 3 3 6
272 210 140 135 32.89 3 3 6
274 210 140 135 32.89 3 3 6
275 210 140 135 32.89 3 3 6
276 210 140 135 32.89 3 3 6
B130137 168 131 126 32.89 5 3 8
B130138 168 121 117 32.89 5 3 8
B130140 126 103 99 32.89 4 3 7
B130141 126 93 90 32.89 4 3 7
B130160 126 75 72 32.89 4 3 7
34
B130161 126 75 72 32.89 4 3 7
277 210 140 135 32.89 3 3 6
278 210 140 135 32.89 3 3 6
279 210 140 135 32.89 3 3 6
280 210 140 135 32.89 3 3 6
281 210 140 135 32.89 3 3 6
282 210 140 135 32.89 3 3 6
283 210 140 135 32.89 3 3 6
284 210 140 135 32.89 3 3 6
285 210 140 135 32.89 3 3 6
286 210 140 135 32.89 3 3 6
35
287 210 140 135 32.89 3 3 6

95
Corridor Segment
ID Bridge ID Point
FID RPN
Floods RPN
Storms RPN
Tornadoes Winter
Severity Index
Rating Combined
Rating Snow
Net Rating
288 210 140 135 32.89 3 3 6
289 210 140 135 32.89 3 3 6
290 210 140 135 32.89 3 3 6
291 210 140 135 32.89 3 3 6
292 210 140 135 32.89 3 3 6
293 210 140 135 32.89 3 3 6
294 210 140 135 32.89 3 3 6
295 210 140 135 32.89 3 3 6
296 210 140 135 32.89 3 3 6
B130146 126 84 81 32.89 4 3 7
B130147 168 103 99 32.89 5 3 8
B130148 126 75 72 32.89 4 3 7
B130149 168 84 81 32.89 4 3 7
B130164 126 84 81 32.89 4 3 7
B130165 126 93 90 32.89 4 3 7
B130168 168 131 126 32.89 5 3 8
B130169 210 140 135 32.89 5 3 8
B130171 210 140 135 32.89 5 3 8
B130172 168 112 108 32.89 5 3 8
297 210 140 135 32.89 3 3 6
298 210 140 135 32.89 3 3 6
299 210 140 135 32.89 3 3 6
300 210 140 135 32.89 3 3 6
301 210 140 135 32.89 3 3 6
302 210 140 135 32.89 3 3 6
303 210 140 135 32.89 3 3 6
309 210 105 45 36.86 4 4 8
36
B130208 168 112 108 32.89 5 3 8
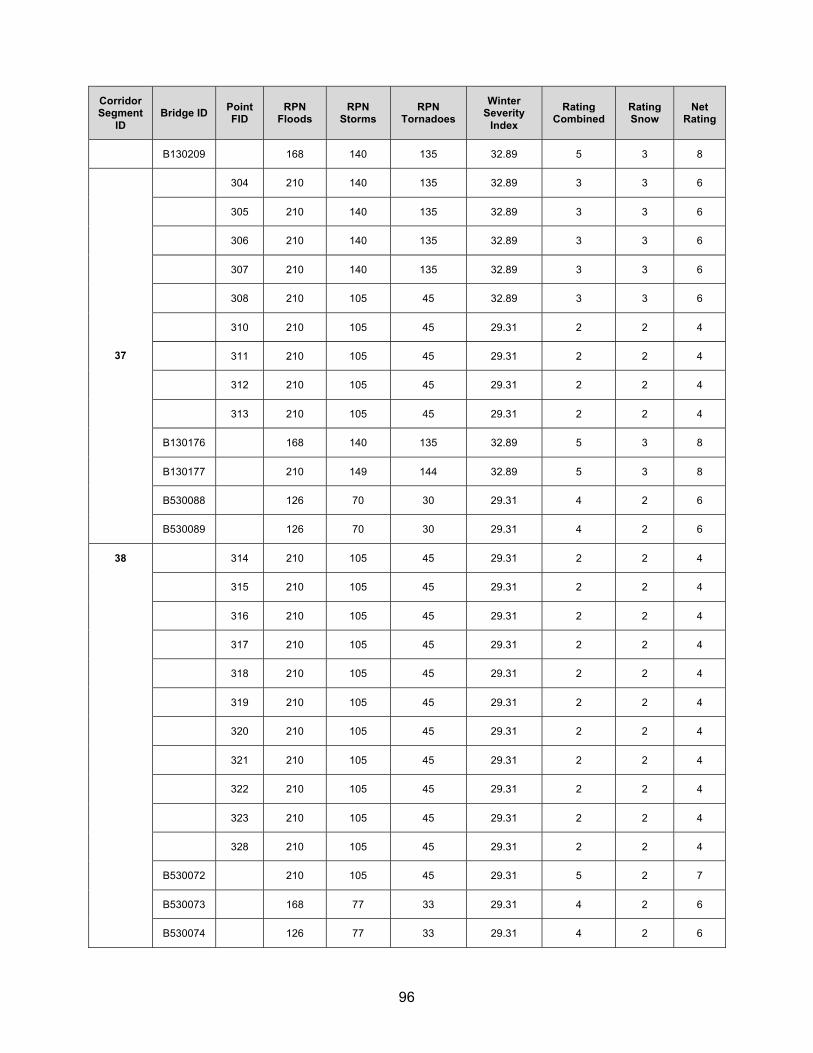
96
Corridor Segment
ID Bridge ID Point
FID RPN
Floods RPN
Storms RPN
Tornadoes Winter
Severity Index
Rating Combined
Rating Snow
Net Rating
B130209 168 140 135 32.89 5 3 8
304 210 140 135 32.89 3 3 6
305 210 140 135 32.89 3 3 6
306 210 140 135 32.89 3 3 6
307 210 140 135 32.89 3 3 6
308 210 105 45 32.89 3 3 6
310 210 105 45 29.31 2 2 4
311 210 105 45 29.31 2 2 4
312 210 105 45 29.31 2 2 4
313 210 105 45 29.31 2 2 4
B130176 168 140 135 32.89 5 3 8
B130177 210 149 144 32.89 5 3 8
B530088 126 70 30 29.31 4 2 6
37
B530089 126 70 30 29.31 4 2 6
314 210 105 45 29.31 2 2 4
315 210 105 45 29.31 2 2 4
316 210 105 45 29.31 2 2 4
317 210 105 45 29.31 2 2 4
318 210 105 45 29.31 2 2 4
319 210 105 45 29.31 2 2 4
320 210 105 45 29.31 2 2 4
321 210 105 45 29.31 2 2 4
322 210 105 45 29.31 2 2 4
323 210 105 45 29.31 2 2 4
328 210 105 45 29.31 2 2 4
B530072 210 105 45 29.31 5 2 7
B530073 168 77 33 29.31 4 2 6
38
B530074 126 77 33 29.31 4 2 6

97
Corridor Segment
ID Bridge ID Point
FID RPN
Floods RPN
Storms RPN
Tornadoes Winter
Severity Index
Rating Combined
Rating Snow
Net Rating
B530075 168 84 36 29.31 4 2 6
B530076 168 84 36 29.31 4 2 6
B530077 294 98 42 29.31 5 2 7
B530079 126 63 27 29.31 4 2 6
B530080 126 63 27 29.31 4 2 6
B530081 84 49 21 29.31 3 2 5
B530082 84 49 21 29.31 3 2 5
B530083 84 42 18 29.31 3 2 5
B530084 126 49 21 29.31 3 2 5
B530085 210 84 36 29.31 4 2 6
B530086 168 84 36 29.31 4 2 6
324 210 105 45 29.31 2 2 4
325 210 105 45 29.31 2 2 4
326 210 105 45 29.31 2 2 4
327 210 105 45 29.31 2 2 4
329 210 105 45 29.31 2 2 4
B530065 252 112 48 29.31 5 2 7
39
B530066 210 105 45 29.31 5 2 7
330 210 105 45 29.31 2 2 4
331 210 105 45 29.31 2 2 4
332 210 105 45 29.31 2 2 4
340 210 105 45 36.86 4 4 8
B530029 126 70 30 29.31 4 2 6
B530030 168 77 33 29.31 4 2 6
B530059 126 49 21 29.31 3 2 5
B530060 84 42 18 29.31 3 2 5
B530061 126 63 27 29.31 4 2 6
40
B530062 126 56 24 29.31 4 2 6

98
Corridor Segment
ID Bridge ID Point
FID RPN
Floods RPN
Storms RPN
Tornadoes Winter
Severity Index
Rating Combined
Rating Snow
Net Rating
B530063 84 42 18 29.31 3 2 5
B530064 84 42 18 29.31 3 2 5
B530214 84 42 18 29.31 3 2 5
B530215 42 28 12 29.31 1 2 3
333 210 105 45 29.31 2 2 4
341 210 105 45 29.31 2 2 4
B530229 84 42 18 29.31 3 2 5 41
B530230 42 28 12 29.31 1 2 3
334 210 105 45 29.31 2 2 4
335 210 105 45 29.31 2 2 4
336 210 105 45 29.31 2 2 4
337 210 105 45 29.31 2 2 4
338 210 105 45 29.31 2 2 4
339 210 105 45 29.31 2 2 4
342 210 105 45 29.31 2 2 4
343 210 105 45 29.31 2 2 4
344 210 105 45 29.31 2 2 4
345 210 105 45 29.31 2 2 4
346 210 105 45 29.31 2 2 4
B530036 84 49 21 29.31 3 2 5
B530037 126 63 27 29.31 4 2 6
B530039 84 42 18 29.31 3 2 5
B530040 84 49 21 29.31 3 2 5
B530042 126 56 24 29.31 4 2 6
B530043 84 42 18 29.31 3 2 5
42
B530056 168 84 36 29.31 4 2 6
347 210 105 45 29.31 2 2 4 43
348 210 105 45 29.31 2 2 4

99
Corridor Segment
ID Bridge ID Point
FID RPN
Floods RPN
Storms RPN
Tornadoes Winter
Severity Index
Rating Combined
Rating Snow
Net Rating
349 210 105 45 29.31 2 2 4
350 210 105 45 29.31 2 2 4
351 210 105 45 29.31 2 2 4
B530048 84 42 18 29.31 3 2 5
B530051 84 49 21 29.31 3 2 5
B530216 84 49 21 29.31 3 2 5
B530217 42 28 12 29.31 1 2 3


Wisconsin Department of TransportationResearch & Library Unit
4802 Sheboygan Avenue, Room 104P.O. Box 7915
Madison, WI 53707
CFIRENational Center for Freight & Infrastructure Research & Education
Wisconsin Transportation Center2205 Engineering Hall1415 Engineering Drive
Madison, WI 53706