Wisconsin Clinical Laboratory Science Workforce …Wisconsin Department of Health Services, Division...
56
Wisconsin Clinical Laboratory Science Workforce Survey, 2010
Transcript of Wisconsin Clinical Laboratory Science Workforce …Wisconsin Department of Health Services, Division...

Wisconsin Clinical Laboratory ScienceWorkforce Survey, 2010

Wisconsin Clinical Laboratory Science Workforce Survey, 2010
Population Health Information Section Division of Public Health Wisconsin Department of Health Services November 2010

ii Wisconsin Clinical Laboratory Science Workforce Survey, 2010
Foreword This report presents key statistical information about the Wisconsin clinical laboratory workforce. The source of data for the information in this report is the 2010 Wisconsin Clinical Laboratory Science Workforce Survey. The Department of Health Services conducted this survey for the public health workforce component of the Collaborative Response to a Growing Workforce Crisis grant program. This program is funded by the Healthier Wisconsin Partnership Program, “Advancing a Healthier Wisconsin” endowment at the Medical College of Wisconsin. The Division of Public Health would like to acknowledge and thank the personnel of all respondent laboratories in Wisconsin who completed the survey. Yiwu Zhang and Karl Pearson in the Population Health Information Section of the Division of Public Health (DPH) prepared this report, in consultation with Nancy McKenney, Director of Workforce Development and Public Health Workforce Project Coordinator. Barbara Saar, Senior Quality Assurance Program Specialist in the Division of Quality Assurance, wrote the Introduction and provided technical advice and edits. Patricia Nametz edited the report. The report was prepared under the supervision of Christine Hill, Chief, Population Health Information Section, and the overall direction of Patricia Guhleman, Director, Office of Policy and Practice Alignment. A copy of the survey instrument used to collect the data presented in this report is included in the Appendix. Copies of this report are available on the Department’s website at: http://www.dhs.wisconsin.gov/health/workforce/index.htm. Suggestions and comments may be addressed to:
Population Health Information Section Division of Public Health
Department of Health Services P.O. Box 2659
Madison, WI 53701-2659 Telephone: (608) 267-0334
E-mail: [email protected] or E-mail: [email protected]
Suggested Citation: Wisconsin Department of Health Services, Division of Public Health, Population Health Information Section. Wisconsin Clinical Laboratory Science Workforce Survey, 2010 (P-00233). November 2010.

Wisconsin Clinical Laboratory Science Workforce Survey, 2010 iii
Table of Contents Foreword.............................................................................................................................................................. ii Table of Content..........................................................................................................................................iii Introduction ....................................................................................................................................................... 1 Key Findings........................................................................................................................................................ 3 Statewide Information……….......................................................................................................................5 Table 1. CLIA-Certified Laboratories by Department of Health Services (DHS) Region………... .................5 Figure 1. CLIA-Certified Laboratories by Department of Health Services (DHS) Region………... .................5 Figure 2. CLIA-Certified Laboratories by Certificate Type ………….. ............................................................. 6 Table 2. CLIA-Certified Laboratories by Certificate Type ………….. ............................................................. 6 Table 3. Estimated Number of Laboratories by Staff Size………... .................................................................. 6 Table 4. Estimated Number of Laboratories by Percent of Employees Trained in Emergency Preparedness and Response, Statewide ............................................................................. 7 Table 5. Estimated Number of Laboratories with an Established Emergency Preparedness
and Response Plan, Statewide ………….. ........................................................................................... 7 Table 6. Estimated Number of Laboratory Employees by Age, Statewide ........................................................ 8 Figure 3. Laboratory Employees by Age, Statewide ........................................................................................... 8 Table 7. Estimated Number of Laboratory Employees by Race and Ethnicity, Statewide................................. 9 Figure 4. Laboratory Employees by Race and Ethnicity, Statewide.................................................................... 9 Table 8. Estimated Full-Time Equivalent (FTE) Laboratory Employees by Job Title,
for All Certificate Types, Statewide .................................................................................................. 10 Table 9. Estimated Full-Time Equivalent (FTE) Laboratory Employees by Job Title, for Certificate
of Waiver (COW) and Certificate of Provider Performed Microscopy (PPM) Laboratories, Statewide11 Table 10. Estimated Full-Time Equivalent (FTE) Laboratory Employees by Job Title, for
Certificate of Compliance (COC) and Certificate of Accreditation (COA) Laboratories, Statewide ................................................................................................................... 12
Table 11. Estimated Percent of Laboratories with Pathologists and Pathologist Vacancies,
by Certificate Type .......................................................................................................................... 13 Table 12. Estimated Percent of Laboratories with Pathology Assistants and Pathology Assistant Vacancies,
by Certificate Type ........................................................................................................................... 13 Table 13. Estimated Percent of Laboratories with Managers and Administrators and Manager and
Administrator Vacancies, by Certificate Type ................................................................................. 13

iv Wisconsin Clinical Laboratory Science Workforce Survey, 2010
Table 14. Estimated Percent of Laboratories with Certified Medical Technologists and Certified Medical Technologist Vacancies, by Certificate Type ………….. .................................................. 14
Table 15. Estimated Percent of Laboratories with Medical Technologists and Medical Technologist Vacancies, by Certificate Type ………….. ...................................................................................... 14 Table 16. Estimated Percent of Laboratories with Certified Medical Laboratory Technicians and Certified Medical Laboratory Technician Vacancies, by Certificate Type ...................................... 14 Table 17. Estimated Percent of Laboratories with Medical Laboratory Technicians and Medical Laboratory Technician Vacancies, by Certificate Type ................................................................... 15 Table 18. Estimated Percent of Laboratories with Phlebotomists and Phlebotomist Vacancies,
by Certificate Type .......................................................................................................................... 15 Table 19. Estimated Percent of Laboratories with Histotechnologists and Histotechnologist Vacancies,
by Certificate Type .......................................................................................................................... 15 Table 20. Estimated Percent of Laboratories with Histotechnicians and Histotechnician Vacancies,
by Certificate Type .......................................................................................................................... 16 Table 21. Estimated Percent of Laboratories with Cytologists and Cytologist Vacancies,
by Certificate Type .......................................................................................................................... 16 Table 22. Estimated Percent of Laboratories with Cytogenetic Technologists and Cytogenetic
Technologist Vacancies, by Certificate Type .................................................................................. 16 Table 23. Estimated Percent of Laboratories with Molecular Biologists and Molecular
Biologist Vacancies, by Certificate Type ......................................................................................... 17 Table 24. Estimated Percent of Laboratories with Registered Nurses and Registered Nurse Vacancies,
by Certificate Type .......................................................................................................................... 17 Table 25. Estimated Percent of Laboratories with Licensed Practical Nurses and Licensed Practical
Nurse Vacancies, by Certificate Type .............................................................................................. 17 Table 26. Estimated Percent of Laboratories with Certified Medical Assistants and Certified
Medical Assistant Vacancies, by Certificate Type ........................................................................... 18 Table 27. Estimated Percent of Laboratories with Certified Nursing Assistants and Certified Nursing
Assistant Vacancies, by Certificate Type ......................................................................................... 18 Table 28. Estimated Percent of Laboratories with “Other” Employees and “Other” Vacancies,
by Certificate Type .......................................................................................................................... 18 Information by Region ..................................................................................................................................... 19 Table 29. Employees of Respondent Laboratories by Age, Southern Region ................................................. 19 Figure 5. Employees of Respondent Laboratories by Age, Southern Region ................................................. 19 Table 30. Employees of Respondent Laboratories by Race and Ethnicity, Southern Region .......................... 20 Figure 6. Employees of Respondent Laboratories by Race and Ethnicity, Southern Region .......................... 20

Wisconsin Clinical Laboratory Science Workforce Survey, 2010 v
Table 31. Estimated Full-Time Equivalent (FTE) Laboratory Employees by Job Title, Southern Region................................................................................................................................ 21
Table 32. Respondent Laboratories by Percent of Employees Trained in Emergency Preparedness
and Response, Southern Region........................................................................................................ 22 Table 33. Respondent Laboratories with an Established Emergency Preparedness and Response Plan,
Southern Region .............................................................................................................................. 22 Table 34. Employees of Respondent Laboratories by Age, Southeastern Region ........................................... 23 Figure 7. Employees of Respondent Laboratories by Age, Southeastern Region .......................................... 23 Table 35. Employees of Respondent Laboratories by Race and Ethnicity,
Southeastern Region ........................................................................................................................ 24 Figure 8. Employees of Respondent Laboratories by Race and Ethnicity,
Southeastern Region ........................................................................................................................ 24 Table 36. Estimated Full-Time Equivalent (FTE) Laboratory Employees by Job Title,
Southeastern Region ......................................................................................................................... 25 Table 37. Respondent Laboratories by Percent of Employees Trained in Emergency Preparedness
and Response, Southeastern Region ................................................................................................. 26 Table 38. Respondent Laboratories with an Established Emergency Preparedness and Response Plan,
Southeastern Region ....................................................................................................................... 26 Table 39. Employees of Respondent Laboratories by Age, Northeastern Region ............................................ 27 Figure 9. Employees of Respondent Laboratories by Age, Northeastern Region ............................................ 27 Table 40. Employees of Respondent Laboratories by Race and Ethnicity, Northeastern Region .................... 28 Figure 10. Employees of Respondent Laboratories by Race and Ethnicity, Northeastern Region .................... 28 Table 41. Estimated Full-Time Equivalent (FTE) Laboratory Employees by Job Title,
Northeastern Region .......................................................................................................................... 29 Table 42. Respondent Laboratories by Percent of Employees Trained in Emergency Preparedness
and Response, Northeastern Region ................................................................................................. 30 Table 43. Respondent Laboratories with an Established Emergency Preparedness and Response Plan,
Northeastern Region ....................................................................................................................... 30 Table 44. Employees of Respondent Laboratories by Age, Western Region .................................................. 31 Figure 11. Employees of Respondent Laboratories by Age, Western Region .................................................. 31 Table 45. Employees of Respondent Laboratories by Race and Ethnicity, Western Region .......................... 32 Figure 12. Employees of Respondent Laboratories by Race and Ethnicity, Western Region .......................... 32

vi Wisconsin Clinical Laboratory Science Workforce Survey, 2010
Table 46. Estimated Full-Time Equivalent (FTE) Laboratory Employees by Job Title, Western Region................................................................................................................................. 33
Table 47. Respondent Laboratories by Percent of Employees Trained In Emergency Preparedness
and Response, Western Region ..................................................................................................... 34 Table 48. Respondent Laboratories with an Established Emergency Preparedness and Response Plan,
Western Region ............................................................................................................................... 34 Table 49. Employees of Respondent Laboratories by Age, Northern Region ................................................. 35 Figure 13. Employees of Respondent Laboratories by Age, Northern Region ................................................ 35 Table 50. Employees of Respondent Laboratories by Race and Ethnicity, Northern Region ......................... 36 Figure 14. Employees of Respondent Laboratories by Race and Ethnicity, Northern Region ......................... 36 Table 51. Estimated Full-Time Equivalent (FTE) Laboratory Employees by Job Title,
Northern Region................................................................................................................................ 37 Table 52. Respondent Laboratories by Percent of Employees Trained in Emergency Preparedness
and Response, Northern Region........................................................................................................ 38 Table 53. Respondent Laboratories with an Established Emergency Preparedness and Response Plan,
Northern Region .............................................................................................................................. 38 Appendix A. Technical Notes .......................................................................................................................... 39 Table A1. Response Rate by Wisconsin Department of Health Services (DHS) Region.................................. 42 Table A2. Response Rate by Certificate Type................................................................................................... 42 Table A3. Response Rate by Certificate Type and by Wisconsin Department of Health
Services (DHS) Region..................................................................................................................... 43 Table A4. Wisconsin Population Estimates by Race and Ethnicity, Wisconsin Department
of Health Services (DHS) Regions, 2008 ....................................................................................... 44 Appendix B. Survey Instrument: Wisconsin Clinical Laboratory Science Workforce Survey, 2010 .............. 45 Appendix C. Clinical Laboratory Science Education Programs in Wisconsin................................................. 47

Wisconsin Clinical Laboratory Science Workforce Survey, 2010 1
Introduction
This report presents the complete results of a survey of the clinical laboratory workforce in Wisconsin that was conducted in March and April, 2010. An earlier “At a Glance” publication gave preliminary results and is available at: http://www.dhs.wisconsin.gov/hw2020/infrastructure/workforce/clinicallabs.pdf
Laboratory science professionals are among the health disciplines that constitute the public health workforce. As demonstrated by the recent Novel Influenza A (H1N1) outbreak, laboratory science professionals address public health challenges. These professionals conduct testing to report results for certain infectious diseases (e.g. HIV, Influenza, and Lyme disease), emerging communicable diseases, and chronic diseases. Additionally, the results of the tests performed by laboratory science professionals are used to monitor individual health and wellness. Due to a growing concern to develop a diverse, sufficient and competent health workforce to protect and promote the health of the public, the Division of Public Health (DPH) and the Division of Quality Assurance (DQA), both in the Wisconsin Department of Health Services, conducted this survey of primarily non-governmental clinical laboratories throughout Wisconsin. Clinical laboratories in Wisconsin operate under the federal regulations known as the Clinical Laboratory Improvement Amendments (CLIA). (Wisconsin has no additional state regulations for clinical laboratories.) These federal regulations define a laboratory as a “facility for the biological, microbiological, serological, chemical, immunohematological, hematological, biophysical, cytological, pathological or other examination of materials derived from the human body for the purpose of providing information for the diagnosis, prevention, or treatment of a disease or impairment of, or the assessment of the health of, human beings.” Facilities performing testing under this definition are required to maintain CLIA certification with the federal Centers for Medicare and Medicaid Services (CMS). There are four types of CLIA certification:
• Certificate of Waiver, • Provider Performed Microscopy, • Compliance, and • Accreditation.
The type of CLIA certification a laboratory holds is based on several factors, including the complexity of testing performed, qualification of test personnel, and inspection/survey agency. Laboratories with a Certificate of Compliance or Accreditation are inspected every two years.
There were 3,374 CLIA-certified (Clinical Laboratory Improvement Amendments certification) laboratories in Wisconsin as of September 2, 2009. CLIA certification ranges from Certificate of Waiver (can perform only relatively simple tests) to Certificate of Compliance and Certificate of Accreditation (can perform tests of high complexity). A sample of 746 laboratories, stratified by CLIA type and DHS region, was drawn from the full list of laboratories. There was a 43% response rate, with 319 laboratories completing the survey. Results were weighted to represent all clinical laboratories in Wisconsin. Additional information about survey design and results is included in Appendix A, Technical Notes, at the end of this report.

2 Wisconsin Clinical Laboratory Science Workforce Survey, 2010
Who makes up Wisconsin’s clinical laboratory workforce? The clinical laboratory workforce includes professionals with clinical laboratory training and experience such as Pathologists, Medical Technologists, Histotechnologists, and Cytologists. Characteristics of this part of the laboratory workforce include college degrees and/or board certifications with an association specific to their discipline. The workforce also includes staff such as Registered Nurses, Certified Medical Assistants and Certified Nursing Assistants. This staff primarily performs waived testing, but with the appropriate training can also perform testing of moderate complexity. The survey results showed a significant part of the workforce listed as “Other,” with no information about their clinical laboratory training and/or experience. The survey instrument was not designed to collect more information about staff in this category. What are the laboratory workforce challenges in Wisconsin?
The first challenge Wisconsin faces is to assure a laboratory workforce that is sufficient, competent and diverse to provide all types of clinical laboratory testing. Whether the testing is simple waived methods or highly complex testing, which includes emerging technologies, the laboratory workforce will require initial and ongoing education and training. A large majority of laboratories in Wisconsin hold a CLIA Certificate of Waiver. Laboratories with this certificate do not have routine oversight and there are no personnel requirements. Since 1992, when the current CLIA regulations were implemented, the number of tests allowed to be performed by Certificate of Waiver laboratories has increased from 9 to approximately 80 different tests. Screening tests such as the rapid influenza tests used in the recent H1N1 outbreak are an example of tests performed under a Certificate of Waiver. In 2002, CMS authorized all states to conduct on-site surveys in a small percentage of laboratories with Certificates of Waiver. An initial CMS report of its 2002-2003 survey findings supported CMS’s earlier concerns about the quality of testing practices and the need for education and training of testing personnel in Certificate of Waiver laboratories. This CMS report is available at: http://www.cdc.gov/mmwr/PDF/rr/rr5413.pdf A second challenge is to assure that the workforce has the education and training needed to perform highly complex methods such as those used to confirm H1N1 during the recent outbreak. In contrast to the Certificate of Waiver laboratories, only three laboratories in Wisconsin were authorized by the Centers for Disease Control and Prevention (CDC) to perform this confirmation testing during the recent outbreak. Methods used for confirmation testing included emerging technologies such as molecular biology-based assays, which can only be performed by personnel with highly specialized clinical laboratory training and experience. As new methods are continually being developed in response to new disease outbreaks, threats, and/or identification of new genetic markers for disease prediction, the potential exists for continued growth in demand for staff with this level of expertise. A third challenge is to assure that all Wisconsin laboratories have emergency preparedness and response plans and workforce training in place to support their vital role in promoting and protecting the health of the public.

Wisconsin Clinical Laboratory Science Workforce Survey, 2010 3
Selected Findings
• According to the Wisconsin Division of Quality Assurance, nearly two-thirds (64%) of all Wisconsin CLIA-certified laboratories have a Certificate of Waiver, meaning they can perform only relatively simple tests.
• According to the Division of Quality Assurance, only 23 percent of CLIA-certified laboratories in
Wisconsin are routinely inspected or surveyed; these are laboratories with a Certificate of Compliance or Accreditation.
• In 2010, most laboratories in Wisconsin (91 percent) had 50 or fewer full-time equivalent employees.
• An estimated 29 percent of laboratories reported that all their employees were trained in emergency
preparedness and response. Another 29 percent reported that none of their employees were trained in emergency preparedness and response.
• An estimated 64 percent of laboratories statewide had an established emergency preparedness and
response plan.
• In 2010, clinical laboratories in Wisconsin had an estimated 51,337 total employees.
• Eighty percent of laboratory employees statewide were female.
• Statewide, 24 percent of laboratory employees were under age 30, 19 percent were between 30 and 39, 21 percent were between 40 and 49, 26 percent were between 50 and 59, and 10 percent were 60 years of age and older.
• In 2010, 89 percent of laboratory employees in Wisconsin were reported to be White; 5 percent Black
or African American, 1 percent American Indian/Alaska Native, 1 percent Asian, and 2 percent other races. Three percent of employees were reported to be Hispanic/Latino. Each employee was counted only once in these groupings; therefore the race groups exclude Hispanics.
• Statewide, 49 percent of laboratory workers had a job title reflecting clinical laboratory professional
education and training.
• In 2010, estimated FTE vacancies in laboratories statewide are: o Staff with clinical laboratory professional education and training: 756 o Other professional staff who perform laboratory testing: 516 o “Other staff”: 454
• Fifteen percent of the employees of Certificate of Waiver and Provider Performed Microscopy
certified laboratories had a job title reflecting clinical laboratory professional education and training.
• Seventy-nine percent of the employees of Certificate of Compliance and Certificate of Accreditation certified laboratories had a job title reflecting clinical laboratory professional education and training.


Distribution of Laboratories by Region
Wisconsin Clinical Laboratory Science Workforce Survey, 2010 5
Table 1. CLIA-Certified Laboratories by Department of Health Services (DHS) Region Region Number of Laboratories Percent Southern Region 582 17% Southeastern Region 1,353 40 Northeastern Region 744 22 Western Region 381 11 Northern Region 314 9 Total 3,374 100%
Source: Wisconsin Division of Quality Assurance, Department of Health Services.
Figure 1. CLIA-Certified Laboratories by Department of Health Services (DHS) Region

Distribution of Laboratories by Region
6 Wisconsin Clinical Laboratory Science Workforce Survey, 2010
• According to the Wisconsin Division of Quality Assurance, nearly two-thirds (64%) of all Wisconsin
CLIA-certified laboratories have a Certificate of Waiver. Testing performed under this type of certificate is limited to methods which are determined by the U.S. Food and Drug Administration to be “so simple and accurate as to render the likelihood of erroneous results negligible or pose no reasonable risk of harm to the patient if the test is performed incorrectly” (Code of Federal Register CFR § 493.15 (a)). (For the details of CLIA certificate types, visit http://www.cms.gov/clia/.)
• According to the Division of Quality Assurance, only 23 percent of CLIA-certified laboratories are
routinely inspected or surveyed; these are laboratories with a Certificate of Compliance or Accreditation.
Figure 2. CLIA-Certified Laboratories by Certificate Type
Certificate of Compliance
12%(412)
Certificate of Provider
Performed Microscopy
13%(444)
Certificate of Accreditation
11%(364)
Certificate of Waiver
64%(2,154)
Source: Wisconsin Division of Quality Assurance, Department of Health Services.
Table 2. CLIA-Certified Laboratories by Certificate Type
CLIA Type Number of
Laboratories Percent Certificate of Waiver 2,154 64%Certificate of Provider Performed Microscopy 444 13 Certificate of Compliance 412 12 Certificate of Accreditation 364 11 Total 3,374 100%Source: Wisconsin Division of Quality Assurance, Department of Health Services.
Table 3. Estimated Number of Laboratories by Staff Size Full-Time-Equivalent Employees (FTEs) Number of Laboratories Percent 50 or fewer 3,078 91%51 - 100 159 5 101 - 200 106 3 201 or more 32 1 Total 3,374 100%
Source: Wisconsin Clinical Laboratory Science Workforce Survey, 2010, Department of Health Services.
Note: Estimates are based on results from 319 responding laboratories; see Technical Notes.

Emergency Preparedness and Response
Wisconsin Clinical Laboratory Science Workforce Survey, 2010 7
Table 4. Estimated Number of Laboratories by Percent of Employees Trained in Emergency Preparedness and Response, Statewide
Percent of Employees Trained Number of
Laboratories Percent No employee had training 973 29% 1% - 50% of employees had training 740 22 51%-99% of employees had training 286 8 100% of employees had training 984 29 No response to this question 391 12 Total number of laboratories 3,374 100% Source: Wisconsin Clinical Laboratory Science Workforce Survey, 2010, Department of Health Services. Note: Estimates are based on results from 282 responding laboratories; see Technical Notes.
Table 5. Estimated Number of Laboratories with an Established Emergency Preparedness
and Response Plan, Statewide
Established Plan? Number of Laboratories Percent Yes 2,147 64% No 910 27 No response to this question 317 9 Total number of laboratories 3,374 100% Source: Wisconsin Clinical Laboratory Science Workforce Survey, 2010, Department of Health Services.
Note: Estimates are based on results from 289 responding laboratories; see Technical Notes.
• An estimated 29 percent of laboratories reported that all their employees were trained in emergency preparedness and response.
• Another estimated 29 percent of laboratories reported that none of their employees were trained
in emergency preparedness and response.
• An estimated 64 percent of laboratories had an established emergency preparedness and response plan.

Laboratory Employees, Statewide
8 Wisconsin Clinical Laboratory Science Workforce Survey, 2010
Table 6. Estimated Number of Laboratory Employees by Age and Gender, Statewide
Total Male Female Age Count Percent Count Percent Count Percent Under 25 6,349 12% 1,169 11% 5,180 13% 25-29 5,993 12 1,187 12 4,806 12 30-39 9,768 19 2,090 20 7,679 19 40-49 11,031 21 2,126 21 8,905 22 50-54 6,953 14 1,157 11 5,796 14 55-59 5,926 12 1,127 11 4,800 12 60+ 5,316 10 1,441 14 3,876 9 Total 51,337 100% 10,296 100% 41,041 100%
Source: Wisconsin Clinical Laboratory Science Workforce Survey, 2010, Department of Health Services.
Note: Percentages may not add to 100 percent due to rounding. Estimates are based on the age and sex distribution of the 8,501 employees for whom age and gender were reported in the 319 laboratories that completed the survey; see Technical Notes.
Figure 3. Laboratory Employees by Age, Statewide
10%
24%
19% 21%
26%
0
10
20
30
40
Under 29 30-39 40-49 50-59 60+
Age Group
Perc
ent b
y A
ge
Source: Wisconsin Clinical Laboratory Science Workforce Survey, 2010, Department of Health Services.
• In 2010, clinical laboratories in Wisconsin had an estimated 51,337 total employees.
• Eighty percent of laboratory employees statewide were female. • Statewide, 24 percent of laboratory employees were under age 30, 19 percent were between 30 and
39, 21 percent were between 40 and 49, 26 percent were between 50 and 59, and 10 percent were 60 years of age and older.

Laboratory Employees, Statewide
Wisconsin Clinical Laboratory Science Workforce Survey, 2010 9
• In 2010, 89 percent of laboratory employees in Wisconsin were reported to be White; 5 percent
Black or African American, 1 percent American Indian/Alaska Native, 1 percent Asian, and 2 percent other races. Three percent of employees were reported to be Hispanic/Latino. Each employee was counted only once in these groupings; therefore the race groups exclude Hispanics.
Table 7. Estimated Number of Laboratory Employees by Race and Ethnicity, Statewide
Race: Number Percent White 45,430 89% Black/African American 2,546 5 American Indian/Alaska Native 312 1 Native Hawaiian /Other Pacific Islander 132 0 Asian 689 1 Other 557 1 Ethnicity: Hispanic/Latino 1,671 3% Total 51,337 100%
Source: Wisconsin Clinical Laboratory Science Workforce Survey, 2010, Department of Health Services. Note: Race and ethnicity groups are mutually exclusive.
Estimates are based on the race and ethnicity distribution of the 8,571 employees for whom race and ethnicity were reported in the 319 laboratories that completed the survey; see Technical Notes.
Figure 4. Laboratory Employees by Race and Ethnicity, Statewide
Other2%
Asian 1%
Hispanic3%
African American
5%
White89%
Source: Wisconsin Clinical Laboratory Science Workforce Survey, 2010, Department of Health Services.

Laboratory Employees, Statewide
10 Wisconsin Clinical Laboratory Science Workforce Survey, 2010
Table 8. Estimated Full-Time Equivalent (FTE) Laboratory Employees by Job Title, All Certificate Types, Statewide
Job Title/Discipline Estimated FTEs
Statewide Estimated FTE
Vacancies, Statewide Staff with clinical laboratory professional education and training Pathologists 737 8 Pathology Assistants 76 0 Managers/Administrators* 2,917 38 Certified Medical Technologists – MT(ASCP), CLS(NCA), etc. 7,826 130 Medical Technologists (non-certified) 3,066 0 Certified Medical Laboratory Technicians – MLT(ASCP), CLT(NCA), etc. 2,981 277 Medical Laboratory Technicians (non-certified) 694 9 Phlebotomists 5,210 258 Histotechnologists (Bachelor of Science degree, B.S.) 303 0 Histotechnician 570 36 Cytologists 428 0 Cytogenetic Technologists 246 0 Molecular Biologists 47 0 Other professionals who perform laboratory testing Registered Nurses 4,571 108 Licensed Practical Nurses 2,986 100 CMA/MA 1,061 28 CNA/NA 8,198 280 Other 9,420 454 Total 51,337 1,726
Source: Wisconsin Clinical Laboratory Science Workforce Survey, 2010, Department of Health Services. Note: Estimated statewide numbers of FTE laboratory employees by job title were based on FTEs reported by the
respondent laboratories, and calculated using a multiplier of 9.5. These estimates assume that all Wisconsin laboratories have a distribution of employees by discipline similar to that of the 319 respondent laboratories that completed the survey. Formula used to calculate the multiplier: 319/3,374 x 100 = 9.5.
* This category assumes that laboratory managers have received clinical laboratory professional education and
training. • Statewide, 49 percent of laboratory workers had a job title reflecting clinical laboratory
professional education and training. • In 2010, estimated FTE vacancies in laboratories statewide are:
o Staff with clinical laboratory professional education and training: 756 o Other professional staff who perform laboratory testing: 516 o “Other” staff: 454

Laboratory Employees, Statewide
Wisconsin Clinical Laboratory Science Workforce Survey, 2010 11
Table 9. Estimated Full-Time Equivalent (FTE) Laboratory Employees by Job Title,
Certificate of Waiver (COW) and Certificate of Provider Performed Microscopy (PPM) Laboratories, Statewide
Job Title/Discipline Estimated FTEs
Statewide Estimated FTE
Vacancies, Statewide Staff with clinical laboratory professional education and training Pathologists 9 0 Pathology Assistants 0 0 Managers/Administrators* 1,034 19 Certified Medical Technologists – MT(ASCP), CLS(NCA), etc. 47 0 Medical Technologists (non-certified) 2,657 0 Certified Medical Laboratory Technicians – MLT(ASCP), CLT(NCA), etc. 28 9 Medical Laboratory Technicians (non-certified) 19 0 Phlebotomists 76 0 Histotechnologists (Bachelor of Science degree, B.S.) 0 0 Histotechnician 0 0 Cytologists 0 0 Cytogenetic Technologists 0 0 Molecular Biologists 0 0 Other professionals who perform laboratory testing Registered Nurses 4,231 108 Licensed Practical Nurses 2,834 100 CMA/MA 527 9 CNA/NA 7,773 251 Other 5,297 34 Total 24,532 530
Source: Wisconsin Clinical Laboratory Science Workforce Survey, 2010, Department of Health Services. Note: Estimated statewide numbers of FTE laboratory employees by job title were based on FTEs reported by the
respondent laboratories, and calculated using a multiplier of 9.5. These estimates assume that all Wisconsin laboratories have a distribution of employees by discipline similar to that of the 319 respondent laboratories that completed the survey. Formula used to calculate the multiplier: 319/3,374 x 100 = 9.5.
* This category assumes that laboratory managers have received clinical laboratory professional education and
training.
• Fifteen percent of the employees of COW and PPM certified laboratories had a job title reflecting clinical laboratory professional education and training. COW laboratories can only perform waived tests. PPM laboratories, in addition to waived tests, may also perform certain microscopic examinations during the course of a patient visit using specimens that are not easily transportable.

Laboratory Employees, Statewide
12 Wisconsin Clinical Laboratory Science Workforce Survey, 2010
Table 10. Estimated Full-Time Equivalent (FTE) Laboratory Employees by Job Title,
Certificate of Compliance (COC) and Certificate of Accreditation (COA) Laboratories, Statewide
Job Title/Discipline Estimated FTEs
Statewide Estimated FTE
Vacancies, Statewide Staff with clinical laboratory professional education and training Pathologists 727 8 Pathology Assistants 76 0 Managers/Administrators* 1,882 19 Certified Medical Technologists – MT(ASCP), CLS(NCA), etc. 7,778 130 Medical Technologists (non-certified) 409 0 Certified Medical Laboratory Technicians – MLT(ASCP), CLT(NCA), etc. 2,953 268 Medical Laboratory Technicians (non-certified) 675 9 Phlebotomists 5,133 258 Histotechnologists (Bachelor of Science degree, B.S.) 303 0 Histotechnician 570 36 Cytologists 428 0 Cytogenetic Technologists 246 0 Molecular Biologists 47 0 Other professionals who perform laboratory testing Registered Nurses 340 0 Licensed Practical Nurses 152 0 CMA/MA 535 19 CNA/NA 425 28 Other 4,123 420 Total 26,802 1,195
Source: Wisconsin Clinical Laboratory Science Workforce Survey, 2010, Department of Health Services. Note: Estimated statewide numbers of FTE laboratory employees by job title were based on FTEs reported by the
respondent laboratories, and calculated using a multiplier of 9.5. These estimates assume that all Wisconsin laboratories have a distribution of employees by discipline similar to that of the 319 respondent laboratories that completed the survey. Formula used to calculate the multiplier: 319/3,374 x 100 = 9.5.
* This category assumes that laboratory managers have received clinical laboratory professional education and
training.
• Seventy-nine percent of the employees of COC and COA certified laboratories had a job title reflecting clinical laboratory professional education and training. COC and COA certified laboratories may perform tests of high complexity.

Laboratory Employees and Vacancies by Certificate Type
Wisconsin Clinical Laboratory Science Workforce Survey, 2010 13
To examine the types of employee and vacancies by certificate type, the four CLIA laboratory types have been combined into two groups: Certificate of Compliance and Certificate of Accreditation; and Certificate of Waiver and Certificate of Provider Performed Microscopy.
Table 11. Estimated Percent of Laboratories with Pathologists and Pathologist Vacancies, by Certificate Type
Laboratory Type Number of
Laboratories
Percent with this Employee
Type
(C.I. ±) Percent
Percent with Vacancies in this Employee Type
(C.I. ±) Percent
Compliance and Accreditation 776 19.7% 5.7% 0.5% 0.9% Waiver and Provider Performed Microscopy 2,598 0.6 1.1 -- --
Total 3,374 5.0% 1.7% 0.1% 0.2% Source: Wisconsin Clinical Laboratory Science Workforce Survey, 2010, Department of Health Services. Table 12. Estimated Percent of Laboratories with Pathology Assistants and Pathology Assistant
Vacancies, by Certificate Type
Laboratory Type Number of
Laboratories
Percent with this Employee
Type
(C.I. ±) Percent
Percent with Vacancies in this Employee Type
(C.I. ±) Percent
Compliance and Accreditation 776 3.2% 2.6% -- -- Waiver and Provider Performed Microscopy 2,598 -- -- -- --
Total 3,374 0.7% 0.6% -- -- Source: Wisconsin Clinical Laboratory Science Workforce Survey, 2010, Department of Health Services.
Table 13. Estimated Percent of Laboratories with Managers and Administrators and Manager and
Administrator Vacancies, by Certificate Type
Laboratory Type Number of
Laboratories
Percent with this Employee
Type
(C.I. ±) Percent
Percent with Vacancies in this Employee Type
(C.I. ±) Percent
Compliance and Accreditation 776 44.4% 7.3% 0.9% 1.3% Waiver and Provider Performed Microscopy 2,598 33.4 8.5 1.7 2.4
Total 3,374 35.9% 6.7% 1.5% 1.8% Source: Wisconsin Clinical Laboratory Science Workforce Survey, 2010, Department of Health Services.

Laboratory Employees and Vacancies by Certificate Type
14 Wisconsin Clinical Laboratory Science Workforce Survey, 2010
Table 14. Estimated Percent of Laboratories with Certified Medical Technologists and Certified
Medical Technologist Vacancies, by Certificate Type
Laboratory Type Number of
Laboratories
Percent with this Employee
Type
(C.I. ±) Percent
Percent with Vacancies in this Employee Type
(C.I. ±) Percent
Compliance and Accreditation 776 55.1% 7.4% 4.9% 3.2% Waiver and Provider Performed Microscopy 2,598 2.6 2.6 -- --
Total 3,374 14.7% 3.4% 1.1% 0.8% Source: Wisconsin Clinical Laboratory Science Workforce Survey, 2010, Department of Health Services.
Table 15. Estimated Percent of Laboratories with Medical Technologists and Medical Technologist
Vacancies, by Certificate Type
Laboratory Type Number of
Laboratories
Percent with this Employee
Type
(C.I. ±) Percent
Percent with Vacancies in this Employee Type
(C.I. ±) Percent
Compliance and Accreditation 776 4.3% 3.0% -- -- Waiver and Provider Performed Microscopy 2,598 0.5 1.0 -- --
Total 3,374 1.4% 1.0% -- -- Source: Wisconsin Clinical Laboratory Science Workforce Survey, 2010, Department of Health Services. Table 16. Estimated Percent of Laboratories with Certified Medical Laboratory Technicians and
Certified Medical Laboratory Technician Vacancies, by Certificate Type
Laboratory Type Number of
Laboratories
Percent with this Employee
Type
(C.I. ±) Percent
Percent with Vacancies in this Employee Type
(C.I. ±) Percent
Compliance and Accreditation 776 54.6% 7.4% 4.2% 2.9% Waiver and Provider Performed Microscopy 2,598 0.6 1.1 0.8 1.5
Total 3,374 13.0% 2.9% 1.6% 1.4% Source: Wisconsin Clinical Laboratory Science Workforce Survey, 2010, Department of Health Services.

Laboratory Employees and Vacancies by Certificate Type
Wisconsin Clinical Laboratory Science Workforce Survey, 2010 15
Table 17. Estimated Percent of Laboratories with Medical Laboratory Technicians and Medical
Laboratory Technician Vacancies, by Certificate Type
Laboratory Type Number of
Laboratories
Percent with this Employee
Type
(C.I. ±) Percent
Percent with Vacancies in this Employee Type
(C.I. ±) Percent
Compliance and Accreditation 776 10.9% 4.5% 0.5% 1.0% Waiver and Provider Performed Microscopy 2,598 1.5 2.1 -- --
Total 3,374 3.6% 2.0% 0.1% 0.2% Source: Wisconsin Clinical Laboratory Science Workforce Survey, 2010, Department of Health Services. Table 18. Estimated Percent of Laboratories with Phlebotomists and Phlebotomist Vacancies, by
Certificate Type
Laboratory Type Number of
Laboratories
Percent with this Employee
Type
(C.I. ±) Percent
Percent with Vacancies in this Employee Type
(C.I. ±) Percent
Compliance and Accreditation 776 43.2% 7.3% 6.4% 3.7% Waiver and Provider Performed Microscopy 2,598 3.9 3.4 -- --
Total 3,374 13.0% 3.5% 1.5% 0.9% Source: Wisconsin Clinical Laboratory Science Workforce Survey, 2010, Department of Health Services. Table 19. Estimated Percent of Laboratories with Histotechnologists and Histotechnologist
Vacancies, by Certificate Type
Laboratory Type Number of
Laboratories
Percent with this Employee
Type
(C.I. ±) Percent
Percent with Vacancies in this Employee Type
(C.I. ±) Percent
Compliance and Accreditation 776 5.2% 3.4% -- -- Waiver and Provider Performed Microscopy 2,598 -- -- -- --
Total 3,374 1.2% 0.8% -- -- Source: Wisconsin Clinical Laboratory Science Workforce Survey, 2010, Department of Health Services.

Laboratory Employees and Vacancies by Certificate Type
16 Wisconsin Clinical Laboratory Science Workforce Survey, 2010
Table 20. Estimated Percent of Laboratories with Histotechnicians and Histotechnician Vacancies,
by Certificate Type
Laboratory Type Number of
Laboratories
Percent with this Employee
Type
(C.I. ±) Percent
Percent with Vacancies in this Employee Type
(C.I. ±) Percent
Compliance and Accreditation 776 7.8% 3.9% 1.9% 2.1% Waiver and Provider Performed Microscopy 2,598 -- -- -- --
Total 3,374 1.8% 0.9% 0.4% 0.5% Source: Wisconsin Clinical Laboratory Science Workforce Survey, 2010, Department of Health Services. Table 21. Estimated Percent of Laboratories with Cytologists and Cytologist Vacancies,
by Certificate Type
Laboratory Type Number of
Laboratories
Percent with this Employee
Type
(C.I. ±) Percent
Percent with Vacancies in this Employee Type
(C.I. ±) Percent
Compliance and Accreditation 776 5.7% 3.4% -- -- Waiver and Provider Performed Microscopy 2,598 -- -- -- --
Total 3,374 1.3% 0.8% -- -- Source: Wisconsin Clinical Laboratory Science Workforce Survey, 2010, Department of Health Services. Table 22. Estimated Percent of Laboratories with Cytogenetic Technologists and Cytogenetic
Technologist Vacancies, by Certificate Type
Laboratory Type Number of
Laboratories
Percent with this Employee
Type
(C.I. ±) Percent
Percent with Vacancies in this Employee Type
(C.I. ±) Percent
Compliance and Accreditation 776 1.6% 1.8% -- -- Waiver and Provider Performed Microscopy 2,598 -- -- -- --
Total 3,374 0.4% 0.4% -- -- Source: Wisconsin Clinical Laboratory Science Workforce Survey, 2010, Department of Health Services.

Laboratory Employees and Vacancies by Certificate Type
Wisconsin Clinical Laboratory Science Workforce Survey, 2010 17
Table 23. Estimated Percent of Laboratories with Molecular Biologists and Molecular Biologist
Vacancies, by Certificate Type
Laboratory Type Number of
Laboratories
Percent with this Employee
Type
(C.I. ±) Percent
Percent with Vacancies in this Employee Type
(C.I. ±) Percent
Compliance and Accreditation 776 1.4% 1.9% -- -- Waiver and Provider Performed Microscopy 2,598 -- -- -- --
Total 3,374 0.3% 0.4% -- -- Source: Wisconsin Clinical Laboratory Science Workforce Survey, 2010, Department of Health Services. Table 24. Estimated Percent of Laboratories with Registered Nurses and Registered Nurse
Vacancies, by Certificate Type
Laboratory Type Number of
Laboratories
Percent with this Employee
Type
(C.I. ±) Percent
Percent with Vacancies in this Employee Type
(C.I. ±) Percent
Compliance and Accreditation 776 7.9% 4.1% -- -- Waiver and Provider Performed Microscopy 2,598 50.6 8.8 6.6% 4.3%
Total 3,374 40.8% 7.1% 5.1% 3.3% Source: Wisconsin Clinical Laboratory Science Workforce Survey, 2010, Department of Health Services. Table 25. Estimated Percent of Laboratories with Licensed Practical Nurses and Licensed
Practical Nurse Vacancies, by Certificate Type
Laboratory Type Number of
Laboratories
Percent with this Employee
Type
(C.I. ±) Percent
Percent with Vacancies in this Employee Type
(C.I. ±) Percent
Compliance and Accreditation 776 4.5% 3.1% -- -- Waiver and Provider Performed Microscopy 2,598 30.9 8.1 6.2% 4.3%
Total 3,374 24.8% 6.4% 4.8% 3.4% Source: Wisconsin Clinical Laboratory Science Workforce Survey, 2010, Department of Health Services.

Laboratory Employees and Vacancies by Certificate Type
18 Wisconsin Clinical Laboratory Science Workforce Survey, 2010
Table 26. Estimated Percent of Laboratories with Certified Medical Assistants and Certified
Medical Assistant Vacancies, by Certificate Type
Laboratory Type Number of
Laboratories
Percent with this Employee
Type
(C.I. ±) Percent
Percent with Vacancies in this Employee Type
(C.I. ±) Percent
Compliance and Accreditation 776 18.7% 5.8% 0.4% 0.8% Waiver and Provider Performed Microscopy 2,598 14.7 7.0 0.5 1.0
Total 3,374 15.6% 5.6% 0.5% 0.8% Source: Wisconsin Clinical Laboratory Science Workforce Survey, 2010, Department of Health Services. Table 27. Estimated Percent of Laboratories with Certified Nursing Assistants and Certified
Nursing Assistant Vacancies, by Certificate Type
Laboratory Type Number of
Laboratories
Percent with this Employee
Type
(C.I. ±) Percent
Percent with Vacancies in this Employee Type
(C.I. ±) Percent
Compliance and Accreditation 776 3.8% 2.8% 1.2% 1.7% Waiver and Provider Performed Microscopy 2,598 28.7 7.8 5.9 3.9
Total 3,374 22.9% 6.1% 4.8% 3.0% Source: Wisconsin Clinical Laboratory Science Workforce Survey, 2010, Department of Health Services. Table 28. Estimated Percent of Laboratories with “Other” Employees and “Other” Vacancies, by
Certificate Type
Laboratory Type Number of
Laboratories
Percent with this Employee
Type
(C.I. ±) Percent
Percent with Vacancies in this Employee Type
(C.I. ±) Percent
Compliance and Accreditation 776 13.8% 5.0% 2.3% 2.3% Waiver and Provider Performed Microscopy 2,598 41.3 8.7 1.6 1.8
Total 3,374 35.0% 6.9% 1.8% 1.5% Source: Wisconsin Clinical Laboratory Science Workforce Survey, 2010, Department of Health Services.

Laboratory Employees, Southern Region
Wisconsin Clinical Laboratory Science Workforce Survey, 2010 19
Table 29. Employees of Respondent Laboratories by Age and Gender, Southern Region
Total Male Female Age Percent Percent Percent
Under 25 9% 5% 10% 25-29 11 8 12 30-39 20 18 21 40-49 23 25 22 50-54 13 12 13 55-59 12 13 12 60+ 12 19 10 Total 100% 100% 100%
Source: Wisconsin Clinical Laboratory Science Workforce Survey, 2010, Department of Health Services.
Note: There were 69 respondent laboratories (with 1,661 employees for whom age and sex were reported) in the Southern Region, which has a total of 582 laboratories.
Figure 5. Employees of Respondent Laboratories by Age, Southern Region
12%
20% 20%
23%25%
0
10
20
30
40
Under 29 30-39 40-49 50-59 60+
Age Group
Perc
ent b
y A
ge
Source: Wisconsin Clinical Laboratory Science Workforce Survey, 2010, Department of Health Services.
• Thirty-seven percent of all respondent laboratory employees in the Southern Region were 50 years
of age and older.

Laboratory Employees, Southern Region
20 Wisconsin Clinical Laboratory Science Workforce Survey, 2010
Table 30. Employees of Respondent Laboratories by Race and Ethnicity, Southern Region Race: Percent White 85% Black/African American 2 American Indian/Alaska Native 1 Native Hawaiian /Other Pacific Islander 0 Asian 2 Other 1 Ethnicity: Hispanic/Latino 9% Total 100% Source: Wisconsin Clinical Laboratory Science Workforce Survey, 2010, Department of Health Services.
Note: Race and ethnicity groups are mutually exclusive.
There were 69 respondent laboratories (with 1,718 employees for whom race and ethnicity were reported) in the Southern Region, which has a total of 582 laboratories.
Figure 6. Employees of Respondent Laboratories by Race and Ethnicity, Southern Region
Others 2%
Asian2%
Hispanic 9%
African American
2%
Non-Hispanic White 85%
Source: Wisconsin Clinical Laboratory Science Workforce Survey, 2010, Department of Health Services.

Laboratory Employees, Southern Region
Wisconsin Clinical Laboratory Science Workforce Survey, 2010 21
Table 31. Estimated Full-Time Equivalent (FTE) Laboratory Employees by Job Title, Southern Region
Job Title/Discipline Estimated FTEs Estimated
FTE Vacancies Staff with clinical laboratory professional education and training Pathologists 147 0 Pathology Assistants 9 0 Managers/Administrators* 833 19 Certified Medical Technologists – MT(ASCP), CLS(NCA), etc. 1,755 38 Medical Technologists (non-certified) 372 0 Certified Medical Laboratory Technicians – MLT(ASCP), CLT(NCA), etc. 905 47 Medical Laboratory Technicians (non-certified) 174 0 Phlebotomists 793 5 Histotechnologists (Bachelor of Science degree, B.S.) 28 0 Histotechnician 76 0 Cytologists 117 0 Cytogenetic Technologists 180 0 Molecular Biologists 0 0 Other professionals who perform laboratory testing Registered Nurses 810 2 Licensed Practical Nurses 427 0 CMA/MA 198 19 CNA/NA 1,139 28 Other 1,934 189 Total 9,897 347
Source: Wisconsin Clinical Laboratory Science Workforce Survey, 2010, Department of Health Services. Note: Estimated numbers of FTE laboratory employees by job title were based on FTEs reported by the respondent
laboratories, and calculated using a multiplier of 9.5. These estimates assume that all Wisconsin laboratories have a distribution of employees by discipline similar to that of the 319 respondent laboratories that completed the survey. Formula used to calculate the multiplier: 319/3,374 x 100 = 9.5.
* This category assumes that laboratory managers have received clinical laboratory professional education and
training.
• In the Southern Region, 54 percent of the employees of CLIA-certified laboratories had a job title reflecting clinical laboratory professional education and training, versus 49 percent statewide.

Laboratory Employees, Southern Region
22 Wisconsin Clinical Laboratory Science Workforce Survey, 2010
Table 32. Respondent Laboratories by Percent of Employees Trained in Emergency
Preparedness and Response, Southern Region
Percent of Employees Trained Percent No employee had training 26% 1% - 50% of employees had training 20 51%-99% of employees had training 9 100% of employees had training 35 No response to this question 10 Total respondent laboratories 100% Source: Wisconsin Clinical Laboratory Science Workforce Survey, 2010, Department of Health Services. Note: In the Southern Region, 62 laboratories responded to this question.
Percentages may not add to 100 percent due to rounding.
Table 33. Respondent Laboratories with an Established Emergency Preparedness and Response Plan, Southern Region
Established Plan? Percent Yes 61% No 30 No response to this question 9 Total respondent laboratories 100%
Source: Wisconsin Clinical Laboratory Science Workforce Survey, 2010, Department of Health Services. Note: In the Southern Region, 63 laboratories responded to this question.
Percentages may not add to 100 percent due to rounding.
• Thirty-five percent of respondent laboratories in the Southern Region reported that all their employees were trained in emergency preparedness and response.
• Sixty-one percent of respondent laboratories in the Southern Region had an established emergency
preparedness and response plan.
Laboratory Employees, Southeastern Region
Wisconsin Clinical Laboratory Science Workforce Survey, 2010 23
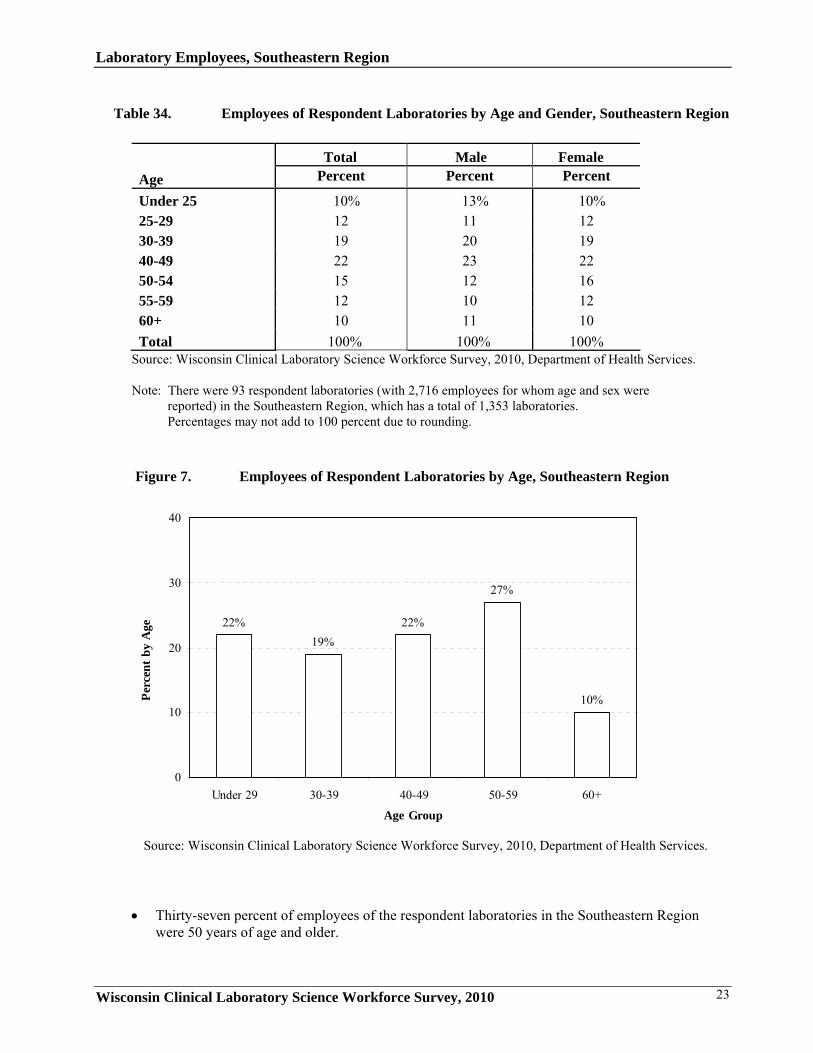
Table 34. Employees of Respondent Laboratories by Age and Gender, Southeastern Region
Total Male Female Age Percent Percent Percent
Under 25 10% 13% 10% 25-29 12 11 12 30-39 19 20 19 40-49 22 23 22 50-54 15 12 16 55-59 12 10 12 60+ 10 11 10 Total 100% 100% 100%
Source: Wisconsin Clinical Laboratory Science Workforce Survey, 2010, Department of Health Services.
Note: There were 93 respondent laboratories (with 2,716 employees for whom age and sex were reported) in the Southeastern Region, which has a total of 1,353 laboratories. Percentages may not add to 100 percent due to rounding.
Figure 7. Employees of Respondent Laboratories by Age, Southeastern Region
10%
22%19%
22%
27%
0
10
20
30
40
Under 29 30-39 40-49 50-59 60+
Age Group
Perc
ent b
y A
ge
Source: Wisconsin Clinical Laboratory Science Workforce Survey, 2010, Department of Health Services.
• Thirty-seven percent of employees of the respondent laboratories in the Southeastern Region were 50 years of age and older.

Laboratory Employees, Southeastern Region
24 Wisconsin Clinical Laboratory Science Workforce Survey, 2010
Table 35. Employees of Respondent Laboratories by Race and Ethnicity, Southeastern Region
Race: Percent White 78% Black/African American 14 American Indian/Alaska Native <1 Native Hawaiian /Other Pacific Islander <1 Asian 1 Other 2 Ethnicity: Hispanic/Latino 4 Total 100%
Source: Wisconsin Clinical Laboratory Science Workforce Survey, 2010, Department of Health Services.
Note: There were 93 respondent laboratories (with 2,634 employees for whom race and ethnicity were reported) in the Southeastern Region, which has a total of 1,353 laboratories. Race and ethnicity groups are mutually exclusive.
Figure 8. Employees of Respondent Laboratories by Race and Ethnicity, Southeastern Region
Other3%
Asian 1%
Hispanic4%
African American
14%
White78%
Source: Wisconsin Clinical Laboratory Science Workforce Survey, 2010, Department of Health Services.

Laboratory Employees, Southeastern Region
Wisconsin Clinical Laboratory Science Workforce Survey, 2010 25
Table 36. Estimated Full-Time Equivalent (FTE) Laboratory Employees by Job Title,
Southeastern Region
Job Title/Discipline Estimated FTEs Estimated
FTE Vacancies Staff with clinical laboratory professional education and training Pathologists 123 0 Pathology Assistants 28 0 Managers/Administrators* 624 9 Certified Medical Technologists – MT(ASCP), CLS(NCA), etc. 2,643 22 Medical Technologists (non-certified) 28 0 Certified Medical Laboratory Technicians – MLT(ASCP), CLT(NCA), etc. 385 192 Medical Laboratory Technicians (non-certified) 161 0 Phlebotomists 1,693 232 Histotechnologists (Bachelor of Science degree, B.S.) 237 0 Histotechnician 170 15 Cytologists 107 0 Cytogenetic Technologists 9 0 Molecular Biologists 47 0 Other professionals who perform laboratory testing Registered Nurses 1,553 57 Licensed Practical Nurses 1,321 66 CMA/MA 473 0 CNA/NA 2,835 93 Other 1,992 183 Total 14,429 869
Source: Wisconsin Clinical Laboratory Science Workforce Survey, 2010, Department of Health Services. Note: Estimated numbers of FTE laboratory employees by job title were based on FTEs reported by the
respondent laboratories, and calculated using a multiplier of 9.5. These estimates assume that all Wisconsin laboratories have a distribution of employees by discipline similar to that of the 319 respondent laboratories that completed the survey. Formula used to calculate the multiplier: 319/3,374 x 100 = 9.5.
* This category assumes that laboratory managers have received clinical laboratory professional education
and training.
• In the Southeastern Region, 43 percent of the employees of CLIA-certified laboratories had a job title reflecting clinical laboratory professional education and training, versus 49 percent statewide.

Laboratory Employees, Southeastern Region
26 Wisconsin Clinical Laboratory Science Workforce Survey, 2010
Table 37. Respondent Laboratories by Percent of Employees Trained in Emergency
Preparedness and Response, Southeastern Region
Percent of Employees Trained Percent No employee had training 32% 1% - 50% of employees had training 25 51%-99% of employees had training 5 100% of employees had training 22 No response to this question 16 Total respondent laboratories 100%
Source: Wisconsin Clinical Laboratory Science Workforce Survey, 2010, Department of Health Services.
Note: In the Southeastern Region, 78 laboratories responded to this question.
Table 38. Respondent Laboratories with an Established Emergency Preparedness and
Response Plan, Southeastern Region
Established Plan? Percent Yes 57% No 29 No response to this question 14 Total respondent laboratories 100% Source: Wisconsin Clinical Laboratory Science Workforce Survey, 2010, Department of Health Services. Note: In the Southeastern Region, 80 laboratories responded to this question.
• Only 22 percent of respondent laboratories in the Southeastern Region reported that all their employees were trained in emergency preparedness and response, versus 33 percent statewide.
• Fifty-seven percent of respondent laboratories in the Southeastern Region had an established
emergency preparedness and response plan, versus 64 percent statewide.

Laboratory Employees, Northeastern Region
Wisconsin Clinical Laboratory Science Workforce Survey, 2010 27
Table 39. Employees of Respondent Laboratories by Age and Gender, Northeastern Region
Total Male Female Age Percent Percent Percent
Under 25 14% 11% 15% 25-29 12 15 12 30-39 20 23 20 40-49 22 15 23 50-54 13 13 13 55-59 10 10 10 60+ 8 12 7 Total 100% 100% 100% Source: Wisconsin Clinical Laboratory Science Workforce Survey, 2010, Department of Health Services.
Note: There were 75 respondent laboratories (with 1,424 employees for whom age and sex were reported) in
the Northeastern Region, which has a total of 744 laboratories. Percentages may not add to 100 percent due to rounding.
Figure 9. Employees of Respondent Laboratories by Age, Northeastern Region
8%
26%
20% 22% 23%
0
10
20
30
40
Under 29 30-39 40-49 50-59 60+
Age Group
Perc
ent b
y A
ge
Source: Wisconsin Clinical Laboratory Science Workforce Survey, 2010, Department of Health Services.
• Thirty-one percent of all respondent laboratory employees in the Northeastern Region were 50 years
of age and older.
Laboratory Employees, Northeastern Region
28 Wisconsin Clinical Laboratory Science Workforce Survey, 2010
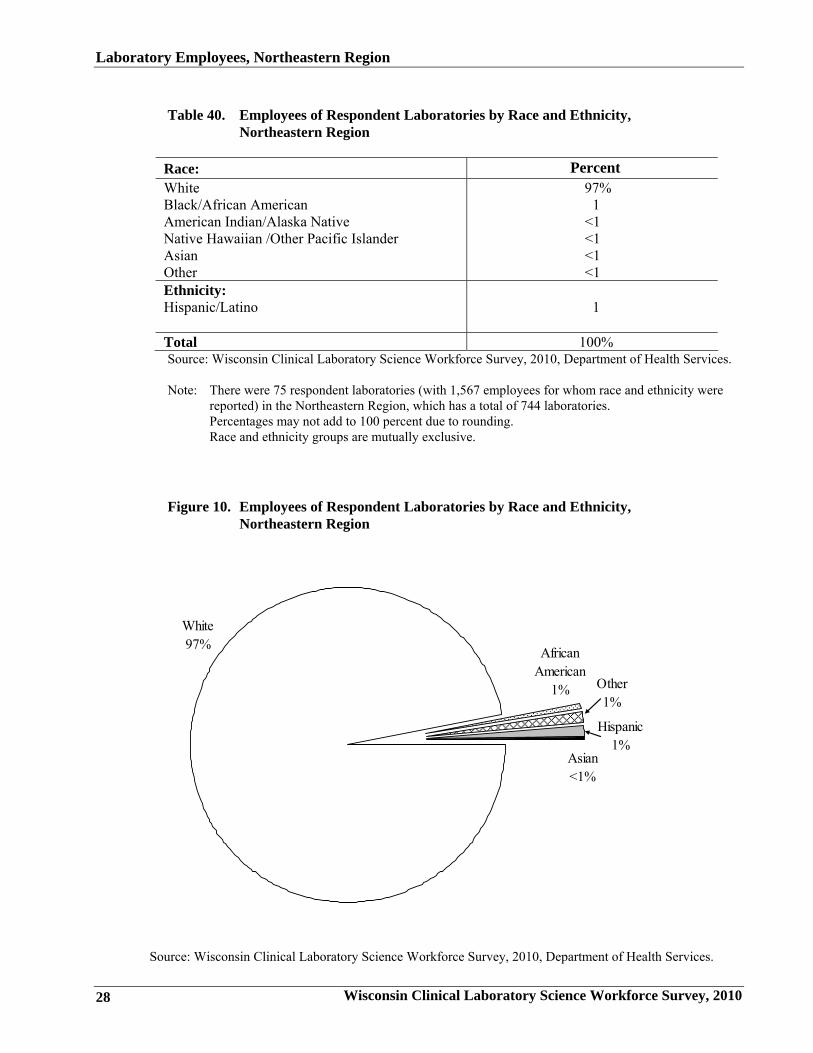
Table 40. Employees of Respondent Laboratories by Race and Ethnicity, Northeastern Region
Race: Percent White 97% Black/African American 1 American Indian/Alaska Native <1 Native Hawaiian /Other Pacific Islander <1 Asian <1 Other <1 Ethnicity: Hispanic/Latino 1 Total 100% Source: Wisconsin Clinical Laboratory Science Workforce Survey, 2010, Department of Health Services. Note: There were 75 respondent laboratories (with 1,567 employees for whom race and ethnicity were
reported) in the Northeastern Region, which has a total of 744 laboratories. Percentages may not add to 100 percent due to rounding. Race and ethnicity groups are mutually exclusive.
Figure 10. Employees of Respondent Laboratories by Race and Ethnicity, Northeastern Region
Other1%
Asian<1%
Hispanic1%
African American
1%
White97%
Source: Wisconsin Clinical Laboratory Science Workforce Survey, 2010, Department of Health Services.

Laboratory Employees, Northeastern Region
Wisconsin Clinical Laboratory Science Workforce Survey, 2010 29
Table 41. Estimated Full-Time Equivalent (FTE) Laboratory Employees by Job Title, Northeastern Region
Job Title/Discipline Estimated FTEs Estimated
FTE Vacancies Staff with clinical laboratory professional education and training Pathologists 135 0 Pathology Assistants 9 0 Managers/Administrators* 406 9 Certified Medical Technologists – MT(ASCP), CLS(NCA), etc. 1,123 0 Medical Technologists (non-certified) 0 0 Certified Medical Laboratory Technicians – MLT(ASCP), CLT(NCA), etc. 476 28 Medical Laboratory Technicians (non-certified) 86 0 Phlebotomists 1,300 9 Histotechnologists (Bachelor of Science degree, B.S.) 9 0 Histotechnician 81 0 Cytologists 62 0 Cytogenetic Technologists 0 0 Molecular Biologists 0 0 Other professionals who perform laboratory testing Registered Nurses 1,062 9 Licensed Practical Nurses 754 0 CMA/MA 147 0 CNA/NA 1,364 61 Other 1,700 0 Total 8,714 116
Source: Wisconsin Clinical Laboratory Science Workforce Survey, 2010, Department of Health Services. Note: Estimated numbers of FTE laboratory employees by job title were based on FTEs reported by the
respondent laboratories, and calculated using a multiplier of 9.5. These estimates assume that all Wisconsin laboratories have a distribution of employees by discipline similar to that of the 319 respondent laboratories that completed the survey. Formula used to calculate the multiplier: 319/3,374 x 100 = 9.5.
* This category assumes that laboratory managers have received clinical laboratory professional education
and training.
• In the Northeastern Region, 42 percent of the employees of CLIA-certified laboratories had a job title reflecting clinical laboratory professional education and training, versus 49 percent statewide.

Laboratory Employees, Northeastern Region
30 Wisconsin Clinical Laboratory Science Workforce Survey, 2010
Table 42. Respondent Laboratories by Percent of Employees Trained in Emergency
Preparedness and Response, Northeastern Region
Percent of Employees Trained Percent No employee had training 33% 1% - 50% of employees had training 21 51%-99% of employees had training 7 100% of employees had training 29 No response to this question 9 Total respondent laboratories 100% Source: Wisconsin Clinical Laboratory Science Workforce Survey, 2010, Department of Health Services.
Note: In the Northeastern Region, 68 laboratories responded to this question.
Percentages may not add to 100 percent due to rounding.
Table 43. Respondent Laboratories with an Established Emergency Preparedness and
Response Plan, Northeastern Region
Established Plan? Percent Yes 67% No 28 No response to this question 5 Total respondent laboratories 100% Source: Wisconsin Clinical Laboratory Science Workforce Survey, 2010, Department of Health Services.
Note: In the Northeastern Region, 71 laboratories responded to this question.
Percentages may not add to 100 percent due to rounding.
• Twenty-nine percent of respondent laboratories in the Northeastern Region reported that all their
employees were trained in emergency preparedness and response.
• Sixty-seven percent of respondent laboratories in the Northeastern Region had an established emergency preparedness and response plan.
Laboratory Employees, Western Region
Wisconsin Clinical Laboratory Science Workforce Survey, 2010 31
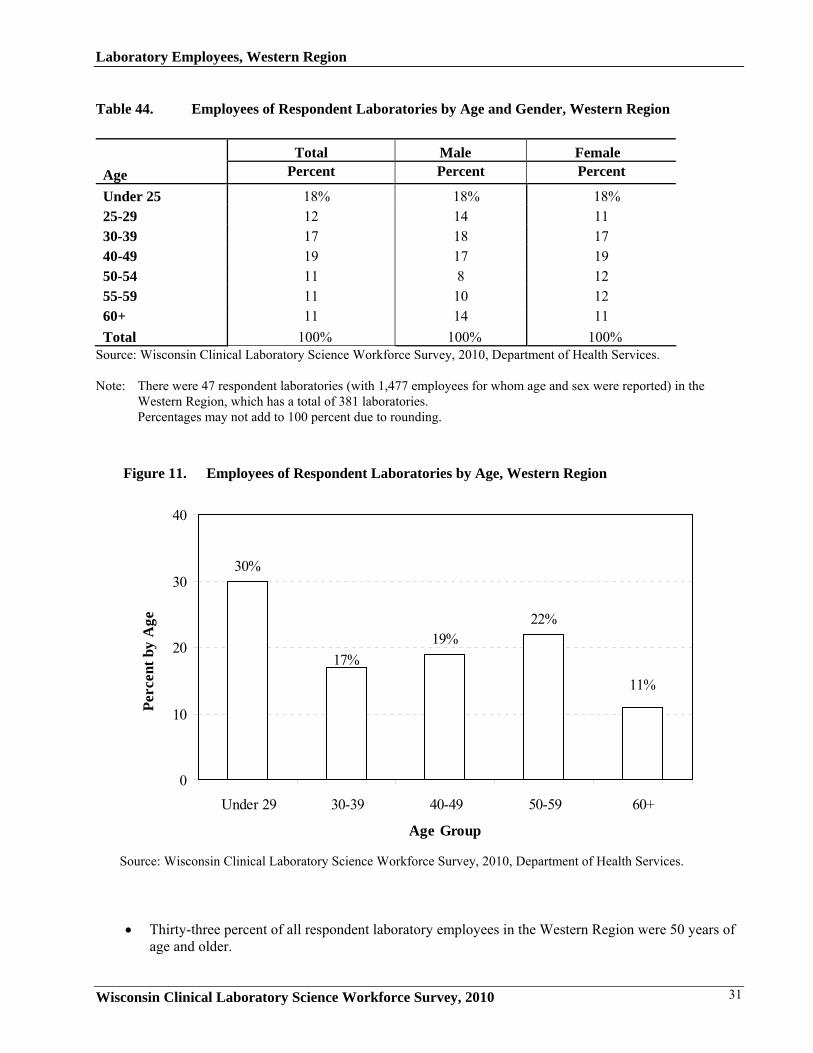
Table 44. Employees of Respondent Laboratories by Age and Gender, Western Region Total Male Female Age Percent Percent Percent
Under 25 18% 18% 18% 25-29 12 14 11 30-39 17 18 17 40-49 19 17 19 50-54 11 8 12 55-59 11 10 12 60+ 11 14 11 Total 100% 100% 100%
Source: Wisconsin Clinical Laboratory Science Workforce Survey, 2010, Department of Health Services. Note: There were 47 respondent laboratories (with 1,477 employees for whom age and sex were reported) in the
Western Region, which has a total of 381 laboratories. Percentages may not add to 100 percent due to rounding.
Figure 11. Employees of Respondent Laboratories by Age, Western Region
11%
30%
17%19%
22%
0
10
20
30
40
Under 29 30-39 40-49 50-59 60+
Age Group
Perc
ent b
y A
ge
Source: Wisconsin Clinical Laboratory Science Workforce Survey, 2010, Department of Health Services.
• Thirty-three percent of all respondent laboratory employees in the Western Region were 50 years of
age and older.

Laboratory Employees, Western Region
32 Wisconsin Clinical Laboratory Science Workforce Survey, 2010
Table 45. Employees of Respondent Laboratories by Race and Ethnicity, Western Region
Race: Percent White 94% Black/African American 1 American Indian/Alaska Native 1 Native Hawaiian /Other Pacific Islander 1 Asian 2 Other <1 Ethnicity: 1 Hispanic/Latino Total 100% Source: Wisconsin Clinical Laboratory Science Workforce Survey, 2010, Department of Health Services.
Note: There were 47 respondent laboratories (with 1,457 employees for whom race and ethnicity were reported)
in the Western Region, which has a total of 381 laboratories. Percentages may not add to 100 percent due to rounding. Race and ethnicity groups are mutually exclusive.
Figure 12. Employees of Respondent Laboratories by Race and Ethnicity, Western Region
Other2%
Asian2%
Hispanic1%
African American
1%
White94%
Source: Wisconsin Clinical Laboratory Science Workforce Survey, 2010, Department of Health Services.

Laboratory Employees, Western Region
Wisconsin Clinical Laboratory Science Workforce Survey, 2010 33
Table 46. Estimated Full-Time Equivalent (FTE) Laboratory Employees by Job
Title, Western Region
Job Title/Discipline Estimated FTEs Estimated
FTE Vacancies Staff with clinical laboratory professional education and training Pathologists 108 0 Pathology Assistants 19 0 Managers/Administrators* 600 0 Certified Medical Technologists – MT(ASCP), CLS(NCA), etc. 1,041 9 Medical Technologists (non-certified) 2,657 0 Certified Medical Laboratory Technicians – MLT(ASCP), CLT(NCA), etc. 722 9 Medical Laboratory Technicians (non-certified) 198 9 Phlebotomists 702 0 Histotechnologists (Bachelor of Science degree, B.S.) 0 0 Histotechnician 130 0 Cytologists 47 0 Cytogenetic Technologists 0 0 Molecular Biologists 0 0 Other professionals who perform laboratory testing Registered Nurses 683 9 Licensed Practical Nurses 318 20 CMA/MA 171 9 CNA/NA 1,549 34 Other 1,469 53 Total 10,414 152
Source: Wisconsin Clinical Laboratory Science Workforce Survey, 2010, Department of Health Services. Note: Estimated numbers of FTE laboratory employees by job title were based on FTEs reported by the
respondent laboratories, and calculated using a multiplier of 9.5. These estimates assume that all Wisconsin laboratories have a distribution of employees by discipline similar to that of the 319 respondent laboratories that completed the survey. Formula used to calculate the multiplier: 319/3,374 x 100 = 9.5.
* This category assumes that laboratory managers have received clinical laboratory professional education
and training.
• In the Western Region, 59 percent of the employees of CLIA-certified laboratories had a job title reflecting clinical laboratory professional education and training, versus 49 percent statewide.

Laboratory Employees, Western Region
34 Wisconsin Clinical Laboratory Science Workforce Survey, 2010
Table 47. Respondent Laboratories by Percent of Employees Trained in Emergency
Preparedness and Response, Western Region
Percent of Employees Trained Percent No employee had training 19% 1% - 50% of employees had training 23 51%-99% of employees had training 11 100% of employees had training 36 No response to this question 11 Total respondent laboratories 100% Source: Wisconsin Clinical Laboratory Science Workforce Survey, 2010, Department of Health Services. Note: In the Western Region, 42 laboratories responded to this question. Percentages may not add to 100 percent due to rounding.
Table 48. Respondent Laboratories with an Established Emergency Preparedness and
Response Plan, Western Region
Established Plan? Percent Yes 72% No 19 No response to this question 9 Total respondent laboratories 100% Source: Wisconsin Clinical Laboratory Science Workforce Survey, 2010, Department of Health Services. Note: In the Western Region, 43 laboratories responded to this question.
Percentages may not add to 100 percent due to rounding.
• Thirty-six percent of respondent laboratories in the Western Region reported that all their employees were trained in emergency preparedness and response, versus 33 percent statewide.
• In the Western Region, 72 percent of respondent laboratories had an established emergency
preparedness and response plan, versus 64 percent statewide.

Laboratory Employees, Northern Region
Wisconsin Clinical Laboratory Science Workforce Survey, 2010 35
Table 49. Employees of Respondent Laboratories by Age and Gender, Northern Region
Total Male Female Age Percent Percent Percent Under 25 13% 10% 14% 25-29 11 11 11 30-39 18 23 17 40-49 22 20 22 50-54 14 10 15 55-59 12 11 12 60+ 9 15 8 Total 100% 100% 100% Source: Wisconsin Clinical Laboratory Science Workforce Survey, 2010, Department of Health Services. Note: There were 35 responding laboratories (with 1,223 employees for whom age and sex were reported) in
the Northern Region, which has a total of 314 laboratories. Percentages may not add to 100 percent due to rounding.
Figure 13. Employees of Respondent Laboratories by Age, Northern Region
9%
24%
18%22%
26%
0
10
20
30
40
Under 29 30-39 40-49 50-59 60+
Age Group
Perc
ent b
y A
ge
Source: Wisconsin Clinical Laboratory Science Workforce Survey, 2010, Department of Health Services.
• Thirty-five percent of all respondent laboratory employees in the Northern Region were 50 years
of age and older.

Laboratory Employees, Northern Region
36 Wisconsin Clinical Laboratory Science Workforce Survey, 2010
Table 50. Employees of Respondent Laboratories by Race and Ethnicity, Northern Region
Race: Percent White 97% Black/African American <1 American Indian/Alaska Native <1 Native Hawaiian /Other Pacific Islander <1 Asian 2 Other 1 Ethnicity: Hispanic/Latino 1 Total 100% Source: Wisconsin Clinical Laboratory Science Workforce Survey, 2010, Department of Health Services. Note: There were 35 responding laboratories (with 1,195 employees for whom race and ethnicity were
reported) in the Northern Region, which has a total of 314 laboratories. Percentages may not add to 100 percent due to rounding. Race and ethnicity groups are mutually exclusive.
Figure 14. Employees of Respondent Laboratories by Race and Ethnicity, Northern Region
Other1%
Asian2%
Hispanic<1%
African American
<1%
White 97%
Source: Wisconsin Clinical Laboratory Science Workforce Survey, 2010, Department of Health Services.

Laboratory Employees, Northern Region
Wisconsin Clinical Laboratory Science Workforce Survey, 2010 37
Table 51. Estimated Full-Time Equivalent (FTE) Laboratory Employees by Job Title,
Northern Region
Job Title/Discipline Estimated FTEs Estimated
FTE Vacancies Staff with clinical laboratory professional education and training Pathologists 222 8 Pathology Assistants 9 0 Managers/Administrators* 454 0 Certified Medical Technologists – MT(ASCP), CLS(NCA), etc. 1,264 61 Medical Technologists (non-certified) 9 0 Certified Medical Laboratory Technicians – MLT(ASCP), CLT(NCA), etc. 494 0 Medical Laboratory Technicians (non-certified) 76 0 Phlebotomists 721 13 Histotechnologists (Bachelor of Science degree, B.S.) 28 0 Histotechnician 113 21 Cytologists 95 0 Cytogenetic Technologists 57 0 Molecular Biologists 0 0 Other professionals who perform laboratory testing Registered Nurses 463 30 Licensed Practical Nurses 165 14 CMA/MA 74 0 CNA/NA 1,312 64 Other 2,325 28 Total 7,881 239
Source: Wisconsin Clinical Laboratory Science Workforce Survey, 2010, Department of Health Services. Note: Estimated numbers of FTE laboratory employees by job title were based on FTEs reported by the
respondent laboratories, and calculated using a multiplier of 9.5. These estimates assume that all Wisconsin laboratories have a distribution of employees by discipline similar to that of the 319 respondent laboratories that completed the survey. Formula used to calculate the multiplier: 319/3,374 x 100 = 9.5.
* This category assumes that laboratory managers have received clinical laboratory professional education
and training.
• In the Northern Region, 45 percent of the employees of CLIA-certified laboratories had a job title reflecting clinical laboratory professional education and training, versus 49 percent statewide.

Laboratory Employees, Northern Region
38 Wisconsin Clinical Laboratory Science Workforce Survey, 2010
Table 52. Respondent Laboratories by Percent of Employees Trained in Emergency Preparedness and Response, Northern Region
Percent of Employees Trained Percent No employee had training 29% 1% - 50% of employees had training 17 51%-99% of employees had training 17 100% of employees had training 29 No response to this question 9 Total respondent laboratories 100%
Source: Wisconsin Clinical Laboratory Science Workforce Survey, 2010, Department of Health Services. Note: In the Northern Region, 32 laboratories responded to this question.
Percentages may not add to 100 percent due to rounding.
Table 53. Respondent Laboratories with an Established Emergency Preparedness and Response Plan, Northern Region
Established Plan? Percent Yes 69% No 23 No response to this question 9 Total respondent laboratories 100%
Source: Wisconsin Clinical Laboratory Science Workforce Survey, 2010, Department of Health Services. Note: In the Northern Region, 32 laboratories responded to this question.
Percentages may not add to 100 percent due to rounding. • Twenty-nine percent of respondent laboratories in the Northern Region reported that all their
employees were trained in emergency preparedness and response. • Sixty-nine percent of respondent laboratories in the Northern Region had an established emergency
preparedness and response plan, versus 64 percent statewide.

Appendix
Wisconsin Clinical Laboratory Science Workforce Survey, 2010 39
Appendix A. Technical Notes Survey Methods The survey universe consisted of 3,374 laboratories in Wisconsin that were CLIA-certified as of September 2, 2009. A sample of 746 laboratories stratified by CLIA type and DHS region was drawn from the universe list. In March 2010, laboratories in the sample were contacted by U.S. mail and asked to complete the survey on the Internet at the Wisconsin DHS, Division of Quality Assurance (DQA) Clinical Laboratory website. Two follow-up postcards were mailed to laboratories that did not respond to the initial request. This yielded a response rate of 43%, with 319 of 746 laboratories completing the survey. The data were adjusted by post-stratification weighting so the results conformed to the characteristics (CLIA certificate type and DHS region) of the survey universe. This survey does not include local health departments because their workforce is included in the Local Health Department Survey at http://dhs.wisconsin.gov/stats/index.htm. Statewide Estimates for Laboratories (Tables 3, 4, and 5) Estimated number of laboratories by staff size was calculated by assuming that the distribution of laboratories by staff size is similar to the distribution of the 319 laboratories that replied to this question in the survey. Estimated number of laboratories to have employees trained in emergency preparedness and response was calculated by assuming that the distribution of laboratories which trained their employees is similar to the distribution of the 282 laboratories that replied to this question in the survey. Estimated number of laboratories with an established emergency preparedness and response plan was calculated by assuming that the distribution of laboratories is similar to the distribution of the 289 laboratories that replied to this question in the survey. Statewide Estimates for Employees (Tables 6, 7, 8, 9, and 10) Estimates were calculated by applying reported percentages to the total estimated number of employees. The total estimated number of employees was calculated by applying a multiplier based on the number of responding laboratories divided by the total number of laboratories: (319/3,374)*100 = 9.5. The estimated number of employees by age and gender in Table 6 therefore assumes that the distribution of employees, both in total and by age and gender, is similar to the distribution of the 8,501 employees for whom age and gender were reported in the 319 laboratories that completed the survey. Similarly, the estimated number of employees by race and ethnicity in Table 7 assumes that the distribution of employees by race and ethnicity is similar to the distribution of the 8,571 employees for whom race and ethnicity were reported in the 319 laboratories that completed the survey. Interpreting confidence intervals Tables 11 through 28 in this report show 95 percent confidence intervals for each reported percentage. Add the confidence interval to the percentage to find the upper boundary of the interval and subtract it from the percentage to find the lower boundary. For example, Table 6 shows that 5.0 percent of all Wisconsin laboratories employ Pathologists, with a confidence interval of +/- 1.7 percent. Adding and subtracting the value of 1.7 yields a 95 percent confidence interval of 3.3 to 6.7 percent. This means that 95 out of 100 random surveys would estimate that between 3.3 and 6.7 percent of Wisconsin clinical laboratories employ Pathologists.

Appendix
40 Wisconsin Clinical Laboratory Science Workforce Survey, 2010
Clinical Laboratory Improvement Amendments (CLIA) Certification To ensure that laboratory testing is of a consistently high quality, the Centers for Medicare and Medicaid Services regulates all laboratory testing (except research) performed on humans in the U.S. through CLIA, as follows:
1. Certificate of Waiver (COW) laboratories can only perform waived tests; 2. Certificate of Provider Performed Microscopy (PPM) laboratories, in addition to waived tests, may
also perform certain microscopic examinations during the course of a patient visit using specimens that are not easily transportable;
3. Certificate of Compliance (COC) laboratories and Certificate of Accreditation (COA) laboratories can perform waived tests, as well as tests of moderate and high complexity.
Laboratories subject to the Clinical Laboratory Improvement Amendments certification provisions must obtain and maintain a certificate based on the type and complexity of testing conducted as follows:
• Laboratories that have been issued a Certificate of Compliance or Certificate of Accreditation are subject to a routine on-site survey every two years.
• Laboratories issued a Certificate of Waiver or Certificate of Provider Performed Microscopy are exempt from routine on-site inspections.
• All certificates must be renewed every two years.

Appendix
Wisconsin Clinical Laboratory Science Workforce Survey, 2010 41
Certificate types are defined as follows:
• Certificate of Waiver (COW) This certificate is issued to a laboratory that performs only waived tests.
• Certificate of Provider Performed Microscopy (PPM) This certificate is issued to a laboratory in which a physician (MD or DO), podiatrist (DPM), dentist (DDM), or mid-level practitioner (Advanced Practice Nurse Practitioner, nurse midwife or physician’s assistant) performs simple microscopy procedures. This certificate also allows waived testing to be performed.
• Certificate of Compliance This certificate is issued to a laboratory after a survey by the authorized state agency finds the laboratory is in compliance with all applicable CLIA requirements. This certificate permits the laboratory to perform testing of moderate and/or high complexity depending on the laboratory personnel qualifications and compliance with all other applicable CLIA requirements, and also to perform waived tests.
• Certificate of Accreditation This certificate is issued to a laboratory on the basis of the laboratory's accreditation by an accreditation organization approved by the Centers for Medicare and Medicaid Services. This certificate permits the laboratory to perform testing of moderate and/or high complexity depending on the laboratory personnel qualifications and compliance with all other applicable CLIA and organizational requirements, and also to perform waived tests.
• Certificate of Registration This certificate is issued to a laboratory that applies for a Certificate of Compliance or Certificate of Accreditation. A registration certificate enables the entity to conduct laboratory testing of moderate or high complexity or both until the entity is determined through on-site survey or verification of accreditation that all applicable requirements are met. This certificate also permits the laboratory to perform waived tests. A registration certificate is temporary and indicates only that the laboratory is registered with the Centers for Medicare and Medicaid Services and does not indicate approval or compliance with CLIA regulations. A registration certificate is valid until a survey takes place, or for two years, whichever is sooner.

Appendix
42 Wisconsin Clinical Laboratory Science Workforce Survey, 2010
Survey Response Rate Table A1. Survey Response Rate by Wisconsin Department of Health Services (DHS) Region
DHS Region Number
of Laboratories Number in
Sample Survey
Responses Survey
Response Rate Southern 582 137 69 50% Southeastern 1,353 290 93 32 Northeastern 744 162 75 46 Western 381 87 47 54 Northern 314 70 35 50 Total 3,374 746 319 43%
Source: Wisconsin Clinical Laboratory Science Workforce Survey, 2010 Table A2. Survey Response Rate by Certificate Type
CLIA Types Number of
Laboratories
Number in
Sample Survey
Responses
Survey Response
Rate Certificate of Waiver 2,154 357 117 33% Certificate of Provider Performed Microscopy 444 72 19 26 Certificate of Compliance 412 168 89 53 Certificate of Accreditation 364 149 94 63 Total 3,374 746 319 43% Source: Wisconsin Clinical Laboratory Science Workforce Survey, 2010

Appendix
Wisconsin Clinical Laboratory Science Workforce Survey, 2010 43
Table A3. Survey Response Rate by Certificate Type and by Wisconsin Department of Health
Services (DHS) Region
CLIA Type DHS Region Number of
Laboratories Number in
Sample Survey
Responses
Survey Response
Rate Certificate of Waiver Southern 362 60 24 40% Southeastern 853 142 34 24 Northeastern 475 78 25 32 Western 249 41 19 46 Northern 215 36 15 42 Certificate of Provider Performed Microscopy Southern 59 10 1 10 Southeastern 236 39 11 28 Northeastern 101 16 5 31 Western 24 3 1 33 Northern 24 4 1 25 Certificate of Compliance Southern 84 35 21 60 Southeastern 175 72 31 43 Northeastern 103 42 25 60 Western 34 13 9 69 Northern 16 6 3 50 Certificate of Accreditation Southern 77 32 23 72 Southeastern 89 37 17 46 Northeastern 65 26 20 77 Western 74 30 18 60 Northern 59 24 16 67 Total Statewide 3,374 746 319 43%
Source: Wisconsin Clinical Laboratory Science Workforce Survey, 2010

Appendix
44 Wisconsin Clinical Laboratory Science Workforce Survey, 2010
Wisconsin Population Estimates Table A4. Wisconsin Population Estimates by Race and Ethnicity, Wisconsin Department of
Health Services (DHS) Regions, 2008
DHS Region Total
Population
Non-Hispanic
White Non-Hispanic
Black
Non-Hispanic American
Indian
Non-Hispanic
Asian Hispanic All Regions 5,672,297 4,865,281 346,308 53,358 121,549 285,801 100.0% 85.8% 6.1% 0.9% 2.1% 5.0%Southern 1,086,560 974,196 37,486 4,835 26,760 43,283 19.2% 17.2% 0.7% 0.1% 0.5% 0.8%Southeastern 2,080,085 1,555,782 282,633 10,907 49,707 181,056 36.7% 27.4% 5.0% 0.2% 0.9% 3.2%Northeastern 1,228,055 1,125,727 16,178 18,858 23,436 43,856 21.7% 19.8% 0.3% 0.3% 0.4% 0.8%Western 775,228 739,868 6,686 6,881 11,232 10,561 13.7% 13.0% 0.1% 0.1% 0.2% 0.2%Northern 502,369 469,708 3,325 11,878 10,413 7,045 8.9% 8.3% 0.1% 0.2% 0.2% 0.1%Source: 2008 bridged race population estimates, Population Health Information Section, Division of Public Health,
Wisconsin Department of Health Services. Note: Percentages refer to percent of total Wisconsin population.

Appendix
Wisconsin Clinical Laboratory Science Workforce Survey, 2010 45
Appendix B: Survey Instrument
Wisconsin Clinical Laboratory Science Workforce Survey 2010
Name of Agency/Organization Name of Person Completing Survey Position of Person Completing Survey Telephone of Person Completing Survey E-mail of Person Completing Survey
Instructions: Please provide counts of employees by category for each of the three questions below. The Total for Table 1 and Table 2 should be the same, equal to the total number of persons employed by the laboratory. Table 3 asks for the number of full-time equivalents (FTEs), so the Total in Table 3 may be different from the Total in Table 1 and Table 2.
1. Age and gender of staff: Count each employee only once. Age Number of Males Number of Females Under 25 25-29 30-39 40-49 50-54 55-59 60+ Total
2. Race and Ethnicity: Count each employee only once.
Ethnicity: Number Hispanic/Latino Non-Hispanic/Latino Race: White Black/African American American Indian/Alaska Native Native Hawaiian /Other Pacific Islander Asian Other Total

Appendix
46 Wisconsin Clinical Laboratory Science Workforce Survey, 2010
3. Employment status of laboratory administrative and test personnel: Count each employee only once; classify each employee at his/her highest level of employment. Include staff on vacation or other paid leave. (Refer to the definitions below.)
Job title/discipline Number of FTEs
per Week Number of
FTE Vacancies Pathologists Pathology Assistants Managers/Administrators Certified Medical Technologists – MT(ASCP), CLS(NCA), etc.
Medical Technologists (non-certified) Certified Medical Laboratory Technicians – MLT(ASCP), CLT(NCA), etc.
Medical Laboratory Technicians (non-certified)
Phlebotomists Histotechnologists (Bachelor of Science degree, B.S.)
Histotechnician Cytologists Cytogenetic Technologists Molecular Biologists RN LPN CMA/MA CNA/NA Other Total
Definitions: MT (ASCP) = Medical Technologist certified by the American Society for Clinical Pathology. CLS (NCA) = Clinical Laboratory Scientist certified by the National Credentialing Agency for
Laboratory Personnel. MLT (ASCP) = Medical Laboratory Technician certified by the American Society for Clinical Pathology. CLT (NCA) = Clinical Laboratory Technician certified by the National Credentialing Agency for
Laboratory Personnel. LPN = Licensed Practical Nurse (met state licensure requirements as a licensed practical nurse). RN = Registered Nurse (met state licensure requirements as a registered nurse). CNA/NA = Nursing Assistant (received a Nursing Assistant Technical Diploma through a 120-hour
program which included skill pre-work, lecture, lab and clinical experiences; may be certified). CMA/MA = Medical Assistant (received a Medical Assistant Technical Diploma through a one-year,
two-semester, plus three-week program; may be certified). FTE = Full-time equivalent at 35+ hours/week.
4. How many employees in your laboratory are trained in the roles, expectations and operations of laboratories in emergency preparedness and response (bioterrorism, chemical emergencies, recent outbreaks and accidents)? The value must be greater than or equal to 0.
5. Does your laboratory have an established emergency preparedness and response plan
describing potential roles and responsibilities? Yes - No

Appendix
Wisconsin Clinical Laboratory Science Workforce Survey, 2010 47
Appendix C: Clinical Laboratory Science Education Programs in Wisconsin
Four colleges or universities in Wisconsin offer a Bachelor’s Degree in Clinical Laboratory Science and are approved by the National Accrediting Agency for Clinical Laboratory Sciences (NAACLS):
• University of Wisconsin - Madison * • Marquette University • University of Wisconsin - Milwaukee • University of Wisconsin - Stevens Point
Seven technical colleges in Wisconsin offer an Associate’s Degree in Clinical Laboratory Science and are approved by NAACLS:
• Chippewa Valley Technical College • Moraine Park Technical College • Northeast Wisconsin Technical College • Western Technical College • Madison Area Technical College (Madison College) • Milwaukee Area Technical College • Northcentral Technical College
*UW Madison’s CLS program will close in 2012.

Appendix
48 Wisconsin Clinical Laboratory Science Workforce Survey, 2010
P-00233 (11/10)

Wisconsin Department of Health Services Division of Public Health
P- 00233 (11/10)