Wireline Formation Testers Wireline formation testers are used to obtain Wireline formation testers...
35
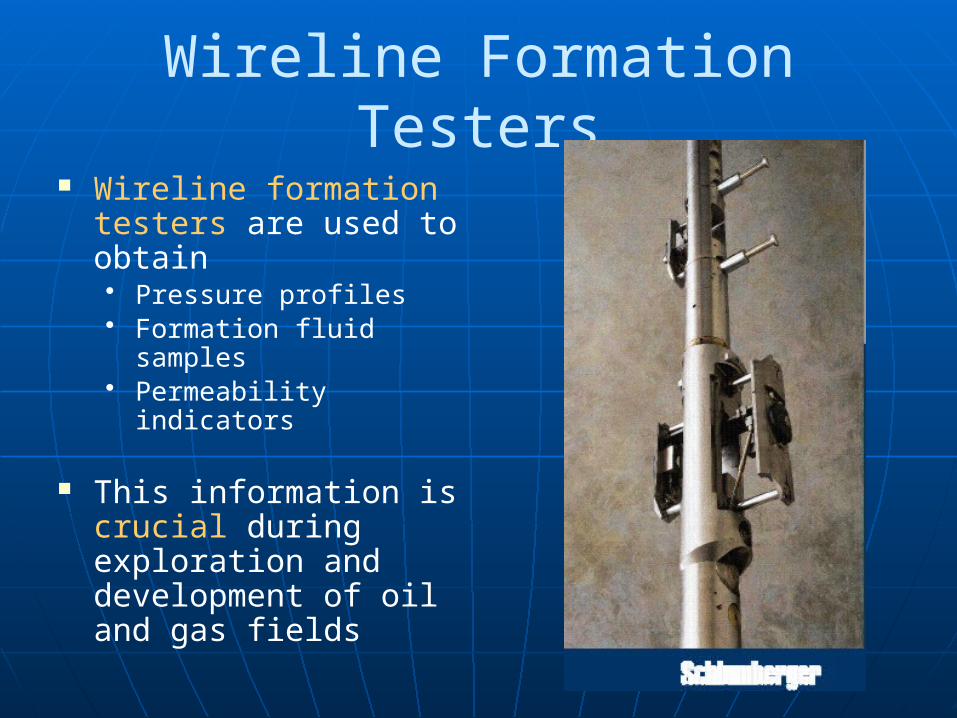
Wireline Formation Testers Wireline formation testers are used to obtain • Pressure profiles • Formation fluid samples • Permeability indicators This information is crucial during exploration and development of oil and gas fields
-
Upload
micah-boord -
Category
Documents
-
view
272 -
download
9
Transcript of Wireline Formation Testers Wireline formation testers are used to obtain Wireline formation testers...
Wireline Formation Testers Wireline formation
testers are used to obtain • Pressure profiles• Formation fluid samples• Permeability indicators
This information is crucial during exploration and development of oil and gas fields
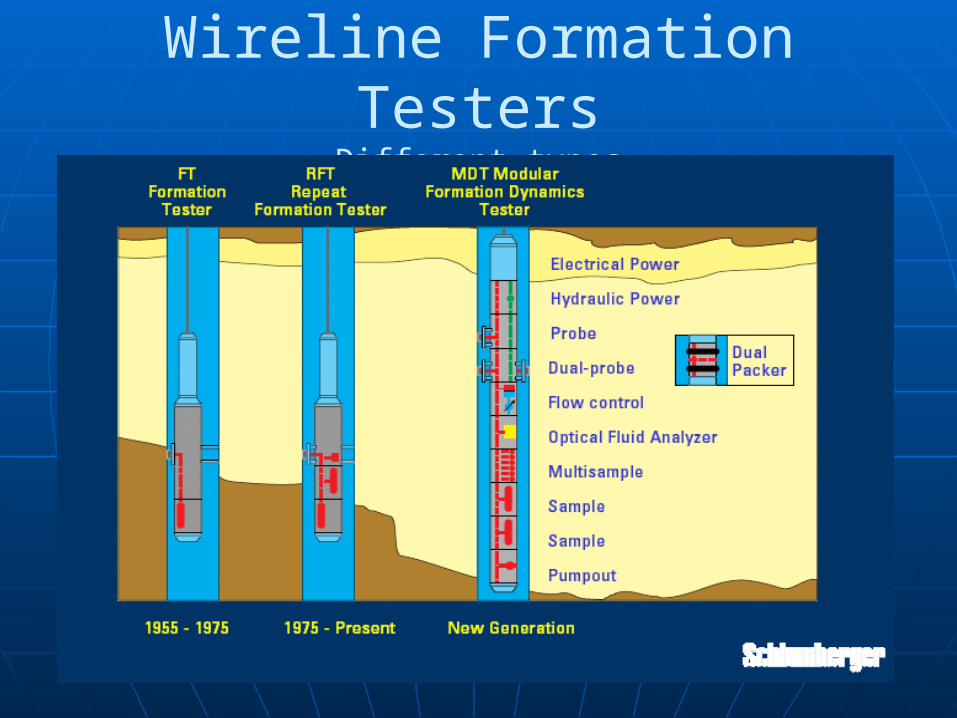
Wireline Formation TestersDifferent types
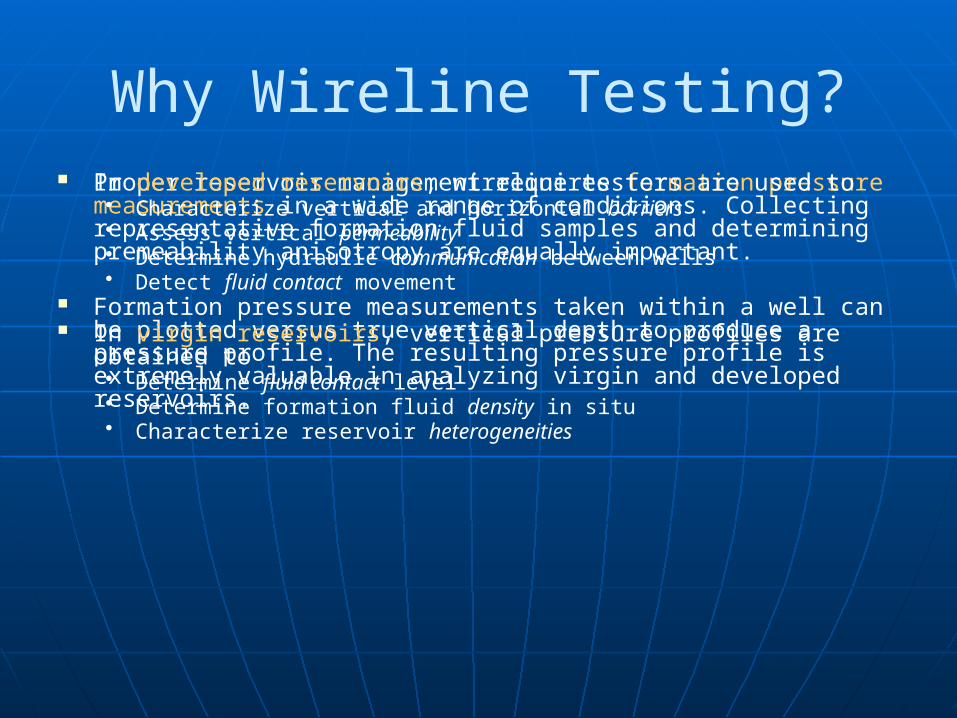
Why Wireline Testing? Proper reservoir management requires formation pressure
measurements in a wide range of conditions. Collecting representative formation fluid samples and determining premeability anisotropy are equally important.
Formation pressure measurements taken within a well can be plotted versus true vertical depth to produce a pressure profile. The resulting pressure profile is extremely valuable in analyzing virgin and developed reservoirs.
In developed reservoirs, wireline testers are used to • Characterize vertical and horizontal barriers• Assess vertical permeability• Determine hydraulic communication between wells• Detect fluid contact movement
In virgin reservoirs, vertical pressure profiles are obtained to• Determine fluid contact level• Determine formation fluid density in situ• Characterize reservoir heterogeneities

Why Wireline Testing? Wireline formation testers are also used to collect formation fluid
samples, the MDT tool attempts to improve the quality of samples by using techniques for downhole fluid analysis
Tests from wireline testers provide mobility profiles that help to pinpoint zones of better productivity. The recorded transient pressure response at each station can be analyzed to estimate permeability
In homogeneous formations, the multiprobe tester scan estimate horizontal and vertical mobilities
In laminated formations, this tool enables the study of potential permeability barriers and their effect on vertical fluid movement
Wireline formation testing data are essential for analyzing and improving reservoir performance and making reliable predictions, which are vital to optimizing reservoir development and management
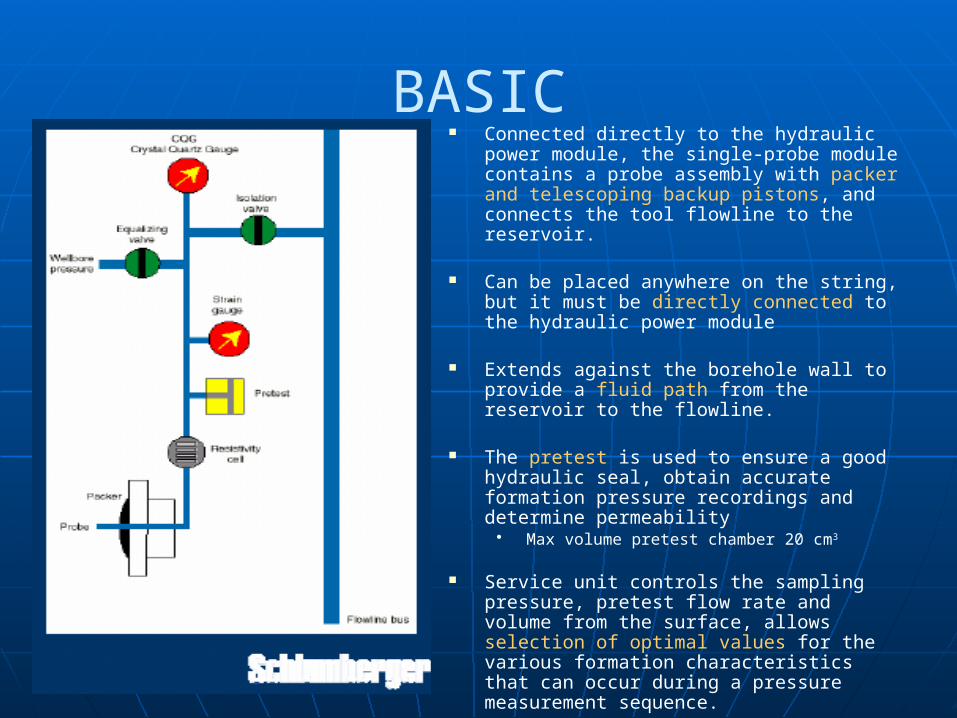
BASIC Connected directly to the hydraulic power
module, the single-probe module contains a probe assembly with packer and telescoping backup pistons, and connects the tool flowline to the reservoir.
Can be placed anywhere on the string, but it must be directly connected to the hydraulic power module
Extends against the borehole wall to provide a fluid path from the reservoir to the flowline.
The pretest is used to ensure a good hydraulic seal, obtain accurate formation pressure recordings and determine permeability
• Max volume pretest chamber 20 cm3
Service unit controls the sampling pressure, pretest flow rate and volume from the surface, allows selection of optimal values for the various formation characteristics that can occur during a pressure measurement sequence.
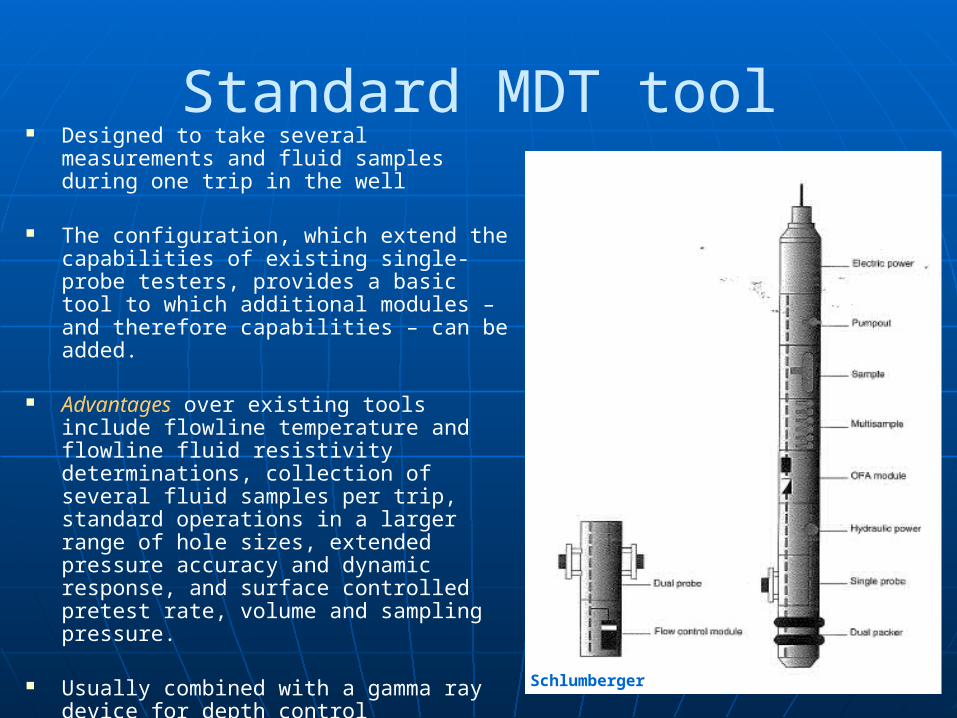
Standard MDT tool Designed to take several measurements
and fluid samples during one trip in the well
The configuration, which extend the capabilities of existing single-probe testers, provides a basic tool to which additional modules – and therefore capabilities – can be added.
Advantages over existing tools include flowline temperature and flowline fluid resistivity determinations, collection of several fluid samples per trip, standard operations in a larger range of hole sizes, extended pressure accuracy and dynamic response, and surface controlled pretest rate, volume and sampling pressure.
Usually combined with a gamma ray device for depth control
Schlumberger
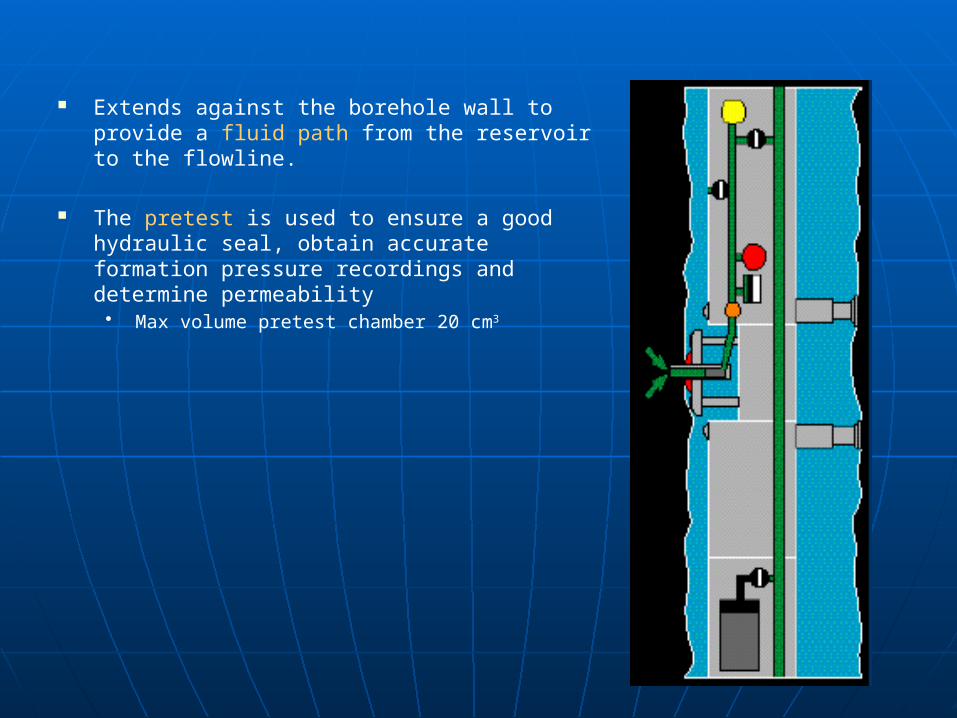
Extends against the borehole wall to provide a fluid path from the reservoir to the flowline.
The pretest is used to ensure a good hydraulic seal, obtain accurate formation pressure recordings and determine permeability• Max volume pretest chamber 20 cm3
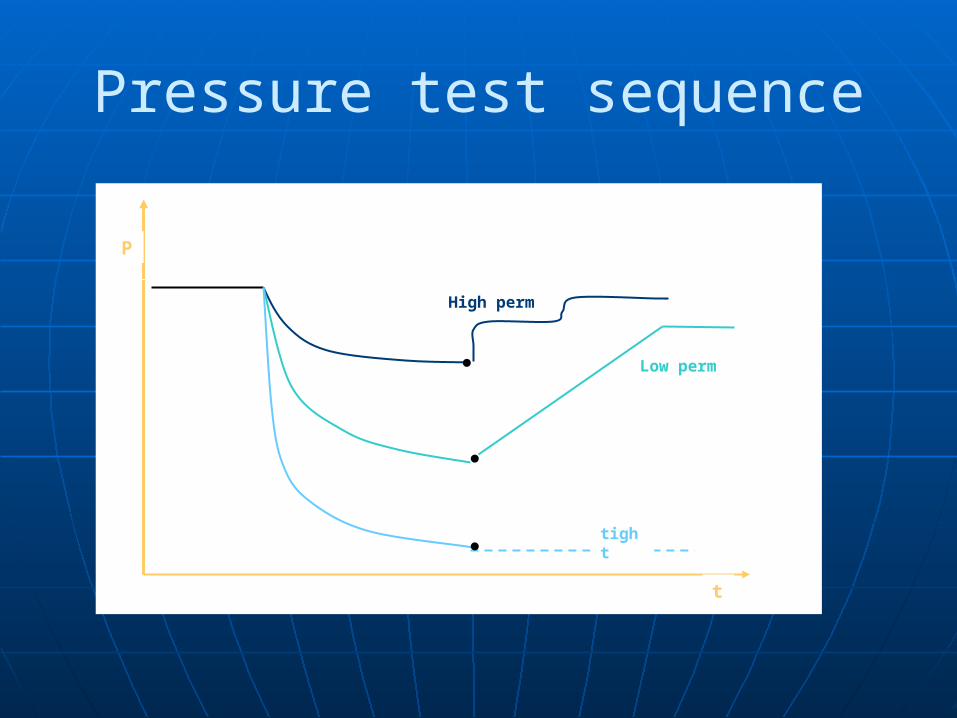
Pressure test sequence
P
t
tight
Low perm
High perm
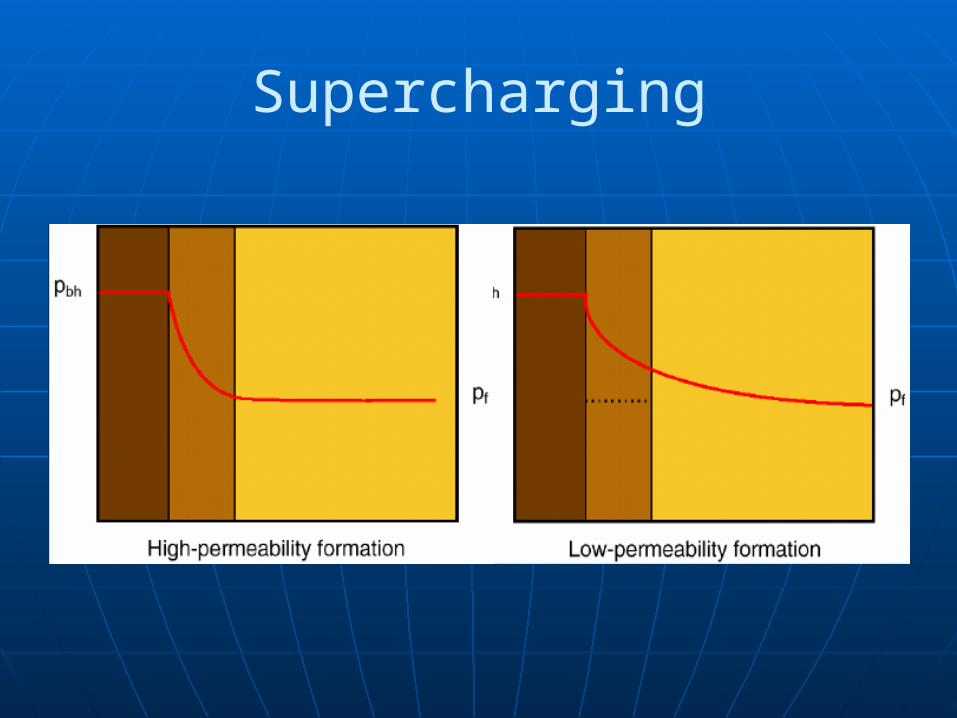
Supercharging

Supercharging In low-permeability formations, wireline formation pressure
measurements are sometimes hampered by the “supercharging” phenomenon.
Caused because the permeability of the mudcake is not exactly zero but has some small value. This permeability allows a finite continuous flow of filtrate across the mudcake.
In a low-permeability formation, the resistance to fluid flow because of the mudcake can be the same order of magnitude as the resistance of the formation to accepting fluid.
Thus, a standard wireline pressure measurement will not be sufficient to measure the pressure of the virgin formation, because a residual finite pressure difference remains between the formation at the mudcake interface and the virgin formation some distance away.
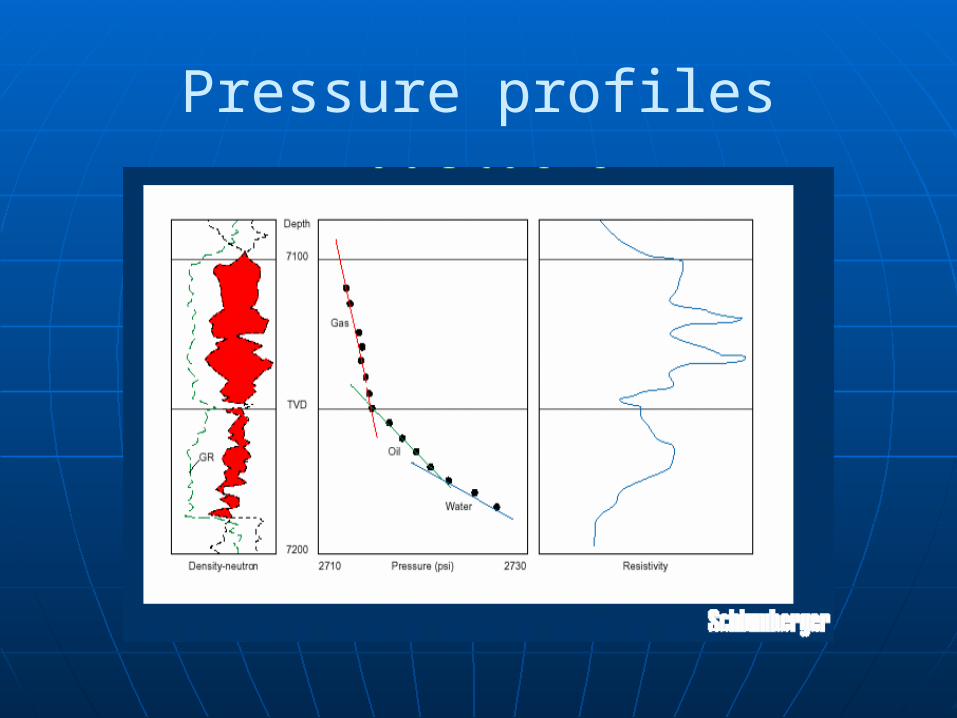
Pressure profiles

Pressure Profiles In thick reservoirs with relatively high permeabilities, vertical
pressure profiles are used to determine in-situ fluid densities and fluid contact level.
This type of pressure measurements requires gauge with high accuracy and resolution. Standard quartz gauges, although suitable for fluid gradient determination, require long stabilization times when subjected to sudden changes in temperature or pressure, a common occurrence during formation tests.
Strain gauges have a better dynamic response,but do not offer the accuracy or resolution needed for most fluid gradient determinations.
A new gauge was needed that could combine the accuracy and resolution of the quartz gauge with the dynamic response of the strain gauge. These requirements were met in the CQG (Crystal Quartz Gauge).

Free water level (FWL) from pressureResistivity Wm Pressure barSW
Oil/water contact
Free water level
0 1
Resistivity measurements New features include a flowline resistivity sensor and
temperature sensor and isolation valve.
The resistivity measurement helps to discriminate filtrate from water-base mud and formation fluids. Also useful when taking formation water samples in wells drilled with oil-base mud.
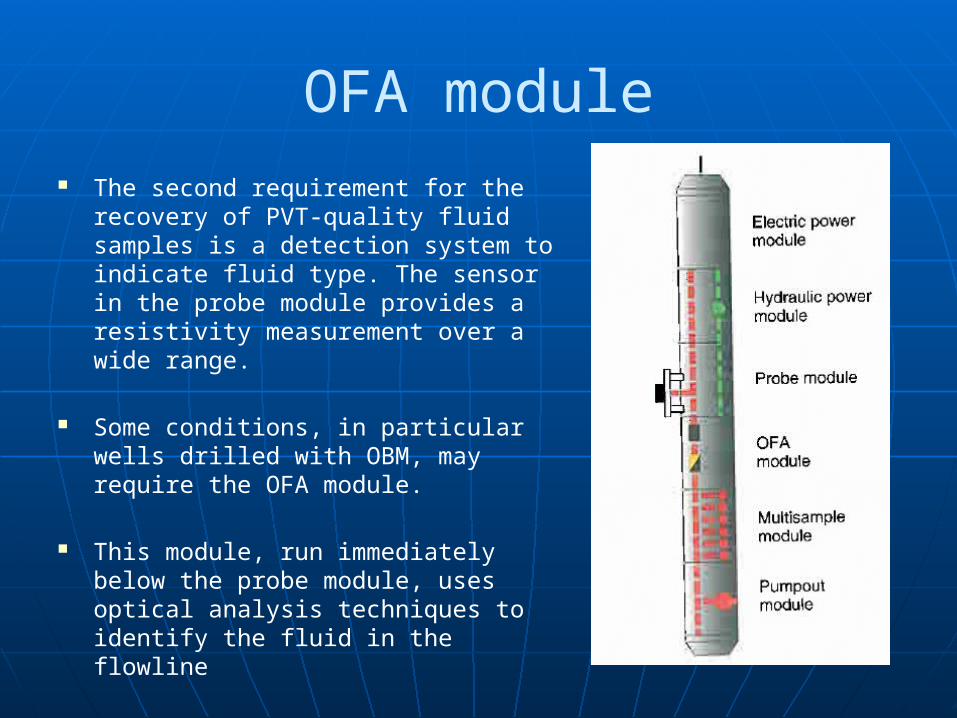
OFA module The second requirement for the
recovery of PVT-quality fluid samples is a detection system to indicate fluid type. The sensor in the probe module provides a resistivity measurement over a wide range.
Some conditions, in particular wells drilled with OBM, may require the OFA module.
This module, run immediately below the probe module, uses optical analysis techniques to identify the fluid in the flowline

OFA module OFA (Optical Fluid Analysis) is used for fluid analysis with two sensor systems:
one for liquid detection and analysis and the other for gas detection. The flowline passes through two independent optical sensors. In one cell, absorption spectroscopy is used to detect and analyze liquid. In the other cell, a special type of optical reflection measurement detect gas.
This allows wellsite personnel to decide whether to divert the flow into a sample chamber, or increase the sampling pressure above bubblepoint.
It can also be used to verify that the formation contains only water or only gas and that a sample is not required. Thus, the sample chambers in the tool are kept available for desired fluids only.
Even when OBM is used it is possible to track the transition from borehole mud, to filtrate, to connate oil as long as the two oils differs in color.
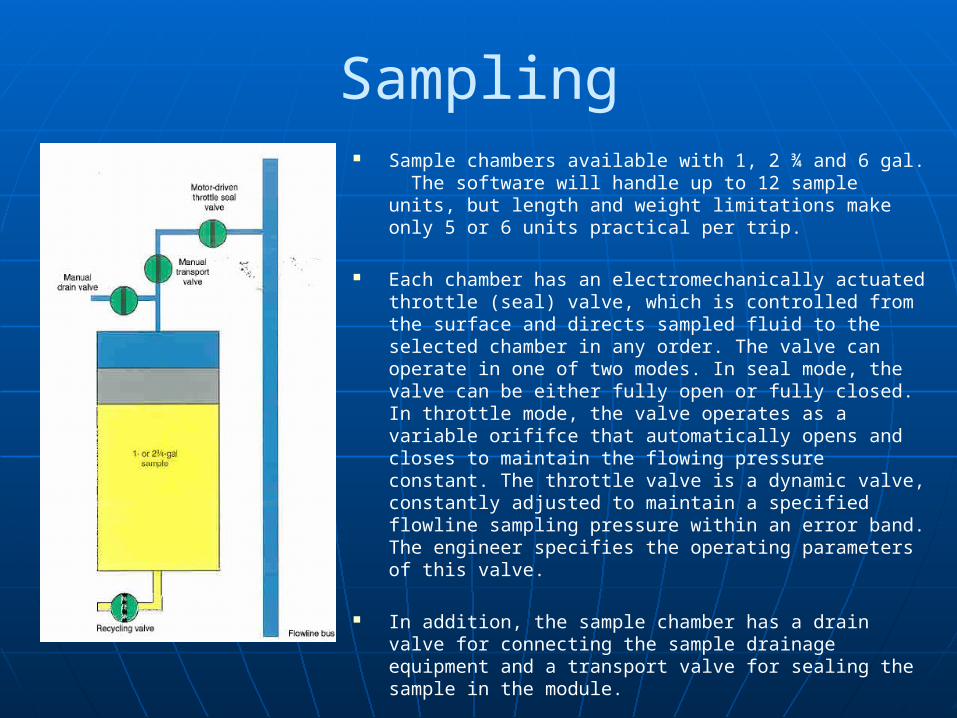
Sampling Sample chambers available with 1, 2 ¾ and 6 gal. The
software will handle up to 12 sample units, but length and weight limitations make only 5 or 6 units practical per trip.
Each chamber has an electromechanically actuated throttle (seal) valve, which is controlled from the surface and directs sampled fluid to the selected chamber in any order. The valve can operate in one of two modes. In seal mode, the valve can be either fully open or fully closed. In throttle mode, the valve operates as a variable orififce that automatically opens and closes to maintain the flowing pressure constant. The throttle valve is a dynamic valve, constantly adjusted to maintain a specified flowline sampling pressure within an error band. The engineer specifies the operating parameters of this valve.
In addition, the sample chamber has a drain valve for connecting the sample drainage equipment and a transport valve for sealing the sample in the module.

Dual packer Provides two inflatable packer elements to isolate a
borehole interval for testing and/or sampling. The pumpout module uses borehole fluid to inflate the packer elements to about 1000 psi above hydrostatic pressure. Spacing between the packer elements varies with the borehole size, min. distance is about 3 feet (92 cm). The entire borehole wall is open to the formation, so the fluid area is several 1000 x larger than with conventional probes.
Can be used as an alternative to conventional probes.
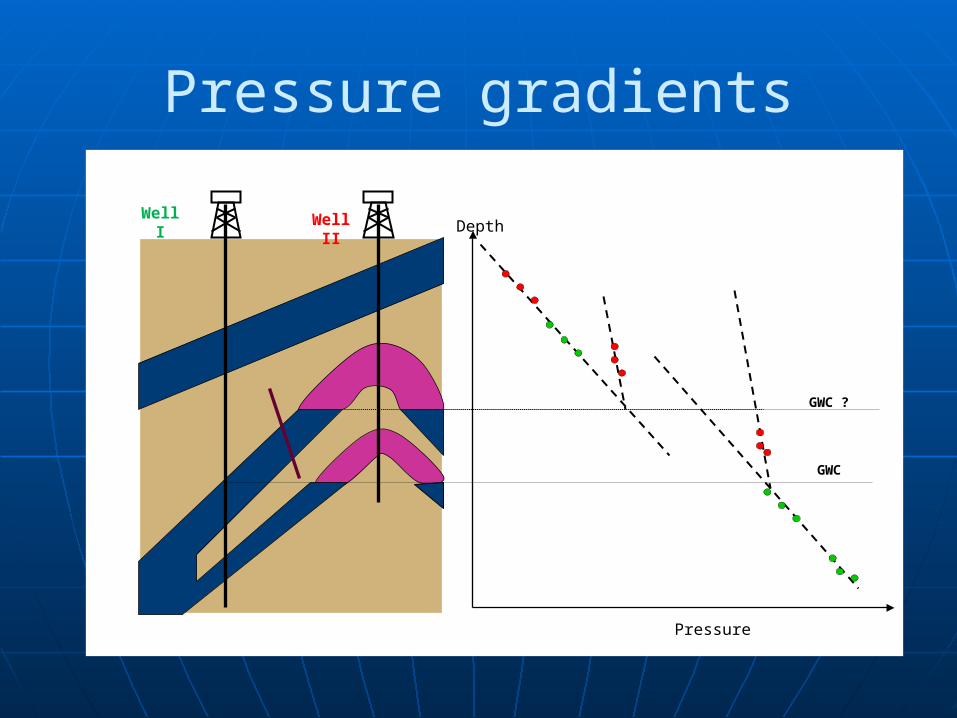
Extrapolating pressure gradients In some reservoirs, the gas-water contact cannot be identified by the
pressure profile of Well 1 or Well 2. Therefore, no estimate of reservoir volume can be made.
However, by extrapolating the water gradient of well 1 and the gas gradients of well 2, it is possible to determine the gas-water contacts and estimate reservoir volume. This extrapolation shows that pressure readings taken near the wellbore reflect pressures that exist deep within the formation.
Pressure
Depth
GWC ?
GWC
Well I Well II
Pressure gradients
Barrier detection Flow barriers have prevented formation fluids from reaching equilibrium
over geologic time. Because the fluid has not reached equilibrium, a potential difference exists on opposite sides of the barrier. This pressure potential means that formation fluid would flow if the barrier were removed. Variation in potential can easily be seen when carefully analyzing gradients and provides a means of identifying flow barriers.
Gradients may not be continuous through what is thought to be a single reservoir. In these instances, two or more similar of identical gradients can be identified; however, they can have a potential difference because of an existing flow barrier. Vertical flow barriers can be identified by this potential.
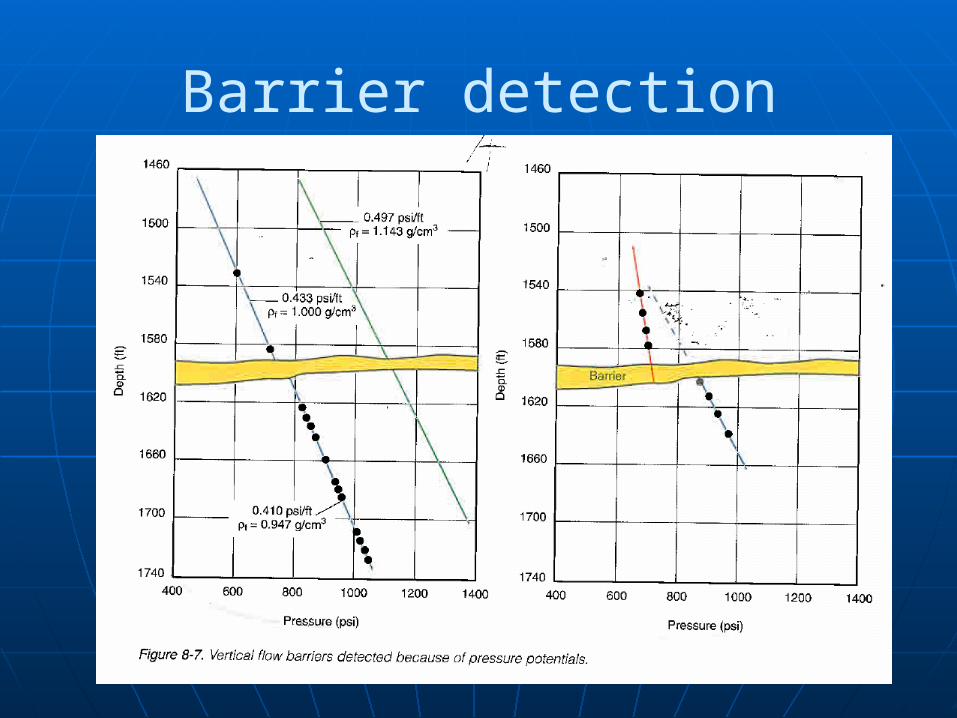
Barrier detection
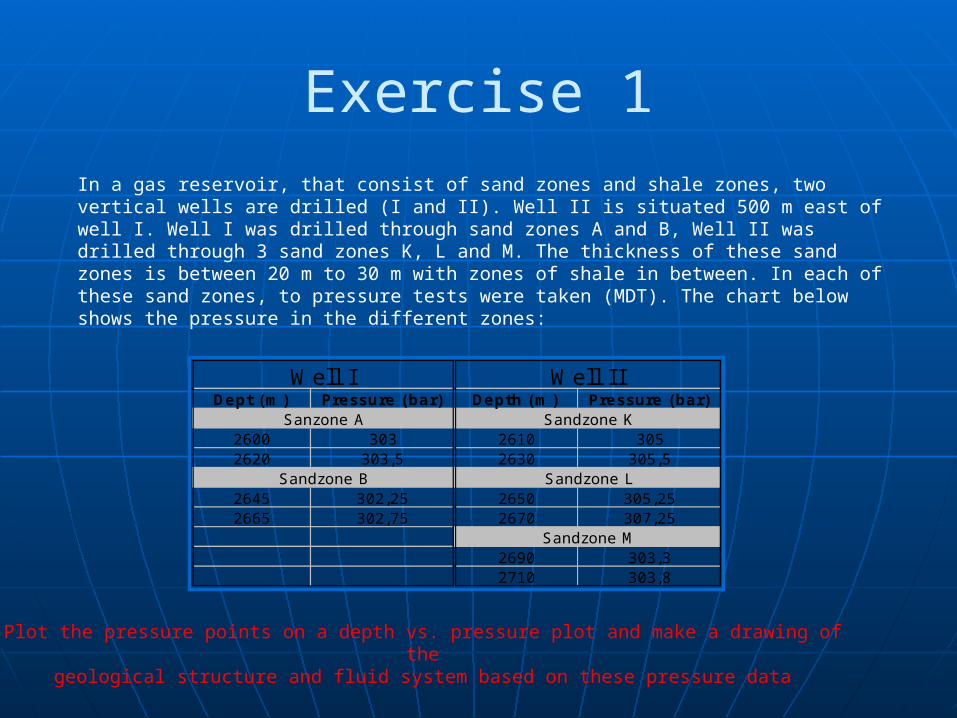
Exercise 1In a gas reservoir, that consist of sand zones and shale zones, two vertical wells are drilled (I and II). Well II is situated 500 m east of well I. Well I was drilled through sand zones A and B, Well II was drilled through 3 sand zones K, L and M. The thickness of these sand zones is between 20 m to 30 m with zones of shale in between. In each of these sand zones, to pressure tests were taken (MDT). The chart below shows the pressure in the different zones:
Dept (m) Pressure (bar) Depth (m) Pressure (bar)
2600 303 2610 3052620 303,5 2630 305,5
2645 302,25 2650 305,252665 302,75 2670 307,25
2690 303,32710 303,8
Sandzone B Sandzone L
Sandzone M
Well I Well I I
Sanzone A Sandzone K
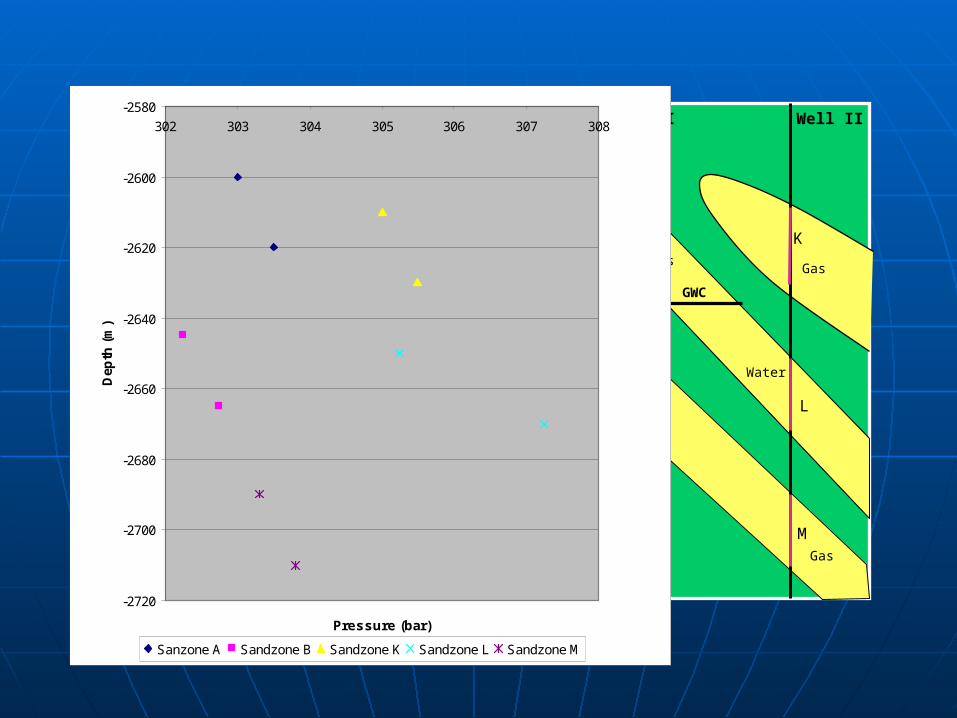
Plot the pressure points on a depth vs. pressure plot and make a drawing of thegeological structure and fluid system based on these pressure data
-2720
-2700
-2680
-2660
-2640
-2620
-2600
-2580
302 303 304 305 306 307 308
Pressure (bar)
Dep
th (
m)
Sanzone A Sandzone B Sandzone K Sandzone L Sandzone M
2637
Well I Well II
K
M
L
B
A
GWC
Gas
Water
Gas
Gas
Gas
ANSWER
A
K
B
M
L
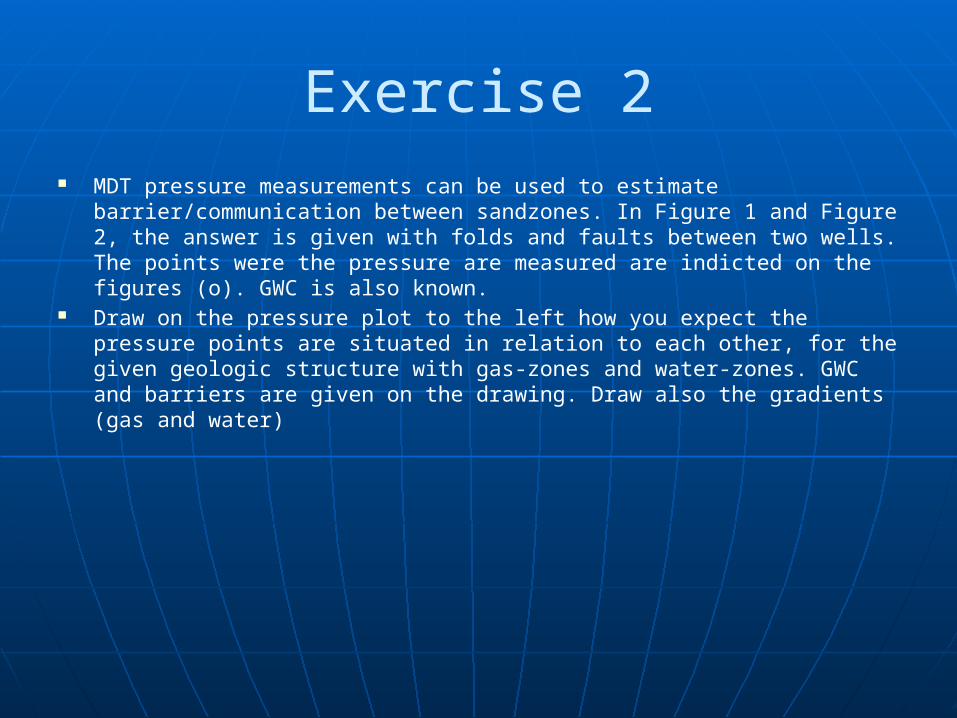
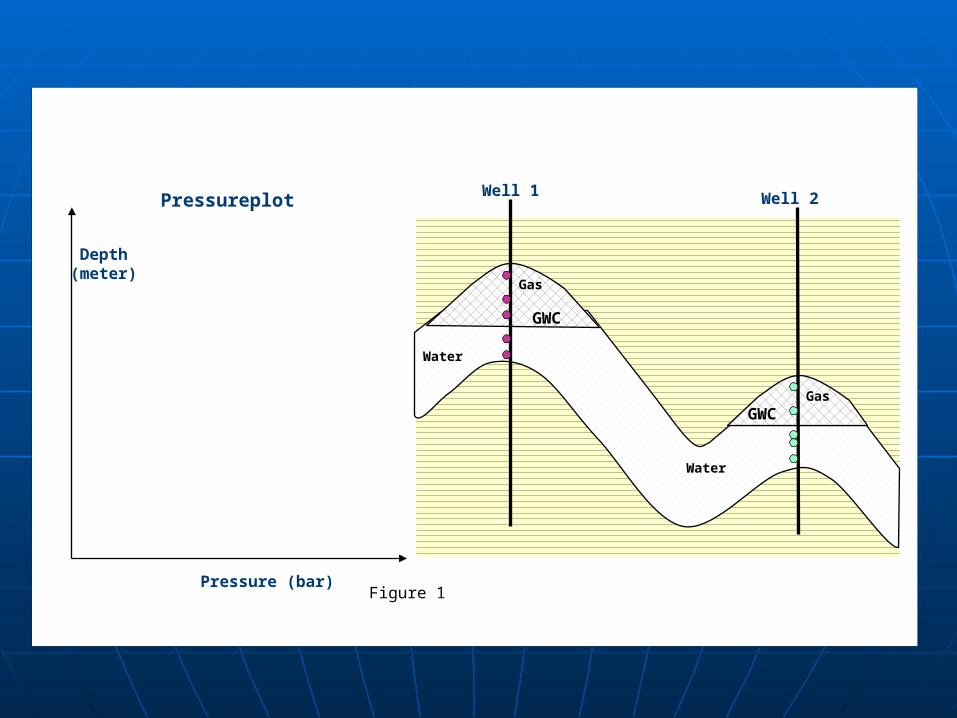
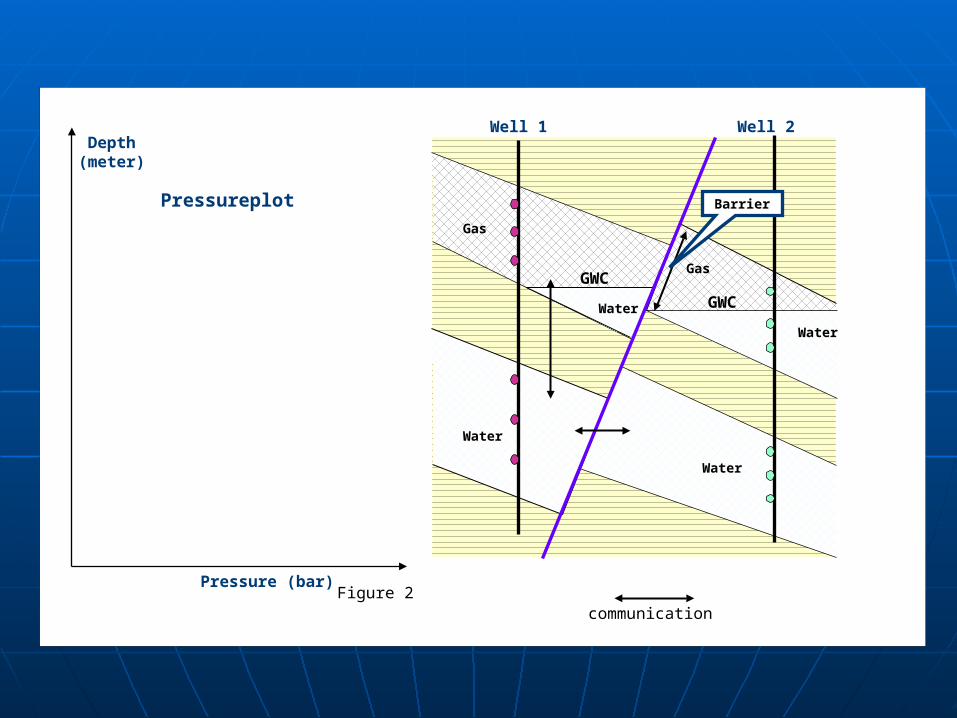
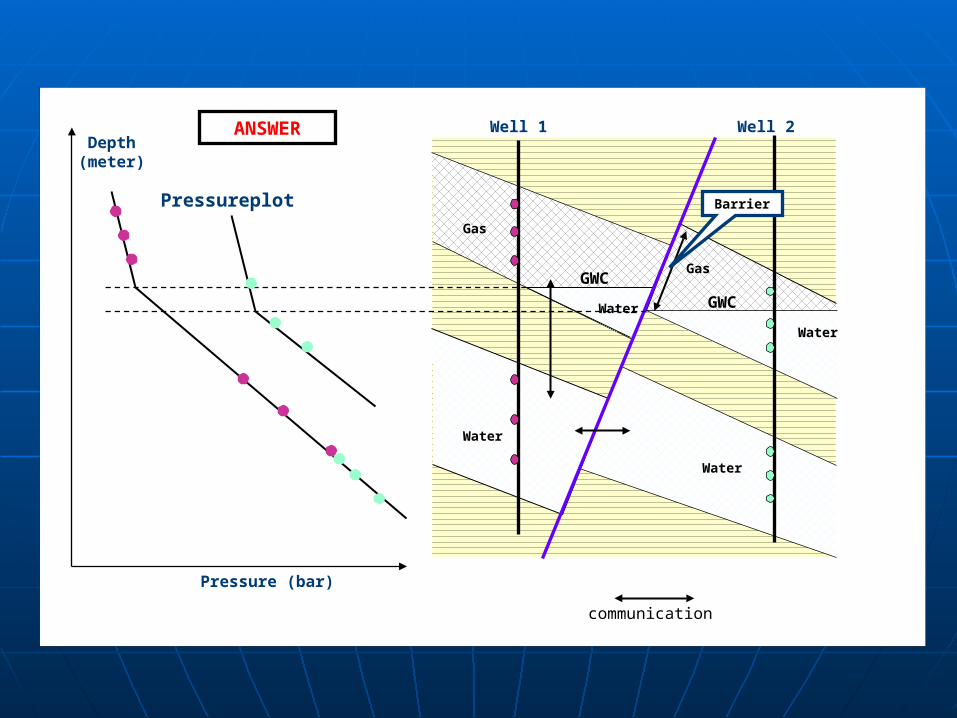
Exercise 2 MDT pressure measurements can be used to estimate
barrier/communication between sandzones. In Figure 1 and Figure 2, the answer is given with folds and faults between two wells. The points were the pressure are measured are indicted on the figures (o). GWC is also known.
Draw on the pressure plot to the left how you expect the pressure points are situated in relation to each other, for the given geologic structure with gas-zones and water-zones. GWC and barriers are given on the drawing. Draw also the gradients (gas and water)
Pressureplot
Depth (meter)
Pressure (bar)
Well 1 Well 2
Gas
Gas
GWC
GWC
Water
Water
Draw the
Draw the pressure pointsand
Figure 1Figure 1

Pressureplot
Depth (meter)
Pressure (bar)
Well 1 Well 2
Gas
Gas
GWC
GWC
Water
Water
ANSWER
Pressureplot
Depth (meter)
Pressure (bar)
GWC
Water
Well 1 Well 2
Water
Water
Gas
GWC
GWCGas
Water
Water
Barrier
communicationFigure 2
Pressureplot
Depth (meter)
Pressure (bar)
GWC
Water
Well 1 Well 2
Water
Water
Gas
GWC
GWCGas
Water
Water
Barrier
communication
ANSWER
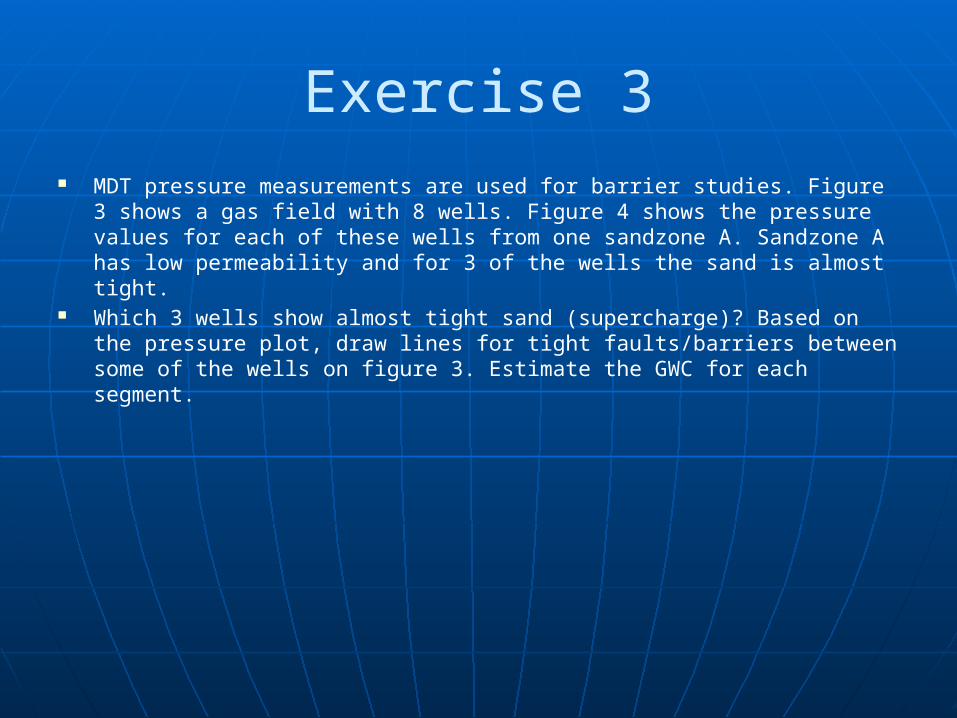
Exercise 3 MDT pressure measurements are used for barrier studies. Figure 3 shows a
gas field with 8 wells. Figure 4 shows the pressure values for each of these wells from one sandzone A. Sandzone A has low permeability and for 3 of the wells the sand is almost tight.
Which 3 wells show almost tight sand (supercharge)? Based on the pressure plot, draw lines for tight faults/barriers between some of the wells on figure 3. Estimate the GWC for each segment.
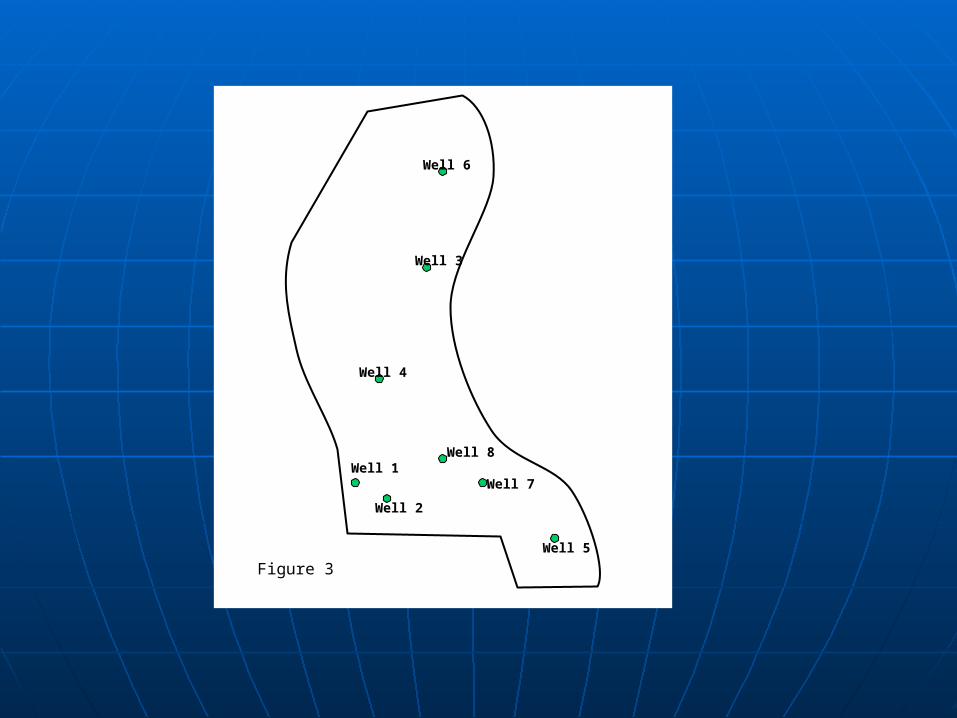
Well 1
Well 2
Well 3
Well 4
Well 5
Well 6
Well 7
Well 8
Figure 3
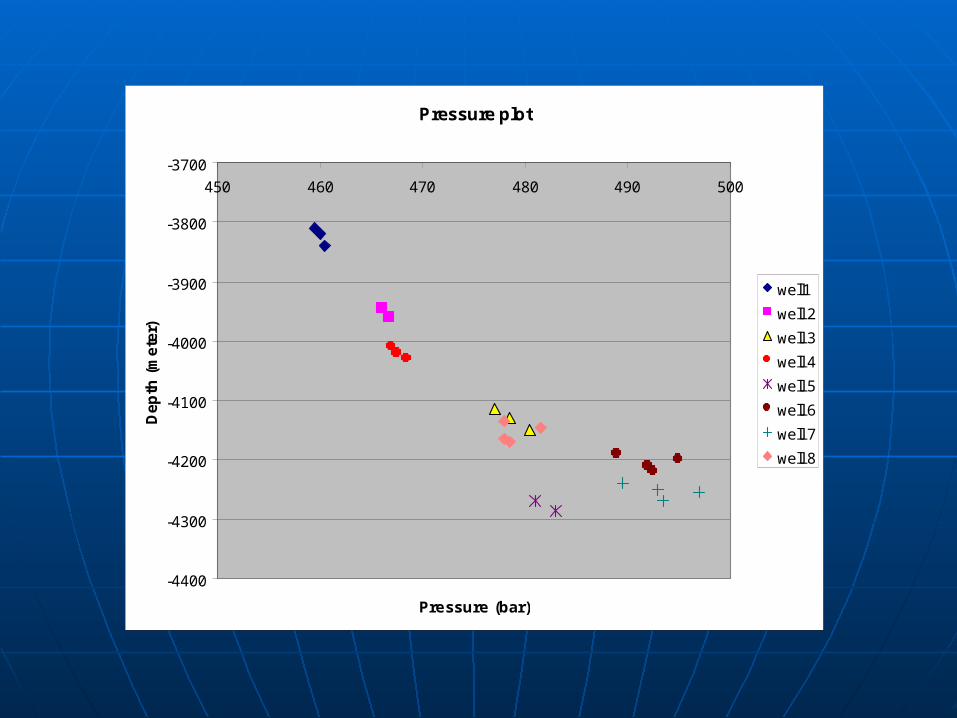
Pressure plot
-4400
-4300
-4200
-4100
-4000
-3900
-3800
-3700
450 460 470 480 490 500
Pressure (bar)
De
pth
(m
ete
r)
well1
well 2
well 3
well 4
well 5
well 6
well 7
well 8
Figure 4
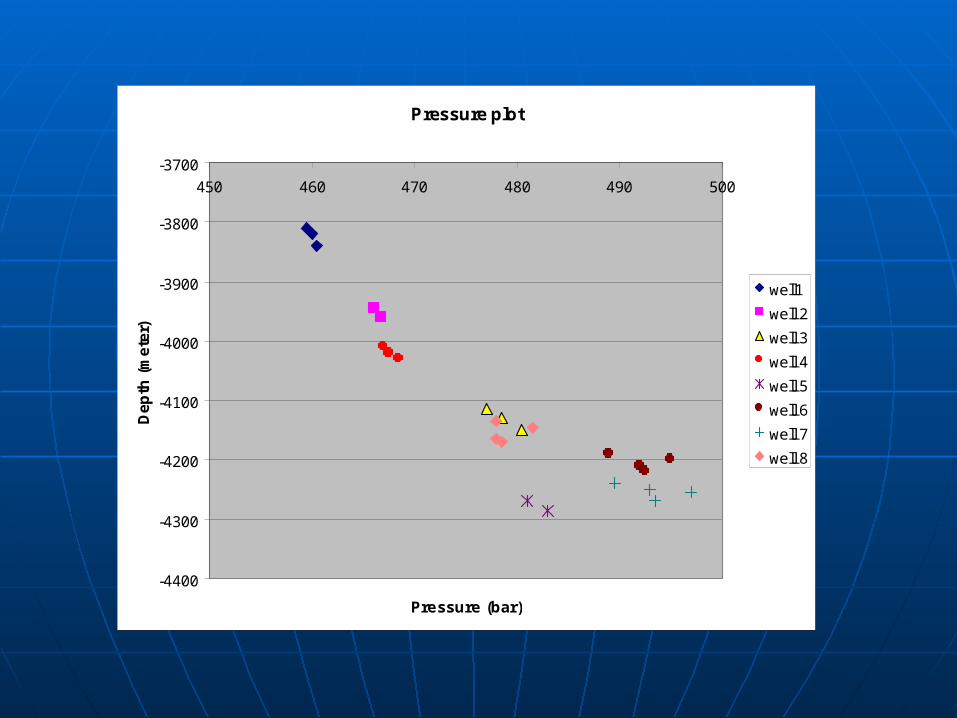
Pressure plot
-4400
-4300
-4200
-4100
-4000
-3900
-3800
-3700
450 460 470 480 490 500
Pressure (bar)
De
pth
(m
ete
r)
well1
well 2
well 3
well 4
well 5
well 6
well 7
well 8
ANSWER
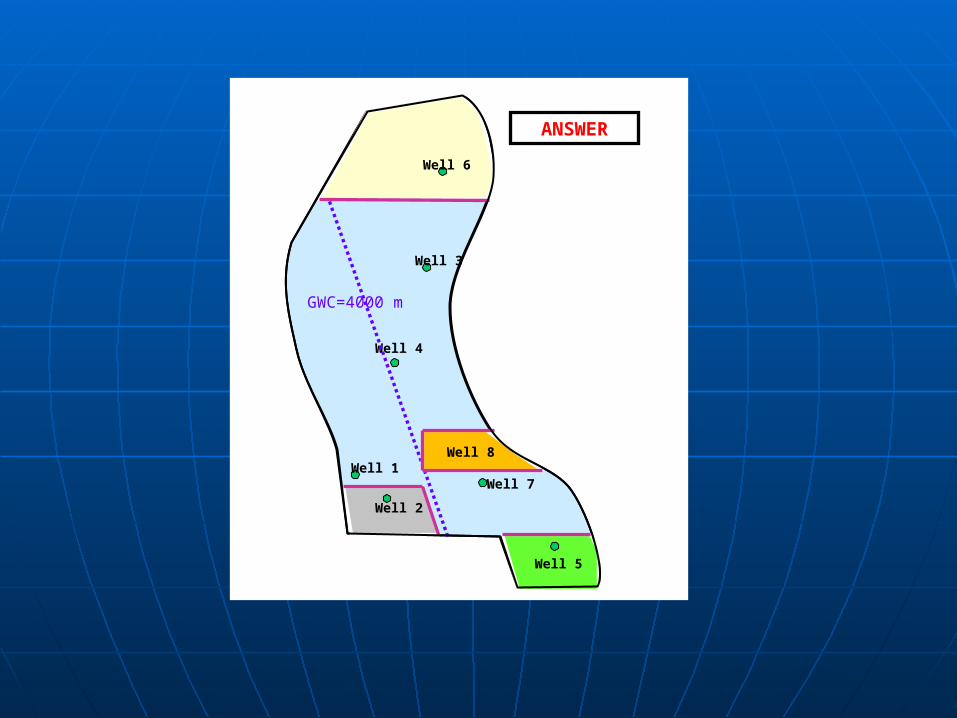
Well 1
Well 3
Well 4
Well 6
Well 7
GWC=4000 m
Well 8
Well 2
Well 5
ANSWER

About the Author
Karl Audun Lehne
Education:
University of Oslo & University of London
Experience:
UiS, Statoil, Total, IRIS, Statens Kartverk
Address:
UiS
E-mail: [email protected]
Phone: 91154518