Wireless Terms & Reference
54
-
Upload
harish-vadada -
Category
Technology
-
view
562 -
download
0
Transcript of Wireless Terms & Reference


Wireless Finance Terms and Reference (eBook Edition)
Version: 1
www.Telecom-cloud.net
Copyright © 2011 by Harish Vadada All rights reserved.
This book is distributed only as a Kindle eBook.
No part of the this work may be reproduced or transmitted in any form or by any means, electronic or mechanical,
including photocopying, recording, or by any information storage or retrieval system, without the prior written
permission of the copyright owner.
Permission is granted to redistribute electronically the unmodified and complete computer file that comprises the
PDF Edition of this work. This permission does not impair or restrict the author’s moral rights, or grant any
additional permission. Without the prior written permission of the copyright owner any or all of the following is
not permitted: (i) altering, editing, or otherwise modifying the file that comprises the PDF Edition of this work; (ii)
printing or publishing this work in any form (including but not limited to print on‐
demand services); (iii) selling, retailing, or offering in exchange for any kind of compensation the file that
comprises the PDF Edition of this work or any of its content; (iv) redistributing some or all extracted or excerpted
content from this work; (v) redistributing some or all content of this work in a different format (for example but
not limited to HTML or plain text).
The Telecom Cloud logo is a registered trademark of Telecom Cloud and can be used with permission.
Trademarked names may appear in this book. Rather than use a trademark symbol with every occurrence of a
trademarked name, we use the names only in an editorial fashion and to the benefit of the trademark owner, with
no intention of infringement of the trademark.
For information on translations and/or licensing, please email ebooks@telecom‐cloud.net
The information in this book is distributed on an “as is” basis without warranty. Although every precaution has
been taken in the preparation of this work, neither the author nor publishers shall have any liability to any person
or entity with respect to any loss or damage caused or alleged to be caused directly or indirectly by the
information contained in this work.

Introduction
As a technologist in the wireless industry for over a decade I have been flummoxed multiple times at the
financial terms and metrics that get mentioned. Hence, I decided to create this eBook to address all the
wireless financial terms and more to demystify the wireless metrics for a layman, having seen the
business in motion as an insider. The metrics described here are used as a standard to compare the
profitability and health of a network operator. My goal is to de‐mystify the business processes and aura
surrounding the buzzwords that are used in the wireless business.
I attribute this drive of mine to all the professors and teachers that I have associated with in my life.
They had made learning fun and in the process embedding in me the bug of lifelong association of
learning, teaching and mentoring. I come from a family of teachers – my grandfather was a teacher, my
dad’s first job was a teacher and he became a teacher after he retired from the corporate world. I
attribute this passion for sharing knowledge for being in my ‘genes’. And I fuel this passion of sharing my
knowledge online through my blog – www.telecom‐cloud.net as well as through a Social Training
network – www.gyanfinder.com of which I am a co‐founder.
I believe in Keeping it – Simple, honest and free! Please send me suggestions and improvements and let
me know if I can help you in your endeavor.
Acknowledgements
To my parents who made me; and my wife and kids who sustain me.

ACSI – (American Customer Satisfaction Index) Created by the National Quality Research Center at the
University of Michigan. ACSI reports scores on a 0‐100 scale at the national level and produces indexes
for 10 economic sectors, 47 industries (including e‐commerce and e‐business), more than 225
companies, and over 200 federal or local government services. In addition to the company‐level
satisfaction scores, ACSI produces scores for the causes and consequences of customer satisfaction and
their relationships. The measured companies, industries, and sectors are broadly representative of the
U.S. economy serving American households. ACSI releases results on a monthly basis to bring
stakeholders in‐depth coverage of various sectors of the economy throughout the entire calendar year.
The national index is updated quarterly, factoring in ACSI scores from more than 225 companies in 47
industries; 2 local government services; and over 200 programs, services, and websites offered by 130
federal agencies.(URL: www.theacsi.org/)
_____________________________________________________________________________________
AAL – (Add‐a‐Line) Add another phone service line to an existing account.
_____________________________________________________________________________________
Advantages of Proposition – Unique Selling Proposition (USP), competitive advantage for the seller to
stand apart from competition. It is a marketing concept that was first proposed as a theory to explain a
pattern among successful advertising campaigns of the early 1940s. It states that such campaigns made
unique propositions to the customer and that this convinced them to switch brands. The term was
invented by Rosser Reeves of Ted Bates & Company. Today the term is used in other fields or just
casually to refer to any aspect of an object that differentiates it from similar objects.
Pinpointing USP requires some hard soul‐searching and creativity. One way to start is to analyze how
other companies use their USPs to their advantage. This requires careful analysis of other companies'
ads and marketing messages. A careful analysis of what they say they sell, not just their product or
service characteristics, we can learn a great deal about how companies distinguish themselves from
competitors e.g. Neiman Marcus sells luxury, while Wal‐Mart sells bargains.
_____________________________________________________________________________________
Amortization – depreciation of intangible assets. When used in the context of a home purchase,
amortization is the process by which the loan principal decreases over the life of the loan. With each
mortgage payment that is made, a portion of the payment is applied towards reduction of the principal
and another portion of the payment is applied towards paying the interest on the loan. While
amortization and depreciation are often used interchangeably, technically this is an incorrect practice
because amortization refers to intangible assets and depreciation refers to tangible assets.
The amortization calculator formula is:

Or, equivalently
Where: P is the principal amount borrowed, A is the periodic payment, r is the periodic interest rate
divided by 100 (annual interest rate also divided by 12 in case of monthly installments), and n is the total
number of payments (for a 30‐year loan with monthly payments n = 30 × 12 = 360).
Negative amortization (also called deferred interest) occurs if the payments made do not cover the
interest due. The remaining interest owed is added to the outstanding loan balance, making it larger
than the original loan amount.
_____________________________________________________________________________________
AMPU – (Average Margin per user) AMPU stands for Average Margin per User and is the difference
between the cost of serving a user and the revenue that the user generates. AMPU can be positive or
negative. Higher the AMPU, the greater the profit.
AMPU = ARPU – Average Cost per User
Or
AMPU = Total Margin/ Number of Subscribers
AMPU takes into consideration both Revenue and Cost. Types of revenue factors.
Non Recurring Revenue: These are the revenue sources that are one time charge for the customer and
are to be recovered as soon as the customer enters the network.
Activation Charges
Security Deposit
Recurring Revenue: These are recovered as and when the customer makes a usage or avail off certain
Rental services.
_____________________________________________________________________________________
ARPU – (Average Revenue per User) Service Revenue divided by number of subscribers. ARPU is
commonly calculated by dividing the aggregate amount of revenue by the total number of users who
provide that revenue. Other measurements are tracked as well, including the revenue generated by new
customers as compared with the revenue generated by existing customers and the revenue generated
by new services as compared with the revenue generated by existing services.
ARPU is not the best indicator of carrier’s health. Average Margin Per User (AMPU) or Average Profit Per
User (APPU) per month or over the life of the subscriber are better measures of carrier’s strategy and
execution, however, since such details are not public knowledge, ARPU trending over time provides a

good glimpse into how things are progressing with a carrier or within a given market. Higher wireless
data ARPU is directly correlated to a company's success in selling additional services to individual
customers using creative business models that empower the entire ecosystem, device customization
that enhances user experience and brand loyalty, and applications and services that benefit the
customers. Growth in ARPU is likely to be more profitable than increasing the number of customers; the
increases in costs are likely to be less than those incurred by raising the number of customers.
Blended ARPU: weighted average ARPU of all customers (eg. Post‐paid and Pre‐paid customers or Voice
and Data customers)
_____________________________________________________________________________________
Asset Turnover – Sales divided by Average Total Assets. This measures the efficiency of a company’s use
of its assets in generating sales revenue. There are a few variations on this, depending on what measure
of assets is used. The most obvious is total assets, i.e., fixed assets + current assets. This measures how
many dollars in sales is generated for each dollar invested in assets.
Revenue obviously comes from the income statement
Net assets = total assets less total liabilities
The resulting figure is expressed as a “number of times per year”
From an investor's point of view, it can be argued that current liabilities should be deducted from the
amount of assets used. Investors are concerned with returns on their investment; therefore the funding
of current assets from current liabilities can be ignored.
Taking this further what investors care about is the sales generated by their investment, i.e. equity +
debt. This leaves us using the same denominator as ROCE (return on capital employed). Using this
definition thereby gives us a nice decomposition:
ROCE = EBIT margin ×asset turnover
_____________________________________________________________________________________
Bad Debt ‐ portion of receivables that can no longer be collected. Bad debt in accounting is considered
an expense. This usually occurs when the debtor has declared bankruptcy or the cost of pursuing further
action in an attempt to collect the debt exceeds the debt itself. When debts are classified as bad, they
are charged as a cost on the profit and loss account. Because a certain level of bad debt is expected, it is
common practice for companies to make a provision for the amount of debt that is expected to become
bad.

_____________________________________________________________________________________
Basis Points (bps) – A basis point is a unit of measure used in finance to describe the percentage change
in the value or rate of a financial instrument. One basis point is equivalent to 0.01% (1/100th of a
percent) or 0.0001 in decimal form. In most cases, it refers to changes in interest rates and bond yields.
For example, if the Federal Reserve Board raises interest rates by 25 basis points, it means that rates
have risen by 0.25% percentage points. If rates were at 2.50%, and the Fed raised them by 0.25%, or 25
basis points, the new interest rate would be 2.75%. In the bond market, a basis point is used to refer to
the yield that a bond pays to the investor. For example, if a bond yield moves from 7.45% to 7.65%, it is
said to have raised 20 basis points.
The usage of the basis point measure is primarily used in respect to yields and interest rates, but it may
also be used to refer to the percentage change in the value of an asset such as a stock. It may be heard
that a stock index moved up 134 basis points in the day's trading. This represents a 1.34% increase in the
value of the index.
1 basis point = 1 permyriad = one one-hundredth percent
1 bp = 1/100% = 0.01% = 0.1‰ = 10−4 = 1⁄10000 = 0.0001
It is frequently, but not exclusively, used to express differences in interest rates of less than 1% per year.
For example, a difference of 0.10% is equivalent to a change of 10 basis points (e.g. a 4.67% rate
increases by 10 basis points to 4.77%).
Like percentage points, basis points avoid the ambiguity between relative and absolute discussions
about interest rates by dealing only with the absolute change in numeric value of a rate. For example, if
a report says there has been a "1% increase" from a 10% interest rate, this could refer to an increase
either from 10% to 10.1% (relative, 1% of 10%), or from 10% to 11% (absolute, 1% plus 10%). If,
however, the report says there has been a "10 basis point increase" from a 10% interest rate, then we
know that the interest rate of 10% has increased by 0.10% (the absolute change) to a 10.1% rate. It is
common practice in the financial industry to use basis points to denote a rate change in a financial
instrument, or the difference (spread) between two interest rates, including the yields of fixed‐income
securities.
_____________________________________________________________________________________
Below the Line – expenses such as depreciation that are not directly controllable by a business owner,
therefore excluded from certain P&Ls.
Accounting: Used to characterize items in an account that are excluded from the account total, such as
appropriations and extraordinary items that have no effect on the profit or loss in the current
accounting period.

Advertising: Used to characterize promotional methods (such as catalog marketing, direct marketing,
and trade fair marketing) those are under the direct control of the marketer (client) and earn no
commissions for the advertising agency.
_____________________________________________________________________________________
Benchmarking – process of comparing one’s business processes and performance metrics to industry
bests and/or best practices from other industries. Dimensions typically measured are quality, time, and
cost. Improvements from learning mean doing things better, faster, and cheaper.
Benchmarking involves looking outward (outside a particular business, organization, industry, region or
country) to examine how others achieve their performance levels and to understand the processes they
use. In this way benchmarking helps explain the processes behind excellent performance. When the
lessons learnt from a benchmarking exercise are applied appropriately, they facilitate improved
performance in critical functions within an organization or in key areas of the business environment.
Application of benchmarking involves four key steps:
Understand in detail existing business processes
Analyze the business processes of others
Compare own business performance with that of others analyzed
Implement the steps necessary to close the performance gap
Benchmarking should not be considered a one‐off exercise. To be effective, it must become an ongoing,
integral part of an ongoing improvement process with the goal of keeping abreast of ever‐improving
best practice.
Strategic Benchmarking: Where businesses need to improve overall performance by examining the long‐
term strategies and general approaches that have enabled high‐performers to succeed. It involves
considering high level aspects such as core competencies, developing new products and services and
improving capabilities for dealing with changes in the external environment.
Performance or Competitive Benchmarking: Businesses consider their position in relation to
performance characteristics of key products and services. Benchmarking partners are drawn from the
same sector. This type of analysis is often undertaken through trade associations or third parties to
protect confidentiality.
Process Benchmarking: Focuses on improving specific critical processes and operations. Benchmarking
partners are sought from best practice organizations that perform similar work or deliver similar
services.
Functional Benchmarking: Businesses look to benchmark with partners drawn from different business
sectors or areas of activity to find ways of improving similar functions or work processes. This sort of
benchmarking can lead to innovation and dramatic improvements. Improving activities or services for
which counterparts do not exist.

Internal Benchmarking: Involves benchmarking businesses or operations from within the same
organization (e.g. business units in different countries). The main advantage of internal benchmarking is
that access to sensitive data and information is easier; standardized data is often readily available; and,
usually less time and resources are needed.
External Benchmarking: Involves analyzing outside organizations that are known to be best in class.
External benchmarking provides opportunities of learning from those who are at the "leading edge".
This type of benchmarking can take up significant time and resource to ensure the comparability of data
and information, the credibility of the findings and the development of sound recommendations.
International Benchmarking: Best practitioners are identified and analyzed elsewhere in the world,
perhaps because there are too few benchmarking partners within the same country to produce valid
results. Globalization and advances in information technology are increasing opportunities for
international projects. However, these can take more time and resources to set up and implement and
the results may need careful analysis due to national differences.
_____________________________________________________________________________________
Blue Ocean Strategy – high growth and profit can be generated by creating new demand in an
uncontested market space of industries and/or markets not in existence today, a “Blue Ocean,” instead
of competing head to head for known customers in an existing industry, a “Red Ocean.” Blue oceans, in
contrast, denote all the industries not in existence today—the unknown market space, untainted by
competition. In blue oceans, demand is created rather than fought over. There is ample opportunity for
growth that is both profitable and rapid. In blue oceans, competition is irrelevant because the rules of
the game are waiting to be set. Blue Ocean is an analogy to describe the wider, deeper potential of
market space that is not yet explored. Cirque du Soleil ‐ an example of creating a new market space, by
blending opera and ballet with the circus format while eliminating star performer and animals. (URL:
http://www.blueoceanstrategy.com/)
_____________________________________________________________________________________
Business Model – describes the rationale of how an organization creates, delivers, and captures value.
The process of business model construction is part of business strategy. A business model is used for a
broad range of informal and formal descriptions to represent core aspects of a business, including
purpose, offerings, strategies, infrastructure, organizational structures, trading practices, and
operational processes and policies. Hence, it gives a complete picture of an organization from a high‐
level perspective.
Whenever a business is established, it either explicitly or implicitly employs a particular business model
that describes the architecture of the value creation, delivery, and capture mechanisms employed by
the business enterprise. The essence of a business model is that it defines the manner by which the
business enterprise delivers value to customers, entices customers to pay for value, and converts those
payments to profit: it thus reflects management’s hypothesis about what customers want, how they

want it, and how an enterprise can organize to best meet those needs, get paid for doing so, and make a
profit.
A business model draws on several business processes including economics, entrepreneurship, finance,
marketing, operations and strategy. Some of the main components addressed by a business model are,
Value Proposition: A description of a customer problem and how the product looks to mitigate this.
Market Segment: A group of customers that is targeted by the ensuing product.
Value Chain Structure: The company's position and activities in the value chain and how the firm looks
to capture this value chain.
Revenue generation and margins: How revenue for the company is generated ‐ sales, subscriptions,
support and the cost structure associated as well as the targeted profit.
Competitive Analysis and Strategy: Identify existing competitors and how the company will address to
develop a sustainable advantage over competitors.
_____________________________________________________________________________________
Buyer’s Remorse – Customer cancels service without incurring ETF within the remorse period & has
returned the device. It may stem from fear of making the wrong choice, guilt over extravagance, or a
suspicion of having been overly influenced by the seller. The anxiety may be rooted in various factors,
such as: the person's concern they purchased the wrong product, purchased it for too high a price,
purchased a current model now rather than waiting for a newer model, purchased in an ethically
unsound way, purchased on credit that will be difficult to repay, or purchased something that would not
be acceptable to others.
A prospective buyer often feels positive emotions associated with a purchase (desire, a sense of
heightened possibilities, and an anticipation of the enjoyment that will accompany using the product,
for example); afterwards, having made the purchase, they are more fully able to experience the
negative aspects: all the opportunity costs of the purchase, and a reduction in purchasing power.
Also, before the purchase, the buyer has a full array of options, including not purchasing; afterwards,
their options have been reduced to:
Continuing with the purchase, surrendering all alternatives
Renouncing the purchase
Buyer's remorse can also be caused or increased by worrying that other people may later question the
purchase or claim to know better alternatives.
_____________________________________________________________________________________
CAGR – (Compound Annual Growth Rate) annualized gain of an investment over a given time period.
CAGR is often used to describe the growth over a period of time of some element of the business, for
example revenue, units delivered, registered users, etc.

CAGR is the best formula for evaluating how different investments have performed over time. Investors
can compare the CAGR in order to evaluate how well one stock performed against other stocks in a peer
group or against a market index. The CAGR can also be used to compare the historical returns of stocks
to bonds or a savings account.
When using the CAGR, it is important to remember two things: the CAGR does not reflect investment
risk, and the same time periods must be used. Investment returns are volatile, meaning they can vary
significantly from one year to another, and CAGR does not reflect volatility. CAGR is a pro forma number
that provides a "smoothed" annual yield, so it can give the illusion that there is a steady growth rate
even when the value of the underlying investment can vary significantly. This volatility, or investment
risk, is important to consider when making investment decisions.
_____________________________________________________________________________________
Cannibalization – reduction in sales volume, sales revenue, or market share of one product as a result of
the introduction of a new product by the same producer. If a company is practicing market
cannibalization, it is eating its own market. For example, say Pepsi puts out a new product called Pepsi
chill, and customers buy Pepsi chill instead of regular Pepsi. Although sales may be up for the new
product, these sales may be eating into Pepsi's original market, in which case the overall company sales
would not be increasing. Because of the possibility of market cannibalization, investors should always
dig deeper, analyzing the source and impact of the success of a company's new but similar product.
Identification of cannibalization is by no means clear‐cut and needs to take into account of the dynamics
of the market. This needs examination by three methods.
Gains loss analysis
Duplication of purchase
Deviations from expected share movements
_____________________________________________________________________________________
Capacity Charge – cost of sustaining and expanding a wireless carrier’s infrastructure, can be assigned to
users based on bandwidth usage or other methodology. The capacity charge, sometimes called Demand
Charge, is assessed on the amount of capacity being purchased.
_____________________________________________________________________________________
Capacity Utilization – extent to which an enterprise actually uses its productive capacity. It refers to the
relationship between actual output that 'is' produced with the installed equipment and the potential
output which 'could' be produced with it, if capacity was fully used.

_____________________________________________________________________________________
CAPEX/Capex (Capital Expenditure) – investment to create future benefits. A capital expenditure is
incurred when a business spends money either to buy assets or to add to the value of an existing asset
with a useful life that extends beyond the taxable year. Also referred to as Capital Investments, for tax
purposes, CAPEX is a cost which cannot be deducted in the year in which it is paid or incurred and must
be capitalized. The general rule is that if the acquired property's useful life is longer than the taxable
year, then the cost must be capitalized. The capital expenditure costs are then amortized or depreciated
over the life of the asset in question.
Included in capital expenditures are amounts spent on:
Acquiring fixed, and in some cases, intangible assets
Repairing an existing asset so as to improve its useful life
Upgrading an existing asset if its results in a superior fixture
Preparing an asset to be used in business
Restoring property or adapting it to a new or different use
Starting or acquiring a new business
_____________________________________________________________________________________
Cap-and-trade – A market mechanism designed to reduce the cost of cutting pollution. The regulator
caps pollution at a level below business‐as‐usual and allocates allowances to industry up to but not
exceeding the cap. Covered entities must have their emissions independently verified and must
surrender allowances to match their annual emissions each year, normally with penalties for non‐
compliance. Since the overall cap is below actual emissions, this cuts the overall level of pollution and
creates a scarcity of allowances, and therefore a monetary value. Those with a surplus may sell them to
those with a shortfall, creating a tradable market for allowances.
_____________________________________________________________________________________
Capital Efficiency – ratio of output divided by CAPEX. The larger the ratio, the better the capital
efficiency. The basic formula for calculating capital efficiency involves dividing the average value of
output by the rate of expenditure for the same period of time. Output divided by expenditure will help
to make it clear if a venture is currently generating a modest profit, is approaching a point where
profitability will be realized once expenditures are decreased, or if there is no real value in continuing to
fund the venture. While the latter situation is one to avoid at all costs, the two former possible states
are not situations that should be considered negative.
Because many business ventures begin with a higher level of capital expenditures, a project rarely
realizes a profit in the first stages of the operation. The expectation is that after the initial launch, some
expenses will be settled and not be recurring. As the rate of expenditure decreases and the output or
production increases, the opportunity for profit expands. For this reason, periodic calculation of the
capital efficiency of a project can help investors know that the project is heading in the right direction.

_____________________________________________________________________________________
Capital Intensity – A business process or an industry that requires large amounts of money and other
financial resources to produce a good or service. A business is considered capital intensive based on the
ratio of the capital required to the amount of labor that is required.
Some industries commonly thought of as capital intensive include oil production and refining,
telecommunications and transports such as railways and airlines. Another example is the auto industry
which is capital‐intensive because, in order to make cars, it requires a lot of workers and expensive
equipment that must be properly maintained. Another, smaller scale example is a dentist office, which
requires expensive equipment and materials. In order to stay afloat, capital intensive companies need
either consistently large profits or inexpensive credit.
_____________________________________________________________________________________
Capital Injection – An investment of capital generally in the form of cash or equity ‐ and rarely, assets ‐
into a company or institution. The word "injection" connotes that the company or institution into which
capital is being invested may be floundering or in some distress, although it is not uncommon for the
term to also refer to investments made in a start‐up or new company.
Capital injections in the private sector are usually made in exchange for an equity stake in the company
into which capital is being injected. However, governments may make capital injections into struggling
sectors to assist in their stabilization in the larger public interest; in such cases, a government may or
may not negotiate an equity stake in recipient companies or institutions.
_____________________________________________________________________________________
Cash Cost Per User (CCPU) – Measure of the monthly cost to serve a customer, derived by dividing total
operating costs by average number of users. It is a measure of the monthly costs to operate the
business on a per subscriber basis consisting of costs of service and operations, and general and
administrative expenses of consolidated statement of operations, plus handset subsidies on equipment
sold to existing subscribers, less stock‐based compensation expense.
_____________________________________________________________________________________
Churn – average number of customers discontinuing service during a period. The broad definition of
churn is the action that a customer’s telecommunications service is canceled. This includes both service‐
provider initiated churn and customer initiated churn. An example of service‐provider initiated churn is a
customer’s account being closed because of payment default. Customer initiated churn is more
complicated and the reasons behind vary. Examples of reason codes are: unacceptable call quality, more
favorable competitor’s pricing plan, misinformation given by sales, customer expectation not met, billing
problem, moving, and change in business, and so on.
Churn can be shown as follows:

Monthly Churn = (C0 + A1 - C1) / C0
Where:
C0 = Number of customers at the start of the month
C1 = Number of customers at the end of the month
A1 = Gross new customers during the month
As an example, suppose a carrier has 100 customers at the start of the month, acquires 20 new
customers during the month, and has 110 customers at the end of the month. It must have lost 10
customers during the month, 10 percent of the customers it had at the start of the month.
According to the formula:
Monthly Churn = (100 + 20 - 110) / 100 = 10%
In an intensely competitive environment, customers receive numerous incentives to switch and
encounter numerous disincentives to stay.
Price: Particularly in the wireless and long‐distance markets, carriers often offer pricing promotions,
such as relatively low monthly fees, high‐volume offerings (fixed number of minutes at a reasonable fee
per month), and low rates per‐minute.
Service quality: Lack of connection capabilities or quality in places where the customer requires service
can cause customers to abandon their current carrier in favor of one with broader reach or a more
robust network.
Fraud: Customers may attempt to “game the system” by generating high usage volumes and avoiding
payment by constantly churning to the next competitor.
Lack of carrier responsiveness: Slow or no response to customer complaints is a sure path to a customer
relations disaster. Broken promises, long hold times when the customer reports problems, and multiple
complaints related to the same issue are sure to lead to customer churn.
Lack of features: Customers may switch carriers for features not provided by their current carrier. This
might include the inability of a particular carrier to be the “one‐stop shop” for the entire customer’s
Communications needs.
New technology or product introduced by competitors: New technologies such as high‐speed data or
bundled high‐value phone offerings like iPhone —create significant opportunities for carriers to entice
competitors’ customers to switch.
Billing or service disputes: Billing errors, incorrectly applied payments, and disputes about service
disruptions can cause customers to switch carriers. Depending on the situations, such churn may be
avoidable.
_____________________________________________________________________________________
COGS – (Cost of Goods Sold) direct costs attributable to the production of products or services sold by a
company. It includes cost of materials and labor used in creation, as well as indirect expenses such as
distribution costs and sales force costs. For example, the COGS for a PC maker would include the

material costs for the parts that go into making the PC along with the labor costs used to put the
computer together. The cost of sending the computer to sellers like Bestbuy and the cost of the labor
used to sell them would be excluded. The exact costs included in the COGS calculation will differ from
one type of business to another. The cost of goods attributed to a company’s products is expensed as
the company sells these goods. There are several ways to calculate COGS but one of the more basic
ways is to start with the beginning inventory for the period and add the total amount of purchases made
during the period then deducting the ending inventory. This calculation gives the total amount of
inventory or, more specifically, the cost of this inventory, sold by the company during the period.
_____________________________________________________________________________________
Competitive Advantage – A competitive advantage is an advantage over competitors gained by offering
consumers greater value, either by means of lower prices or by providing greater benefits and service
that justifies higher prices. In other words it is a position of a company in a competitive landscape that
allows them to earn return on investments higher than the cost of investments.
Differentiation Strategy: This strategy involves selecting one or more criteria used by buyers in a market
‐ and then positioning the business uniquely to meet those criteria. This strategy is usually associated
with charging a premium price for the product ‐ often to reflect the higher production costs and extra
value‐added features provided for the consumer. Differentiation is about charging a premium price that
more than covers the additional production costs, and about giving customers clear reasons to prefer
the product over other, less differentiated products. eg. Porsche
Cost Leadership Strategy: With this strategy, the objective is to become the lowest‐cost producer in the
industry. Many (perhaps all) market segments in the industry are supplied with the emphasis placed
minimizing costs. If the achieved selling price can at least equal (or near) the average for the market,
then the lowest‐cost producer will (in theory) enjoy the best profits. This strategy is usually associated
with large‐scale businesses offering "standard" products with relatively little differentiation that are
perfectly acceptable to the majority of customers. Occasionally, a low‐cost leader will also discount its
product to maximize sales, particularly if it has a significant cost advantage over the competition and, in
doing so, it can further increase its market share. eg. Wal‐Mart, Dell Computers
Differentiation Focus Strategy: In the differentiation focus strategy, a business aims to differentiate
within just one or a small number of target market segments. The special customer needs of the
segment mean that there are opportunities to provide products that are clearly different from
competitors who may be targeting a broader group of customers. The important issue for any business
adopting this strategy is to ensure that customers really do have different needs and wants ‐ in other
words that there is a valid basis for differentiation ‐ and that existing competitor products are not
meeting those needs and wants. eg. Perfumania, All things remembered
Cost Focus Strategy: Here a business seeks a lower‐cost advantage in just one or a small number of
market segments. The product will be basic ‐ perhaps a similar product to the higher‐priced and
featured market leader, but acceptable to sufficient consumers. Such products are often called "me‐
too's". eg. Many smaller retailers featuring own‐label or discounted label products.

_____________________________________________________________________________________
Contra Account – account on a financial statement (balance sheet and P&L) that offsets the activity of a
related and corresponding account. When it comes to an example of how one account offsets another
account, perhaps the easiest illustration would be to take an account that records accumulated
amortization into account. In order to balance the debit position associated with the amortization, an
opposite or contra account with the balance sheet structure will represent a credit that essentially
offsets the amortized figure. This helps to maintain a balance between debits and credits in the
bookkeeping process.
However, it must be understood that the concept of the contra account does not always involve a credit
offsetting a debit. The basic function of a contra account is simply to be an opposite of another account.
This means that an account showing a debit would be a type of contra account usually known as a
contra‐liability account. By the same token, an account with a credit would be balanced by a contra‐
asset account.
_____________________________________________________________________________________
Core – accounts and services for customers with good credit who are billed after services are received.
_____________________________________________________________________________________
Cost-Benefit Analysis – economic tool that weighs the total expected costs against the total expected
benefits of one or more actions in order to choose the best or most profitable option.
Cost Benefit Analysis is an economic tool to aid decision‐making, and is typically used by organizations to
evaluate the desirability of a given intervention in markets. Cost‐benefit analysis is mostly, but not
exclusively, used to assess the value for money of very large private and public sector projects. This is
because such projects tend to include costs and benefits that are less amenable to being expressed in
financial or monetary terms (e.g. environmental damage), as well as those that can be expressed in
monetary terms. Private sector organizations tend to make much more use of other project appraisal
techniques, such as rate of return, where feasible.
The practice of cost‐benefit analysis differs between countries and between sectors (e.g. transport,
health) within countries. Some of the main differences include the types of impacts that are included as
costs and benefits within appraisals, the extent to which impacts are expressed in monetary terms and
differences in discount rate between countries.
_____________________________________________________________________________________
Covered POP - Population covered by a wireless network’s coverage footprint.
_____________________________________________________________________________________
CPGA - Cost Per Gross Add. A ratio used to quantify the costs of acquiring one new customer to a
business. Often, the CPGA ratio is used by companies that offer subscription services to clients, such as
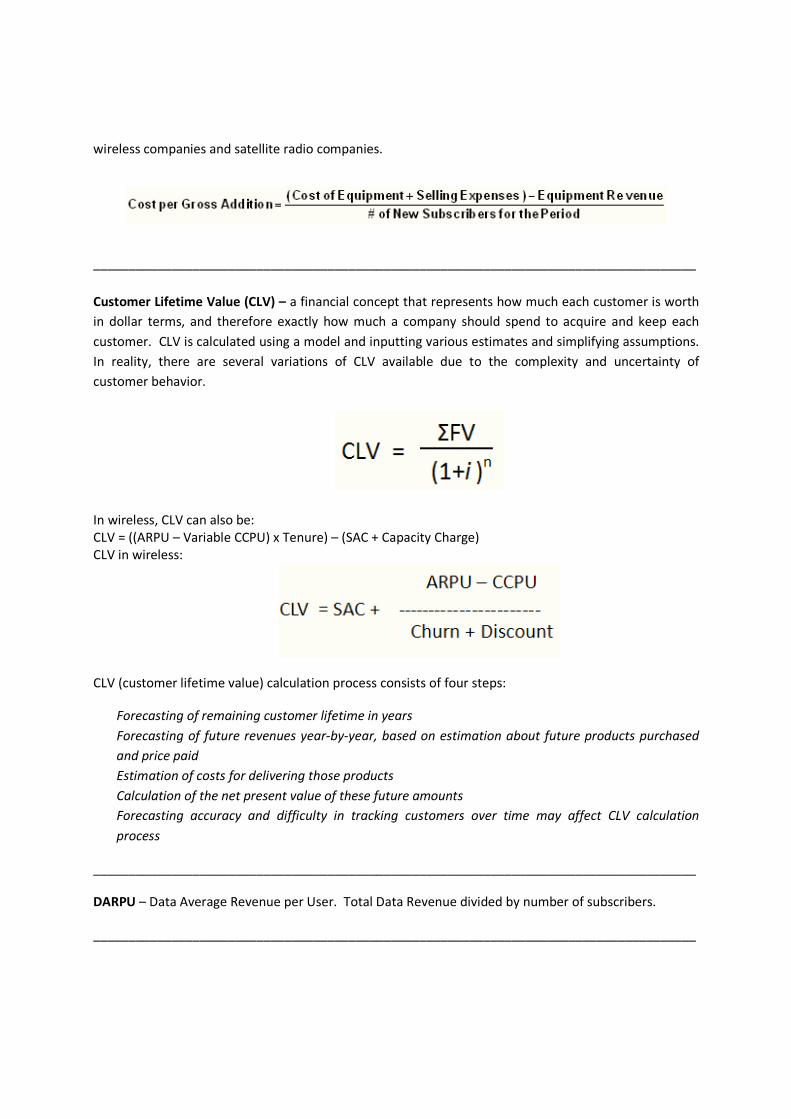
wireless companies and satellite radio companies.
_____________________________________________________________________________________
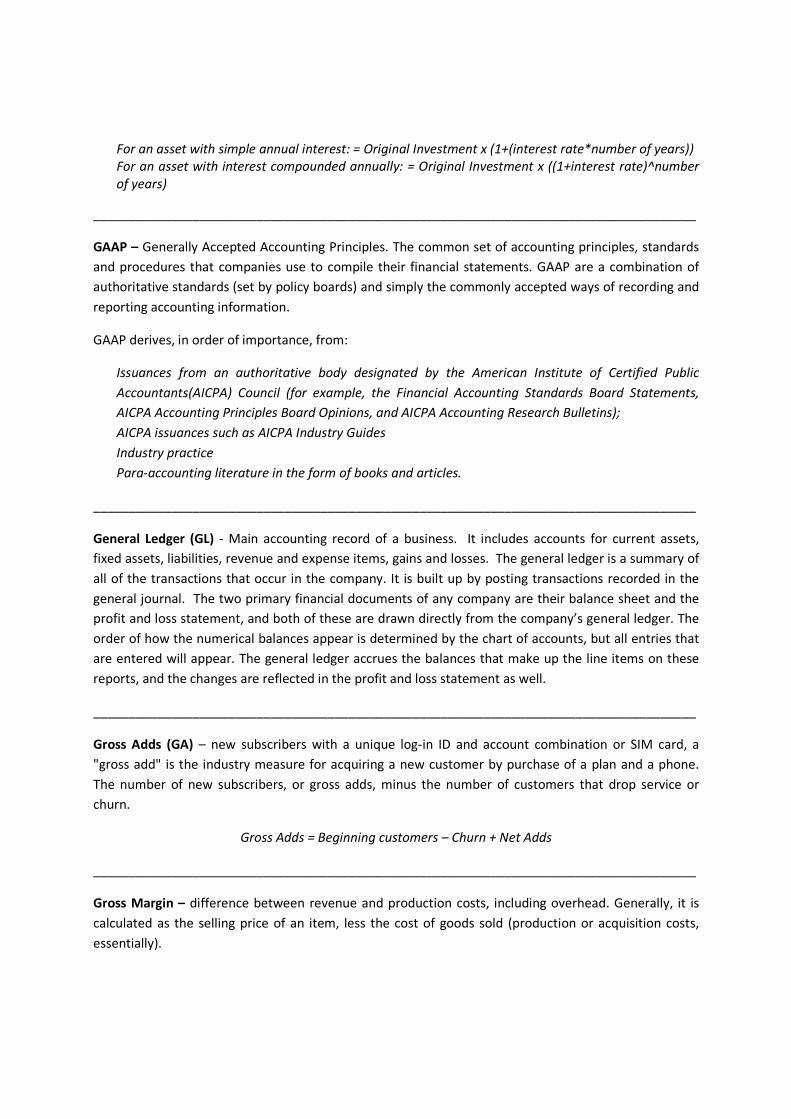
Customer Lifetime Value (CLV) – a financial concept that represents how much each customer is worth
in dollar terms, and therefore exactly how much a company should spend to acquire and keep each
customer. CLV is calculated using a model and inputting various estimates and simplifying assumptions.
In reality, there are several variations of CLV available due to the complexity and uncertainty of
customer behavior.
In wireless, CLV can also be:
CLV = ((ARPU – Variable CCPU) x Tenure) – (SAC + Capacity Charge)
CLV in wireless:
CLV (customer lifetime value) calculation process consists of four steps:
Forecasting of remaining customer lifetime in years
Forecasting of future revenues year-by-year, based on estimation about future products purchased
and price paid
Estimation of costs for delivering those products
Calculation of the net present value of these future amounts
Forecasting accuracy and difficulty in tracking customers over time may affect CLV calculation
process
_____________________________________________________________________________________
DARPU – Data Average Revenue per User. Total Data Revenue divided by number of subscribers.
_____________________________________________________________________________________

DCF (Discounted Cash Flow) - method of valuing a project, company, or asset using Time Value of
Money. All future cash flows are estimated and discounted to give their Present Values (PVs). The sum
of all future cash flows, both incoming and outgoing, is the Net Present Value (NPV), which is taken as
the value of the cash flows.
Discounted cash flow (DCF) analysis uses future free cash flow projections and discounts them (most
often using the weighted average cost of capital) to arrive at a present value, which is used to evaluate
the potential for investment. If the value arrived at through DCF analysis is higher than the current cost
of the investment, the opportunity may be a good one.
Calculated as:
Also known as the Discounted Cash Flows Model. The purpose of DCF analysis is just to estimate the
money to be received from an investment and to adjust for the time value of money.
_____________________________________________________________________________________
Depreciation – accounting method to attribute the cost of an asset over the asset’s useful life.
Amortization is the term usually used for depreciation of intangible assets. Depreciation is used in
accounting to try to match the expense of an asset to the income that the asset helps the company
earn. For example, if a company buys a piece of equipment for $10 million and expects it to have a
useful life of 10 years, it will be depreciated over 10 years. Every accounting year, the company will
expense $1000, 000 (assuming straight‐line depreciation), which will be matched with the money that
the equipment helps to make each year.
_____________________________________________________________________________________
Discount Rate – used in financial calculations to bring the value of anticipated future cash flows to the
present. Often it is chosen to be equal to the cost of capital. Some adjustment may be made to the
discount rate to take account the risks associated with uncertain cash flows.
_____________________________________________________________________________________
Disruptive App – An app which takes away potential revenue from its carrier. For example, Skype may
lower a carrier’s airtime and/or long distance revenue even though its bandwidth costs the carrier more
in capacity charges/opportunity costs.
_____________________________________________________________________________________

Disruptive Technology – innovations that improve a product or service in ways that the market does not
3expect, typically by lowering price or designing for a different set of consumers. Example WiMAX which
accelerated the development of 3GPP‐LTE.
_____________________________________________________________________________________
Earnings Per Share (EPS) – Earnings returned on an initial investment amount. The portion of a
company's profit allocated to each outstanding share of common stock. Earnings per share serve as an
indicator of a company's profitability.
Calculated as:
When calculating, it is more accurate to use a weighted average number of shares outstanding over the
reporting term, because the number of shares outstanding can change over time. However, data
sources sometimes simplify the calculation by using the number of shares outstanding at the end of the
period. Diluted EPS expands on basic EPS by including the shares of convertibles or warrants outstanding
in the outstanding shares number.
_____________________________________________________________________________________
EBITDA ‐ Earnings before interest, taxes, depreciation and amortization. A metric that can be used to
evaluate a company's profitability. EBIT or DA independently can denote those components. Externally
reported as OIBDA (Operating Income before Depreciation and Amortization) with minor definitional
differences.
EBITDA is calculated by taking net income and adding interest, taxes, depreciation and amortization
expenses back to it. EBITDA is used to analyze a company's operating profitability before non‐operating
expenses (such as interest and "other" non‐core expenses) and non‐cash charges (depreciation and
amortization). Factoring out interest, taxes, depreciation and amortization can make even completely
unprofitable firms appear to be fiscally healthy. A look back at the dotcoms provides countless examples
of firms that had no hope, no future and certainly no earnings, but became the darlings of the
investment world. The use of EBITDA as measure of financial health made these firms look attractive.
EBITDA numbers are easy to manipulate. If fraudulent accounting techniques are used to inflate
revenues and interest, taxes, depreciation and amortization are factored out of the equation, almost
any company will look great. EBITDA is a financial calculation that is NOT regulated by GAAP (Generally
Accepted Accounting Principles) and therefore can be manipulated to a company's own ends.
_____________________________________________________________________________________
EBITDA Margin – EBITDA divided by Total Revenue. Conceptually, EBITDA Margin represents what
percentage is retained from the overall amount received. A measurement of a company's operating

profitability. It is equal to earnings before interest, tax, depreciation and amortization (EBITDA) divided
by total revenue. Because EBITDA excludes depreciation and amortization, EBITDA margin can provide
an investor with a cleaner view of a company's core profitability.
_____________________________________________________________________________________
Economics of Strategy – economics book by Besanko, Dranove, and Shanley that applies modern
economic principles to firms’ strategic positions.
_____________________________________________________________________________________
Economies of Density – increase in output resulting in a less than proportional increase in total costs.
_____________________________________________________________________________________
Economies of Scale – cost advantages a business obtains due to growth. Factors that cause a producer’s
average cost per unit to fall as scale is increased. The increase in efficiency of production as the number
of goods being produced increases. Typically, a company that achieves economies of scale lowers the
average cost per unit through increased production since fixed costs are shared over an increased
number of goods.
There are two types of economies of scale:
External economies - the cost per unit depends on the size of the industry, not the firm.
Internal economies - the cost per unit depends on size of the individual firm.
_____________________________________________________________________________________
Economies of Scope – conceptually similar to Economies of Scale. Whereas economies of scale refer to
efficiencies associated with supply side changes, Economies of Scope refer to efficiencies associated
with demand side changes. Examples include increasing or decreasing the scope of marketing and
distribution of different types of products. Economies of Scope are the main reason for strategies such
as product bundling, product lining, and family branding. The average total cost of production decreases
as a result of increasing the number of different goods produced.
_____________________________________________________________________________________
Elasticity – ratio of the percentage change in one variable to another variable. An elasticity of 1 means
that a 1% change in something causes a 1% change in something else. It is a tool for measuring the
responsiveness of a function to changes in parameters in a unit less way. Frequently used elasticities
include price elasticity of demand, price elasticity of supply, income elasticity of demand, elasticity of
substitution between factors of production and elasticity of intertemporal substitution.
Elasticity is one of the most important concepts in neoclassical economic theory. It is useful in
understanding the incidence of indirect taxation, marginal concepts as they relate to the theory of the
firm and distribution of wealth and different types of goods as they relate to the theory of consumer

choice. Elasticity is also crucially important in any discussion of welfare distribution, in particular
consumer surplus, producer surplus, or government surplus.
_____________________________________________________________________________________
EOY –End of Year. Sometimes referred to as EY.
_____________________________________________________________________________________
Equipment Installment Plan (EIP) – Mobile Operator financing in lieu of subsidizing handsets. An iPhone
offered by an operator costs much less than buying from Apple without a data service.
_____________________________________________________________________________________
Family Branding – marketing strategy that involves selling several related products under one brand
name. A family brand name is used for all products. By building customer trust and loyalty to the family
brand name, all products that use the brand can benefit.
Some good examples include brands in the food industry, including Kellogg’s, Heinz and Del Monte. Of
course, the use of a family brand can also create problems if one of the products gets bad publicity or is
a failure in a market. This can damage the reputation of a whole range of brands.
_____________________________________________________________________________________
Financial Accounting Standards Board (FASB) – It is a private, not‐for‐profit organization whose primary
purpose is to develop generally accepted accounting principles (GAAP) within the United States in the
public's interest. The Securities and Exchange Commission (SEC) designated the FASB as the organization
responsible for setting accounting standards for public companies in the U.S. It was created in 1973,
replacing the Committee on Accounting Procedure (CAP) and the Accounting Principles Board (APB) of
the American Institute of Certified Public Accountants (AICPA).
The FASB is not a governmental body and its mission is "to establish and improve standards of financial
accounting and reporting for the guidance and education of the public, including issuers, auditors, and
users of financial information." To achieve this, FASB has five goals:
Improve the usefulness of financial reporting by focusing on the primary characteristics of relevance
and reliability, and on the qualities of comparability and consistency.
Keep standards current to reflect changes in methods of doing business and in the economy.
Consider promptly any significant areas of deficiency in financial reporting that might be improved
through standard setting.
Promote international convergence of accounting standards concurrent with improving the quality of
financial reporting.
Improve common understanding of the nature and purposes of information in financial reports.
_____________________________________________________________________________________

Fixed Cost – business expense that is not dependent on the activities of the business. They tend to be
time‐related, such as salaries or rents. An example of a fixed cost would be a company's lease on a
building. If a company has to pay $12,000 each month to cover the cost of the lease but does not
manufacture anything during the month, the lease payment is still due in full.
_____________________________________________________________________________________
Flywheel – additive effect of many small initiatives. The Flywheel concept is from Jim Collins’ “Good to
Great.” It is a concept that is based on concept to apply immense force to rotate the ‘Flywheel’ and it
doesn't move but perseverance to move it inch by an inch still persists. While efforts continue to apply
force to it and finally the efforts pay off by making it complete a turn. Nobody notices but the person
who is turning the wheel knows what they are up to. They continue applying force in the same direction
until it attains a speed which people stop to notice. They believe that a massive restructuring program
must have gone under to bring it to such speed.
_____________________________________________________________________________________
Forecast (FC) ‐ detailed estimate of the expected financial position and results of operations and cash
flows based on expected conditions. Forecasts are made for all GL accounts in conjunction with the
budget, and updated monthly.
_____________________________________________________________________________________
“Friends & Family” – Mobile Network Operators plan that gives customer’s unlimited calling to a select
group of numbers. They are popularly known as ‘my circle’ or ‘myfaves’ as branded by different
operators.
_____________________________________________________________________________________
FTE – Full‐Time Equivalent is a way to measure a worker's involvement in a project. An FTE of 1.0 means
that the person is equivalent to a full‐time worker at 40 hours per week, while an FTE of 0.5 signals that
the worker is only half‐time at 20 hours per week.
_____________________________________________________________________________________
Future Value (FV) – future sum of money that a given amount of money is worth at a specified time in
the future, assuming a certain interest rate or ROI.
FV=PV (1+i) n
Where,
FV – Future value
PV – Present Value
i – Annual interest rate
There are two ways to calculate FV:
For an asset with simple annual interest: = Original Investment x (1+(interest rate*number of years))
For an asset with interest compounded annually: = Original Investment x ((1+interest rate)^number
of years)
_____________________________________________________________________________________
GAAP – Generally Accepted Accounting Principles. The common set of accounting principles, standards
and procedures that companies use to compile their financial statements. GAAP are a combination of
authoritative standards (set by policy boards) and simply the commonly accepted ways of recording and
reporting accounting information.
GAAP derives, in order of importance, from:
Issuances from an authoritative body designated by the American Institute of Certified Public
Accountants(AICPA) Council (for example, the Financial Accounting Standards Board Statements,
AICPA Accounting Principles Board Opinions, and AICPA Accounting Research Bulletins);
AICPA issuances such as AICPA Industry Guides
Industry practice
Para-accounting literature in the form of books and articles.
_____________________________________________________________________________________
General Ledger (GL) ‐ Main accounting record of a business. It includes accounts for current assets,
fixed assets, liabilities, revenue and expense items, gains and losses. The general ledger is a summary of
all of the transactions that occur in the company. It is built up by posting transactions recorded in the
general journal. The two primary financial documents of any company are their balance sheet and the
profit and loss statement, and both of these are drawn directly from the company’s general ledger. The
order of how the numerical balances appear is determined by the chart of accounts, but all entries that
are entered will appear. The general ledger accrues the balances that make up the line items on these
reports, and the changes are reflected in the profit and loss statement as well.
_____________________________________________________________________________________
Gross Adds (GA) – new subscribers with a unique log‐in ID and account combination or SIM card, a
"gross add" is the industry measure for acquiring a new customer by purchase of a plan and a phone.
The number of new subscribers, or gross adds, minus the number of customers that drop service or
churn.
Gross Adds = Beginning customers – Churn + Net Adds
_____________________________________________________________________________________
Gross Margin – difference between revenue and production costs, including overhead. Generally, it is
calculated as the selling price of an item, less the cost of goods sold (production or acquisition costs,
essentially).

Gross margin = (Revenue - Cost of goods sold) / Revenue
Cost of sales (also known as cost of goods sold or COGS) includes variable costs and fixed costs directly
linked to the sale, such as material costs, labor, supplier profit, shipping‐in costs (cost of getting the
product to the point of sale, as opposed to shipping‐out costs which are not included in COGS), etc. It
does not include indirect fixed costs like office expenses, rent, administrative costs, etc.
_____________________________________________________________________________________
Halo Effect – the first traits recognized influence interpretation and perception of later traits because of
expectation. The halo effect is very common among physically attractive individuals. Physically attractive
individuals are assumed to possess more socially desirable traits, live happier lives, and become more
successful than unattractive people. Edward Thorndike was the first to support the halo effect with
empirical research. Thorndike’s main contribution to psychology was the creation of many theories to
educational psychology.
_____________________________________________________________________________________
Handset Seeding – giveaways of handsets to developers with the expectation that they will develop
apps. For example concerned many of its developers aren't up to speed with Android 2.0, Google had
emailed studios informed them they could receive a free Motorola Droid or Nexus One handset
presently as part of the firm's Device Seeding Program. Mobile operators do the same by seeding the
market in expectation of launching a new technology, another example was seeding data capable
phones before data services were launched during GSM days.
_____________________________________________________________________________________
Hedgehog Concept – a Venn diagram of three intersecting circles can be drawn for “good‐to‐great”
companies that represent:
1. What they are deeply passionate about,
2. What they can be the best in the world at
3. What best drives the economic engine.
Under this concept, good‐to‐great companies turn down opportunities that fail the Hedgehog test. The
Hedgehog concept is from Jim Collins’ “Good to Great.” Consistency is key in a business. Although it is
okay to change directions if the current plan is not working, this shouldn't be a common occurrence. The

hedgehog concept shows many benefits for leaders who plan first, and then act. Consider how any
changes, no matter how small, might affect the company five or ten years from now; don't only
concentrate on the immediate benefits. Companies that have leaders following the hedgehog concept
will have a better chance of becoming great companies in the long run.
_____________________________________________________________________________________
Herfindahl–Hirschman Index – Herfindahl Hirschman Index determines if a monopoly exists. The
calculation gives higher weight to larger firms but also allows firms outside of the top four largest to
factor into the equation. A similar index is the Four‐Firm Concentration Ratio, which only factors in the
four largest firms. The lower the Herfindahl Hirschman Index, the more spread out the market share
with many large firms. The higher the Herfindahl Hirschman, the more concentrated the market shares
with only a couple of large firms.
Formula:
HHI = Σ Xi, i from 1 to n
Xi is the percent market share of firm i x 100
n is the number of firms (or 50 if more than that)
Herfindahl‐Hirschman Index will vary with changes in market share among bigger business firms. A
market characterized by monopoly will have higher HHI. For example, if a single company dominates
(100 percent market share) then index will equal 10,000‐exhibiting a monopoly. In a competitive
market, with thousands of business firms competing for customers, HHI would be near zero‐indicating
perfect competition. Governments worldwide use Herfindahl‐Hirschman Index for assessing mergers. A
competitive marketplace is considered to be one with HHI lower than 1,000. On other hand, a market
with HHI of 1,800 or more is considered as highly concentrated. A market at this level has potent anti‐
trust concerns. Anti‐trust concerns are also raised when a transaction may increase market HHI by more
than 100 points.
_____________________________________________________________________________________
Horizontal Market – market which meets a given need of a wide variety of industries, rather than a
specific one. The audience for horizontal markets shares characteristics across industries. Based on the
scope of horizontal markets, the marketing efforts that support them must reach this spectrum of
buyers and prospective buyers. An Internet service provider (ISP), for example, may launch a horizontal
marketing effort to support the sale of Internet services to homeowners. This is a broad umbrella
consisting of all homeowners in a specific region. This category of homeowners represents a horizontal
market.
_____________________________________________________________________________________
IFRS – International Financial Reporting Standards (comparable to GAAP). IFRS are considered a
"principles based" set of standards in that they establish broad rules as well as dictating specific
treatments and adopted by the International Accounting Standards Board (IASB).
International Financial Reporting Standards comprise:
International Financial Reporting Standards (IFRS)—standards issued after 2001
International Accounting Standards (IAS)—standards issued before 2001
Standing Interpretations Committee (SIC)—issued before 2001
Conceptual Framework for the Preparation and Presentation of Financial Statements (2010)
_____________________________________________________________________________________
Incollects – invoices sent to a carrier for calls by their subscribers that originated outside of the carrier’s
service area. Incollects ‐ sometimes called out‐roamers, are billing records that are received from other
systems for services provided to their customers that have used the services of other networks.
_____________________________________________________________________________________
Indirect Channels – dealers and national retailers that sell any network operator’s products and
services. Indirect Channels are also known as Indirect Sales Channels or Retail Sales Partners. The
indirect channel is used by companies who do not sell their goods directly to consumers. Suppliers and
manufacturers typically use indirect channels because they exist early in the supply chain. Depending on
the industry and product, direct distribution channels have become more prevalent because of the
Internet.
Distributors, wholesalers and retailers are the primary indirect channels a company may use when
selling its products in the marketplace. Companies choose the indirect channel best suited for their
product to obtain the best market share; it also allows them to focus on producing their goods.
_____________________________________________________________________________________
Income Statement/Income Summary or Profit and Loss Statement (P&L) ‐ A financial statement for
companies that indicates how revenue is transformed into net income (the result after all revenues and
expenses have been accounted for). P&Ls can also be used to report on departments or business lines
within a company. These records provide information that shows the ability of a company to generate
profit by increasing revenue and reducing costs.
The format of the income statement or the profit and loss statement will vary according to the
complexity of the business activities. However, most companies will have the following elements in their
income statements:
Revenues and Gains
Revenues from primary activities
Revenues or income from secondary activities
Gains (e.g., gain on the sale of long-term assets, gain on lawsuits)

Expenses and Losses
Expenses involved in primary activities
Expenses from secondary activities
Losses (e.g., loss on the sale of long-term assets, loss on lawsuits)
_____________________________________________________________________________________
Innovator’s Dilemma – management book by Clayton Christensen that describes how established
companies often overlook disruptive technologies. The book explains how established companies are
focused on improving a product/service for their most sophisticated customers, although this innovation
outpaces what most customers can absorb over time. Christensen describes two types of technologies:
sustaining technologies and disruptive technologies. Sustaining technologies are technologies that
improve product performance. These are technologies that most large companies are familiar with;
technologies that involve improving a product that has an established role in the market. Most large
companies are adept at turning sustaining technology challenges into achievements. Christensen claims
that large companies have problems dealing with disruptive technologies. Disruptive technologies are
"innovations that result in worse product performance, at least in the near term." They are generally
"cheaper, simpler, smaller, and, frequently, more convenient to use." Disruptive technologies occur less
frequently, but when they do, they can cause the failure of highly successful companies who are only
prepared for sustaining technologies.
Above graph shows, disruptive technologies cause problems because they do not initially satisfy the
demands of even the high end of the market. Because of that, large companies choose to overlook
disruptive technologies until they become more attractive profit‐wise. Disruptive technologies,
however, eventually surpass sustaining technologies in satisfying market demand with lower costs.
When this happens, large companies who did not invest in the disruptive technology sooner are left
behind. This, according to Christensen, is the "Innovator's Dilemma."
Solving the Innovator's dilemma lies in firms being able to identify, develop and successfully market
emerging, potentially disruptive technologies before they overtake the traditional sustaining technology.

However, as described by the Innovator’s Dilemma, the value networks and organization structures of
these firms make it an arduous process to complete.
_____________________________________________________________________________________
Involuntary Churn – percentage of customers whose service is terminated by the carrier for reasons
such as nonpayment of bill.
_____________________________________________________________________________________
JD Power Awards – J.D. Power and Associates is a global marketing information services firm founded in
1968 by James David Power III. The firm conducts surveys of customer satisfaction, product quality, and
buyer behavior for industries ranging from cars to marketing and advertising firms. The firm is best
known for its customer satisfaction research on new‐car quality and long‐term dependability. Its service
offerings include industry‐wide syndicated studies, proprietary research, consulting, training, and
automotive forecasting.
J.D. Power and Associates' marketing research consists primarily of consumer surveys. The company
bears the cost of developing and administering specific surveys with sample sizes of between several
hundred and over 100,000.J.D. Power ratings are based on the survey responses of randomly selected
and/or specifically targeted consumers. J.D. Power relies on consumer reporting for study results as well
as in‐house vehicle testing for opinion based reviews in Blogs.
Although publicly known for the endorsement value of its product awards, J.D. Power obtains the
majority of its revenue from corporations that seek the data collected from J.D. Power surveys for
internal use. Companies which have used J.D. Power surveys range from automotive, cellphone, and
computer manufacturers to home builders and utility companies. To be able to use the J.D. Power logo
and to quote the survey results in advertising, companies must pay a licensing fee to J.D. Power. These
advertisement licensing fees, however, form a small part of J.D. Power's revenues.
_____________________________________________________________________________________
Journal Entry (JE) – used in accounting to document a business transaction that increases funds in one
account and decreases them in another account without cash being received or a check being
processed.
_____________________________________________________________________________________
Key Performance Indicators (KPIs) – Metrics (usually non‐financial) to measure performance and help
an organization define and evaluate how successful it is, typically in terms of making progress towards
its long‐term organizational goals. Key performance indicators define a set of values used to measure
against. These raw sets of values, which are fed to systems in charge of summarizing the information,
are called indicators. Quantitative indicators which can be presented as a number.
Practical indicators that interface with existing company processes.
Directional indicators specifying whether an organization is getting better or not.

Actionable indicators are sufficiently in an organization's control to effect change.
Financial indicators used in performance measurement and when looking at an operating index.
_____________________________________________________________________________________
Keynesian perspective – Keynesian principles is a school of macroeconomic thought based on the ideas
of 20th‐century English economist John Maynard Keynes. Keynesian economics argues that private
sector decisions sometimes lead to inefficient macroeconomic outcomes and, therefore, advocates
active policy responses by the public sector, including monetary policy actions by the central bank and
fiscal policy actions by the government to stabilize output over the business cycle. The theories forming
the basis of Keynesian economics were first presented in The General Theory of Employment, Interest
and Money, published in 1936. The interpretations of Keynes are contentious and several schools of
thought claim his legacy. According to Keynesian theory, some individually‐rational microeconomic‐level
actions — if taken collectively by a large proportion of individuals and firms — can lead to inefficient
aggregate macroeconomic outcomes, wherein the economy operates below its potential output and
growth rate. Such a situation had previously been referred to by classical economists as a general glut.
There was disagreement among classical economists on whether a general glut was possible. Keynes
contended that a general glut would occur when aggregate demand for goods was insufficient, leading
to an economic downturn resulting in losses of potential output due to unnecessarily high
unemployment, which results from the defensive (or reactive) decisions of the producers. In such a
situation, government policies could be used to increase aggregate demand, thus increasing economic
activity and reducing unemployment and deflation.
Keynesian macroeconomics destroys the classical dichotomy by abandoning the assumption that wages
and prices adjust instantly to clear markets. This approach is motivated by the observation that many
nominal wages are fixed by long‐term labor contracts and many product prices remain unchanged for
long periods of time. Once the inflexibility of wages and prices is admitted into a macroeconomic model,
the classical dichotomy and the irrelevance of money quickly disappear.
_____________________________________________________________________________________
Kondratiev cycles – Kondratiev waves (also called supercycles, great surges, long waves, K‐waves or the
long economic cycle) are described as sinusoidal‐like cycles in the modern capitalist world economy.[1]
Averaging fifty and ranging from approximately forty to sixty years in length, the cycles consist of
alternating periods between high sectoral growth and periods of relatively slow growth. Unlike the
short‐term business cycle, the long wave of this theory is not accepted by current mainstream
economics.

Kondratiev identified four distinct phases the economy goes through. They are a period of inflationary
growth, followed by stagflation, then deflationary growth and finally depression. Some characteristics
are as follows:
Inflationary Growth (expansion): ‐ stable to slow rising prices, low commodity prices, low and stable
interest rates, rising stock prices. The period might also be characterized by strong and growing
corporate profits and technological innovations.
Stagflation (recession): ‐ rising prices, rising commodity prices, rising interest rates, stagnant to falling
stock prices. Stagnant profits, rising debt. This period usually sees a major war that contributes to the
commodity and price inflation, and to the rising debt and misdirects business resources.
Deflationary Growth (plateau): ‐ stable to falling prices, falling commodity prices, falling interest rates,
sharply rising stock prices, profit growth but probably not as good as in the inflationary growth phase.
Sharply rising debt. Possible period of considerable technological innovation. Excess debt contributes to
speculative bubbles.
Depression (depression): ‐ falling prices, rising commodity prices (particularly gold), stable interest rates,
falling stock prices, falling profits, debt collapse. As the stock market collapses numerous scandals will
emerge. A major war occurs that helps contribute to end of the depression phase and the start of the
new expansion period.
_____________________________________________________________________________________
Lag and accelerator models – The accelerator effect in economics refers to a positive effect on private
fixed investment of the growth of the market economy (measured e.g. by a change in Gross National
Product). Rising GNP (an economic boom or prosperity) implies that businesses in general see rising
profits, increased sales and cash flow, and greater use of existing capacity. This usually implies that
profit expectations and business confidence rise, encouraging businesses to build more factories and
other buildings and to install more machinery. (This expenditure is called fixed investment.) This may
lead to further growth of the economy through the stimulation of consumer incomes and purchases,
i.e., via the multiplier effect.
The accelerator effect also goes the other way: falling GNP (a recession) hurts business profits, sales,
cash flow, use of capacity and expectations. This in turn discourages fixed investment, worsening a

recession by the multiplier effect. The accelerator effect is shown in the simple accelerator model. This
model assumes that the stock of capital goods (K) is proportional to the level of production (Y):
K = k×Y This implies that if k (the capital‐output ratio) is constant, an increase in Y requires an increase in K. That
is, net investment, In equals:
In = k×∆Y Suppose that k = 2 (usually, k is assumed to be in (0,1)). This equation implies that if Y rises by 10, then
net investment will equal 10×2 = 20, as suggested by the accelerator effect. If Y then rises by only 5, the
equation implies that the level of investment will be 5×2 = 10. This means that the simple accelerator
model implies that fixed investment will fall if the growth of production slows. An actual fall in
production is not needed to cause investment to fall. However, such a fall in output will result if slowing
growth of production causes investment to fall, since that reduces aggregate demand. Thus, the simple
accelerator model implies an endogenous explanation of the business‐cycle downturn, the transition to
a recession.
In statistics and econometrics, a distributed lag model is a model for time series data in which a
regression equation is used to predict current values of a dependent variable based on both the current
values of an explanatory variable and the lagged (past period) values of this explanatory variable.
The starting point for a distributed lag model is an assumed structure of the form
yt = a + w0xt + w1xt − 1 + w2xt − 2 + ... + error term
or the form
yt = a + w0xt + w1xt − 1 + w2xt − 2 + ... + wnxt − n + error term,
Where yt is the value at time period t of the dependent variable y, a is the intercept term to be
estimated, and wi is called the lag weight (also to be estimated) placed on the value i periods previously
of the explanatory variable x. In the first equation, the dependent variable is assumed to be affected by
values of the independent variable arbitrarily far in the past, so the number of lag weights is infinite and
the model is called an infinite distributed lag model. In the alternative, second, equation, there are only
a finite number of lag weights, indicating an assumption that there is a maximum lag beyond which
values of the independent variable do not affect the dependent variable; a model based on this
assumption is called a finite distributed lag model.
In an infinite distributed lag model, an infinite number of lag weights need to be estimated; clearly this
can be done only if some structure is assumed for the relation between the various lag weights, with the
entire infinitude of them expressible in terms of a finite number of assumed underlying parameters. In a
finite distributed lag model, the parameters could be directly estimated by ordinary least squares
(assuming the number of data points sufficiently exceeds the number of lag weights); nevertheless, such
estimation may give very imprecise results due to extreme multicollinearity among the various lagged

values of the independent variable, so again it may be necessary to assume some structure for the
relation between the various lag weights.
The concept of distributed lag models easily generalizes to the context of more than one right‐side
explanatory variable.
_____________________________________________________________________________________
Lean Enterprise – production practice that seeks to eliminate any action determined to be “non value
add.” Lean Enterprise is often known simply as “Lean,”
_____________________________________________________________________________________
Long Tail – Small volumes of hard‐to‐find items can be sold to many customers. The Long Tail
phenomenon was less common before Internet sales became common. The Long Tail or long tail refers
to the statistical property that a larger share of population rests within the tail of a probability
distribution than observed under a 'normal' or Gaussian distribution. A long tail distortion will arise with
the inclusion of some unusually high (or low) values which increase (decrease) the mean, skewing the
distribution to the right (or left).
The term Long Tail has gained popularity in recent times as describing the retailing strategy of selling a
large number of unique items with relatively small quantities sold of each – usually in addition to selling
fewer popular items in large quantities. The Long Tail was popularized by Chris Anderson in an October
2004 Wired magazine article, in which he mentioned Amazon.com and Netflix as examples of businesses
applying this strategy. Anderson elaborated the concept in his book The Long Tail: Why the Future of
Business Is Selling Less of More.
_____________________________________________________________________________________
Margin – difference between the selling price of a product or service and the cost of producing it.
_____________________________________________________________________________________

M2M (Machine to Machine) – technologies that allow both wireless and wired systems to communicate
with each other.
_____________________________________________________________________________________
Metcalfe effect – Metcalfe's law states that the value of a telecommunications network is proportional
to the square of the number of connected users of the system (n2). First formulated in this form by
George Gilder in 1993, and attributed to Robert Metcalfe in regard to Ethernet, Metcalfe's law was
originally presented, circa 1980, not in terms of users, but rather of “compatible communicating
devices” (for example, faxes machines, telephones, etc.) Only more recently with the launch of the
internet did this law carry over to users and networks as its original intent was to describe Ethernet
purchases and connections. The law is also very much related to economics and business management,
especially with competitive companies looking to merge with one another.
Metcalfe's law characterizes many of the network effects of communication technologies and networks
such as the Internet, social networking, and the World Wide Web. Metcalfe's Law is related to the fact
that the number of unique connections in a network of a number of nodes (n) can be expressed
mathematically as the triangular number n(n − 1)/2, which is proportional to n2 asymptotically.
Websites and blogs such as Twitter, Facebook, and MySpace are the most prominent modern example
of Metcalfe's Law. Metcalfe's law is more of a heuristic or metaphor than an iron‐clad empirical rule. In
addition to the difficulty of quantifying the "value" of a network, the mathematical justification
measures only the potential number of contacts, i.e., the technological side of a network. However the
social utility of a network depends upon the number of nodes in contact. A good way to describe this is
"quality versus quantity."
_____________________________________________________________________________________
MMS (Multimedia Messaging Service) – standard for sending multimedia content to and from mobile
phones. The most popular use is to send photographs from camera‐equipped handsets.
_____________________________________________________________________________________
MOU – Minutes of use and could include all allowance minutes available for calls that include any Night
& Weekend, Mobile to Mobile, Friends & Family or any other allowance.
_____________________________________________________________________________________
MRC – Monthly Recurring Charge also called monthly access charge it is the set monthly cost of the plan
before additional monthly usage charges, taxes and operator surcharges.
_____________________________________________________________________________________
MVNO – (Mobile Virtual Network Operator) A company that provides mobile phone service but does
not have its own network infrastructure, buys minutes wholesale from wireless companies with such
infrastructures, and retails them to its own customers. Examples are Virgin Mobile, Wal‐Mart.

Net Adds – Gross Adds minus deactivations. Incremental change in customer base over a period.
NetAdds = New Subscribers - Churn
_____________________________________________________________________________________
Net Income (NI) – remaining income after adding revenue and gains and subtracting all expenses and
losses. If negative, Net Income is referred to as Net Loss.
Net Income = Net Revenue - Total Overall Expenses
_____________________________________________________________________________________
Net Income Margin (NI Margin/NIM) – Net Income divided by Revenue.
Net Income Margin = Net Income/Revenue
_____________________________________________________________________________________
Net Present Value (NPV) – The difference between the present value of cash inflows and the present
value of cash outflows. NPV is used in capital budgeting to analyze the profitability of an investment or
project.
NPV analysis is sensitive to the reliability of future cash inflows that an investment or project will yield.
Formula:
NPV compares the value of a dollar today to the value of that same dollar in the future, taking inflation
and returns into account. If the NPV of a prospective project is positive, it should be accepted. However,
if NPV is negative, the project should probably be rejected because cash flows will also be negative.
_____________________________________________________________________________________
Net Promoter Score (NPS) – Net Promoter is a customer loyalty metric developed by (and a registered
trademark of) Fred Reichheld, Bain & Company, and Satmetrix. It is a market research tool that uses a
single question: “How likely is it that you would recommend your current provider to a friend or
colleague?” Customers respond on a 0‐to‐10 point rating scale and are categorized as follows:
Promoters (score 9-10) are loyal enthusiasts who will keep buying and refer others, fueling growth.
Passives (score 7-8) are satisfied but unenthusiastic customers who are vulnerable to competitive
offerings.
Detractors (score 0-6) are unhappy customers who can damage the brand and impede growth
through negative word-of-mouth.

To calculate a company's Net Promoter Score (NPS), take the percentage of customers who are
Promoters and subtract the percentage who are Detractors.
NPS = % of Promoters (9, 10) - % of Detractors (0-6)
_____________________________________________________________________________________
Network perception – Perception management are actions to convey or deny selected information and
indicators to people in order to influence their emotions, motives, and objective reasoning, so as to be
favorable to the originators objectives. Everyone is influenced by perceptions, but only a few know how
to actually manage these perceptions to increase their success potential. Every operator is influenced by
certain perceptions due to their marketing campaigns, Industry studies, Industry awards and customer
behavior. A great example is the Verizon – “can you hear me now?” campaign which set in the minds of
people of ubiquitous coverage.
When a person has had a poor experience with a company, or has even heard bad things without having
experienced them themselves, it’s going to take something pretty special to tip the perceptions on their
head – first impressions are the ones that stick, and a bad reputation has seen the downfall of many a
promising companies.
_____________________________________________________________________________________
Nielsen ratings – Nielsen ratings are the audience measurement systems developed by Nielsen Media
Research, in an effort to determine the audience size and composition of television programming in the
United States. Nielsen Media Research was founded by Arthur Nielsen, who was a market analyst,
whose career had begun in the 1920s with brand advertising analysis and expanded into radio market
analysis during the 1930s, culminating in Nielsen ratings of radio programming, which was meant to
provide statistics as to the markets of radio shows.
Nielsen metrics for mobile devices (including “connected” devices like iPads, Kindles and tablets) are
used to study the market share, consumer satisfaction, device share, service quality, revenue share,
advertising effectiveness, audience reach and other key indicators in the mobile marketplace.
Nielsen uses a broad range of measurement tools to help companies make the most of their
investments in mobile, including:
Monitoring network signaling in 86 U.S. markets to count mobile subscribers and determine
marketshare
Analyzing the cellphone bills of more than 65,000 mobile subscribers in the U.S.
Conducting extensive drive tests to measure quality of service in North America
Deploying On-Device Meters to measure Smartphone activity
Analyzing carrier server logs to understand feature phone usage behavior
Surveying mobile consumers via telephone, in-person and online surveys.
_____________________________________________________________________________________

Network satisfaction – A survey conducted by consumerreports.org which takes several factors into
consideration while coming up with the results. This report and Ratings will be useful regardless of how
a person picks an approach for choosing a carrier and phone plan, and may be interesting. The report
outlines key findings about the best and worst carriers, according to readers. It also offers news about
the rise of more no‐contract plans, faster 4G service, and the prevalence of bills that are higher than
readers expected. This helps guide consumers to plans and phones that may suit them, whether the
person is a minimal phone user, a heavy talker and texter, an ardent e‐mailer, or someone who does all
that plus heavily surfs the Web. Our overall Ratings rank service, with and without a contract, based on
the survey conducted by the Consumer Reports National Research Center covering 23 metro areas.
_____________________________________________________________________________________
OEM (Original Equipment Manufacturer) – manufacturer of products or components that are
purchased by another company and retailed under the purchasing company’s brand name.
_____________________________________________________________________________________
Oligopoly – market dominated by a small number of sellers. The word is derived, by analogy with
"monopoly", from the Greek ὀλίγοι (oligoi) "few" + πόλειν (pólein) "to sell". Because there are few
sellers, each oligopolist is likely to be aware of the actions of the others. The decisions of one firm
influence, and are influenced by, the decisions of other firms. Strategic planning by oligopolists needs to
take into account the likely responses of the other market participants. As a quantitative description of
oligopoly, the four‐firm concentration ratio is often utilized. This measure expresses the market share of
the four largest firms in an industry as a percentage. For example, as of this year Verizon, AT&T, Sprint,
and T‐Mobile together control 89% of the US cellular phone market.
_____________________________________________________________________________________
Operating Cash flow – The cash generated from the operations of a company, generally defined as
revenues less all operating expenses, but calculated through a series of adjustments to net income. The
OCF can be found on the statement of cash flows. It is arguably a better measure of a business's profits
than earnings because a company can show positive net earnings (on the income statement) and still
not be able to pay its debts. It's cash flow that pays the bills for any company.
OCF is also used as a check on the quality of a company's earnings. If a firm reports record earnings but
negative cash, it may be using aggressive accounting techniques.
Operating Cash Flow = EBITA + Depreciation - Taxes
Also known as "cash flow provided by operations" or "cash flow from operating activities".
_____________________________________________________________________________________
Operating Margin – ratio of operating income divided by net sales, usually expressed in percent.
Operating margin is a measurement of what proportion of a company's revenue is left over after paying

for variable costs of production such as wages, raw materials, etc. A healthy operating margin is
required for a company to be able to pay for its fixed costs, such as interest on debt.
_____________________________________________________________________________________
Operating expense (OPEX) – OPEX is the ongoing cost for running a product, business, or system. It is a
category of expenditure that a business incurs as a result running a product, business, or system. Its
counterpart, a capital expenditure (CAPEX), is the cost of developing or providing non‐consumable parts
for the product or system. For example, the purchase of a photocopier involves CAPEX, and the annual
paper, toner, power and maintenance costs represent OPEX.
Operating expenses include:
Accounting expenses
License fees
Maintenance and repairs, such as snow removal, trash removal, janitorial service, pest control, and
lawn care
Advertising
Office expenses
Supplies
Attorney fees and legal fees
Utilities, such as telephone
Insurance
Property management, including a resident manager
Property taxes
Travel and vehicle expenses
One of the typical responsibilities that management must contend with is determining how low
operating expenses can be reduced without significantly affecting the firm's ability to compete with its
competitors.
_____________________________________________________________________________________
Opportunity Cost – next best choice available when choosing between several mutually exclusive
choices. The opportunity cost is also the cost of the foregone products after making a choice.
Opportunity cost is a key concept in economics, and has been described as expressing "the basic
relationship between scarcity and choice”. The notion of opportunity cost plays a crucial part in ensuring
that scarce resources are used efficiently. Thus, opportunity costs are not restricted to monetary or
financial costs: the real cost of output foregone, lost time, pleasure or any other benefit that provides
utility should also be considered opportunity costs.
_____________________________________________________________________________________

Organic Growth – Organic growth is the process of businesses expansion due to increasing overall
customer base, increased output per customer or representative, new sales, or any combination of the
above, as opposed to mergers and acquisitions that are examples of inorganic growth. Typically, the
organic growth rate also excludes the impact of foreign exchange. Growth including foreign exchange,
but excluding divestitures and acquisitions is often referred to as core growth.
Organic growth is growth that comes from a company's existing businesses, as opposed to expansion by
acquisition of an external company. It may be negative.
_____________________________________________________________________________________
P&L – Profit and Loss Statement or Income Statement. A financial statement for companies that
indicates how revenue is transformed into income (the result after all revenues and expenses have been
accounted for). P&Ls can also be used to report on departments or business lines within a company.
The statement of profit and loss follows a general form as seen in this example. It begins with an entry
for revenue and subtracts from revenue the costs of running the business, including cost of goods sold,
operating expenses, tax expense and interest expense. The bottom line (literally and figuratively) is net
income (profit). The balance sheet, income statement and statement of cash flows are the most
important financial statements produced by a company. While each is important in its own right, they
are meant to be analyzed together.
_____________________________________________________________________________________
Pareto Chart – A Pareto chart, named after Vilfredo Pareto, is a type of chart that contains both bars
and a line graph, where individual values are represented in descending order by bars, and the
cumulative total is represented by the line. In quality control, the Pareto chart often represents the
most common sources of defects, the highest occurring type of defect, or the most frequent reasons for
customer complaints, etc.
The benefits of using a Pareto Charts lie in economic terms. A Pareto Chart breaks a big problem down
into smaller pieces, identifies the most significant factors, shows where to focus efforts, and allows
better use of limited resources. They can separate the few major problems from the many possible
problems so that focus can be put on improvement efforts, arrange data according to priority or
importance, and determine which problems are most important using data, not perception.
A Pareto Chart can answer the following questions:
What are the largest issues facing our team or business?
What 20% of sources are causing 80% of the problems?
Where should we focus our efforts to achieve the greatest improvements?
A Pareto Chart is a good tool to use when the process that is being investigated produces data that are
broken down into categories and the number of times each category occurs can be counted. A Pareto
diagram puts data in a hierarchical order, which allows the most significant problems to be corrected

first. The Pareto analysis technique is used primarily to identify and evaluate nonconformities, although
it can summarize all types of data. It is the perhaps the diagram most often used in management
presentations.
_____________________________________________________________________________________
Post-Mortem – analysis completed subsequent to a project or campaign to determine if expectations
were achieved. A detailed post‐mortem can be used to inform future decisions.
_____________________________________________________________________________________
Postpaid/Postpay – accounts and services for customers who are billed after services are received. Also
known as Core.
_____________________________________________________________________________________
Prepaid/Prepay ‐ accounts and services for customers who pay up front, before the services are
received.
_____________________________________________________________________________________
Present Value (PV) – value on a given date of a future payment or series of future payments, discounted
to reflect the Time Value of Money and other factors such as investment risk. Determining the
appropriate discount rate is the key to properly valuing future cash flows, whether they are earnings or
obligations. Also referred to as "discounted value".
The basis is that receiving $1,000 now is worth more than $1,000 five years from now, because if we get
the money now, we could invest it and receive an additional return over the five years. The calculation
of discounted or present value is extremely important in many financial calculations. For example, net
present value, bond yields, spot rates, and pension obligations all rely on the principle of discounted or
present value.
_____________________________________________________________________________________
Price-Cost Margin – Price margin (also called gross margin) is the part of a product or service's price in
excess of cost, expressed in dollars or as a percentage of the price. Businesses normally use markup
formulas to add predetermined percentages to an item's cost to arrive at a price. Not all products in a
business's inventory carry the same markup or price margin. Savvy businesspeople calculate price
margins to provide information for analyzing the relative profitability of different products, whether the
margin is generating a net profit over expenses, how much to discount prices for sales and much more.
_____________________________________________________________________________________
Price per MHz POP ($/MHz-POP) – The wireless industry commonly uses a dollar per megahertz per
person covered, or $/MHz‐POP metric to value spectrum. This method may place a high value on
densely populated areas, which for consumer‐based wireless telephone carriers may correlate well with
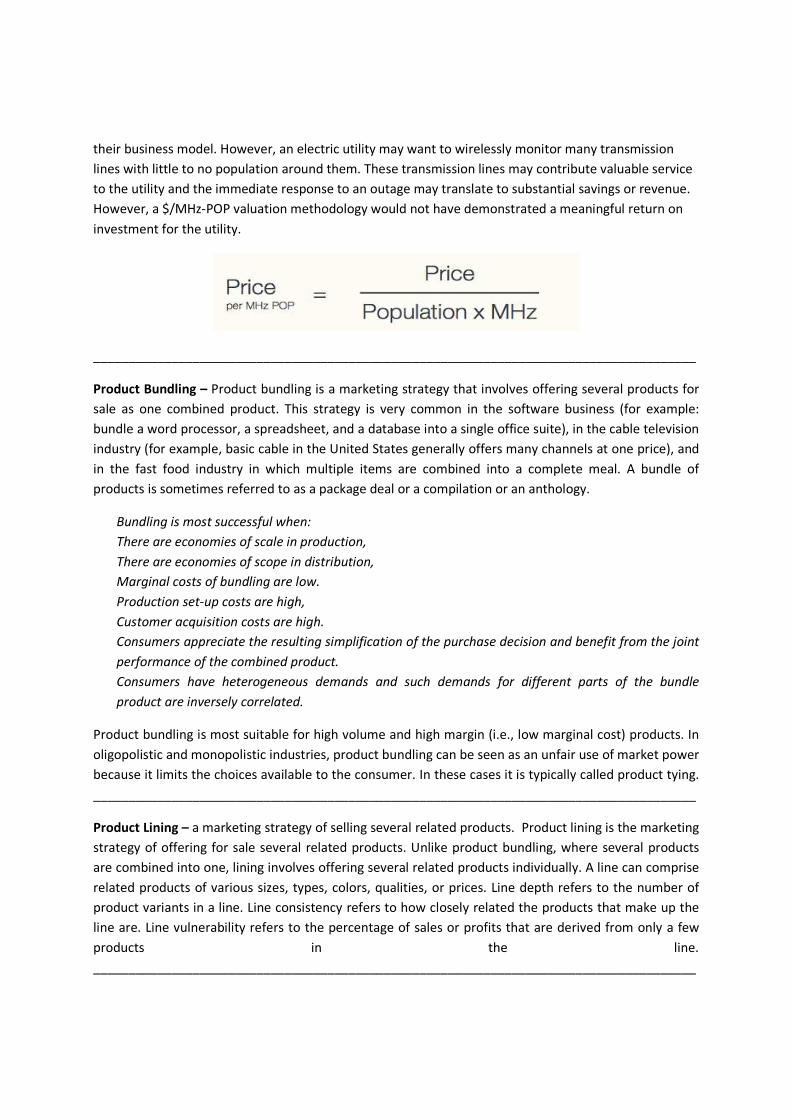
their business model. However, an electric utility may want to wirelessly monitor many transmission
lines with little to no population around them. These transmission lines may contribute valuable service
to the utility and the immediate response to an outage may translate to substantial savings or revenue.
However, a $/MHz‐POP valuation methodology would not have demonstrated a meaningful return on
investment for the utility.
_____________________________________________________________________________________
Product Bundling – Product bundling is a marketing strategy that involves offering several products for
sale as one combined product. This strategy is very common in the software business (for example:
bundle a word processor, a spreadsheet, and a database into a single office suite), in the cable television
industry (for example, basic cable in the United States generally offers many channels at one price), and
in the fast food industry in which multiple items are combined into a complete meal. A bundle of
products is sometimes referred to as a package deal or a compilation or an anthology.
Bundling is most successful when:
There are economies of scale in production,
There are economies of scope in distribution,
Marginal costs of bundling are low.
Production set-up costs are high,
Customer acquisition costs are high.
Consumers appreciate the resulting simplification of the purchase decision and benefit from the joint
performance of the combined product.
Consumers have heterogeneous demands and such demands for different parts of the bundle
product are inversely correlated.
Product bundling is most suitable for high volume and high margin (i.e., low marginal cost) products. In
oligopolistic and monopolistic industries, product bundling can be seen as an unfair use of market power
because it limits the choices available to the consumer. In these cases it is typically called product tying.
_____________________________________________________________________________________
Product Lining – a marketing strategy of selling several related products. Product lining is the marketing
strategy of offering for sale several related products. Unlike product bundling, where several products
are combined into one, lining involves offering several related products individually. A line can comprise
related products of various sizes, types, colors, qualities, or prices. Line depth refers to the number of
product variants in a line. Line consistency refers to how closely related the products that make up the
line are. Line vulnerability refers to the percentage of sales or profits that are derived from only a few
products in the line.
_____________________________________________________________________________________

QOS – (Quality of Service) The quality of service (QoS) refers to several related aspects of telephony and
computer networks that allow the transport of traffic with special requirements. In particular, much
technology has been developed to allow computer networks to become as useful as telephone networks
for audio conversations, as well as supporting new applications with even more strict service demands.
QoS (quality of service) refers to the mechanisms in the network software that make the actual
determination of which packets have priority (see packet scheduler). CoS (class of service) refers to
feature sets, or groups of services, that are assigned to users based on company policy. If a feature set
includes priority transmission, then CoS winds up being implemented in QoS functions within the
routers and switches in the network.
_____________________________________________________________________________________
RAZR Effect – Motorola relied too long on the RAZR, and when the RAZR’s appeal declined, Motorola
slashed prices to gain market share, and suffered heavy losses. The RAZR used great technology, it had a
bold and expressive aesthetic, and it succeeded in the marketplace. When it entered the mass market in
2005, Motorola CEO Edward J. Zander proudly announced in his Q3 2005 conference call that the RAZR
“just knocked the cover off the ball in unit sales, operating earnings and market shares and every area
that we measured.” And with good reason. The “RAZR boom”, as it was referred to, not only raised sales
and brand awareness, but also brought Motorola a stock boost of nearly $10 per share. However the
“worst” is that everything that made the RAZR a success is being lost by the company, just a few years
later. Nowadays, even Motorola does not seem to be able to follow its own example of innovation with
its new product lines.
_____________________________________________________________________________________
Revenue (Rev) – income a company receives from normal business activities. Profits or net income is
revenue minus expenses. Revenue is the amount of money that is brought into a company by its
business activities. In the case of government, revenue is the money received from taxation, fees, fines,
inter‐governmental grants or transfers, securities sales, mineral rights and resource rights, as well as any
sales that are made. Revenue for a company is calculated by multiplying the price at which goods or
services are sold by the number of units or amount sold.
_____________________________________________________________________________________
Revenue Lifetime Value (RLV) – Present Value of expected future revenue streams.
_____________________________________________________________________________________
Roaming – use of a cell phone that is outside the coverage footprint of the carrier. The term "roaming"
originates from the GSM (Global System for Mobile Communications) sphere; the term "roaming" can
also be applied to the CDMA technology.
_____________________________________________________________________________________

ROCE (return on capital employed) – It is the rate of return a business is making on the total capital
employed in the business. Capital will include all sources of funding (shareholders funds + debt). To be
consistent with this the return should be taken prior to interest (the return to lenders) and tax. It is
therefore:
EBIT ÷ (shareholders funds + debt)
RoE is a similar measure which looks only at the returns to shareholders. return on equity (RoE) is
normally higher than ROCE and is affected by the level of debt. Return on operating capital employed is
a variant of ROCE that looks at the operations of the business only, ignoring the effects of cash holdings
and provisions. It is therefore a better measure of how efficiently the actual business is run and is more
comparable across companies.
Comparisons across companies using any measure of return on capital require that numbers for both
profit and capital are comparable. This means looking closely at a range of accounting policies and
adjusting where necessary. For example, differences in depreciation or revaluation policies that change
the amount of capital employed.
_____________________________________________________________________________________
Roaming Overbuild – construction of additional network where network previously existed to
ameliorate coverage gaps.
_____________________________________________________________________________________
ROI (Return on Investment) – ratio of money gained or lost on an investment relative to the amount of
money invested. Also referred to as Rate of Return, it is a very popular metric because of its versatility
and simplicity. That is, if an investment does not have a positive ROI, or if there are other opportunities
with a higher ROI, then the investment should be not be undertaken.
Formula:
_____________________________________________________________________________________
ROIC (Return on Invested Capital) – financial measure that quantifies how well a company generates
cash flow relative to the capital it has invested in its business. It is defined as Net Operating Profit less
adjusted taxes, also known as "return on capital".
Return on invested capital (ROIC) is a financial measure that quantifies how well a company generates
cash flow relative to the capital it has invested in its business. It is defined as net operating profit less
adjusted taxes divided by invested capital and is usually expressed as a percentage. In this calculation,
capital invested includes all monetary capital invested: long‐term debt, common and preferred shares.

Formula:
_____________________________________________________________________________________
Real business cycles theory – Real Business Cycles (RBC) theory views cycles as arising in frictionless
perfectly competitive economies with generally complete markets subject to real shocks (random
changes in technology or productivity), it makes the argument that cycles are consistent with
competitive general equilibrium environments in which all agents are rational maximizes.
Contrary to what Keynesian, Monetarist, and new classical economists believed, RBC theorists, starting
with Nelson and Plosser in 1982, found that the hypothesis that GDP growth follows a random walk
cannot be rejected. They argued that most of the changes in GDP were permanent, and that output
growth would not revert to an underlying trend following a shock. "In this case, the observed
fluctuations in GNP are fluctuations in the natural (trend) rate of output, not deviations of output from a
smooth determinist trend." (Snowdon)
Typically RBC models have the following features:
They use a representative agent framework, thereby avoiding aggregation problems.
Firms and households have explicit objective (utility) functions that they maximize subject to budget
and technology constraints.
Cycles are created by exogenous productivity shocks (impulse mechanism), which are amplified by
propagation mechanisms such as intertemporal substitution, consumption smoothing, investment
lag, or inventory building. Kydland and Prescott’s time-to-build model, for example, assumes that it
takes 4 quarters to build capital. They furthermore employ a fatigue effect, which incorporates into
the model that more labor in t = 1 will lead to higher preference for leisure in t = 2.
Their basic assumptions are rational expectations, perfect (competitive) markets, and perfect
information.
RBC models were generally successful in accounting for persistence and comovement, but less
successful in offering convincing explanations for fluctuations in employment.
_____________________________________________________________________________________
S.A. – (Sustainable Advantage) Sustainable competitive advantage is the focal point of corporate
strategy. It allows the maintenance and improvement of any enterprise's competitive position in the
market. It is an advantage that enables business to survive against its competition over a long period of
time.
_____________________________________________________________________________________

Sales Lift – incremental increase in sales attributable to an event or campaign and can be online or
offline.
_____________________________________________________________________________________
Seasonal Adjustment – statistical method for removing the seasonal component of a time series used
when analyzing non‐seasonal trends. Seasonal adjustment is a statistical method for removing the
seasonal component of a time series that is used when analyzing non‐seasonal trends. It is normal to
report seasonally adjusted data for unemployment rates to reveal the underlying trends in labor
markets.
The investigation of many economic time series becomes problematic due to seasonal fluctuations.
Series are made up of four components:
St: The seasonal component
Tt: The trend component
Ct: The cyclical component
It: The error, or irregular component.
Unlike the trend and cyclical components, seasonal components, theoretically, happen with similar
magnitude during the same time period each year. The seasonal component of a series is often
considered to be uninteresting in their own right and to cause the interpretation of a series to be
ambiguous. By removing the seasonal component, it is easier to focus on other components. A good
example is the decrease of Voice traffic in Cell sites close to universities during holidays.
_____________________________________________________________________________________
Sensitivity Analysis – study of how the variation in the output of an analysis (e.g. a cost‐benefit analysis)
changes when various inputs are change. In any budgeting process there are always variables that are
uncertain. Future tax rates, interest rates, inflation rates, headcount, operating expenses and other
variables may not be known with great precision. Sensitivity analysis answers the question, "if these
variables deviate from expectations, what will the effect be (on the business, model, system, or
whatever is being analyzed)?"
In more general terms uncertainty and sensitivity analysis investigate the robustness of a study when
the study includes some form of statistical modeling. Sensitivity analysis can be useful to computer
modelers for a range of purposes, including:
Support decision making or the development of recommendations for decision makers (e.g. testing
the robustness of a result);
Enhancing communication from modelers to decision makers (e.g. by making recommendations
more credible, understandable, compelling or persuasive);
Increased understanding or quantification of the system (e.g. understanding relationships between
input and output variables); and
Model development (e.g. searching for errors in the model).

_____________________________________________________________________________________
SG&A – (Selling General and Administrative Expenses) Reported on the income statement, it is the sum
of all direct and indirect selling expenses and all general and administrative expenses of a company.
Direct selling expenses are expenses that can be directly linked to the sale of a specific unit such as
credit, warranty and advertising expenses. Indirect selling expenses are expenses which cannot be
directly linked to the sale of a specific unit, but which are proportionally allocated to all units sold during
a certain period, such as telephone, interest and postal charges. General and administrative expenses
include salaries of non‐sales personnel, rent, heat and lights.
SGA expenses consist of the combined costs of operating the company, which breaks down to:
Selling: Cost of Sales, which includes salaries, advertising expenses, cost of manufacturing, rent, and
all expenses and taxes directly related to producing and selling product
General: General operating expenses and taxes that are directly related to the general operation of
the company, but don't relate to the other two categories.
Administration: Executive salaries and general support and all associated taxes related to the overall
administration of the company
_____________________________________________________________________________________
Simple Free Cash Flow (Simple FCF) ‐ EBITDA minus tax, interest, and capex. A measure of financial
performance calculated as operating cash flow minus capital expenditures. Free cash flow (FCF)
represents the cash that a company is able to generate after laying out the money required to maintain
or expand its asset base. Free cash flow is important because it allows a company to pursue
opportunities that enhance shareholder value. Without cash, it's tough to develop new products, make
acquisitions, pay dividends and reduce debt.
Free Cash Flow = Cash Flow from Operations (Operating Cash) - Capital Expenditure
_____________________________________________________________________________________
Six Sigma (6σ) – business management strategy that seeks to improve the quality of process outputs by
identifying and removing the causes of defects (errors) and minimizing variability in manufacturing and
business processes. Six Sigma is a business management strategy originally developed by Motorola, USA
in 1986. Six Sigma seeks to improve the quality of process outputs by identifying and removing the
causes of defects (errors) and minimizing variability in manufacturing and business processes. It uses a
set of quality management methods, including statistical methods, and creates a special infrastructure
of people within the organization ("Black Belts", "Green Belts", etc.) who are experts in these methods.
Each Six Sigma project carried out within an organization follows a defined sequence of steps and has
quantified financial targets (cost reduction and/or profit increase).
The term Six Sigma originated from terminology associated with manufacturing, specifically terms
associated with statistical modeling of manufacturing processes. The maturity of a manufacturing

process can be described by a sigma rating indicating its yield, or the percentage of defect‐free products
it creates. A six sigma process is one in which 99.99966% of the products manufactured are statistically
expected to be free of defects (3.4 defects per million). Motorola set a goal of "six sigma" for all of its
manufacturing operations, and this goal became a byword for the management and engineering
practices used to achieve it.
_____________________________________________________________________________________
SOC – Service Order Charge, for example a Blackberry device e‐mail plan in which subscribers can
choose to add an e‐mail plan, for a certain charge per month.
_____________________________________________________________________________________
Spiff – immediate bonus for a sale of a specified product. "Spiffs" are paid, either by a manufacturer or
employer, directly to a salesperson for selling a specific product. The use of the spiff, while widely
accepted in some industries, is of questionable ethical nature. A spiff can sometimes encourage
salespeople to push a less satisfactory product upon a customer, or allow manufacturers to circumvent
the instructions or intentions of managers and owners by paying the salespeople directly. While
commission‐centric sales tactics are often transparent, based on the price of the product being pushed
by a salesperson, spiff‐centric sales tactics are less noticeable, and may be perceived as dishonest
salesmanship by consumers who are pushed towards a product when there is no evidence that the
salesperson might be biased or influenced by monetary gain. It should be noted, however, that not all
commissions are transparent based on ticket price. Many retailers pay employees different percentages
on different products, based on the gross profit margin of the item.
_____________________________________________________________________________________
Stickiness – economic situation in which a variable is resistant to change. For example, wages are said
to be sticky in the short run.
_____________________________________________________________________________________
Subscriber Acquisition Costs (SAC) – Average variable cost of acquiring a new customer. The customer
acquisition cost of mobile companies is complicated by the number of costs involved. Mobile telecoms
companies frequently pay incentives to retailers who bring in customers for their networks. They also
usually subsidize the costs of mobile phones (heavily so in the case of contract customers).
The SAC of contract connections is usually far higher than that of prepay connections because of the
greater incentives and subsidies. This is more than outweighed by the greater value to the networks of
contract customers who are committed to minimum expenditure levels.
_____________________________________________________________________________________
Supply Chain – system of organizations, people, technology, activities, information, and resources
involved in moving a product or service from supplier to customer. Supply chain activities transform

natural resources, raw materials and components into a finished product that is delivered to the end
customer. In sophisticated supply chain systems, used products may re‐enter the supply chain at any
point where residual value is recyclable. Supply chains link value chains.
_____________________________________________________________________________________
SWOT Analysis - strategic planning method used to evaluate the Strengths, Weaknesses, Opportunities,
and Threats involved in a project or a business venture. It involves specifying the objective and
identifying the internal and external factors that are favorable and unfavorable to achieve that
objective.
Setting the objective should be done after the SWOT analysis has been performed. This would allow
achievable goals or objectives to be set for the organization.
Strengths: characteristics of the business, or project team that give it an advantage over others
Weaknesses (or Limitations): are characteristics that place the team at a disadvantage relative to
others
Opportunities: external chances to improve performance (e.g. make greater profits) in the
environment
Threats: external elements in the environment that could cause trouble for the business or project
Identification of SWOTs is essential because subsequent steps in the process of planning for
achievement of the selected objective may be derived from the SWOTs. First, the decision makers have
to determine whether the objective is attainable, given the SWOTs. If the objective is NOT attainable a
different objective must be selected and the process repeated. The SWOT analysis is often used in
academia to highlight and identify strengths, weaknesses, opportunities and threats.
_____________________________________________________________________________________
Sunk Costs – Costs that have already been incurred and cannot be recovered. In economics and business
decision‐making, sunk costs are retrospective (past) costs that have already been incurred and cannot
be recovered. Sunk costs are sometimes contrasted with prospective costs, which are future costs that
may be incurred or changed if an action is taken. Both retrospective and prospective costs may be either
fixed (that is, they are not dependent on the volume of economic activity, however measured) or
variable (dependent on volume).
In traditional microeconomic theory, only prospective (future) costs are relevant to an investment
decision. Traditional economics proposes that an economic actor not let sunk costs influence one's
decisions, because doing so would not be rationally assessing a decision exclusively on its own merits.
The decision‐maker may make rational decisions according to their own incentives; these incentives may
dictate different decisions than would be dictated by efficiency or profitability, and this is considered an
incentive problem and distinct from a sunk cost problem. Evidence from behavioral economics suggests
this theory fails to predict real‐world behavior. Sunk costs greatly affect actors' decisions, because many
humans are loss‐averse and thus normally act irrationally when making economic decisions.
Sunk costs should not affect the rational decision‐makers best choice. However, until a decision‐maker
irreversibly commits resources, the prospective cost is an avoidable future cost and is properly included
in any decision‐making processes. For example, if one is considering preordering movie tickets, but has
not actually purchased them yet, the cost remains avoidable. If the price of the tickets rises to an
amount that requires him to pay more than the value he places on them, he should figure the change in
prospective cost into the decision‐making and re‐evaluate his decision.
_____________________________________________________________________________________
Take rate – The amount of people taking up on a given offer or promotion campaign. Take rate is used
to measure micro‐conversions. These can include:
Newsletter subscriptions
Downloadable materials such as eBooks
Case studies
White papers
RSS subscriptions
“Add to Friend” links for social networking sites
Up-sell and cross-sell offers added to shopping cart
_____________________________________________________________________________________
Tenure Factor – (in the CLV equation) a “Tenure Factor” reflects voluntary and involuntary churn. For
example, in the first month the tenure factor is 1.0 since 100% of the customer base is still active. In the
second month it will be less.
_____________________________________________________________________________________
Time Value of Money (TVM) – value of money figuring in a given amount of interest earned over a given
amount of time. This core principle of finance holds that, provided money can earn interest, any amount
of money is worth more the sooner it is received.
FV = PV (1+r), where
FV – Future Value
PV – Present Value
r – Rate of return
It is also referred to as present discounted value.
_____________________________________________________________________________________
Theories of cyclicality – Telecommunication industry like most businesses today is in crisis in the United
States, Europe, and other regions. The present downturn is only temporary and the industry will
recover, though not at the hyper level of the bubble years. That, however, is not the real problem for
the industry. It is not a one‐time recovery from a one‐time boom and bust. The main problem is that the
telecom industry is entering a pattern of volatility, with boom‐bust patterns becoming a common

occurrence rather than an aberration. A pattern of ups and downs may be emerging, a cycle. While
business cycles are not new to many industries, in telecom they are a new phenomenon. In the past, the
network industry progressed in only one direction: up. Telecom has always been less volatile than the
economy as a whole. It grew steadily, with long planning horizons hardly ruffled by the business cycle.
There are many competing explanations for economic cyclicality, from sunspots to the alignment of the
planets, and to the political election cycle. Many distinguished economists have contributed their views
towards the economics that govern these cycles.
The Monetarist View: According to that theory, associated especially with Friedrich von Hayek (1933,
1950) and Milton Friedman (1982), cycles are caused by flawed monetary policy that causes instability.
For example, if a central bank changes interest rates incorrectly, consumers and businesses get wrong
signals and their expectations lead to reactions that set off instabilities.
The Keynesian Perspective: Aggregate demand is affected by the mood swings of market participants
that often become self‐fulfilling, (Keynes 1936, Hicks 1950, Tobin 1975). The key trigger is psychological
and on the demand side. Keynes called it the "animal spirits" of entrepreneurs. More recently Allan
Greenspan described it as an "irrational exuberance" (Shiller, 2001).The demand orientation of the
Keynesian approach leads Wall Street analysts to look closely at data for consumer spending as leading
indicators.
Real Business Cycles Theory (RBC): This theory is a supply side story, going back to Prescott (1983) and
others. For RBC advocates, cycles are caused by random shocks and their impact on total factor
productivity. The internet was a positive shock. September 11 was a negative shock. Random positive
shocks lead to higher productivity, higher output, higher real wages, consumption, etc. For RBC
advocates, causality does not run from consumption to output but the other way around.(Espinosa‐Vega
and Guo, 2001). The theory therefore rejects explanations based on consumer psychology such as
"exuberant irrationality." RBC proponents believe that there is really nothing that governments can do
about a cycle since it is based on random shocks.
Lag and Accelerator Models: These models go back to Samuelson (1939). Small changes in desired
capacity levels lead to large differences in capacity expansion, which drives investment. Where there is a
delivery lag, unanticipated shifts in desired capacity can generate cycles of investment spending. The key
here is the adjustment lag. These lags induce oscillation in the same way that a slowly reacting
bathroom shower induces cycles of hot and cold water. The famous "cobweb" cycle is a model of such
overshooting.
The "Austrian" Theory: This view is associated with Mises (1928), Hayek (1933, 1990), Haberler (1937),
BohmBawerk (1895), Wicksell (1936), and Schumpeter (1939). It is focused on overcapacity. Such
overcapacity has been created for some reason‐whether due to exuberance, excessive bank lending,
monetary policy, or other factors. After an adjustment lag there is eventually a downturn. The pattern is
one of boom, overcapacity, price war, bust, and shakeout. A young industry tends to start off with small
firms, and once their product fetches a high price it attracts entry, which expands output and lowers
price. This goes on for a while. Industry growth rate slows below that of individual firms, and a shakeout
occurs.
Externalities: The RBC theory discussed earlier assumes constant returns to scale. That is, if one
increases the capital and labor inputs of the firms proportionately, their outputs would grow by the
same proportion. But for network industries this ignores the network effects, also known as positive
network externalities (Farmer and Guo, 1994) or the‐Metcalfe effect. An increase in usage leads to
greater utility of the product and to increased demand. This increases productivity and real wages and
enables further consumption. Growth of other network participants is factored in as part of the value of
the product, and leads to still further growth. At some point, however, the expectations of further
growth decline, for example as saturation occurs.
_____________________________________________________________________________________
Tornado Diagram – used to compare the importance of relative variables in Sensitivity Analyses. The
sensitive variable is modeled as an uncertain value while all other variables are held at baseline values. A
tornado diagram is a type of bar chart in which the data is displayed with vertical bars, with the largest
at the top and the smallest at the bottom, giving the appearance of a tornado.
_____________________________________________________________________________________
Total Quality Management (TQM) – business management concept that focuses on reducing errors
during manufacturing or service processes, increasing customer satisfaction, and streamlining the supply
chain. TQM capitalizes on the involvement of management, workforce, suppliers, and even customers,
in order to meet or exceed customer expectations. Considering the practices of TQM as discussed in six
empirical studies, Cua, McKone, and Schroeder (2001) identified the nine common TQM practices as
cross‐functional product design, process management, supplier quality management, customer
involvement, information and feedback, committed leadership, strategic planning, cross‐functional
training, and employee involvement.
_____________________________________________________________________________________
Total Shareholder Return (TSR) – combination of share price and dividends to show the total return to
the shareholder. It is used to compare the performance of different companies’ stocks and shares over
time. It is a concept used to compare the performance of different companies’ stocks and shares over
time. It combines share price appreciation and dividends paid to show the total return to the
shareholder. The absolute size of the TSR will vary with stock markets, but the relative position reflects
the market perception of overall performance relative to a reference group.
With Pricebegin = share price at beginning of period, Priceend = share price at end of period, Dividends =
dividends paid and TSR = Total Shareholder Return, TSR is computed as
TSR = (Priceend − Pricebegin + Dividends) / Pricebegin
_____________________________________________________________________________________
Unsupported App – app where the creator lacks the infrastructure or commitment to resolve issues.
These apps could be broken by an OS update. In wireless, unsupported apps could also lead to
additional customer service expense or negative publicity for the carrier or device‐ maker.
_____________________________________________________________________________________
USP – Unique Selling Point, Unique Selling Proposition. Competitive advantage. Pinpointing the USP
requires some hard soul‐searching and creativity. To start the company needs to analyze how other

companies use their USPs to their advantage. This requires careful analysis of other companies' ads and
marketing messages. An analysis of what the competition sells, not just their product or service
characteristics, but they need to get a great deal about how companies distinguish themselves from
competitors.
To uncover a company’s USP and use it to power sales, here are some steps that might need to be done.
Analyzing customers’ needs: Too often, entrepreneurs fall in love with their product or service and
forget that it is the customer's needs, not their own, that they must satisfy. Step back from the daily
operations and carefully scrutinize what customers really want.
Know what motivates customers' behavior and buying decisions. Effective marketing requires a
person to be an amateur psychologist. They need to know what drives and motivates customers. This
goes beyond the traditional customer demographics, such as age, gender, race, income and
geographic location that most businesses collect to analyze their sales trends.
Uncover the real reasons customers buy your product instead of a competitor's. As business grows,
the best source of information for the company is the customers themselves. So reaching out to
customers for feedback would be a great strategy to the company.
_____________________________________________________________________________________
Value Added Service (VAS) – all services in telecommunications beyond standard voice and text
transmissions. In the telecommunication industry, on a conceptual level, value‐added services add value
to the standard service offering, spurring the subscriber to use their phone more and allowing the
operator to drive up their ARPU. For mobile phones, while technologies like SMS, MMS and GPRS are
usually considered value‐added services, a distinction may also be made between standard (peer‐to‐
peer) content and premium‐charged content. These are called mobile value‐added services (MVAS)
which are often simply referred as VAS.
_____________________________________________________________________________________
Value Chain – series of activities for a firm operating in a specific industry. Products pass through all
activities of the chain in order, and at each activity the product gains some value. The chain of activities
gives the products more added value than the sum of added values of all activities. The Value Chain
concept was first described by Michael Porter in 1985.
Primary Activities in a Value chain are:
Inbound Logistics: Here goods are received from a company's suppliers. They are stored until they
are needed on the production/assembly line. Goods are moved around the organisation.
Operations: This is where goods are manufactured or assembled. Individual operations could include
room service in a hotel, packing of books/videos/games by an online retailer, or the final tune for a
new car's engine.
Outbound Logistics: The goods are now finished, and they need to be sent along the supply chain to
wholesalers, retailers or the final consumer.

Marketing and Sales: In true customer orientated fashion, at this stage the organisation prepares the
offering to meet the needs of targeted customers. This area focuses strongly upon marketing
communications and the promotions mix.
Service: This includes all areas of service such as installation, after-sales service, complaints handling,
training and so on.
_____________________________________________________________________________________
Value Driver – an activity or organizational focus which enhances the perceived value of a product or
service in the perception of the consumer and which therefore creates value for the producer. Advanced
technology, reliability, or reputation for customer service can all be value drivers.
_____________________________________________________________________________________
Variable Cost – expenses that change in proportion to the activity of the business. Variable cost is the
sum of marginal costs over all units produced. It can also be considered normal costs. Fixed costs and
variable costs make up the two components of total cost. Direct Costs, however, are costs that can
easily be associated with a particular cost object. However, not all variable costs are direct costs. For
example, variable manufacturing overhead costs are variable costs that are indirect costs, not direct
costs. Variable costs are sometimes called unit‐level costs as they vary with the number of units
produced.
Direct labor and overhead are often called conversion cost, while direct material and direct labor are
often referred to as prime cost.
_____________________________________________________________________________________
Vertical Chain/Vertical Integration – A style of management control where companies in a supply chain
are united through a common owner. Vertically integrated companies in a supply chain are united
through a common owner. Usually each member of the supply chain produces a different product or
(market‐specific) service, and the products combine to satisfy a common need. It is contrasted with
horizontal integration.
Vertical integration is one method of avoiding the hold‐up problem. A monopoly produced through
vertical integration is called a vertical monopoly.
_____________________________________________________________________________________
Vertical Market – group of similar businesses and customers that engage in trade based on specific and
specialized needs. A vertical market (often referred to simply as a "vertical") is a group of similar
businesses and customers that engage in trade based on specific and specialized needs. Often,
participants in a vertical market are very limited to a subset of a larger industry (a niche market). An
example of this sort of market is the market for point‐of‐sale terminals, which are often designed
specifically for similar customers and are not available for purchase to the general public. Vertical
marketing can be witnessed at trade shows.
_____________________________________________________________________________________
Visitor Roaming – use of a cell phone on a carrier’s network by a non‐customer, payment for which is
arranged between the carrier and the user’s wireless service provider.
_____________________________________________________________________________________
Voluntary Churn – percentage of customers who choose to deactivate their service.
_____________________________________________________________________________________
Waterfall Chart – form of data visualization which helps in determining the cumulative effect of
sequentially introduced positive or negative values. A waterfall chart is a form of data visualization that
helps in determining the cumulative effect of sequentially introduced positive or negative values. The
waterfall chart is also known as a flying bricks chart or Mario chart due to the apparent suspension of
columns (bricks) in mid‐air. Often in finance, it will be referred to as a bridge.
Waterfall charts were popularized by the strategic consulting firm McKinsey & Company in its
presentations to clients.
_____________________________________________________________________________________
What is Strategy – management book by Michael Porter. The book explains how the strategic model of
the 1980s was based on productivity, increasing market share, and lowering costs, all of which led to
philosophies like Total Quality Management (TQM), benchmarking, outsourcing, re‐engineering, Six
Sigma, Lean Enterprise, and so on. Continuing incremental improvement, however, brings different
players to the same level. Porter states that a company’s strategy should focus on customer needs,
customer accessibility, or the variety of a company’s products and services. In the value chain, one link
can be imitated, but the chain is difficult to imitate. The tradeoff is that for a company to excel at some
things, it must make a conscious decision not to do other things.
_____________________________________________________________________________________
Yield – rate of income generated.
_____________________________________________________________________________________
YOY – Year over Year.
_____________________________________________________________________________________

About the Author
Harish Vadada is a Wireless engineer and web 2.0 enthusiast and has
spent more than a decade helping large companies build and
develop networks. He has designed and built networks on 4G/3G/2G
technologies and helped make strategic decisions evaluating
emerging technologies and architectures and launch new products
and services for various operators and vendors in the US.
He is also a co‐founder and Chief Strategy Officer of software
product startup Gyanfinder – a social training network for the eLearning industry. He is also an avid
technology blogger and writer having contributed to various telecom magazines as a writer. He has a
Master’s of Science in Electrical Engineering from Lamar University, Texas and lives with his wife and
two kids in Martinez, California.
Please reach out to him on – harish.vadada@telecom‐cloud.net for questions/suggestions.
LinkedIn ‐ http://www.linkedin.com/in/harishvadada
Twitter ‐ @ TelecomCloud_4G