Wire-Free A 3 TM Consulting Stephen Adams Mohib Ahmad Tara Armatas Keron Twum Matt Muller.
23
Wire-Free A 3 TM Consulting Stephen Adams Mohib Ahmad Tara Armatas Keron Twum Matt Muller
-
date post
22-Dec-2015 -
Category
Documents
-
view
214 -
download
0
Transcript of Wire-Free A 3 TM Consulting Stephen Adams Mohib Ahmad Tara Armatas Keron Twum Matt Muller.
Wire-FreeA3TM Consulting Stephen Adams
Mohib AhmadTara ArmatasKeron TwumMatt Muller
Wire-Free
Executive Summary
“Wire-Free” Concept Advanced Technology Ease-of-Use for Consumers No Wires. Period. Allows Users a Choice
Wire-Free
New Product Development Increased Use of Wireless Technology Competition Already In Market Concept Offers Practical Options Viable Option for
First Time Buyers Innovators Early Adopters Older and Younger Generations Alike
Wire-Free
New Product Development Competitive Advantage #3, #4, #5 in the Market Complete Manufacturing – All In One Established Product offering
Sleek Design Brilliant Picture Simplicity Reliability
Wire-Free
Situation Analysis Industry/Category Analysis Sales Analysis Competitor Analysis Customer Analysis Planning Assumptions Forecasting
Wire-Free
Industry/Category Analysis Market for wireless home networking
equipment was estimated at $1.7 billion in 2004
Up from $427 million in 2002 Market is expected to grow to 32
million households in 2009 Opportunity for us as consumers are
increasingly adopting Wi-Fi devices
Wire-Free
Sales Analysis Product marketed towards innovators
(1%) and early adopters (2-3 %) Opinion-makers would help diffuse the
message across aiding the accompanying ad campaign
Garner around 0.3% share of Consumer Home Electronics market
Wire-Free
Competitor Analysis #1 and #2 would pour money into
R&D to have similar value additions in their products
Having deep pockets, they can afford it However being market leaders, they
would be compelled to develop a better product than ours
To nullify any potential edge, A3TM needs to keep innovating the product
Wire-Free
Customer Analysis B2B focus Customer(s) would have a value-added
product and an opportunity to increase market share
Wire-Free
Planning Assumptions HDTV would become the first choice of
consumers buying a new TV (low) The wireless market would grow to 24
million households by 2007 (low) The sales would be innovation-driven
(medium) Bass model can forecast sales
effectively for our product (medium)
Wire-Free
Forecasting According to ATAR, the market share is
for the first year would be 1.5% (1%) 360,000+ (320,000+) households by
2007
Wire-Free
Corporate Objectives Overall Marketing Objectives
Market Acceptance Program Objectives
Pricing Advertising/Promotion Sales Distribution Product
Wire-Free
Marketing Strategy Targets
Customer Targets Competitor Targets
Core Strategy Strategic Alternatives Considered
Wire-Free
Integrated Marketing Plan Our Core Strategy
Offer manufacturers the full triad of quality, cost, and speed
Sales Pre-launch and pre-announcement
period International CES
Trade shows and conferences
Wire-Free
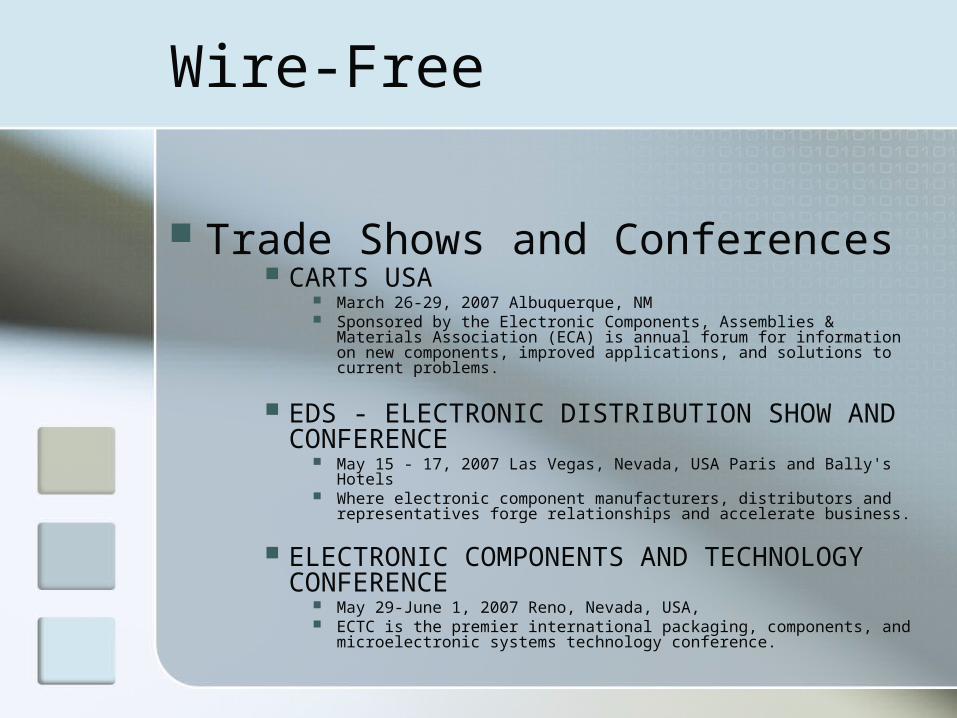
Trade Shows and Conferences CARTS USA
March 26-29, 2007 Albuquerque, NM Sponsored by the Electronic Components, Assemblies & Materials
Association (ECA) is annual forum for information on new components, improved applications, and solutions to current problems.
EDS - ELECTRONIC DISTRIBUTION SHOW AND CONFERENCE
May 15 - 17, 2007 Las Vegas, Nevada, USA Paris and Bally's Hotels Where electronic component manufacturers, distributors and
representatives forge relationships and accelerate business.
ELECTRONIC COMPONENTS AND TECHNOLOGY CONFERENCE
May 29-June 1, 2007 Reno, Nevada, USA, ECTC is the premier international packaging, components, and
microelectronic systems technology conference.
Wire-Free
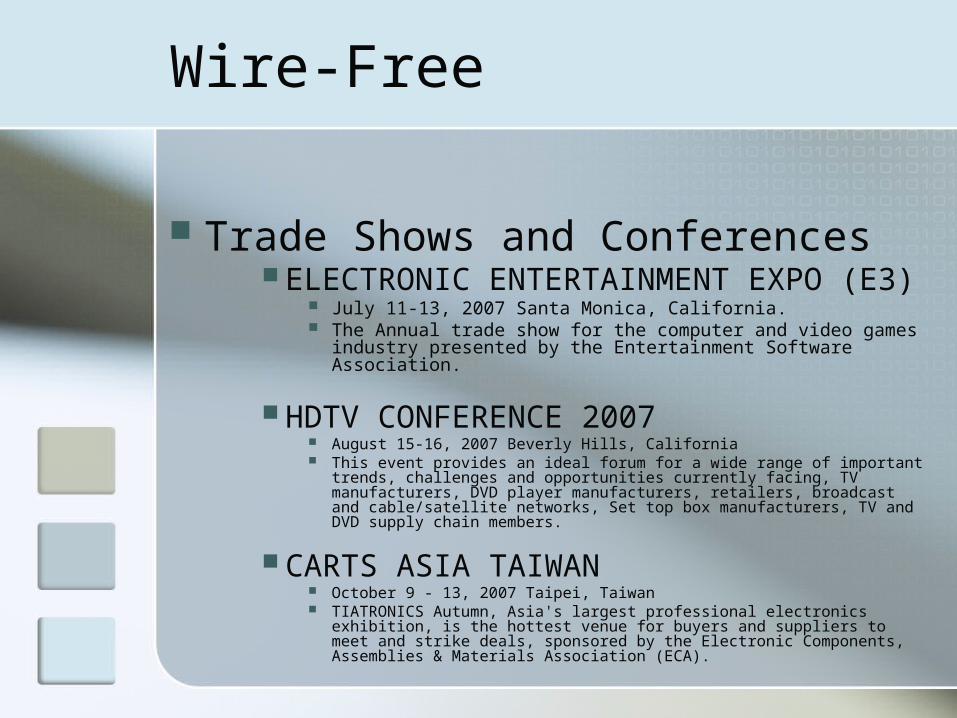
Trade Shows and Conferences ELECTRONIC ENTERTAINMENT EXPO
(E3) July 11-13, 2007 Santa Monica, California. The Annual trade show for the computer and video games
industry presented by the Entertainment Software Association.
HDTV CONFERENCE 2007 August 15-16, 2007 Beverly Hills, California This event provides an ideal forum for a wide range of important trends,
challenges and opportunities currently facing, TV manufacturers, DVD player manufacturers, retailers, broadcast and cable/satellite networks, Set top box manufacturers, TV and DVD supply chain members.
CARTS ASIA TAIWAN October 9 - 13, 2007 Taipei, Taiwan TIATRONICS Autumn, Asia's largest professional electronics exhibition, is
the hottest venue for buyers and suppliers to meet and strike deals, sponsored by the Electronic Components, Assemblies & Materials Association (ECA).
Wire-Free
Brand / Brand Management HDTV “Wire-Free” logo
Intel’s “Intel Inside”
Product packaging Silver & Black Specifications and instructions Intuitive and simple
Wire-Free
Market Research/Customer Management
Web Presence & Advertisement The flash videos, will emphasize the
benefits of HD wireless over standard televisions
uncluttered wall versus a messy clutter wall the website will display positive sales and
revenues of our original clients Launch
Merchandise in the hands of the customer to observe the interaction and reaction, just as TiVo
How to improve the firmware applications and the manufacturer
Wire-Free
Market Research/Customer Management
Tracking System Client problems and issues in order to
continually improve on the quality and functionality of our product.
Tech support personnel will have access to the data in order to diagnose and fix problems.
Design and installation engineers will also use the database to configure products and record best practices for later use in firmware and software updates to manufacturers.
Database Market research data on our client’s sales and
profitability for later use in the firm’s marketing campaign.
Wire-Free
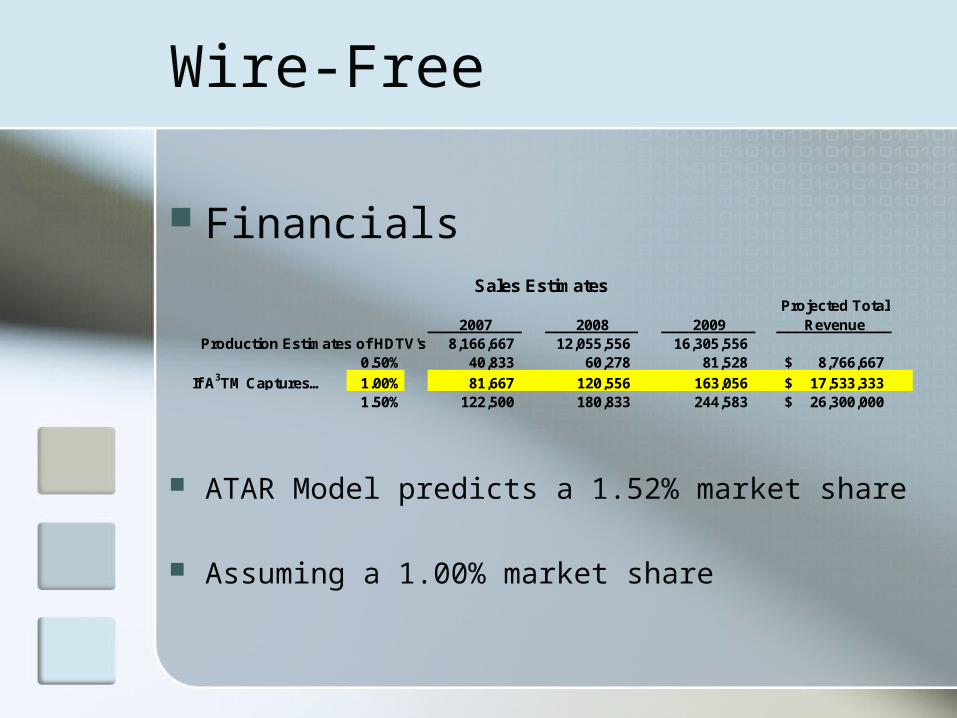
Financials
ATAR Model predicts a 1.52% market share
Assuming a 1.00% market share
2007 2008 2009Projected Total
Revenue8,166,667 12,055,556 16,305,556
0.50% 40,833 60,278 81,528 8,766,667$
If A3TM Captures… 1.00% 81,667 120,556 163,056 17,533,333$ 1.50% 122,500 180,833 244,583 26,300,000$
Production Estimates of HDTV's
Sales Estimates
Wire-Free
Financials
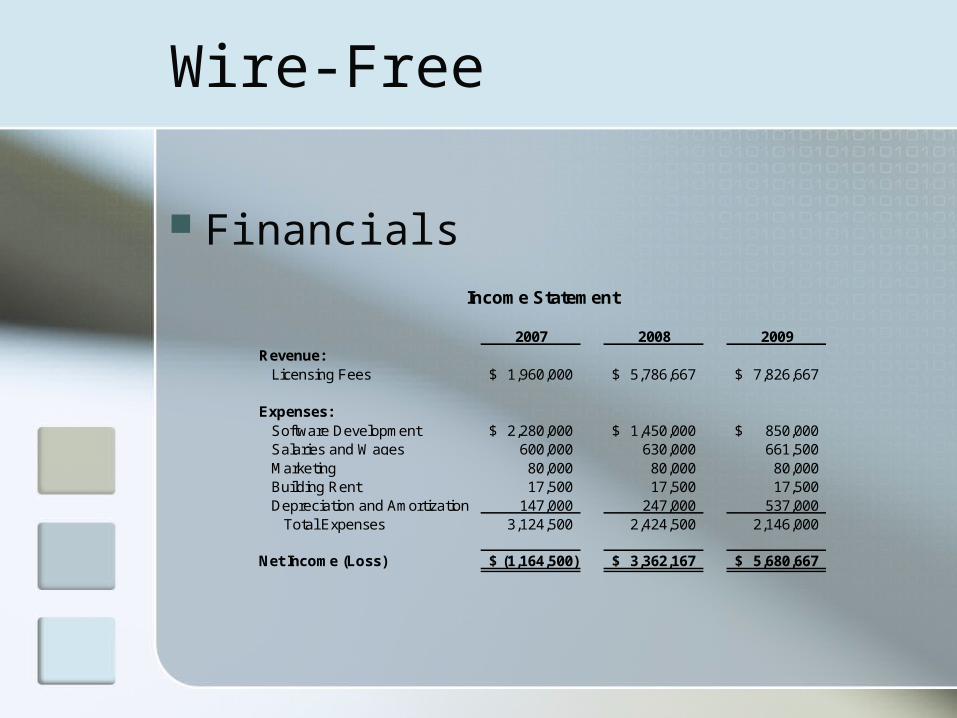
2007 2008 2009Revenue: Licensing Fees 1,960,000$ 5,786,667$ 7,826,667$
Expenses: Software Development 2,280,000$ 1,450,000$ 850,000$ Salaries and Wages 600,000 630,000 661,500 Marketing 80,000 80,000 80,000 Building Rent 17,500 17,500 17,500 Depreciation and Amortization 147,000 247,000 537,000 Total Expenses 3,124,500 2,424,500 2,146,000
Net Income (Loss) (1,164,500)$ 3,362,167$ 5,680,667$
Income Statement
Wire-Free
Financials
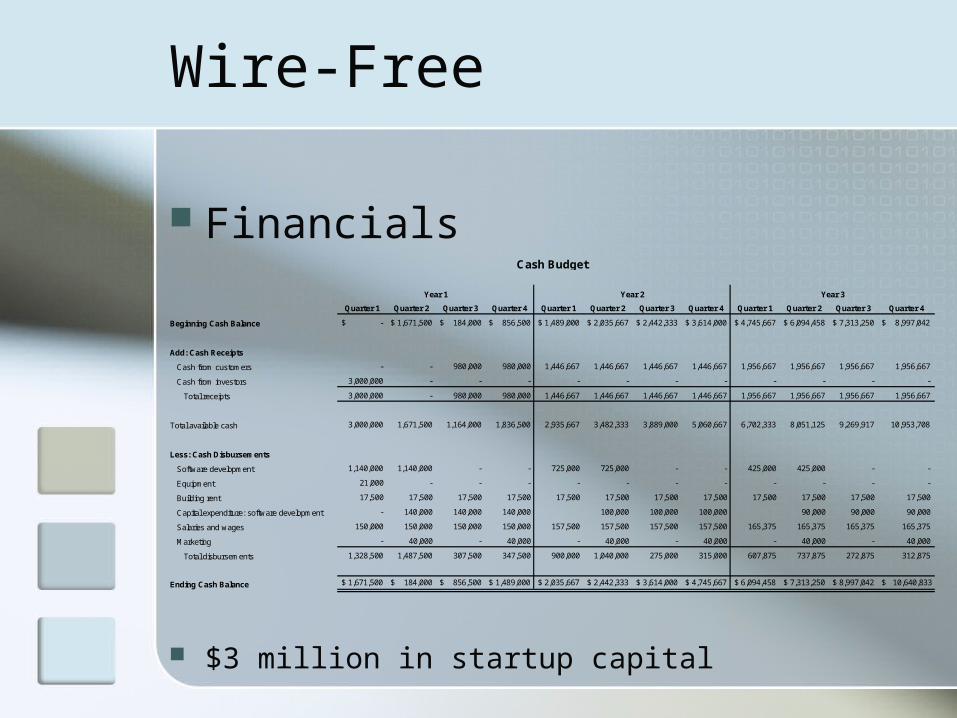
$3 million in startup capital
Quarter 1 Quarter 2 Quarter 3 Quarter 4 Quarter 1 Quarter 2 Quarter 3 Quarter 4 Quarter 1 Quarter 2 Quarter 3 Quarter 4
Beginning Cash Balance $ - $ 1,671,500 $ 184,000 $ 856,500 $ 1,489,000 $ 2,035,667 $ 2,442,333 $ 3,614,000 $ 4,745,667 $ 6,094,458 $ 7,313,250 $ 8,997,042
Add: Cash Receipts
Cash from customers - - 980,000 980,000 1,446,667 1,446,667 1,446,667 1,446,667 1,956,667 1,956,667 1,956,667 1,956,667
Cash from investors 3,000,000 - - - - - - - - - - -
Total receipts 3,000,000 - 980,000 980,000 1,446,667 1,446,667 1,446,667 1,446,667 1,956,667 1,956,667 1,956,667 1,956,667
Total available cash 3,000,000 1,671,500 1,164,000 1,836,500 2,935,667 3,482,333 3,889,000 5,060,667 6,702,333 8,051,125 9,269,917 10,953,708
Less: Cash Disbursements
Software development 1,140,000 1,140,000 - - 725,000 725,000 - - 425,000 425,000 - -
Equipment 21,000 - - - - - - - - - - -
Building rent 17,500 17,500 17,500 17,500 17,500 17,500 17,500 17,500 17,500 17,500 17,500 17,500
Capital expenditure: software development - 140,000 140,000 140,000 100,000 100,000 100,000 90,000 90,000 90,000
Salaries and wages 150,000 150,000 150,000 150,000 157,500 157,500 157,500 157,500 165,375 165,375 165,375 165,375
Marketing - 40,000 - 40,000 - 40,000 - 40,000 - 40,000 - 40,000
Total disbursements 1,328,500 1,487,500 307,500 347,500 900,000 1,040,000 275,000 315,000 607,875 737,875 272,875 312,875
Ending Cash Balance $ 1,671,500 $ 184,000 $ 856,500 $ 1,489,000 $ 2,035,667 $ 2,442,333 $ 3,614,000 $ 4,745,667 $ 6,094,458 $ 7,313,250 $ 8,997,042 $ 10,640,833
Year 1 Year 2 Year 3
Cash Budget

Questions?