WiPry User Manual - Oscium · PDF file · 2015-11-28WiPry User Manual 2.4 GHz...
16
WiPry User Manual 2.4 GHz Wireless Troubleshooting 1
-
Upload
trinhduong -
Category
Documents
-
view
239 -
download
3
Transcript of WiPry User Manual - Oscium · PDF file · 2015-11-28WiPry User Manual 2.4 GHz...
WiPry User Manual 2.4 GHz Wireless Troubleshooting
1
Table of Contents
Section 1 Getting Started 1.10 Quickstart Guide 1.20 Compatibility
Section 2 How WiPry Works 2.10 Basics 2.11 Screen Layout 2.12 Color Legend 2.20 How To Solve Wireless Speed Issues 2.21 Avoid Interference (Features used: Decay, Heat Map)
2.22 Educate Customer (Features used: AP Utilization)
2.23 Identify Interference Source (Features used: Heat Map)
2.24 Optimize Channel (Features used: Channel Guide)
2.25 Undo/Relocate Hardware (Features used: Signal to Noise Ratio)
2.30 Advanced Features 2.31 Waterfall Mode 2.32 Screenshots / Email 2.33 Data logging 2.34 Other (pause / play, power meter, average, directional antenna, average, raw, ZigBee) 2.40 Reference
The ‘Best Practice’ Icon
The ‘Field Application’ Icon
2
Section 1 Getting Started
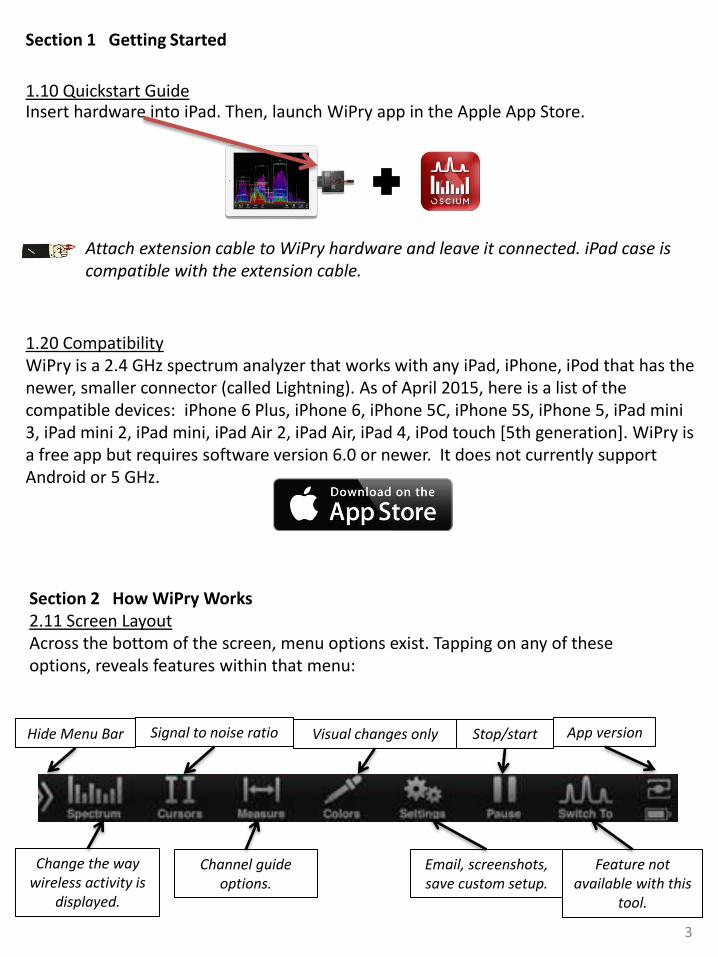
1.10 Quickstart Guide Insert hardware into iPad. Then, launch WiPry app in the Apple App Store.
Attach extension cable to WiPry hardware and leave it connected. iPad case is compatible with the extension cable.
1.20 Compatibility WiPry is a 2.4 GHz spectrum analyzer that works with any iPad, iPhone, iPod that has the newer, smaller connector (called Lightning). As of April 2015, here is a list of the compatible devices: iPhone 6 Plus, iPhone 6, iPhone 5C, iPhone 5S, iPhone 5, iPad mini 3, iPad mini 2, iPad mini, iPad Air 2, iPad Air, iPad 4, iPod touch [5th generation]. WiPry is a free app but requires software version 6.0 or newer. It does not currently support Android or 5 GHz.
3
Section 2 How WiPry Works 2.11 Screen Layout Across the bottom of the screen, menu options exist. Tapping on any of these options, reveals features within that menu:
Change the way wireless activity is
displayed.
Channel guide options.
Email, screenshots, save custom setup.
Feature not available with this
tool.
Signal to noise ratio Visual changes only Stop/start App version Hide Menu Bar
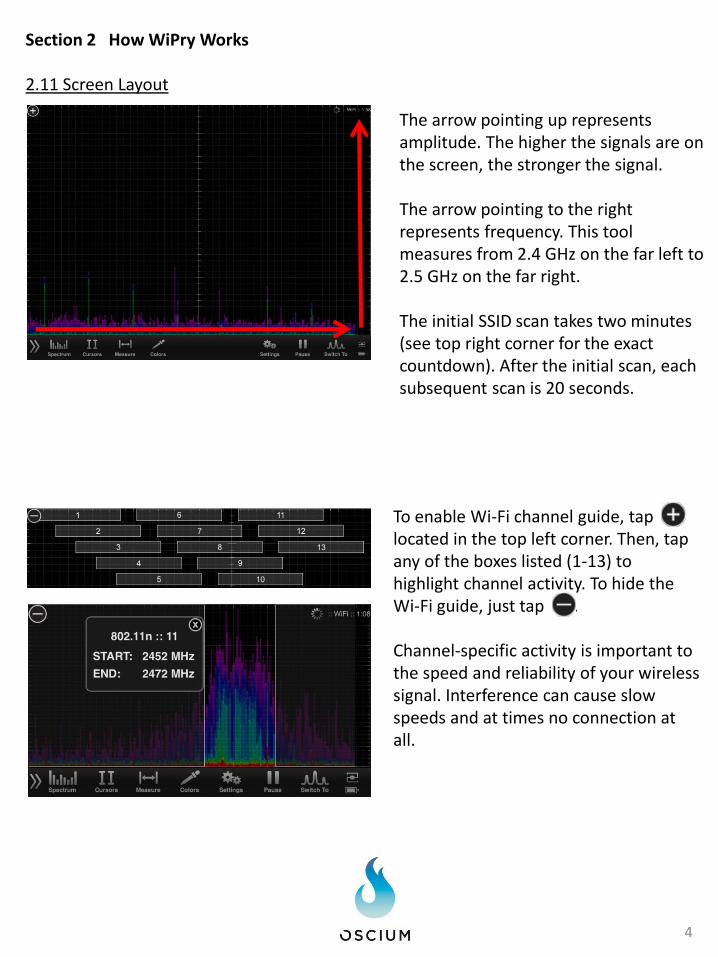
The arrow pointing up represents amplitude. The higher the signals are on the screen, the stronger the signal. The arrow pointing to the right represents frequency. This tool measures from 2.4 GHz on the far left to 2.5 GHz on the far right. The initial SSID scan takes two minutes (see top right corner for the exact countdown). After the initial scan, each subsequent scan is 20 seconds.
Section 2 How WiPry Works 2.11 Screen Layout
To enable Wi-Fi channel guide, tap located in the top left corner. Then, tap any of the boxes listed (1-13) to highlight channel activity. To hide the Wi-Fi guide, just tap . Channel-specific activity is important to the speed and reliability of your wireless signal. Interference can cause slow speeds and at times no connection at all.
4
Light purple - single packet
Blue - less than green
Green - less than yellow
Yellow - less than red
Red - noise floor, continuous
transmissions
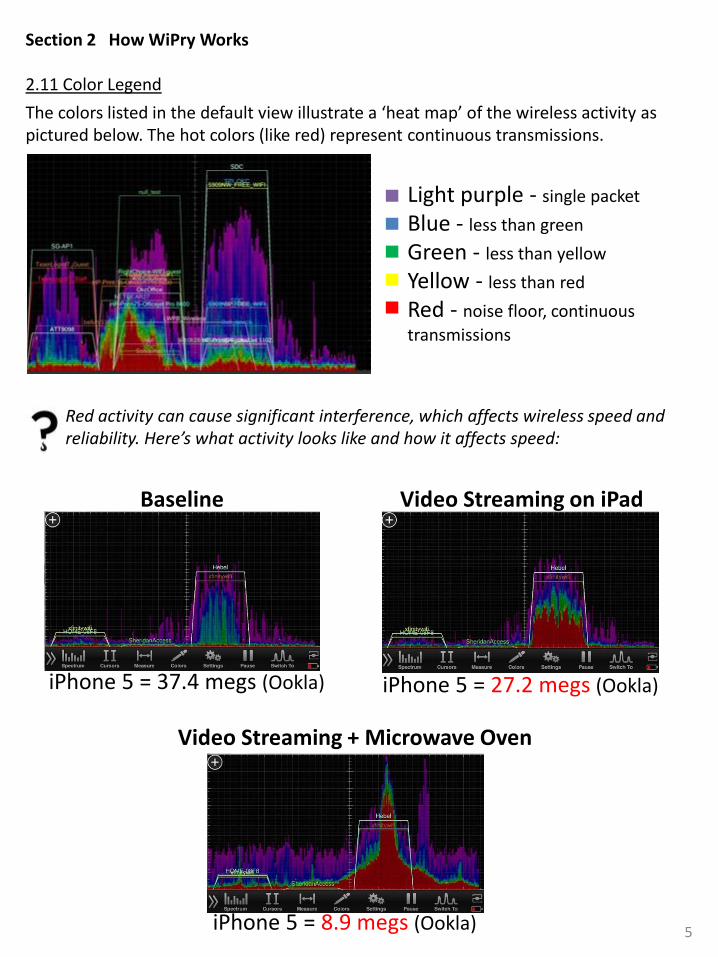
Section 2 How WiPry Works 2.11 Color Legend
The colors listed in the default view illustrate a ‘heat map’ of the wireless activity as pictured below. The hot colors (like red) represent continuous transmissions.
Red activity can cause significant interference, which affects wireless speed and reliability. Here’s what activity looks like and how it affects speed:
Baseline
iPhone 5 = 37.4 megs (Ookla)
Video Streaming on iPad
iPhone 5 = 27.2 megs (Ookla)
iPhone 5 = 8.9 megs (Ookla)
Video Streaming + Microwave Oven
5
Section 2 How WiPry Works
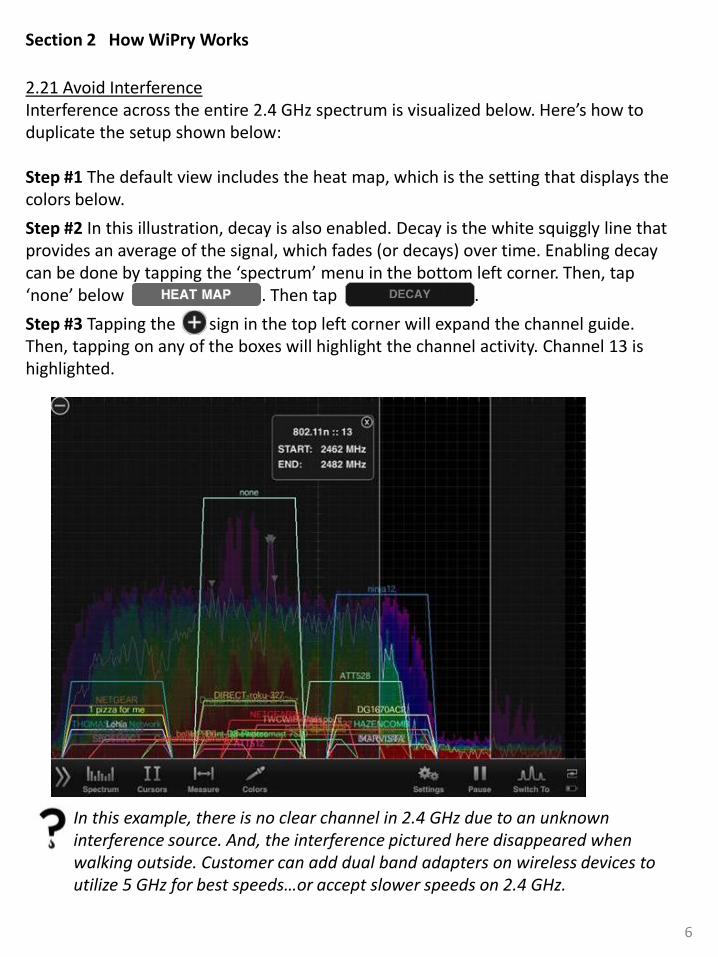
2.21 Avoid Interference Interference across the entire 2.4 GHz spectrum is visualized below. Here’s how to duplicate the setup shown below: Step #1 The default view includes the heat map, which is the setting that displays the colors below.
Step #2 In this illustration, decay is also enabled. Decay is the white squiggly line that provides an average of the signal, which fades (or decays) over time. Enabling decay can be done by tapping the ‘spectrum’ menu in the bottom left corner. Then, tap ‘none’ below . Then tap .
Step #3 Tapping the sign in the top left corner will expand the channel guide. Then, tapping on any of the boxes will highlight the channel activity. Channel 13 is highlighted.
In this example, there is no clear channel in 2.4 GHz due to an unknown interference source. And, the interference pictured here disappeared when walking outside. Customer can add dual band adapters on wireless devices to utilize 5 GHz for best speeds…or accept slower speeds on 2.4 GHz.
6
Section 2 How WiPry Works
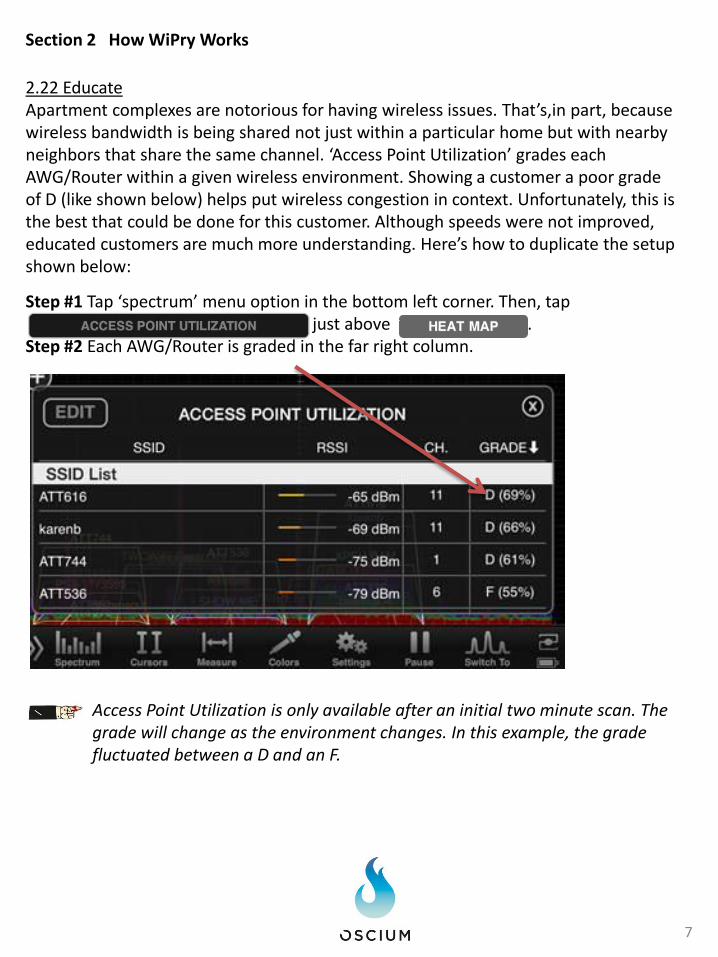
2.22 Educate Apartment complexes are notorious for having wireless issues. That’s,in part, because wireless bandwidth is being shared not just within a particular home but with nearby neighbors that share the same channel. ‘Access Point Utilization’ grades each AWG/Router within a given wireless environment. Showing a customer a poor grade of D (like shown below) helps put wireless congestion in context. Unfortunately, this is the best that could be done for this customer. Although speeds were not improved, educated customers are much more understanding. Here’s how to duplicate the setup shown below:
Step #1 Tap ‘spectrum’ menu option in the bottom left corner. Then, tap just above . Step #2 Each AWG/Router is graded in the far right column.
Access Point Utilization is only available after an initial two minute scan. The grade will change as the environment changes. In this example, the grade fluctuated between a D and an F.
7
Section 2 How WiPry Works
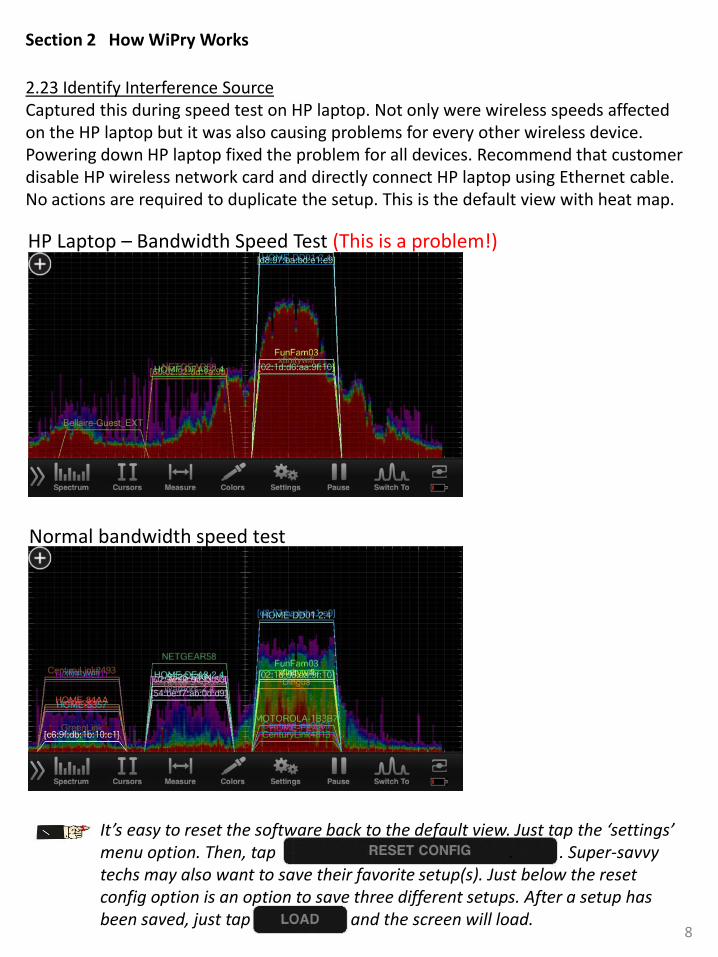
2.23 Identify Interference Source Captured this during speed test on HP laptop. Not only were wireless speeds affected on the HP laptop but it was also causing problems for every other wireless device. Powering down HP laptop fixed the problem for all devices. Recommend that customer disable HP wireless network card and directly connect HP laptop using Ethernet cable. No actions are required to duplicate the setup. This is the default view with heat map.
HP Laptop – Bandwidth Speed Test (This is a problem!)
Normal bandwidth speed test
It’s easy to reset the software back to the default view. Just tap the ‘settings’ menu option. Then, tap . . Super-savvy techs may also want to save their favorite setup(s). Just below the reset config option is an option to save three different setups. After a setup has been saved, just tap and the screen will load.
8
Section 2 How WiPry Works
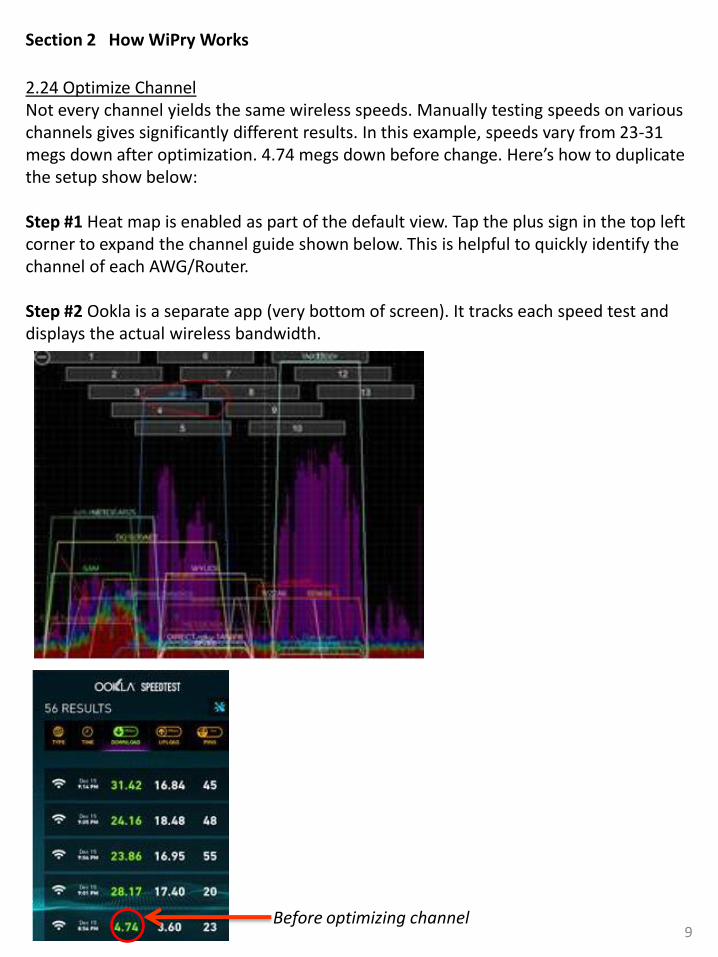
2.24 Optimize Channel Not every channel yields the same wireless speeds. Manually testing speeds on various channels gives significantly different results. In this example, speeds vary from 23-31 megs down after optimization. 4.74 megs down before change. Here’s how to duplicate the setup show below: Step #1 Heat map is enabled as part of the default view. Tap the plus sign in the top left corner to expand the channel guide shown below. This is helpful to quickly identify the channel of each AWG/Router. Step #2 Ookla is a separate app (very bottom of screen). It tracks each speed test and displays the actual wireless bandwidth.
9 Before optimizing channel
Section 2 How WiPry Works
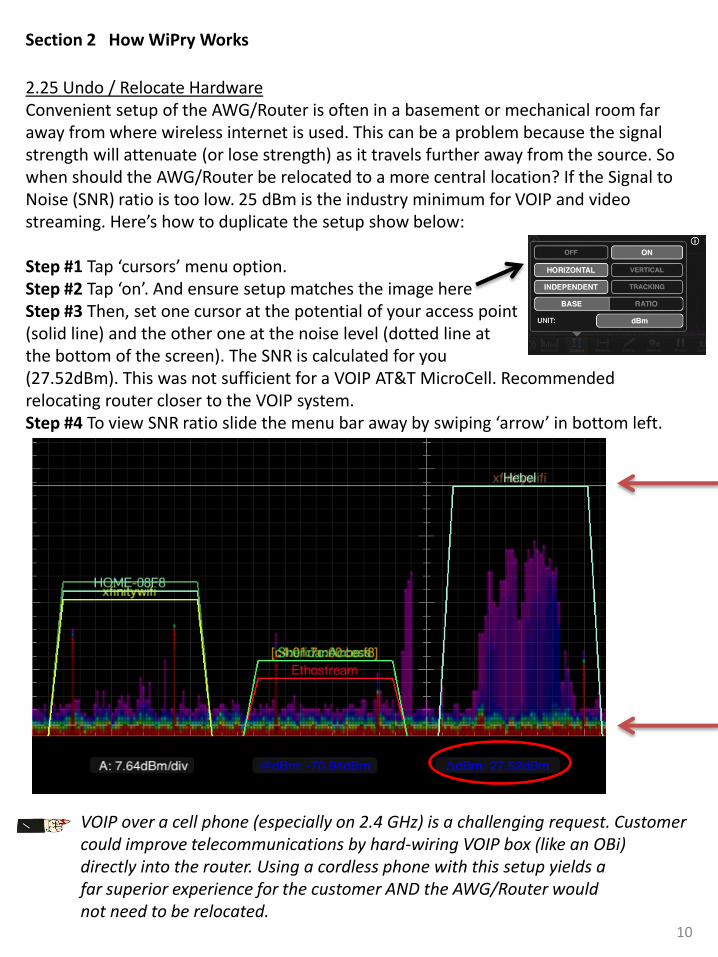
2.25 Undo / Relocate Hardware Convenient setup of the AWG/Router is often in a basement or mechanical room far away from where wireless internet is used. This can be a problem because the signal strength will attenuate (or lose strength) as it travels further away from the source. So when should the AWG/Router be relocated to a more central location? If the Signal to Noise (SNR) ratio is too low. 25 dBm is the industry minimum for VOIP and video streaming. Here’s how to duplicate the setup show below: Step #1 Tap ‘cursors’ menu option. Step #2 Tap ‘on’. And ensure setup matches the image here Step #3 Then, set one cursor at the potential of your access point (solid line) and the other one at the noise level (dotted line at the bottom of the screen). The SNR is calculated for you (27.52dBm). This was not sufficient for a VOIP AT&T MicroCell. Recommended relocating router closer to the VOIP system. Step #4 To view SNR ratio slide the menu bar away by swiping ‘arrow’ in bottom left.
VOIP over a cell phone (especially on 2.4 GHz) is a challenging request. Customer could improve telecommunications by hard-wiring VOIP box (like an OBi) directly into the router. Using a cordless phone with this setup yields a far superior experience for the customer AND the AWG/Router would not need to be relocated.
10
Section 2 How WiPry Works
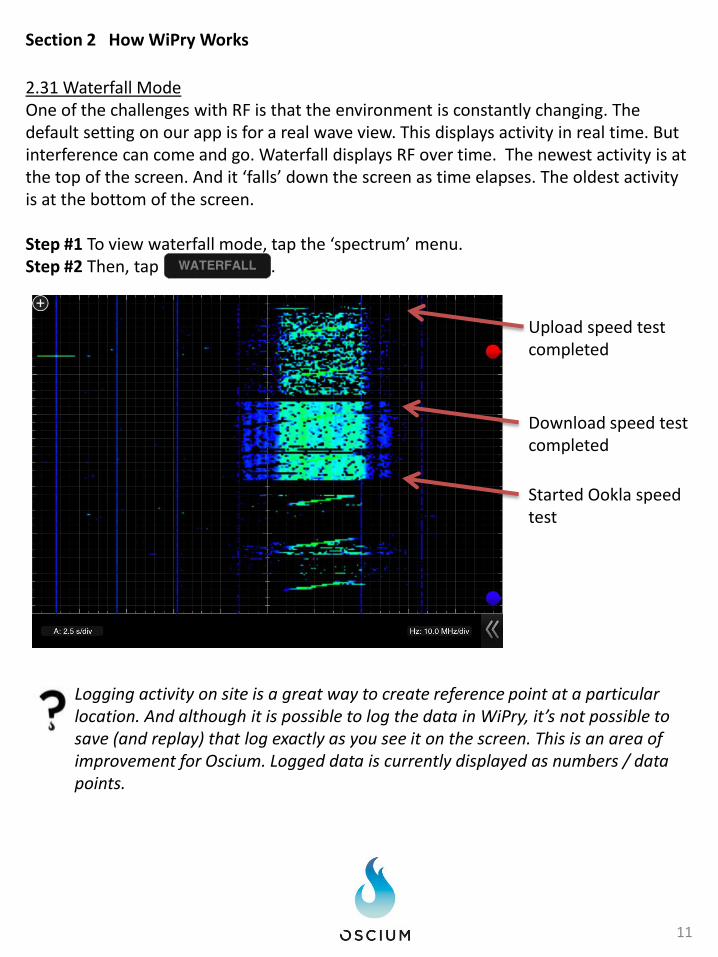
2.31 Waterfall Mode One of the challenges with RF is that the environment is constantly changing. The default setting on our app is for a real wave view. This displays activity in real time. But interference can come and go. Waterfall displays RF over time. The newest activity is at the top of the screen. And it ‘falls’ down the screen as time elapses. The oldest activity is at the bottom of the screen. Step #1 To view waterfall mode, tap the ‘spectrum’ menu. Step #2 Then, tap .
Started Ookla speed test
Download speed test completed
Upload speed test completed
11
Logging activity on site is a great way to create reference point at a particular location. And although it is possible to log the data in WiPry, it’s not possible to save (and replay) that log exactly as you see it on the screen. This is an area of improvement for Oscium. Logged data is currently displayed as numbers / data points.
Section 2 How WiPry Works
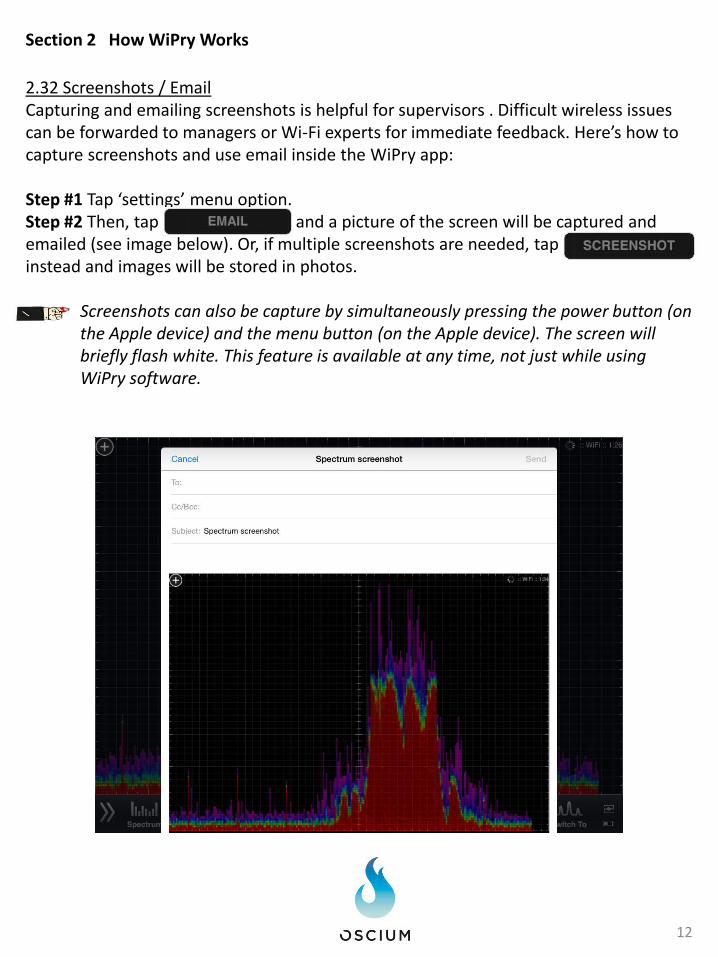
2.32 Screenshots / Email Capturing and emailing screenshots is helpful for supervisors . Difficult wireless issues can be forwarded to managers or Wi-Fi experts for immediate feedback. Here’s how to capture screenshots and use email inside the WiPry app: Step #1 Tap ‘settings’ menu option. Step #2 Then, tap and a picture of the screen will be captured and emailed (see image below). Or, if multiple screenshots are needed, tap instead and images will be stored in photos.
12
Screenshots can also be capture by simultaneously pressing the power button (on the Apple device) and the menu button (on the Apple device). The screen will briefly flash white. This feature is available at any time, not just while using WiPry software.
Section 2 How WiPry Works
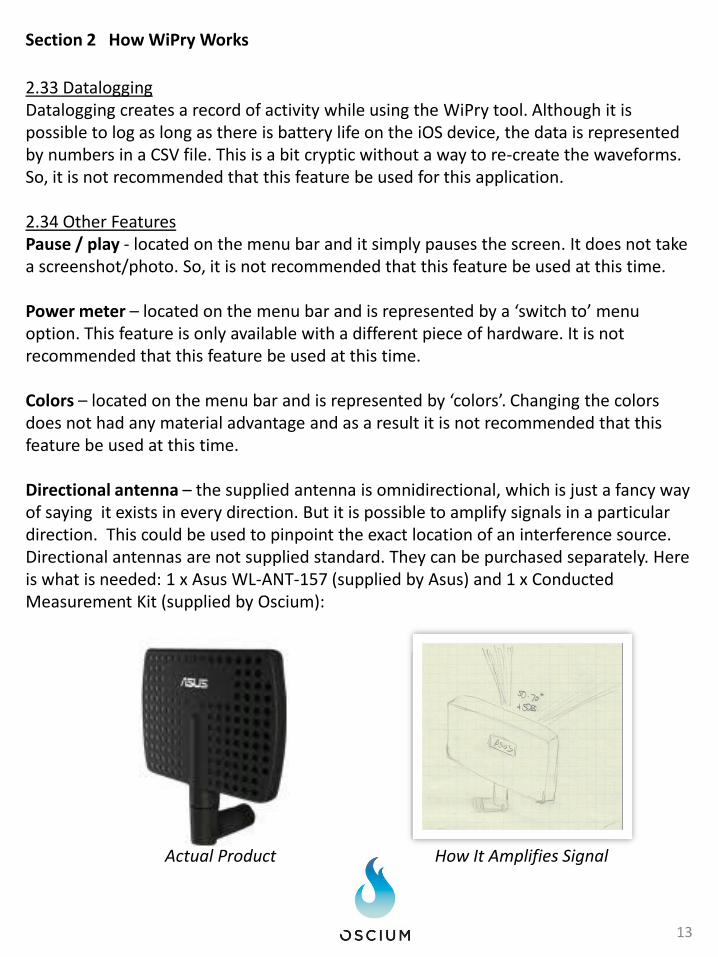
2.33 Datalogging Datalogging creates a record of activity while using the WiPry tool. Although it is possible to log as long as there is battery life on the iOS device, the data is represented by numbers in a CSV file. This is a bit cryptic without a way to re-create the waveforms. So, it is not recommended that this feature be used for this application. 2.34 Other Features Pause / play - located on the menu bar and it simply pauses the screen. It does not take a screenshot/photo. So, it is not recommended that this feature be used at this time. Power meter – located on the menu bar and is represented by a ‘switch to’ menu option. This feature is only available with a different piece of hardware. It is not recommended that this feature be used at this time. Colors – located on the menu bar and is represented by ‘colors’. Changing the colors does not had any material advantage and as a result it is not recommended that this feature be used at this time. Directional antenna – the supplied antenna is omnidirectional, which is just a fancy way of saying it exists in every direction. But it is possible to amplify signals in a particular direction. This could be used to pinpoint the exact location of an interference source. Directional antennas are not supplied standard. They can be purchased separately. Here is what is needed: 1 x Asus WL-ANT-157 (supplied by Asus) and 1 x Conducted Measurement Kit (supplied by Oscium):
13
Actual Product How It Amplifies Signal
Section 2 How WiPry Works
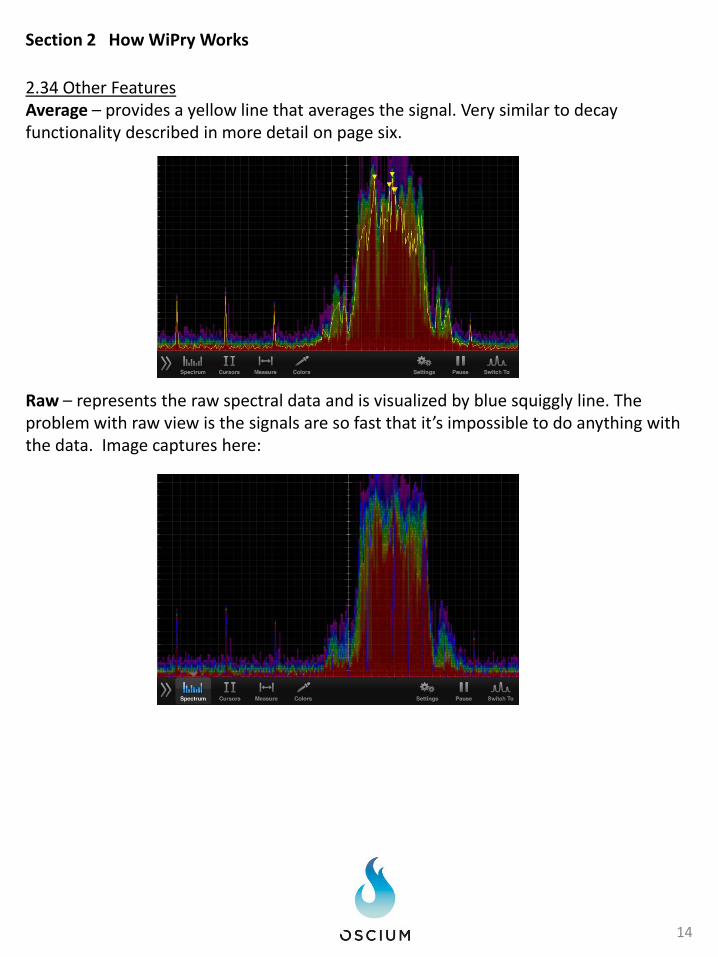
2.34 Other Features Average – provides a yellow line that averages the signal. Very similar to decay functionality described in more detail on page six. Raw – represents the raw spectral data and is visualized by blue squiggly line. The problem with raw view is the signals are so fast that it’s impossible to do anything with the data. Image captures here:
14
Section 2 How WiPry Works
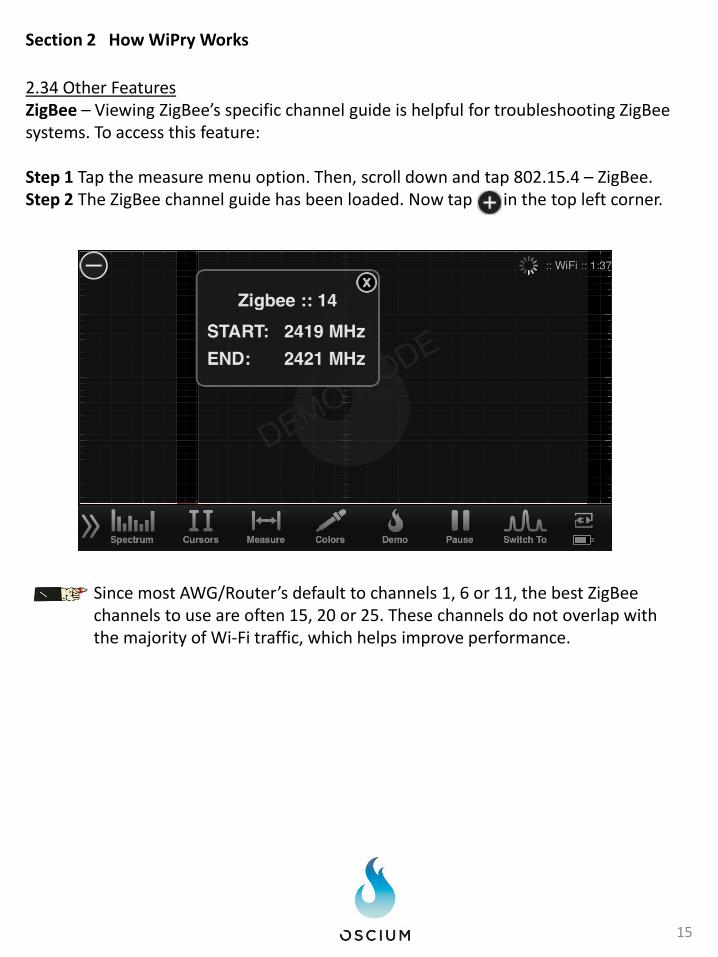
2.34 Other Features ZigBee – Viewing ZigBee’s specific channel guide is helpful for troubleshooting ZigBee systems. To access this feature: Step 1 Tap the measure menu option. Then, scroll down and tap 802.15.4 – ZigBee. Step 2 The ZigBee channel guide has been loaded. Now tap in in the top left corner.
15
Since most AWG/Router’s default to channels 1, 6 or 11, the best ZigBee channels to use are often 15, 20 or 25. These channels do not overlap with the majority of Wi-Fi traffic, which helps improve performance.
Reference
Access Point Utilization (2, 7) Apartment Complex (7) Android (3) Average (2, 14) Avoid interference (6) AWG / Router (7, 9, 10) Bandwidth Speed Test (5, 8, 9, 11) Best Practices (2, 3, 7, 8, 10, 12) Channel Guide (2, 4, 6, 9) Colors menu option (13) Color legend (2, 5) Countdown, 2-minute (7) Cordless phone (10) Cursors (10) Data Logging (13) Directional Antenna (2, 13) Decay (2, 6) Educate Customer (7) Email (2, 12) Extension Cable (3) Grading (7) Hardware, WiPry (3) Heat Map (2, 5, 6, 8, 9) Identify Interference Source (8, 13) Load Config (8) Lightning (3) Menu Bar (3, 10) OBi (10) Optimize Channel (2, 4, 9) Ookla (5, 8, 9, 11) Pause/Play (2, 13) Power Meter (2, 13) Raw (2, 14) Relocate Hardare (2, 10) Reset Config (8) Save Config (8) Screen Layout (2, 4) 16
Screenshots (2, 12) Software, WiPry (3) Speed test (5, 8, 9, 11) Signal-to-noise or SNR ratio (2, 10) Table of Contents (2) Video Streaming (5) VOIP (10) Why Care (2, 5, 6) WiPry (3) ZigBee (3, 15) 5 GHz (3, 6)