WINSTON-SALEM URBAN AREA · · 2009-06-182.2 EXISTING CONDITIONS OVERVIEW ... and was later...
27
WINSTON-SALEM URBAN AREA CONGESTION MANAGEMENT PROCESSES (CMP) Prepared by: The Winston-Salem Department of Transportation February 2009
Transcript of WINSTON-SALEM URBAN AREA · · 2009-06-182.2 EXISTING CONDITIONS OVERVIEW ... and was later...

WINSTON-SALEM URBAN AREA
CONGESTION MANAGEMENT
PROCESSES (CMP)
Prepared by: The Winston-Salem Department of Transportation February 2009

2035 Winston-Salem Urban Area LRTP Congestion Management Processes 2

2035 Winston-Salem Urban Area LRTP Congestion Management Processes 3
TABLE OF CONTENTS ABBREVIATION AND ACRONYM DEFINITIONS………………………………………...1 1.0 INTRODUCTION ………………………………………………………………………….2
1.1 FEDERAL REQUIREMENTS…………………………………………………….2
1.2 WINSTON-SALEM CMS HISTORY……………………………………………..3
1.3 PLAN OBJECTIVES………………………………………………………………4 2.0 BASIS FOR ANALYSIS………………………………………………………………….5
2.1 DEFINING CONGESTION……………………………………………………….5 2.2 EXISTING CONDITIONS OVERVIEW………………………………………….5
3.0 CMP ELEMENTS………………………………………………………………………….6
3.1 ELEMENT #1. OPERATIONS OBJECTIVES…………………………………..6
3.2 ELEMENT #2. AREA OF APPLICATIONS……………………………………..7
3.3 ELEMENT #3. TRANSPORTATION SYSTEM DEFINITION…………………8
3.4 ELEMENT #4. PERFORMANCE MEASURES………………………………...10
3.5 ELEMENT #5. PERFORMANCE MONITORING……………………………...12
3.6 ELEMENT #6. IDENTIFICATION AND EVALUATION OF STRATEGIES…13
3.7 ELEMENT #7. MONITORING OF STRATEGY EFFECTIVENESS…………14
3.8 ELEMENT #8. IMPLEMENTATION AND MANAGEMENT…………………..23
4.0 FUTURE INITIATIVES …………………………………………………………………..24

2035 Winston-Salem Urban Area LRTP Congestion Management Processes 4
LIST OF FIGURES FIGURE 1. WINSTON-SALEM URBAN AREA MPO BOUNDARY………………………4 FIGURE 2. FEDERAL FUNCTIONAL CLASSIFICATION MAP.……………….After pg 10 LIST OF TABLES TABLE 1: PRIMARY ANALYSIS NETWORK………………………………………………..9 TABLE 2: VOLUME TO CAPACITY LOS…………………………………………………...10 TABLE 3: INTERSECTION LOS……………………………………………………………..10
TABLE 4: CONGESTION MANAGEMENT STRATEGY CLASSES……………………..12
TABLE 5: MONITORING TOOLKIT…………………………………………………………15
APPENDICES APPENDIX A: NCDOT BIENNIAL COVERAGE COUNT PROCESS APPENDIX B: SURVEILLANCE CAMERA AND MESSAGE SIGN LOCATIONS APPENDIX C: INCIDENT MANAGEMENT AND ITS TRAVELER INFORMATION APPENDIX D: FUNDING SOURCES

2035 Winston-Salem Urban Area LRTP Congestion Management Processes 5
ABBREVIATION AND ACRONYM DEFINITIONS ADT Average Daily Traffic CBD Central Business District CIP Capital Improvement Program CMAQ Congestion Mitigation Air Quality CMP Congestion Management Process (es) CMS Congestion Management System (s) FCEAD Forsyth County Environmental Affairs Department FFC Federal Functional Classification FHWA Federal Highway Administration GIS Geographical Information System HCM Highway Capacity Manual HOV High Occupancy Vehicle ISTEA Intermodal Surface Transportation Efficiency Act ITS Intelligent Transportation System IVHS Intelligent Vehicle Highway System LJVM Lawrence Joel Veterans Memorial (Coliseum) LOS Level of Service LRTP Long Range Transportation Plan MAB Metropolitan Area Boundary MAC Metro Activity Center MPO Metropolitan Planning Organization NCDOT North Carolina Department of Transportation PART Piedmont Authority for Regional Transportation ROW right of way SAFETEA-LU Safe, Accountable, Flexible, Efficient Transportation Equity Act:
Legacy for Users SOV Single Occupancy Vehicle STIP State Transportation Implementation Program STP-DA Surface Transportation Program – Direct Attributable TAC Transportation Advisory Committee TCC Technical Coordinating Committee TEA Transportation Equity Act TIP Transportation Improvement Program TMA Transportation Management Area UDO Unified Development Ordinances V/C Volume/Capacity VHT Vehicle Hours Traveled VMT Vehicle Miles Traveled WSDOT Winston-Salem Department of Transportation WSMAB Winston-Salem Metropolitan Area Boundary WSTA Winston-Salem Transit Authority WSUA Winston-Salem Urban Area

2035 Winston-Salem Urban Area LRTP Congestion Management Processes 6
1.0 INTRODUCTION For decades, the North Carolina Department of Transportation (NCDOT) has worked cooperatively and effectively with the City of Winston-Salem and the other municipalities in the Winston-Salem Urban Area to address most of the major existing traffic congestion problems and conditions. These agencies have developed and used a variety of tools to manage congestion in the urban area including an extensive computerized traffic signal system, the innovative and nationally recognized Mobility Manager project implemented by the Winston-Salem Transit Authority’s (WSTA), the City’s traffic safety improvement program to minimize congestion related to accidents, and an expanding menu of Intelligent Transportation System (ITS) techniques like variable message signs and traffic surveillance camera systems. These components were described and included in the Congestion Management Plan section of the 1999 and 2002 editions of the 2025 Multi-modal Long Range Transportation Plan (LRTP) for the Winston-Salem Urban Area.
While NCDOT, the City of Winston-Salem, and some other municipalities like the Town of Kernersville, have developed these tools independently over time, they have not been developed as a part of an entire management system for the urban area. In order to maximize our return on transportation investments, we must effectively manage traffic congestion on a systematic approach. 1.1 FEDERAL REQUIREMENTS In 1998, the Transportation Equity Act for the 21st Century (TEA-21) continued the requirement that was first established in the 1991 Intermodal Surface Transportation Efficiency Act (ISTEA) that each Transportation Management Area (TMA) with an urbanized population over 200,000 develop and implement a Congestion Management System (CMS). Additionally, a CMS must be developed and implemented as part of the regular Metropolitan Planning Organization (MPO) planning process. The TEA-21 defines that an effective CMS “…is a systematic process for managing congestion that provides information on transportation system performance and on alternative strategies for alleviating congestion and enhancing the mobility of persons and goods to levels that meet State and local needs. The CMS results in serious consideration of implementation of strategies that provide the most efficient and effective use of existing and future transportation systems. In … metropolitan areas, consideration needs to be given to strategies that reduce single occupant vehicles (SOV) travel and improve existing transportation system efficiency.” The regulations go on to state the following required elements of an effective CMS will include: Methods to monitor and evaluate the performance of the multi-modal transportation system,
identify the causes of congestion, identify and evaluate alternative actions, provide information supporting the implementation of actions, and evaluate the efficiency and effectiveness of implemented actions;
Definition of parameters for measuring the extent of congestion and for supporting the evaluation of the effectiveness of congestion reduction and mobility enhancing strategies for the movement of people and goods;
Establishment of a program for data collection and system performance monitoring to define the extent and duration of congestion, to help determine the causes of congestion, and to evaluate the efficiency and effectiveness of implemented actions;
Identification and evaluation of the anticipated performance an expected benefits of appropriate traditional and non-traditional congestion management strategies;
Identification of an implementation schedule, implementation responsibilities, and possible funding sources for each strategy proposed for implementation;

2035 Winston-Salem Urban Area LRTP Congestion Management Processes 7
Implementation of a process for periodic assessment of the efficiency and effectiveness of implemented strategies, in terms of the area’s established performance measures.
On August 10, 2005, the President signed into law the Safe, Accountable, Flexible, Efficient Transportation Equity Act: A Legacy for Users (SAFETEA-LU). SAFETEA-LU builds on the foundation of ISTEA and TEA-21 with an emphasis on the use of road pricing and the promotion of real-time traffic management in all States to help improve transportation security and provide better information to travelers and emergency responders to manage congestion. 1.2 WINSTON-SALEM CMS HISTORY With the 2000 Census, the Winston-Salem Urban Area MPO was designated as a TMA on July 8, 2002 per a Federal Register notice. As a designated TMA, the Winston-Salem Urban Area MPO is required to develop and implement a CMS in cooperation with local governments, transit operators and the NCDOT within eighteen months of the designation, or January 8, 2004. With some initial training provided by the Federal Highway Administration (FHWA) in December 2003, the Winston-Salem Urban Area MPO developed a plan for creating and implementing the MPO’s first comprehensive CMS. The draft CMS plan was reviewed and approved by the FHWA on January 7, 2004, and was later presented to the Winston-Salem Urban Area Transportation Advisory Committee (TAC) on January 15, 2004. In the Winter of 2004, the Winston-Salem Urban Area MPO CMS Plan Task Force was formed to review the draft plan and provide guidance into the development of the urban area’s first comprehensive CMS Plan. The Task Force includes staff from the FHWA, NCDOT, City of Winston-Salem’s Public Works Department, Engineering Department, and Department of Transportation; City-County Planning Board, WSTA, Piedmont Authority for Regional Transportation (PART), Forsyth County Environmental Affairs Department, and the Town of Kernersville. The CMS Plan Task Force refined the draft CMS Plan in the Spring of 2004 and it was reviewed as part of the MPO’s triennial federal certification review of the Winston-Salem Urban Area MPO and its transportation planning process in August 2004. The only recommendation from the federal certification review regarding the urban area’s CMS was “the MPO needs to complete its Congestion Management System (CMS) and include it as an element in the next LRTP update.” With the inception of SAFETEA-LU in 2005, a new rule was established requiring a TMA MPO to include in its planning procedures a congestion management “process” instead of “system”. The proposed regulations reflect the goal that a Congestion Management Processes (CMP) be an integral part of developing a LRTP and TIP for a TMA MPO. The new rule transfers the congestion management system requirements to the congestion management processes subpart. Therefore, the CMS Plan will be referred to as the CMP Plan henceforth. 1.3 PLAN OBJECTIVES The Winston-Salem Urban Area MPO has five (5) objectives which are to be considered into the development of the of the urban area’s CMP Plan:
1. The CMP is to satisfy the federal requirements of a CMP as identified above; 2. The CMP is to be seriously considered at the local, MPO and State levels when
identifying and recommending capacity expansion of either highway and/or transit systems;
3. The CMP is to utilize available sources of highway, transit and other data without demanding the development of new data needs specifically for this program. While some additional data needs may become necessary, it should be minimized due to funding and staff resource limitations;

2035 Winston-Salem Urban Area LRTP Congestion Management Processes 8
4. The CMP must be flexible to meet the changing needs of the region; and 5. The CMP should not be overly complex or cumbersome.
FIGURE 1: WINSTON-SALEM URBAN AREA MPO BOUNDARY

2035 Winston-Salem Urban Area LRTP Congestion Management Processes 9
2.0 BASIS FOR ANALYSIS 2.1 DEFINING CONGESTION Federal regulations from TEA-21 defines congestion as: “…the level at which transportation system performance is no longer acceptable due to traffic interference. The level of system performance deemed acceptable by State and local officials may vary by type of transportation facility, geographic location (metropolitan area or sub-area, rural area) and/or time of day.” Put simply, traffic congestion means there are more people trying to use a given transportation facility during a specific period of time than the facility can handle with what are considered to be acceptable levels of delay or inconvenience. To some, congestion is not a problem. It is considered to be one result of economic prosperity and one we will have to learn to live with. Others argue, however, that the consequences of congestion are much more serious to an urban area. For example, congestion can cause local traffic impacts in residential neighborhoods, stifle economic growth, minimize accessibility and mobility, affect an area’s quality of life, increase traffic accidents, and worsen the quality of the air we breathe. There are two primary types of congestion – recurring and non-recurring. “Recurring” congestion tends to be concentrated into short time periods, such as “rush hours” and is usually caused from excessive traffic volumes resulting in reduced speed and flow rates within the system. Bottlenecks, seasonal traffic, long-term construction also cause recurring congestion. “Non-recurring” congestion is caused from unforeseen incidents like accidents, disabled vehicles, special events, weather, etc. that affect the driver behavior to a considerable extent. 2.2 EXISTING CONDITIONS OVERVIEW The urban area experiences both recurring and non-recurring traffic congestion on the street and highway system. Most of the recurring congestion occurs during the morning (7:00 to 9:00 a.m.) and afternoon peak hours (4:00 to 6:00 p.m.), and in some select spots during lunchtime (11:00 a.m. to 1:30 p.m). Traffic congestion in the urban area primarily occurs along the freeways and expressways like Interstate 40, US 52, Business Interstate 40 (US 421), and US 421 and other major streets or street segments on the Thoroughfare Plan such as (Silas Creek Parkway, Hanes Mall Boulevard, South Stratford Road, University Parkway, etc.); and, selected signalized intersections, major driveways and other major traffic generators. Occasionally, a few of the WSTA regular route transit lines operate at full capacity with some passengers required to stand for short periods of time. However, this is the kind of “congestion” that is considered desirable within the system. If problems do occur, historically an additional bus or change in headway has taken care of these problems. WSTA is much more concerned with the regular traffic congestion on the surface-street and highway system identified above. When congestion occurs on the street and highway system, particularly the major streets in Winston-Salem, those transit vehicles are usually caught in the same congestion as are other motor vehicles, further hurting the delivery (and attractiveness) of the transit services for the general public. There does not appear to be congestion problems with bicyclists, pedestrians, rail transportation for freight, air transportation, taxi, intercity bus or other modes in the urban area.

2035 Winston-Salem Urban Area LRTP Congestion Management Processes 10
3.0 CMP ELEMENTS There are 8 key CMP components that should be considered in the congestion management process. The following are the components that will be referred to henceforth as elements:
Element 1 - Operations Objectives Element 2 - Area of Application Element 3 - System Definition Element 4 - Performance Measures Element 5 - Performance Monitoring Plan Element 6 - Identification & Evaluation of Strategies Element 7 - Monitoring Strategy Effectiveness Element 8 - Implementation & Management
3.1 ELEMENT 1 - OPERATIONS OBJECTIVES Specific, measurable, agreed, realistic, time-bound goals coordinated with the Transportation Plan. The following are goals selected from the 2035 Winston-Salem Urban Area Long Range Transportation Plan (LRTP), where five out of eleven have objectives that have a more direct correlation to mitigating congestion. Design streets and highways that are safe, efficient and effectively move vehicular
traffic, accommodate transit, pedestrians and bicyclists with minimum negative environmental impacts.
Promote land use patterns and transit oriented design standards that support walking, bicycling and public transit and reduce the number and length of automobile trips.
Expand public transportation into an area-wide transit system of buses, van pools, car pools and special population transit services that is efficient, convenient, safe and cost-effective.
Create a bikeway/sidewalk/greenway network that is an integral part of transportation system and provides an alternative means of transportation and recreation.
Establish policies and programs to reduce travel demand. From these five LRTP Objectives, the following goals have been developed for the CMP with a focus on the first three.
1. Effectively move vehicular traffic. 2. Expand public transportation. 3. Reduce travel demand 4. Reduce the length of automobile trips. 5. Design safe efficient streets and highways. 6. Accommodate transit, pedestrian and bicyclists. 7. Promote land use patterns and transit oriented design standards. 8. Create a bikeway/sidewalk/greenway network that is an integral part of transportation
system. A variety of effective strategies, related to the aforementioned goals are listed in 3.6 Element #6. Identification and Evaluation of Strategies. These strategies have been implemented and a majority of them are continually performed as a part of standard operations for the Winston-Salem Urban Area. While there are many strategies in place to assist with mitigating congestion, the following goals have been selected as a focus at this time
2035 Winston-Salem Urban Area LRTP Congestion Management Processes 11
Goal - Effectively move vehicular traffic
Objective 1 – By June 2009, decrease communication failure rates by changing out the traffic signal system software.
Objective 2 – By 2015 fully upgrade the City of Winston-Salem signal system. Goal - Expand public transportation
Objective 1 – Within 5-7 years expand PART transit service to Davie County, Rockingham County, Danville, Mebane, and Virginia. Objective 2 – Within 5-7 years expand WSTA service to northwest Winston-Salem and add another circulation bus service.
Goal - Reduce travel demand
Objective 1 – Over the next 2 to 10 years implement the recommendations from the Piedmont Triad Seamless Mobility Study to enhance connectivity among transit services. Objective 2 - By 2015 install approximately 24 miles of bicycle lanes and on-road bicycle facilities to increase the option for the alternative mode of transportation.
3.2 ELEMENT 2 - AREA OF APPLICATION This is the geographic area to which the CMP functions and analysis will be applied. It is the area where congestion levels will be monitored, CMP strategies evaluated and implemented.
The CMP Plan Task Force decided the entire urban area MPO’s Metropolitan Area Boundary (MAB) shall serve as the boundary for the CMP plan (see Figure 1. Winston-Salem Urban Area MPO Boundary). This includes Forsyth County and the areas added to the MPO in November 2002, northern Davidson County, the Towns of Midway and Wallburg, eastern Davie County, the Town of Bermuda Run, and southern Stokes County, and the City of King. It should be noted, a small portion of southeastern Forsyth County is excluded from the WSMAB. It is now in the High Point MPO MAB and is part of their MPO’s CMP Plan area. Consideration should also be given to examining traffic congestion conditions and problems on a regional basis as well. Construction work, accidents and other incidents along the Interstate highways, other freeways and expressways, and other major roads linking the entire Piedmont Triad in Greensboro and High Point may have impacts on congestion levels within our MPO boundary and vice versa. 3.3 ELEMENT 3 - TRANSPORTATION SYSTEM DEFINITION Within the defined area of application, the modes of transportation and the transportation network to be monitored by the CMP activities.
Modes The first step in defining the CMP system is to determine the transportation modes to consider in the analysis. To ensure the multi-modal nature of the CMP, the CMP Plan Task Force discussed all possible modes to incorporate into this analysis. The following modes were considered: automobile, regular-route bus, regional commuter bus, intercity bus, bicycle, pedestrian, rail transportation for freight, and taxi or other for-hire passenger transportation.

2035 Winston-Salem Urban Area LRTP Congestion Management Processes 12
The CMP Plan Task Force concluded that the only mode of transportation needing examination for this initial CMP Plan was the automobile. There does not appear to be congestion problems with WSTA’s regular-route bus, PART’s regional commuter bus, intercity bus, bicyclists and pedestrians, rail transportation for freight, taxi or other for-hire transportation modes in the urban area. Additionally, in the future, further analysis will be conducted by the CMP Plan Task Force to examine the correlation between freight movement and congestion in the urban area. Network Once the transportation modes were determined, the transportation network was defined. To keep the initial CMP system relatively simple, the CMP Plan Task Force agreed that the task force concentrate mainly on streets and highways defined as “Principal Arterials” or higher by the urban area’s Federal Functional Classification system maps provided by NCDOT (see Figure 2. Winston-Salem Urban Area Federal Functional Classifications). Primarily the analysis will include all of the “Interstate Highways”, “Freeways/Expressways” and “Other Principal Arterials” in the urban are but does not include the streets and highways defined as “Minor Arterials” or “Collectors.” In the future, the CMP Plan Task Force will determine whether “Minor Arterials” and “Collectors” should be analyzed. TABLE 1: PRIMARY ANALYSIS NETWORK
In the future, once the proposed Northern Beltway is completed, it will be added as an Interstate and Freeway/Expressway. For the Northern Beltway’s Eastern Section, from US 52 east to US 311, it will be designated as Interstate 74, while the Western Section, from South Stratford Road (US 158) to US 52 will be designated as a Freeway/Expressway facility. Selected signalized intersections, major driveways and other major traffic generators (Wake Forest University, LJVM Coliseum, Hanes Mall, shopping areas and large businesses and industries, etc.) along these streets and highways will also be included. Also, if “Minor Arterials’ and “Collectors” are included in the network in the future, roads such as South Stratford Road (US 158) and Hanes Mall Boulevard in Winston-Salem, Main Street and NC 66 in Kernersville, Main Street in King, Thomasville Road (NC 109) in Davidson County, Lewisville-Clemmons Road in Clemmons, and Union Cross Road in southeastern Forsyth County will be studied.
Name Facility Type Description Miles
Interstate 40 Interstate Redland Road in Davie County - Guilford County Line 27
US 52 Freeway/Expressway Little Yadkin River - NC 8/ Old US Highway 36
US 311 Freeway/Expressway Guilford County Line to Interstate 40 9
Bus I-40 (US 421) Freeway/Expressway Interstate 40 to Guilford County Line 17
US 421 Freeway/Expressway Yadkin River Bridge to Interstate 40 10
Silas Creek Parkway Freeway/Expressway Bethabara Road to Business Interstate 40 (US 421) 5
North Point Boulevard Freeway/Expressway University Parkway to Bethabara Road 0.5
Reidsville Road (US 158) Other Principal Arterial Business Interstate 40 (US 421) to the Guilford County Line 13
University Parkway Other Principal Arterial Northwest Boulevard to US 52 6
Cherry Street Other Principal Arterial Northwest Boulevard to Business Interstate 40 (US 421) 1
Marshall Street Other Principal Arterial Northwest Boulevard to Business Interstate 40 (US 421) 1

2035 Winston-Salem Urban Area LRTP Congestion Management Processes 13
3.4 ELEMENT 4 - PERFORMANCE MEASURES The measures provide the basis for evaluating the transportation system operating conditions and identifying the location and severity of congestion. The performance measures provide the mechanism for quantifying the level of congestion on the system. The CMP Plan Task Force reviewed a number of possible performance measures based on data availability including volume-to-capacity ratios (V/C ratios), travel time and speed, traffic delays, signalized and un-signalized intersection capacity analyses and level of service (LOS). The Task Force decided that V/C ratios and intersection LOS would be the primary performance measures. Experience gained in collecting and reporting the data will allow for future improvements, additions, or revisions of the performance measures. The first identified performance measure, the V/C ratio, looks at what percentage of the roadway’s capacity is being utilized by traffic; the higher the ratio, the closer the roadway’s capacity is to being filled. For purposes of this plan, the CMP Plan Task force utilized a generally accepted measure of assigning letter grades (A-F) to ranges of the V/C ratio. This measure can alert transportation providers to areas where traffic mitigation measures should be considered. Following this system, the CMP Plan Task Force assumed that roadway congestion exists on segments with a LOS “E” (a V/C ratio between 0.93 and 1.0) and LOS “F” (V/C ratios higher than 1.0). Although not intuitively reasonable, V/C ratios greater than 1.0, where volumes exceed the theoretical capacity of the roadway, do in fact exist and represent severe congestion. The capacities used for v/c ratio analysis in this plan have been calculated using tables provided by the Florida Department of Transportation in accordance with local experience and professional judgment. The second performance measure, intersection LOS, looks at the overall performance (in terms of delay experienced by the user) of a given intersection. As in the roadway V/C ratio performance measure described above, the CMP Plan Task Force applied the same general accepted letter system to the intersection LOS measure and assumed that LOS “E” and “F” could be assumed to be congested intersections. TABLE 2: VOLUME TO CAPACITY LOS
LOS V/C
A 0.00 - 0.23
B 0.24 - 0.46
C 0.47 - 0.69
D 0.70 - 0.93
E 0.93 to 1.0
F Greater than 1.0
TABLE 3: INTERSECTION LOS
LOS
A
B
C
D
E
F

US
52
Sh
ore
R
o ad
Ha
mp
ton
Road
Pin
eyG
rove
Ro
ad
Dor
alD
riv
e
Broa
dS
tree
t
NC
66
Gumtre
e Road
US 421
Enterprise Road
Interstate 40
Co rnatz
er Roa d
NC 65
Vance
RoadKerners
ville Road
Polo
Road
US311
NC 150
Stye rs Ferry Road
Tra
ns
ou
Roa
dM
ead
ow
lar k
Driv
e
NC
80
1
Re
dB
an
kR
oad
Fish
el Road
Eb
ert
Ro
ad
Teague Roa
d
US 421
Rei
dsville
Road US158
Co
op
erRoad
Pin
eHal
l
Ro
ad
NC
66
De
nn
isRoad
High
Point
Road
Dull Road
Ha
r pe
rRo
ad
NC 65
NC
66
King
Street
NC
8
NC
66
NC65
YadkinvilleRoad
US52
OldSale m Ro ad
US 311
Old Hollow Road
Le
wis
ville
-Cle
mm
on
sR
oa
d
Bus. I-40 US421
E. Fifth Street
Bus. I-40Bus 40/US 421
FryeBridg
eR
o
ad
HickoryTree
Ro
ad
N.
M
ain St ree
t
Indiana
Av
enue
R obinhood Road
Mountain View Road
Pe
t er s
Cre
ek
Pa
r kw
ay
0 2 4 6 81 Miles
Legend
Federal Functional ClassInterstate
Freeway/Expressway
Other Principal Arterial (Urban)
Principal Arterial (Rural)
Minor Arterial (Urban)
Minor Arterial (Rural)
Collector (Urban)
Major Collector (Rural)
Minor Collector (Rural)
Local / Unclassified Streets
Metropolitan Area Boundary
Figure 2:Winston-Salem
Urban AreaFederal Functional
Classifications
As depicted on FederalFunctional Classificationmaps provided by theNorth Carolina Departmentof Transportation.
Winston-Salem Urban AreaCongestion Management Processes
2035 Winston-Salem Urban Area LRTP Congestion Management Processes 15
3.5 ELEMENT 5 - PERFORMANCE MONITORING The performance monitoring plan is the mechanism for collecting the data needed to quantify the performance measures and track congestion over time. It may include: the data to be collected, frequency of data collection, data collection locations, data collection responsibilities, data analysis techniques, database management requirements, and performance analysis reporting. Data to Be Collected: The data collected shall included Average Daily Traffic Volumes (ADTs) counts, intersection turning movement counts, and roadway and intersection capacity data. Travel time data will also be collected for analysis purposes. NCDOT will provide counts on state roads only by the Biennial Coverage Count Process.
This process is included in Appendix A.
Kernersville currently does 1/3 of their counts per year. They will commit to collecting counts biennially on Federal Functional Classification roads that are located in their jurisdiction and are not on the state system. They will add locations as needed.
Winston-Salem currently collects CBD counts biennially. They will also commit to collect counts biennially on Federal Functional Classification roads that are located in their jurisdiction and are not on the state system. They will collect turning movement counts in even years for signalized intersections.
Frequency of Data Collection: The CMP Plan Task Force plans to collect most of the data on the years between the regular State Transportation Improvement Program (STIP) biennial cycles. Data Collection Locations: Data will be collected on all Federal Functionally Classified roads in the WS Urbanized Area as defined by NCDOT in coordination with FHWA. However, further analysis will be conducted on the streets and highways and major intersections with V/C ratios in excess of 0.93 or LOS of “E” or greater. Data Collection Responsibilities and Database Management Requirements: The data can be provided by NCDOT, the City of Winston-Salem (WSDOT), Kernersville Planning Department or other agencies that may become involved in the congestion management process for the Winston-Salem Urban Area. The WSDOT will be responsible for the collection and maintenance of the data. Data Analysis Techniques: The most recent version of the Highway Capacity Manual (HCM) and available intersection capacity analysis software will be utilized in coordination with GIS visualization techniques for dissemination of the analysis results. Performance Analysis Reporting: On a biennial basis, the CMP Plan Task Force will prepare a summary report that will tabulate and summarize the data collected. This reporting schedule should be coordinated with the development of candidate projects for the Transportation Needs report and/or Transportation Improvement Program (TIP).

2035 Winston-Salem Urban Area LRTP Congestion Management Processes 16
3.6 ELEMENT 6 - IDENTIFICATION AND EVALUATION OF STRATEGIES This element of the CMP can function at either the system-wide or corridor/sub-area level of analysis and provide guidance in selecting the strategies, actions and policies required to manage congestion.
There are three classes of congestion management strategies: Demand Management, Operational Management and Capital Intensive Improvement.
TABLE 4: CONGESTION MANAGEMENT STRATEGY CLASSES
Demand Management Operational Management Capital Intensive Improvements
Transit Operational Improvements Traffic Operational Improvements Lane Additions
Transportation Demand Management Access Management Road Extensions
*HOV strategies Incident Management Transit capital improvements
Non-motorized/non-traditional modes *Intelligent Vehicle Highway (IVHS)
*Congestion Pricing
Growth Management
* Under study or not currently practiced in the Winston-Salem Urban Area
As stated in the Introduction, NCDOT and the City have already implemented several major strategies to deal with congestion. Listed below are a number of effective strategies that have been implemented in the WS Urban Area.
Building New Capacity New Streets and Highways Street and Highway Widening High Occupancy Vehicle Lanes Public Transportation WSTA Regular Route Services PART Regional Express Bus Service Ridesharing and Vanpooling Rail/Bus Rapid Transit Park and Ride Lots Traffic Operational Improvements Safety Improvement Program Traffic Signal Coordination Signal/Intersection Improvements Special Event Traffic Management Construction Traffic Management
Intelligent Transportation Systems WSTA’s Mobility Manager Variable Message Signage Incident Management Traffic Surveillance Camera System Other Modes of Transportation Bike Lanes, Trails & Greenways Sidewalks/Pedestrian Facilities Freight Access Management & Land Development Driveway Permitting/Plan Review Street Connectivity Street and Parking Standards Mixed Use Developments Site Plan Review Subdivision Requirements

2035 Winston-Salem Urban Area LRTP Congestion Management Processes 17
3.7 ELEMENT 7 - MONITORING OF STRATEGY EFFECTIVENES This element of the CMP will gather data, evaluate and report on the effectiveness of the congestion management strategies that have been implemented. In an effort to identify and evaluate the strategies implemented by the WS Urban Area Table 5: Monitoring Toolkit has been developed. The table is organized in eight strategy categories: Highway Improvements Transit Operation Improvements Bicycle and Pedestrian Freight Management
Traffic Operational Improvement Intelligent Transportation Systems Access Management Land Development
With each category the toolkit identifies the strategy, provides a description of the strategy, lists the congestion impacts, implementation costs, implementation timeframe, measures of effectiveness, and proposed or existing implementation. The toolkit also contains a strategy code that is used for the development of a Strategy Monitoring Table which will be discussed more in the 3.8 Element 8 - Implementation and Management section of the CMP. The Strategy Monitoring Table will be developed for the biennial report. These codes link the potential strategies with a deficient location.
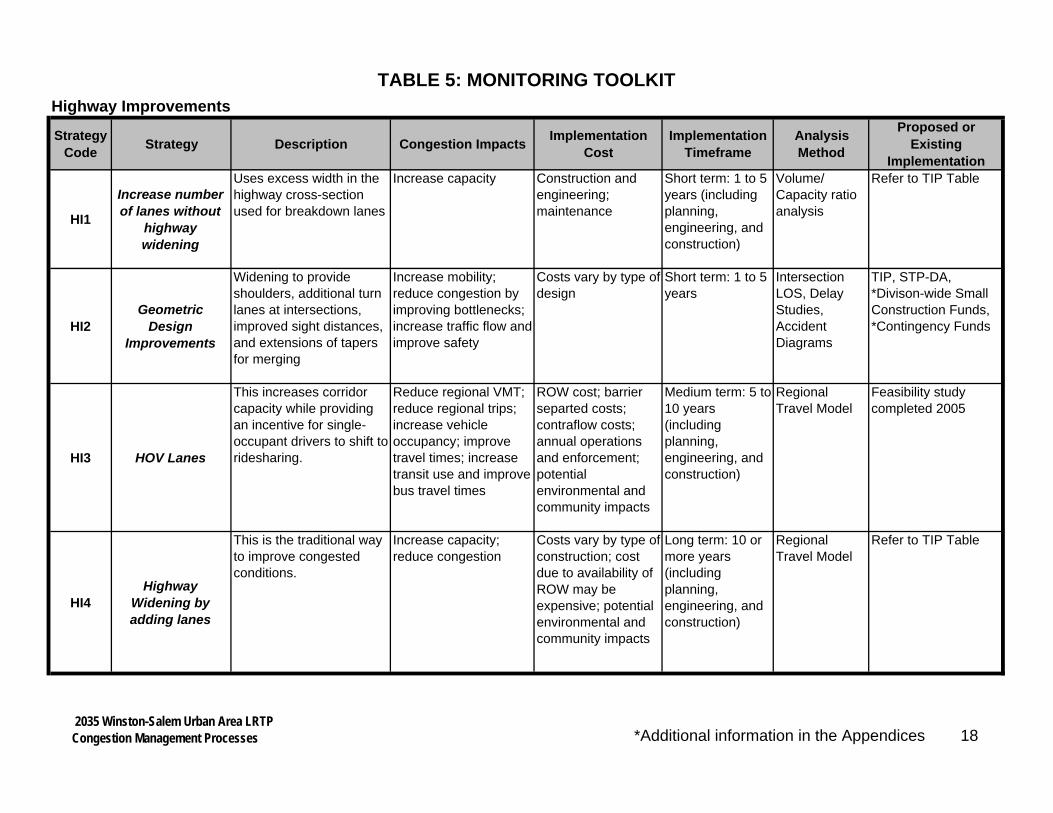
TABLE 5: MONITORING TOOLKIT
Strategy Code
Strategy Description Congestion ImpactsImplementation
CostImplementation
TimeframeAnalysis Method
Proposed or Existing
Implementation
HI1
Increase number of lanes without
highway widening
Uses excess width in the highway cross-section used for breakdown lanes
Increase capacity Construction and engineering; maintenance
Short term: 1 to 5 years (including planning, engineering, and construction)
Volume/ Capacity ratio analysis
Refer to TIP Table
HI2Geometric
Design Improvements
Widening to provide shoulders, additional turn lanes at intersections, improved sight distances, and extensions of tapers for merging
Increase mobility; reduce congestion by improving bottlenecks; increase traffic flow and improve safety
Costs vary by type of design
Short term: 1 to 5 years
Intersection LOS, Delay Studies, Accident Diagrams
TIP, STP-DA, *Divison-wide Small Construction Funds, *Contingency Funds
HI3 HOV Lanes
This increases corridor capacity while providing an incentive for single-occupant drivers to shift to ridesharing.
Reduce regional VMT; reduce regional trips; increase vehicle occupancy; improve travel times; increase transit use and improve bus travel times
ROW cost; barrier separted costs; contraflow costs; annual operations and enforcement; potential environmental and community impacts
Medium term: 5 to 10 years (including planning, engineering, and construction)
Regional Travel Model
Feasibility study completed 2005
HI4Highway
Widening by adding lanes
This is the traditional way to improve congested conditions.
Increase capacity; reduce congestion
Costs vary by type of construction; cost due to availability of ROW may be expensive; potential environmental and community impacts
Long term: 10 or more years (including planning, engineering, and construction)
Regional Travel Model
Refer to TIP Table
Highway Improvements
2035 Winston-Salem Urban Area LRTPCongestion Management Processes *Additional information in the Appendices 18

TABLE 5: MONITORING TOOLKIT
Strategy Code
Strategy Description Congestion ImpactsImplementation
CostImplementation
TimeframeAnalysis Method
Proposed or Existing
Implementation
TI1Increase Bus
Route Coverage or Frequencies
Provides better accessibility to transit to a greater share of the population and makes it more attractive to use.
Increase transit ridership; decrease travel time; reduce daily VMT
Capital cost per passenger trip; operating cost per trip; new bus purchases
Short term: 1 to 5 years (including planning, engineering, and construction)
On Board surveys
Routes are evaluated annually
TI2 PART Express
Direct regional transit and shuttle service between the Triad Cities and the Airport.
Reduce regional VMT; reduce congestion
Capital cost per passenger trip; operating cost per trip; new bus purchases
Medium term: 5 to 10 years
Regional Travel Model Evaluation
Triad area system in operation in 2002
TI3 Vanpool
Commuters who live at least 10 miles from their workplace and agree to share their daily commute to and from work
Reduce congestion; reduce daily VMT,
Savings per carpool and vanpool riders; costs per year per free parking space provided; administrative costs
Short term: 1 to 5 years
Regional Travel Model Evaluation
Ride Sharing and Vanpooling of the Piedmont RSVP in operation for more than 15 years
TI4Implementing Rail/Bus Rapid
Transit
Establish passenger rail services or expand bus services with reduced travel times
Reduce daily VMT Capitla cost per passenger; new systems require large up-front capital and ongoing sources of operating subsidies
Long term: 10 or more years (including planning, engineering, and construction)
Regional Travel Model Evaluation
MIS study completed; Alternatives analysis to be completed in 2008
TI5Park and Ride
Lots
Establish parking lots for vanpool and PART Express users
Reduce regional VMT; increase mobility and transit efficiency
Structure Cost for transit stations
Medium term: 5 to 10 years(including planning, engineering, and construction)
Regional Travel Model Evaluation
PART was awarded $3.5 million in federal funds for the develoment of regional park and ride lots. Currently identifying locations
Transit Operation Improvements
2035 Winston-Salem Urban Area LRTPCongestion Management Processes *Additional information in the Appendices 19

TABLE 5: MONITORING TOOLKIT
Strategy Code
Strategy Description Congestion ImpactsImplementation
CostImplementation
TimeframeAnalysis Method
Proposed or Existing
Implementation
BP1Designate
Bicycle Lanes on Local Roads
Enhance the visibility of bicycle facilities by adding a painted striped line
Increase mobility and access; increase non-motorized mode shares; separate slow moving bicycles from motorized vehicles; reduce incidents
Design and construction cost for paving; striping, and signing; ROW costs if widening is necessary; potential improvements to roadway shoulders
Short term: 1 to 5 years (including planning, engineering, and construction)
Customer Satisfaction Survey
Bicycle Master Plan recommendations; STP-DA Funds
BP2
Designate Greenways and Sidepaths on
Exclusive Non-Motorized Rights-
of-way
Conversion of abandoned rail rights of way, exisiting parkland or designated parallel highway rights of way
Increase mobility; increase non-motorized mode shares; reduce congestion; separate slow moving bicycles from motorized vehicles; reduce incidents
ROW costs, Construction and engineering costs, Maintenance costs
Medium term: 5 to 10 years(including planning, engineering, and construction)
Customer Satisfaction Survey
Bicycle Master Plan and Greenway Plan recommendations; STP-DA funds; TIP projects
BP3 New Sidewalks
Enhancing the visibility of pedestrian facilities increases the perception of safety.
Increase mobility and access; increase non-motorized mode shares; reduce incidents
Design and construction cost; ROW costs for potential widening
Short term: 1 to 5 years (including planning, engineering, and construction)
Customer Satisfaction Survey
Pedestrian Plan recommendations; STP-DA funded projects; TIP projects
BP4
Improved Bicycle Facilities at
Transit Stations and Other Trip Destinations
Installation of bicycle racks and bike lockers at transit locations and other trip destinations to increase security.
Increase mode share; reduce motorized vehicle congestion on access routes
Capital and maintenance costs for bicycle racks, lockers and locker rooms
Short term: 1 to 5 years (including planning, engineering, and construction)
Customer Satisfaction Survey
Bicycle Master Plan recommendations; STP-DA Funds
Bicycle and Pedestrian Strategies
2035 Winston-Salem Urban Area LRTPCongestion Management Processes *Additional information in the Appendices 20
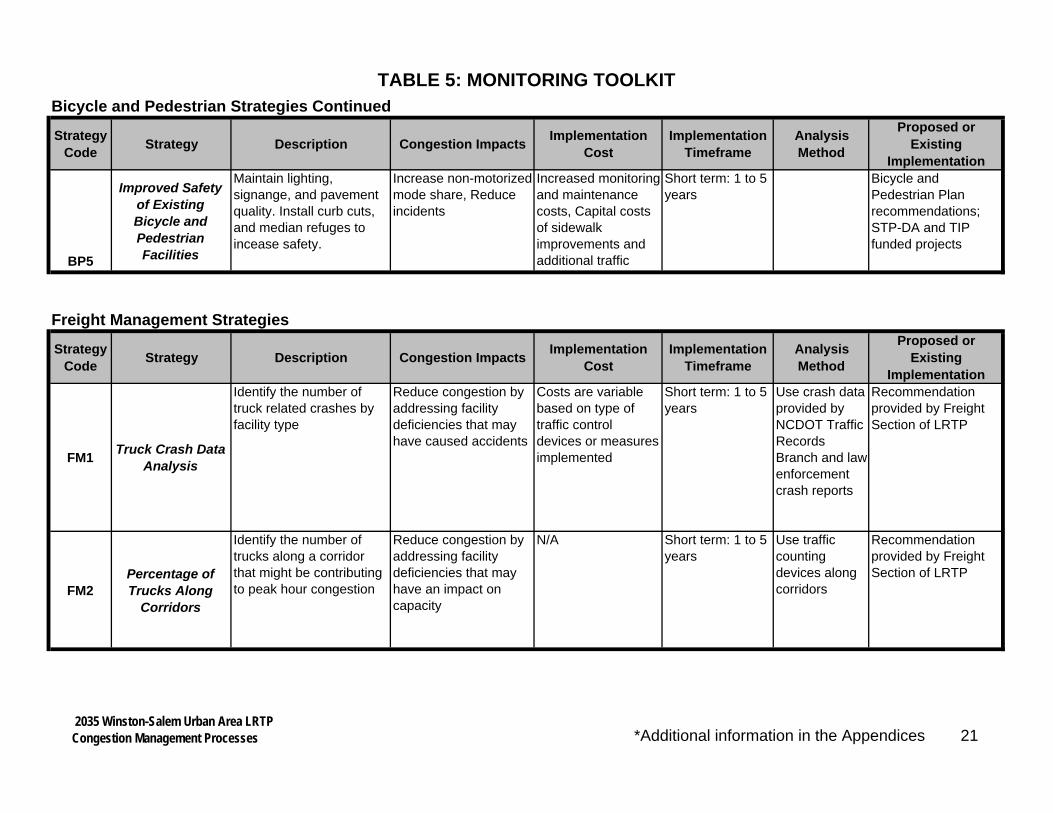
TABLE 5: MONITORING TOOLKIT
Strategy Code
Strategy Description Congestion ImpactsImplementation
CostImplementation
TimeframeAnalysis Method
Proposed or Existing
Implementation
BP5
Improved Safety of Existing Bicycle and Pedestrian Facilities
Maintain lighting, signange, and pavement quality. Install curb cuts, and median refuges to incease safety.
Increase non-motorized mode share, Reduce incidents
Increased monitoring and maintenance costs, Capital costs of sidewalk improvements and additional traffic
Short term: 1 to 5 years
Bicycle and Pedestrian Plan recommendations; STP-DA and TIP funded projects
Strategy Code
Strategy Description Congestion ImpactsImplementation
CostImplementation
TimeframeAnalysis Method
Proposed or Existing
Implementation
FM1Truck Crash Data
Analysis
Identify the number of truck related crashes by facility type
Reduce congestion by addressing facility deficiencies that may have caused accidents
Costs are variable based on type of traffic control devices or measures implemented
Short term: 1 to 5 years
Use crash data provided by NCDOT Traffic Records Branch and law enforcement crash reports
Recommendation provided by Freight Section of LRTP
FM2Percentage of Trucks Along
Corridors
Identify the number of trucks along a corridor that might be contributing to peak hour congestion
Reduce congestion by addressing facility deficiencies that may have an impact on capacity
N/A Short term: 1 to 5 years
Use traffic counting devices along corridors
Recommendation provided by Freight Section of LRTP
Freight Management Strategies
Bicycle and Pedestrian Strategies Continued
2035 Winston-Salem Urban Area LRTPCongestion Management Processes *Additional information in the Appendices 21

TABLE 5: MONITORING TOOLKIT
Strategy Code
Strategy Description Congestion ImpactsImplementation
CostImplementation
TimeframeAnalysis Method
Proposed or Existing
Implementation
TO1Safety
Improvement Program
Annual review of locations with a a large pattern of accidents. Implement monitored traffic measures for effectiveness
Reduces incidents Costs are variable based on type of traffic control devices or improvements
Short term: 1 to 5 years
Review for reduction on number of accidents
Recommendations provided in the City of WS DOT Annual Safety Improvement Report, *Spot Safety
TO2Traffic Signal Coordination
Computerized traffic controls coordinate the timing and operation of signals.
Improves travel time; reduces the number of stops; reduce VMT by vehicle miles per day depending on program
Operation and maintenance cost per signal
Short term: 1 to 5 years
Travel time studies, Delay Studies
Schedule D reviews; Signal System Upgrade
TO3
Traffic Signal Improvements
and Intersection Improvements
Update signal timing patterns, change pavement marks and or signage.
Improves travel time; reduces incidents
Costs are variable based on type of traffic control devices or improvements
Short term: 1 to 5 years
Delay Studies, Intersection LOS
*Spot Safety, STP-DA, CIP,
TO4Special Event
Traffic Management
Temporary installation of traffic control devices and special signal timing plans.
Improves travel time; reduces incidents and delay; some peak-period travel shift
Operation costs; cost for traffic control devises used
Immediate Annual survey of major events
Implemented as needed for local entertaining and sporting events
TO5Construction
Traffic Mangement
Work Zone Traffic Control plans implemented for major construction plans
Improves travel time; reduces incidents and delay; some peak-period travel shift
Costs are variable based on type of traffic control devices or measures implemented
Short term: 1 to 5 years
Customer Survey
NCDOT Work Zone Safety & Mobility Policy; Local design implementation as needed
Traffic Operational Improvement Strategies
2035 Winston-Salem Urban Area LRTPCongestion Management Processes *Additional information in the Appendices 22

TABLE 5: MONITORING TOOLKIT
Strategy Code
Strategy Description Congestion ImpactsImplementation
CostImplementation
TimeframeAnalysis Method
Proposed or Existing
Implementation
IT1 Mobility Manager
Installation of Computer Aided Dispatching and Scheduling (CADS), Mobile Data Terminals (MDT) and Automatic Vehicle Locators (AVL) on WSTA's para-transit and fixed route vehicles to provide real-time information.
Reduce travel times and delay; some peak-period travel and mode shift
Design and implementation costs; operating and maintenance costs variable
Medium term: 5 to 10 years
ITS Deployment Analysis System
Phase I completed in 1995; phase II completed in 2002
IT2Variable Message
Signage
System that provides travelers with real-time information that can be used to make trip and route choice decisions
Reduces accident delay; reduces travel time; some peak period travel shift
Capital costs variable; annual operating and maintenance costs
Medium to long term: 10 years or more
ITS Deployment Analysis System
Refer to Triad Regional ITS Deployment Plan: *511 phone service
IT3Incident
Management
System include video monitoring, dispatch systems, and roving service patrol vehicles
Reduces accident delay
Capital costs variable; annual operating and maintenance costs
Medium to long term: 10 years or more
Average clearance times
*IMAP; cameras, dispatch system
IT4
Traffic Surveillance
Camera System Monitoring
System include video monitoring, dispatch systems.
Reduces accident delay; improves signal system trouble shooting turnaround time
Capital costs variable; annual operating and maintenance costs
Medium to long term: 10 years or more
ITS Deployment Analysis System
*Numerous existing camera and message sign locations within the WSUA; refer to Triad Regional ITS Deployment Plan
Intelligent Transportation Systems (ITS) Strategies
2035 Winston-Salem Urban Area LRTPCongestion Management Processes *Additional information in the Appendices 23

TABLE 5: MONITORING TOOLKIT
Strategy Code
Strategy Description Congestion ImpactsImplementation
CostImplementation
TimeframeAnalysis Method
Proposed or Existing
Implementation
AM1Collector Street
Plan
Inventory existing and identify proposed locations for collector streets.
Reduces congestion; improves connectivity; disperses traffic
Potentially constructed as land is developed, with proposed connections, or extensions of exisiting roads
Short term: 1 to 5 years
Site Plan Review
Collector Street Plan recommendations
AM2
Left Turn Restrictions, Curb Cut and
Driveway Permit Process
Provide restrictions where feasible on left turns, curb cuts and driveways to minimize conflicts.
Increased capacity and efficiency; improved mobility; improved travel times and reduced delay for through traffic; reduced incidents
Implementation and maintenenace costs vary; developer responsible for new construction costs
Short term: 1 to 5 years
Site Plan Review; plan review
Driveway Permit Process coordinated between City of WS, Kernersville, and NCDOT; UDO Provisions
AM3Reduced Parking
Standards
Encourage a reduction in parking when combined driveways, bicycle, pedestrian, and or transit facilities are provided.
Increase transit and non-motorized mode share
Public cost only in changing and monitoring ordinances; reduces private development costs
Short term: 1 to 5 years
Site Plan Review; plan review
UDO Provisions
AM4Street
Connectivity
Limit the length and number of cul-de-sacs in new developments; provision for stub streets with new development; design of new subdivision streets using a connectivity ratio
Improves connectiviity; disperses traffic; reduces congestion
Implementation and maintenenace costs vary; developer responsible for new construction costs
Short term: 1 to 5 years
Site Plan Review; Subdivision Review
UDO Provisions
Access Management Strategies
2035 Winston-Salem Urban Area LRTPCongestion Management Processes *Additional information in the Appendices 24

TABLE 5: MONITORING TOOLKIT
Strategy Code
Strategy Description Congestion ImpactsImplementation
CostImplementation
TimeframeAnalysis Method
Proposed or Existing
Implementation
LD1
Mixed Use and Pedestrian-
Oriented Development
Allows for many trips to be made without automobiles. People can walk to restaurants and services rather than use their vehicles.
Increase walk trips; decrease VMT; decrease vehicle hours of travel
Public costs to set up and monitor ordinances; some public participation in infrastructure costs
Current to long term: 10 or more years
Site Plan Review; Regional Travel Model
Legacy Plan Objectives; UDO Provisions
LD2Infill and
Densification
Encourage the development of more compact urban areas with high density housing and retail utilizing existing infrastructure.
Increase mode share trips; reduce vehicle trips; decrease VMT per household
Public costs to set up and monitor ordinances; some public participation in infrastructure costs
Current to long term: 10 or more years
Site Plan Review; plan review; Regional Travel Model
Legacy Plan Objectives; *UDO Provisions
LD3Subdivision
Requirements
Provide for coordination of streets between proposed subdivisions with existing or planned streets.
Improves efficient circulation patterns; reduces congestion
Public costs to set up and monitor ordinances; some public participation in infrastructure costs
Current to long term: 10 or more years
Site Plan Review; Subdivision Review; Regional Travel Model
UDO Provisions; Subdivision Regulations
LD4Street Design for Efficient Traffic
Flow
Establishes street design standards to assure that new roads are coordinated with the existing and planned street system.
Improves vehicle and pedestrian circulation
Public costs to set up and monitor ordinances; some public participation in infrastructure costs
Current to long term: 10 or more years
Site Plan Review; Subdivision Review; Regional Travel Model
UDO Provisions
LD5Transit Oriented
Development
Encourage the development of higher density housing and businesses near a transit station in walkable communities.
Increase transit mode share; decrease vehicle trips; decrease VMT
Public costs to set up and monitor ordinances; some public participation in infrastructure costs
Current to long term: 10 or more years
Site Plan Review; Regional Travel Model; rezoning process
Legacy Plan Objectives
Land Development Strategies
2035 Winston-Salem Urban Area LRTPCongestion Management Processes *Additional information in the Appendices 25

2035 Winston-Salem Urban Area LRTP Congestion Management Processes 26
3.8 ELEMENT 8 - IMPLEMENTATION AND MANAGEMENT The entire CMP requires an implementation plan to coordinate CMP activities, ensure the timely development and delivery of CMP products, and maintain a high level of quality control. The following are a list of activities to be implemented as part of the biennial reporting process for identifying, evaluating, and monitoring congested corridors, intersections and key traffic generators in the WSUA. Identify deficient locations using the performance measures identified in section 3.3. The
locations to be analyzed should be
o Other Principal Arterials and higher classified by the FFC road network o Minor Arterials and Collectors classified by the FFC road network o Thoroughfare Plan/Comprehensive Transportation Plan network o Selected major intersections o Major traffic generators (MACs, shopping centers, etc.)
Identify existing and/or proposed projects that may mitigate congestion in the deficient
locations. Include effectiveness measures, data collection needs, and time frame for analysis or project completion date. o Bond o CIP o CMAQ o Contingency Funds o Division Small Construction Funds
o Enhancement o Spot Safety o STP-DA o TIP
If there are no existing or proposed projects planned that may mitigate congestion, identify
potential strategies from the Congestion Management Processes Monitoring Toolkit for each deficient location. Coordinate the potential strategies with the project identification processes such as the Needs process, call for Enhancement, STP-DA, CMAQ, and the TIP process for project prioritization and funding. It should be noted that there may be some deficient locations that are not treatable for congestion management.
Biennially, a report will be developed to include the following:
o List of deficient locations with mileage, V/C ratio, and FFC o Map of the deficient locations o Strategy Monitoring table listing the deficient location and strategies for each location o Measures of Effectiveness table with before and after Capacity, Mobility, and or
Energy/Environment comparisons and a benefit identification o Accomplishments that identify improvements implemented since the previous reporting
period that may not be attributed to a specific deficient location o Findings and recommendations

2035 Winston-Salem Urban Area LRTP Congestion Management Processes 27
4.0 FUTURE INITIATIVES WSDOT staff will begin coordination with the FCEAD on air quality analysis for deficient
locations to include in the biennial report as a measure of effectiveness. Starting April 2008 provide a biennial report. Update the data analysis sets with missing capacity information for Davie and Davidson
counties. Compare deficient V/C ratio locations with V/C information provided by the Piedmont
Regional Model. Obtain VHT and VMT information provided by the Piedmont Regional Model. Verify count locations for deficient locations to ensure that it is counted with the next
NCDOT count collection process. Develop a process for collecting corridor travel speed and travel time data as a measure of
effectiveness near deficient locations. Collect accident data and summaries for deficient locations to determine potential strategies
and improvements.
![Winston-Salem 1920 - 1929 [pdf/2072kb/27p] - City of Winston-Salem](https://static.fdocuments.in/doc/165x107/622b38ee24f6740905250f57/winston-salem-1920-1929-pdf2072kb27p-city-of-winston-salem.jpg)