Winning the Ergonomic Justification Battle: Recognizing ... · Recommendation: Engineering or...
6
Winning the Ergonomic Justification Battle: Recognizing and Measuring Labor and Cost Saving Potential: A Case Study Richard Wyatt Aon Risk Solutions 117 Ovella Ave. Huntsville, AL 35811USA [email protected] Author Note: Dr. Richard Wyatt is a Senior Consultant with Aon Risk Solutions in Huntsville, Alabama. Richard holds a Ph.D. in Industrial and Systems Engineering from the University of Alabama-Huntsville, and is a registered professional engineer. He is a certified professional ergonomist and a certified safety professional and has 30 years’ experience in Industrial Ergonomics. Abstract: The financial justification of ergonomics is lacking in the literature, and there is a need for more examples and case studies of successful projects that have resulted in excellent financial justification. This paper describes one case study from a food processing plant that resulted in positive ergonomic risk reduction as well as financial justification through return-on-investment financial techniques. The input variables and ergonomic risk reduction process, as well as the financial methods used to develop the financial payback, will be described. Keywords: ROI, Ergonomic Risk Reduction, Project Justification 1. Introduction Ergonomics has traditionally been associated with many different terms like “making the job easier”, or making a task easier for the person” or even “designing tasks to fit human capability”. This author tends to use the first definition more, although ergonomists could use any of the above definitions that would adequately define the word “ergonomics.” In Occupational Ergonomics, and more specifically examining the occupational definition of the word, the same “making the job easier” definition applies, although some safety managers struggle trying to budget capital and expenses dollars to justify the ergonomic improvement. The author of this paper has a keen interest in bridging the gap in the lack of documentation of successful ergonomic projects. In 2016, Wyatt suggested a combination of ergonomic risk modeling (e.g., NIOSH lift equation) and some financial modeling, (e.g., Internal Rate of Return, Payback Period, or Net Present Value) to describe potential financial payback from the project. The main purpose of this paper is to add another case study of a successful ergonomic improvement that has positive financial justification and ergonomic risk reduction. 2. Description of the Task In food processing plants, it can be common to use conveyors to move product from one area to another, and pallets may be useful to also move product within a facility. In Figure 1 below, a manual material handling task is illustrated. Boxes of product weighing 40 pounds are moved from a conveyor to a pallet. When moving the totes, employees carry the totes to the pallet, then stack them onto the pallet. The employee will bend to place the first row of totes on the pallet and then build up the stack as totes are added. Depending on need, the totes are stacked to different heights, and reaches up to shoulder level may result. Proceedings of the The XXXth Annual Occupational Ergonomics and Safety Conference Pittsburgh, Pennsylvania, USA June 7-8, 2018 ISBN: 97819384965-6-1 096
Transcript of Winning the Ergonomic Justification Battle: Recognizing ... · Recommendation: Engineering or...
Winning the Ergonomic Justification Battle: Recognizing and Measuring Labor and
Cost Saving Potential: A Case Study
Richard Wyatt
Aon Risk Solutions
117 Ovella Ave.
Huntsville, AL 35811USA
Author Note: Dr. Richard Wyatt is a Senior Consultant with Aon Risk Solutions in Huntsville, Alabama. Richard holds a
Ph.D. in Industrial and Systems Engineering from the University of Alabama-Huntsville, and is a registered professional
engineer. He is a certified professional ergonomist and a certified safety professional and has 30 years’ experience in
Industrial Ergonomics.
Abstract: The financial justification of ergonomics is lacking in the literature, and there is a need for more examples and
case studies of successful projects that have resulted in excellent financial justification. This paper describes one case study
from a food processing plant that resulted in positive ergonomic risk reduction as well as financial justification through
return-on-investment financial techniques. The input variables and ergonomic risk reduction process, as well as the financial
methods used to develop the financial payback, will be described.
Keywords: ROI, Ergonomic Risk Reduction, Project Justification
1. Introduction
Ergonomics has traditionally been associated with many different terms like “making the job easier”, or making a
task easier for the person” or even “designing tasks to fit human capability”. This author tends to use the first definition
more, although ergonomists could use any of the above definitions that would adequately define the word “ergonomics.” In
Occupational Ergonomics, and more specifically examining the occupational definition of the word, the same “making the
job easier” definition applies, although some safety managers struggle trying to budget capital and expenses dollars to justify
the ergonomic improvement.
The author of this paper has a keen interest in bridging the gap in the lack of documentation of successful ergonomic projects.
In 2016, Wyatt suggested a combination of ergonomic risk modeling (e.g., NIOSH lift equation) and some financial
modeling, (e.g., Internal Rate of Return, Payback Period, or Net Present Value) to describe potential financial payback from
the project. The main purpose of this paper is to add another case study of a successful ergonomic improvement that has
positive financial justification and ergonomic risk reduction.
2. Description of the Task
In food processing plants, it can be common to use conveyors to move product from one area to another, and pallets
may be useful to also move product within a facility. In Figure 1 below, a manual material handling task is illustrated.
Boxes of product weighing 40 pounds are moved from a conveyor to a pallet. When moving the totes, employees carry the
totes to the pallet, then stack them onto the pallet. The employee will bend to place the first row of totes on the pallet and
then build up the stack as totes are added. Depending on need, the totes are stacked to different heights, and reaches up to
shoulder level may result.
Proceedings of the The XXXth Annual Occupational Ergonomics and Safety Conference Pittsburgh, Pennsylvania, USA June 7-8, 2018
ISBN: 97819384965-6-1 096

Figure 1: Existing handling posture required when moving the bottom row of boxes
After the box is filled with product and moved to the pallet at the end of the Unload conveyor, the pallet is moved
with a powered industrial truck from the Unload conveyor across the aisle to the Load conveyor. A second employee moves
the box from the pallet to a Load conveyor (Load conveyor is illustrated on the right side of Figure 2). This second Load
conveyor moves the completed box to the Warehouse. Figure 2 below shows the flow of the boxed material from the first
Load conveyor to the second Load conveyor. Note: Each of the red ovals represents one employee assigned to that
workstation.
Figure 2: Present State Material Flow Diagram
The improvement opportunity in the process above will eliminate the double handling of the product. Product boxes
are prepared, palletized, moved across the aisle, and moved to another conveyor. An internal ergonomics team studied the
process and agreed that changes in the material flow could eliminate 50 percent of the manual material handling. The first
hurdle that the team faced was to eliminate the aisle that separated the Unload conveyor from the Load conveyor. Once a
plan was finalized to change the traffic flow, a capital plan and drawings were completed to add an additional conveyor to
link the Unload conveyro with the Load conveyors, in effect creating one seamless conveyor. Figure 3 illustrates the new
conveyor design. The use of pallets in this area is eliminated, while also eliminating two lifting steps.
Proceedings of the The XXXth Annual Occupational Ergonomics and Safety Conference Pittsburgh, Pennsylvania, USA June 7-8, 2018
ISBN: 97819384965-6-1 097

Figure 3: Future State Material Flow Diagram
The NIOSH Lift Equation was developed in 1981 and suggests a relative risk for material handling tasks. The lift
equation calculates the risk of strain on the back based on horizotal (ouward) reaching, vertical lift range, lift frequency,
coupling and twisting, resulting in a Recommended Weight Limit (RWL) for the job. The RWL is the recommended weight
that a normal person should be able to lift under the measured conditions without an elevated risk of back injury. In addition,
a Lifting Index (LI) is calculated based on these parameters and the resulting RWL. The LI is the actual product weight
divided by the RWL and is a useful index for the actual versus recommended force or weight. For this particular task, the
following data for the current material handling process, called Present State, was collected. Since the material handling
steps to and from the pallet is eliminated at both conveyors, the Future State Lifting Index is 0 (i.e., the lifting is eliminated).
NIOSH Variables Present State Future State
Weight 40 pounds n/a
Horizontal Reach 13-15 inches n/a
Starting Load Height 30 inches n/a
Travel Distance 25 inches n/a
Lifting Frequency 2 boxes/minute n/a
Twisting 0-30 degrees n/a
Coupling Good n/a
Recommended
Weight Limit (RWL)
14.5- 20.6 pounds n/a
Lifting Index (LI) 1.9 – 2.8 0
The team quickly realized that the ergonomic improvements of this project were positive. The team then estimated
the capital requirements needed to change the traffic pattern and obtain new conveyors. Capital costs are estimated at
$50,000 and the team assumes that one of the two employees assigned to the area could be relocated. Note that in the Present
State, one employee operates the scale and loads the box to the conveyor. The second employee moves the boxes to the Load
conveyor. Since the boxes are now moved directly from the scale to the warehouse, the second employee is not needed in the
Future State.
Proceedings of the The XXXth Annual Occupational Ergonomics and Safety Conference Pittsburgh, Pennsylvania, USA June 7-8, 2018
ISBN: 97819384965-6-1 098
Table 1: NIOSH Lift Equation Data

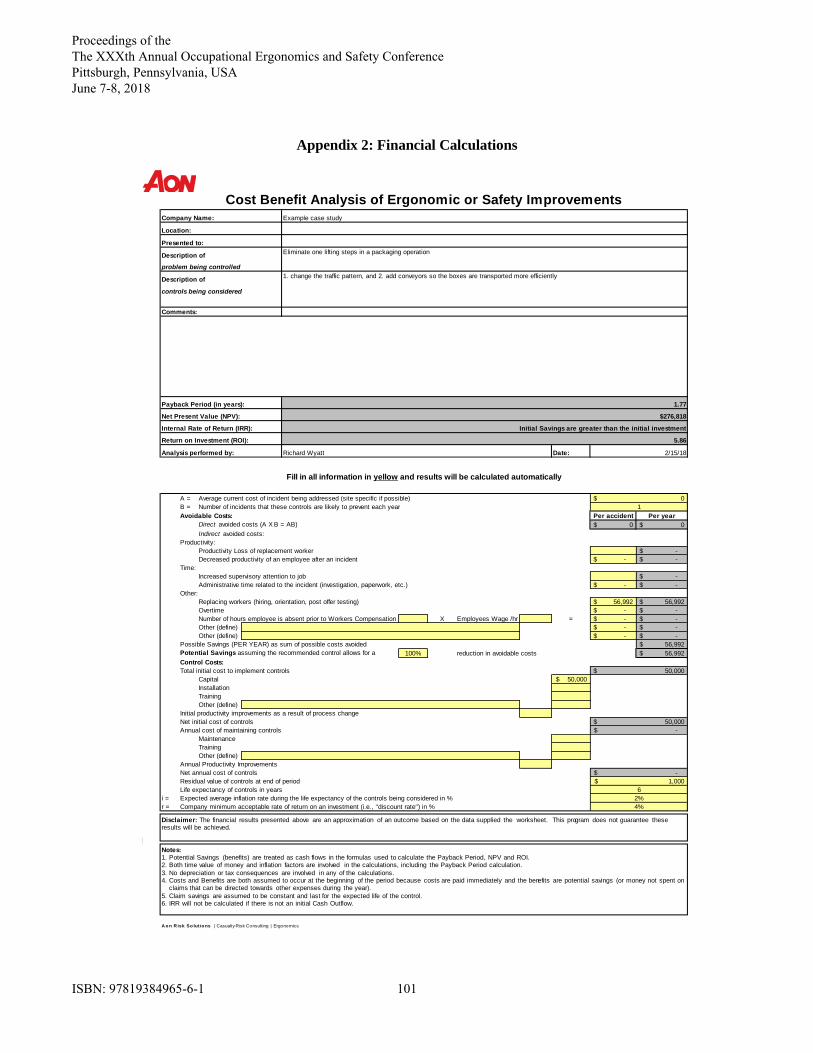
3. Financial Aspects of the Project
By applying the NPV method outlined in Stevens (1983), using the estimated capital budget, a Net Present Value
(NPV) of $276,818 resulted from spending an estimated $50,000 in capital and installation costs to change the process. The
Net-Present-Value of all cash flows, including the savings from having only person perform the material handling work, has
a net worth, or a present value today of $276,818. The idea here is that the annual cost savings of $56,992 will be realized
throughout the life of the project, not just in year one. So if a cost is taken out of the process, the cost is removed for the
entire life of the process. For our calculations here, we have assumed that the equipment will last six (6) years. Depending
on the type of project being examined in safety and ergonomics, this expected life of the project can vary.
It is highly recommended that advice from your accounting or finance team members is sought, as safety
professionals are not expected to have the same knowledge as Certified Professional Accountants. Learn from this successful
case study, and don’t be afraid to ask for help from your team members in Accounting that do know the details of these
financial methods. The Net Present Value method is only one financial model and some organizations use other metrics to
judge the relative merit of a potential project.
4. Conclusions
By eliminating a material-handling step, there is less risk of occupational injury, and the process is more efficient
because a non-value-added material handling step has been eliminated. This paper has provided yet another case study that
shows the value of ergonomics, both from an injury-reduction perspective as well as a cost reduction standpoint. There is a
need for these case-study examples so more Occupational Ergonomics projects may be justified.
References
Stevens, G.T., (1983) Engineering Economy, Reston Publishing Company, Reston, VA.
Wyatt, R. (2016), Ergonomic Risk Reduction and Labor Savings Involved with Manual Material Handling Reduction: A
Case Study, International Society of Occupational Ergonomics and Safety XXVIIIth Annual Occupational Ergonomics and
Safety Conference, Chicago, Illinois.
Proceedings of the The XXXth Annual Occupational Ergonomics and Safety Conference Pittsburgh, Pennsylvania, USA June 7-8, 2018
ISBN: 97819384965-6-1 099

Appendix 1: NIOSH Lift Equation Calculation
Significant Control at Destination?
Units:
Measurement Multiplier Measurement Multiplier
Horizontal Location: 13.0 in 0.77 15.0 in 0.67
Distance from the midpoint
between the ankles to the center
of the load
Vertical Location: 30.0 in 1.00 5.0 in 0.81
Distance from the floor to the mid-
point between the hands
Vertical Travel Distance: 25.0 in 0.89
Vertical distance between the
start and end points of the lift
Asymmetric Angle: 30.0 deg 0.90 30.0 deg 0.90
Angle between the asymetry line
and the mid-sagittal line
Duration: 8.0 hrs
Length of continuous work time
Frequency: 2.0 lifts/min 0.65
Number of lifts per min
Coupling: Good 1.00
Gripping method
Weight: 40.0 lbs
Observed weight of the load
RWL: 20.6 lbs 14.5 lbs
Recommended Weight Limit
Lifting Index: 1.9 2.8
2.8
A o n R isk So lut io ns | Casualty Risk Consulting | Ergonomics
NIOSH Lifting Equation
Origin Destination
Lift
Number:
Recommendation: Engineering or Ergonomic redesign should be
considered
Good = Optimal design containers with
handles of optimal design, or irregular
objects where the hand can be easily
wrapped around the object.
Fair = Optimal design containers with
handles of less than optimal design,
optimal design containers with no handles
or about 90°.
Poor = Less than optimal design container
with no handles or cut-outs, or irregular
objects that are hard to handle and/or
bulky (e.g. bags that sag in the middle).
Overall
Lifting Index:
Error Messages:
Clear
Save
Proceedings of the The XXXth Annual Occupational Ergonomics and Safety Conference Pittsburgh, Pennsylvania, USA June 7-8, 2018
ISBN: 97819384965-6-1 100
Appendix 2: Financial Calculations
Description of
problem being controlled
Description of
controls being considered
Comments:
Return on Investment (ROI):
Date:
A = Average current cost of incident being addressed (site specific if possible)
B = Number of incidents that these controls are likely to prevent each year
Avoidable Costs: Per accident Per year
Direct avoided costs (A X B = AB) 0$ 0$
Indirect avoided costs:
Productivity:
Productivity Loss of replacement worker -$
Decreased productivity of an employee after an incident -$ -$
Time:
Increased supervisory attention to job -$
Administrative time related to the incident (investigation, paperwork, etc.) -$ -$
Other:
Replacing workers (hiring, orientation, post offer testing) 56,992$ 56,992$
Overtime -$ -$
Number of hours employee is absent prior to Workers Compensation X Employees Wage /hr = -$ -$
Other (define) -$ -$
Other (define) -$ -$
Possible Savings (PER YEAR) as sum of possible costs avoided 56,992$
Potential Savings assuming the recommended control allows for a 100% reduction in avoidable costs 56,992$
Control Costs:
Total initial cost to implement controls
Capital 50,000$
Installation
Training
Other (define)
Initial productivity improvements as a result of process change
Net initial cost of controls
Annual cost of maintaining controls
Maintenance
Training
Other (define)
Annual Productivity Improvements
Net annual cost of controls
Residual value of controls at end of period
Life expectancy of controls in years
i = Expected average inflation rate during the life expectancy of the controls being considered in %
r = Company minimum acceptable rate of return on an investment (i.e., "discount rate") in %
A o n R isk So lut io ns | Casualty Risk Consulting | Ergonomics
2%
4%
50,000$
6
1,000$
-$
50,000$
-$
0$
2/15/18Analysis performed by: Richard Wyatt
Fill in all information in yellow and results will be calculated automatically
1
Net Present Value (NPV):
Payback Period (in years):
Internal Rate of Return (IRR): Initial Savings are greater than the initial investment
$276,818
Cost Benefit Analysis of Ergonomic or Safety Improvements
5.86
1.77
Presented to:
Location:
1. change the traffic pattern, and 2. add conveyors so the boxes are transported more efficiently
Company Name:
Eliminate one lifting steps in a packaging operation
Example case study
Disclaimer: The financial results presented above are an approximation of an outcome based on the data supplied the worksheet. This program does not guarantee these results will be achieved.
Notes:1. Potential Savings (benefits) are treated as cash flows in the formulas used to calculate the Payback Period, NPV and ROI.2. Both time value of money and inflation factors are involved in the calculations, including the Payback Period calculation.
3. No depreciation or tax consequences are involved in any of the calculations.4. Costs and Benefits are both assumed to occur at the beginning of the period because costs are paid immediately and the benefits are potential savings (or money not spent on
claims that can be directed towards other expenses during the year).
5. Claim savings are assumed to be constant and last for the expected life of the control.6. IRR will not be calculated if there is not an initial Cash Outflow.
Proceedings of the The XXXth Annual Occupational Ergonomics and Safety Conference Pittsburgh, Pennsylvania, USA June 7-8, 2018
ISBN: 97819384965-6-1 101