WINNING 150 - fabians.org.uk
47
WINNING 150 UNDERSTANDING LABOUR’S TARGET SEATS Luke Raikes September 2021
Transcript of WINNING 150 - fabians.org.uk

WINNING 150
UNDERSTANDING LABOUR’S TARGET SEATS
Luke Raikes
September 2021

WINNING 150: UNDERSTANDING LABOUR’S TARGET SEATS
FABIAN SOCIETY
Acknowledgements
The author would like to thank colleagues for their support with this work,
particularly Andrew Harrop, Katherine Sangster, Ben Cooper, Josh Abey,
Kate Murray and Emma Burnell.

WINNING 150: UNDERSTANDING LABOUR’S TARGET SEATS
FABIAN SOCIETY
CONTENTS
SUMMARY ....................................................................................................... 1
INTRODUCTION ............................................................................................. 5
1. ELECTORAL HISTORY (GB) .................................................................... 6
2. REGION AND NATION (GB) ................................................................... 11
3. SCOTLAND ........................................................................................... 13
4. CITY, TOWN AND VILLAGE (E&W) ......................................................... 15
5. AGE (E&W) ......................................................................................... 17
6. EDUCATION LEVEL (E&W) ................................................................... 19
7. SOCIAL GRADE (E&W) ......................................................................... 21
8. HOUSING TENURE (E&W) .................................................................... 24
9. ETHNICITY (E&W) ............................................................................... 26
11. DEPRIVATION (ENGLAND) ................................................................ 28
12. ECONOMIC CHANGE (E&W) ............................................................. 30
13. BREXIT VOTE (E&W) ....................................................................... 33
CONCLUSIONS ............................................................................................ 35

1
FABIAN SOCIETY
SUMMARY
The next general election is fast approaching: if an election is held in spring
2023, then we are halfway through the parliament and a year and half from
the start of the official campaign.
This paper examines the challenge facing the Labour party in that election. It
does so by painting a statistical picture of the 150 non-Labour seats where
the party came closest to winning in the 2019 election. With Labour needing
to gain 123 seats to have a majority of one, this is the pool of constituencies
which might become Labour’s target seats.
Since there is a strong chance of an election in the first nine months of 2023,
our analysis is based on existing constituency boundaries. An election at a
later date will be fought with new seats but the general pattern of results we
present will not change much: the job will just become a little harder.
There are no shortcuts to a Labour government. Our analysis of the 150
potential target seats shows the party must appeal to a very broad range of
people and win seats across the length and breadth of the country. Labour
cannot ‘slice and dice’ the electorate by seeking to prioritise any one
grouping of seats, whether that is the Red Wall, the Blue Wall, or any other
type of place.
In England and Wales, there are 125 target seats:
- They are mostly made up of towns and villages. Ninety-five of the 125
constituencies are made up of towns (or sometimes villages), with many
of these in the north, midlands and Wales and usually not adjacent to
core cities.
- They are a diverse group of seats and often not ‘extreme’. We looked at
where the target seats sit by looking at their distribution across five
quintiles made up of all constituencies. For all the measures we examine,
the target seats range widely in their characteristics. On some measures
the seats are evenly distributed between five quintiles of seats; or are
clustered around the middle three quintiles. This is the case with respect
to ethnicity, age, homeownership, and numbers of voters in C1
households.

2
FABIAN SOCIETY
- On some measures the target seats skew a little in one direction.
Compared to the median seat in England and Wales, the target seats
tend to have fewer graduates, more voters in C2 and DE households,
more leave voters, lower house price inflation, and lower employment
growth.
- Most are not formerly loyal Labour seats. Only 41 are seats in England
and Wales that used to be loyally Labour and were lost in 2015, 2017 or
2019. More than half of the 125 are seats that have not been consistently
held by Labour – they have either moved between parties in recent times
or have never been in Labour hands.
- More target seats have been slipping away from Labour than have
been moving towards the party. Relative to Labour’s England and
Wales vote share in each election, more seats have been moving away
from Labour than growing more supportive:, 79 target seats have a
lower relative vote share in 2019 compared to 2005, while only 46 have
seen this relative vote share increase. There has been a large drop in
support, in seats where there are: fewer graduates, more Brexit
supporters, more ‘working-class’ DE households; and in places that have
experienced low house price inflation and low employment growth. A
smaller number of seats have been moving at a slower pace towards
Labour: these are often seats the party has never or rarely won before;
they have more graduates, more remain supporters, fewer working-class
voters and are places with above average house price inflation and
employment growth.
In Scotland, there are 25 target seats. They all saw an increased vote for the
SNP in 2019 and are seats in the middle-ground of Scottish politics: they are
clustered around the Scottish median in the extent for their support for
remaining in the EU and for the SNP.
Looking forward, Labour should have four priorities:
1. Win over ‘swing’ seats and seats last won in 2005. There are 51 seats in
England and Wales in this group: 34 last voted Labour in 2005; 17 have
switched more than once between the parties in the last five elections.
Together they make up a major, and recently overlooked, group of
constituencies.
2. Reverse the decline in formerly loyal seats. There are 41 seats in
England and Wales that were formerly loyal to Labour. While the
majorities tend to be smaller, they have been moving away from Labour
for some time and this could be challenging to reverse.

3
FABIAN SOCIETY
3. Win back seats in Scotland. The opinion polls show a country still split
on independence but with a little appetite for an immediate
referendum. A large percentage of Scots want to see stronger
cooperation between Scotland and the rest of the UK. Labour needs to
demonstrate it is the party that can build a strong partnership between
the nations, with a vision for a progressive Britain that devolves power
away from Westminster and into the nations and regions.
4. Exploit smaller, slower-moving demographic changes in previous ‘no-
go’ areas. Thirty-three seats that are within reach, have never or rarely
voted Labour (ie 2001 at the most recent), though many of these have
substantial majorities to overcome. Winning a few extra seats by
capitalising on demographic changes would be the icing on the cake,
but seats like this are too few in number to put Labour in range of
minority government, let alone a majority.

4
FABIAN SOCIETY
FIGURE 1: SUMMARY OF LABOUR’S TARGET SEATS (ENGLAND AND WALES)
FIGURE 2: SUMMARY OF LABOUR’S TARGET SEATS

5
FABIAN SOCIETY
INTRODUCTION
We could be halfway through this parliament if an election is called in the
first half of 2023, as some now expect. For Labour to win that election, the
party has a mountain to climb.
This paper looks forward to that next election and faces up to that challenge,
by seeking to understand the places where Labour needs to win. To win a
majority of one the party needs to gain 123 seats over its disastrous 2019
result. For this reason, the Fabian Society has examined a pool of 150
potential target seats where Labour needs to compete – diverse places with
diverse politics and diverse voters.
These 150 seats we have chosen are the ones where, in 2019, Labour came
closest to the winning party in terms of share of the vote.i When it comes to
selecting seats to target, the result in 2019 should not be the only criterion.
But this is a sensible starting point and any set of target seats will look very
similar to the ones we have here.
Our analysis is based on existing constituencies, on the assumption that an
election is most likely in 2023. New constituency boundaries will take effect
in late 2023 and overall these are likely to make Labour’s job harder: one
projection suggests Labour would enter a 2024 election notionally holding
194 of the new constituencies, meaning it would need to gain 132 seats to
win.ii However, in terms of the profile of the places the party would need to
gain, the picture we present here based on existing seats would change little.
This paper focuses on some of the characteristics of constituencies that we
know are most politically important. As we describe these seats, it is
important not to reduce them to simple caricatures based on the dominant
group within them – all types of voter are present in all types of
constituency, and just because one group is well represented within a place,
that doesn’t mean they will necessarily be politically decisive. But it does
give a rough idea of the direction Labour will need to take to stand a chance
of winning enough seats to form the next government. The Scottish
challenge is the subject of its own section – it has been written in conjunction
with the Scottish Fabians, who have published their own report to
complement this one.

6
FABIAN SOCIETY
1. Electoral history (GB)
Context
The way a seat has voted in the past is a good sign of which way it will
vote in future. Recent commentary has focused mainly on former Red Wall
seats that used to be loyally Labour, in the North, Midlands and Wales,
Recently there has also been talk of a Blue Wall - longstanding Conservative
seats that have moved away from the party in recent elections. Commentary
since the 2019 election has paid less attention to swing seats or seats Labour
last won in 2005.
Analysis
Labour must win seats with very different political histories – from
constituencies Labour has never won, to seats that were loyally Labour until
2017 and 2019. Figure 3 below summarises the political history of the 150
seats.
FIGURE 3: LABOUR’S 150 TARGET SEATS
Electoral
history Description No. of seats
Formerly loyal Labour
Seats lost in 2015, 2017 or 2019 that had usually been in Labour hands for decades (though we’ve included 2 seats that voted Lib Dem in 2010)
41
Swing seat Seats that changed hands between Labour and Conservatives over the 2010, 2015 and 2017 elections 17
Not Labour since 2005
Seats last held by Labour in 2005 that the party lost when it left office in 2010 34
Rarely or never Labour Seats never held by Labour or last won by the party in 2001 33
England and
Wales 125
Scotland The 25 Scottish seats where Labour is most competitive. All were held by Labour prior to 2015. 25
Great Britain 150

7
FABIAN SOCIETY
Most of the formerly loyal Labour and swing seats are concentrated in the
North, the Midlands, Scotland and Wales, as Figure 4 below shows. Seats
last won in 2005, or never/rarely won, tend to be spread fairly evenly around
England and Wales.
FIGURE 4: DISTRIBUTION OF LABOUR’S 150 TARGET SEATS

8
FABIAN SOCIETY
Figures 5 and 6 below show the challenge ahead for Labour:
- Within each of these groups of seats, some are more marginal than
others. As figure 5 shows, many are currently a long way from voting
Labour, requiring a local electoral swing of 10 percentage points or
more. The groups with the most winnable constituencies on average are
swing seats and formerly loyal Labour seats. The most challenging
groups are those rarely or never held, and the Scottish seats, followed by
those last won in 2005. But even these groups have some ‘low hanging
fruit’.
- No one group of seats combines the size and ‘winnability’ required for
Labour to gain power. Figure 6 shows that for each notch of progress
Labour needs to make, there are seats to be targeted across all the types
of constituency. A huge diversity of seats will be needed for Labour to
do well enough to either form a government or win an overall majority.
To make progress, the party needs to reverse changes in voting patterns
which have been underway for more than a decade. Figures 7 and 8 look at
Labour’s performance in recent elections in different groups of seats,
compared to its overall nationwide performance in the same year.
- Labour’s vote has become increasingly concentrated in the seats it held
in 2019. Figure 7 shows how, collectively, the 150 seats have drifted
slightly away from Labour since 2010 when compared to the party’s
national vote share; while the party’s vote share in seats it held in 2019
has increased. As well as seeking to increase its national vote share,
Labour will find it much easier to win if it can reverse this trend and
advance more in the 150 target seats than across the country at large. iii
- There has been a huge slump in the Scottish target seats in 2015, and a
more gradual but significant decline in formerly loyal Labour seats
since 2005. Figure 8 looks within the group of 150 and shows their
different trajectories by their electoral history. More positively, swing
seats and seats never or rarely won have on average have trended
gradually towards Labour since 2010, compared to the party’s
nationwide performance.
This data on trajectory needs to be taken into account when thinking about
which seats to prioritise. Constituencies that have been moving towards
Labour, relative to nationwide performance, could be more winnable than
their 2019 result would suggest. This means that some of the seats last won
in 2005 or never or rarely won may be more obtainable than they first
appear. Conversely, it might be harder than it appears to win seats that have
been slipping away.

9
FABIAN SOCIETY
FIGURE 5: REQUIRED SWING IN TARGET SEATS GROUPED BY ELECTORAL HISTORY
FIGURE 6: TARGET SEATS BY REQUIRED SWING AND ELECTORAL HISTORY

10
FABIAN SOCIETY
FIGURE 7: LABOUR VOTE SHARE IN DIFFERENT TYPES OF SEAT, COMPARED TO NATIONAL LABOUR VOTE SHARE IN EACH YEAR (1)
FIGURE 8: LABOUR VOTE SHARE IN DIFFERENT TYPES OF SEAT, COMPARED TO NATIONAL LABOUR VOTE SHARE IN EACH YEAR (2)

11
FABIAN SOCIETY
2. Region and nation (GB)
Context
Labour has traditionally been strongest in London, the North, Wales and
Scotland. Seats in these regions and nations have formed the bedrock of
Labour’s parliamentary party. But in 2019, Labour is far weaker than in
2005: in the North, the number of Labour seats won was 127 in 2005 but only
88 in 2019; in the Midlands, seats won fell from 63 to 23; and in Wales from
30 to 22. In Scotland, Labour’s vote collapsed in 2015, and the number of
Labour MPs fell from 41 to 1 (see section 3). Some of these seats did come
back to Labour temporarily in 2017 however.
Analysis
- Labour’s target seats are mostly in Scotland, the North, the Midlands
and Wales. 47 are in the North (23 in the North West alone), 25 are in
Scotland, 24 in the Midlands, and 15 in Wales. Just 39 of the 150 are in
southern England including London and the East of England, despite
these regions making up 270 seats overall.
- There is a disproportionate number of target seats in Wales – 15 Welsh
seats are now Labour targets, making up 38 per cent of Wales’ total seats.
- Labour’s performance in the target seats has been improving, relative
to the national picture, in southern England (and a little in Wales). It
has been declining in the West Midlands and North East – and
dramatically so in Scotland.
- Ultra-marginals and more challenging seats are spread evenly across
the country. The North West and Wales have the most ‘low-hanging
fruit’.

12
FABIAN SOCIETY
FIGURE 9: LABOUR VOTE SHARE IN TARGET SEATS, IN DIFFERENT NATIONS AND REGIONS, COMPARED TO NATIONAL LABOUR VOTE SHARE FOR EACH YEAR
FIGURE 10: TARGET SEATS BY REQUIRED SWING AND NATION/REGION

13
FABIAN SOCIETY
3. Scotland
Context
Scotland has been a cornerstone of all Labour majorities in the past, but in
2015 Labour was all but wiped out as a political force in Scotland, retaining
only one seat and losing 40. With 25 of the party’s target seats located in
Scotland, making progress north of the border is essential if Labour is to
form a majority government. It is important not to view a vote for the SNP
as a proxy vote on independence. Polling suggests that 40 per cent of Scots
are not strongly pro-independence or pro-union and that the leadership of
Nicola Sturgeon, and the vision represented by the SNP, attracted many of
these voters in both 2019 and 2021.iv This is the group Labour must target to
find people who might consider shifting their vote from the SNP to a Labour
party that is pro-devolution, proudly Scottish and seems capable of winning
at Westminster (these voters are less likely to support the stridently pro-
Union Conservatives).
Analysis
- Labour’s Scottish target seats typically have higher majorities to
overturn than target constituencies in England and Wales. All are held
by the SNP, and their median majority is 16 per cent, ranging from 3 per
cent (Kirkcaldy and Cowdenbeath) to 25 per cent (Livingston).
- The target seats are centred on Scotlands’s political middle ground –
preferring remain to leave, marginally opposed to independence in 2014
but now supporting the SNP.
- The party needs to address the legacy of the independence referendum
and win SNP voters. It is impossible to win most of Labour’s Scottish
target seats without winning voters directly from the SNP. But only
three of the target seats have a larger majority of votes for pro-
independence parties than for pro-union parties in the 2019 election.

14
FABIAN SOCIETY
FIGURE 11: SCOTLAND CONSTITUENCIES BY EXTENT OF SUPPORT FOR REMAINING IN THE EU AND SNP VOTE SHARE IN 2019 (LINES CROSS AT MEDIAN)

15
FABIAN SOCIETY
4. City, town and village (E&W)
Context
Constituencies made up of towns have long been key electoral
battlegrounds. Historically, Labour has dominated in major cities and post-
industrial towns, in London and the North and Wales, while the
Conservatives have held rural areas, particularly in the south. At the 2015,
2017 and 2019 elections, many of the seats which fell to the Conservatives
were also towns.
Analysis
- Labour’s 125 England and Wales target seats are concentrated outside
of cities: v 95 comprise towns outside conurbations, towns within
conurbations, or villages and smaller communities. 30 are core city or
‘other city’ seats. vi
- Most of non-city target seats are not recently lost, formerly loyal
Labour seats: only 34 of the 95 non-city seats were lost between 2015 and
2019; 14 are swing seats, 24 were last won in 2005 and 23 have never or
rarely been won.
- 68 of the target seats are in towns that are not part of wider
conurbations, with 52 of these in the North, Midlands and Wales –
places such as Darlington or Wrexham.
- Labour’s performance has declined relative to its national results in
most of the 68 target constituencies made up of towns outside
conurbations. In the 10 town constituencies that are part of
conurbations, changes in Labour vote have mirrored the national
average.

16
FABIAN SOCIETY
FIGURE 12: TARGET SEATS (BY CITY/TOWN/VILLAGE)
FIGURE 13: LABOUR VOTE SHARE IN DIFFERENT TYPES OF SEAT, COMPARED TO NATIONAL LABOUR VOTE SHARE FOR EACH YEAR (BY CITY/TOWN/VILLAGE)

17
FABIAN SOCIETY
5. Age (E&W)
Context
In England and Wales, younger voters currently tend to vote Labour and
older voters overwhelmingly vote Conservative. The youngest voters have
tended to vote Labour since at least 1992, but Labour has at times won more
older voters – mot recently in 2010. A stark crossover pattern for age
emerged in 2015, and widened in 2017 and then again in 2019.vii In 2017 the
crossover point – the age at which more of a cohort voted Conservative than
Labour – was 47.viii In 2019 this dropped to age 39. Sixty-seven per cent of
those aged 70+ voted Conservative in 2019, and only 14 per cent voted
Labour.
Analysis
- Labour mostly needs to win places that are neither extremely old nor
extremely young. Most target seats are in the middle in terms of age
profile. Figure 14 shows that 94 of the 125 target seats in England and
Wales are in the middle three-fifths when it comes to their percentage of
residents over 50. Only a few target seats are either extremely young or
extremely old.
- This contrasts with the seats Labour currently holds. Half of Labour’s
existing seats are in the fifth of constituencies with fewest older people.
This includes seats such as Sheffield Central, Manchester Central and
Liverpool Riverside, where 40 to 50 per cent of the adult population is
aged 18 to 30. Only 10 per cent of Labour’s target seats are in this
quintile.

18
FABIAN SOCIETY
FIGURE 14: CONSTITUENCIES BY SHARE OF POPULATION AGED 50+
FIGURE 15: LABOUR VOTE SHARE IN TARGET SEATS IN EACH QUINTILE, COMPARED TO NATIONAL LABOUR VOTE SHARE IN THE SAME YEAR

19
FABIAN SOCIETY
6. Education level (E&W)
Context
Current Labour voters tend to have a higher level of formal qualification.
Even if we factor in a person’s age, there appears to be something about
degree-level education which influences people’s views, particularly around
national identity, immigration, the EU and diversity.ix x The link between
education and politics has changed dramatically over the last 50 years: the
population as a whole has become much more educated; and lower
educated voters are now more likely to vote Conservative than Labour.xi In
2019, 71 per cent of the voters who voted Conservative for the first time did
not have a degree-level qualification, compared to 61 per cent of the
population as a whole.xii
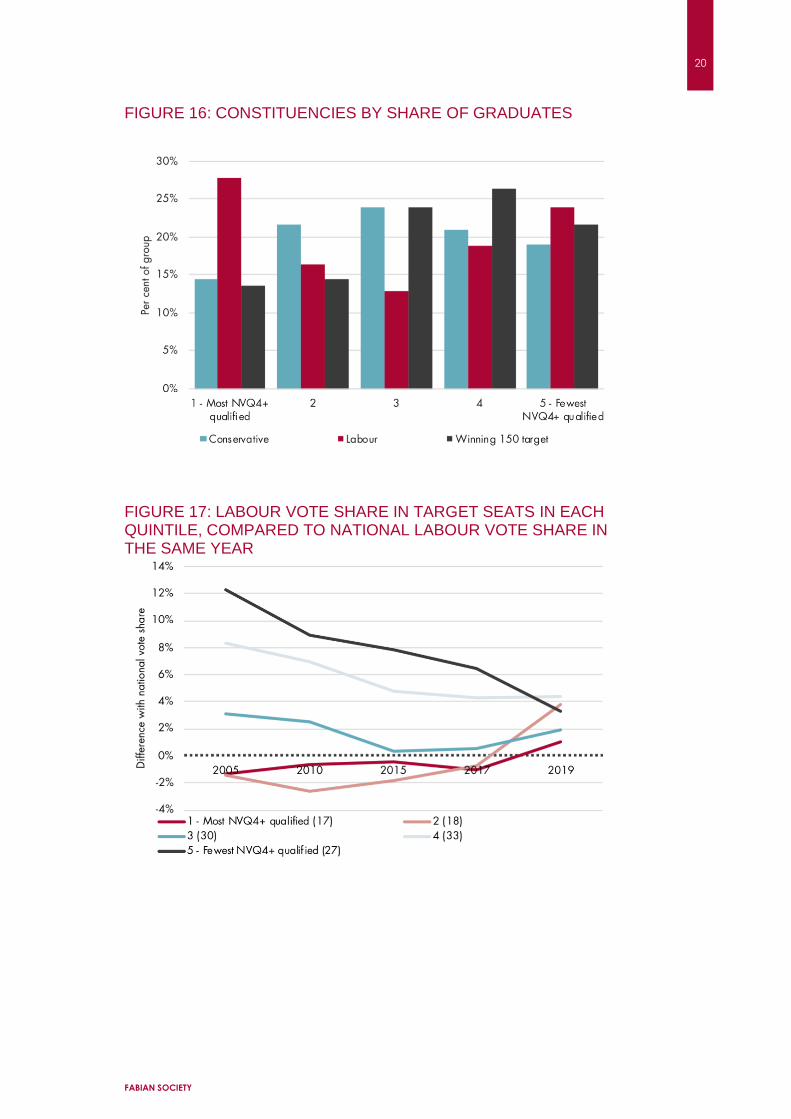
Analysis
- Labour mainly needs to win in places with low and middling numbers
of graduates. Sixty of the 125 target seats in England and Wales are in
the two-fifths of constituencies with the fewest graduates (figure 16). At
the moment, the party does best in places with very high or very low
proportions of graduates.
- Target seats with fewest graduates have been trending away from
Labour – places like Bolsover and Ashfield. Seats with the most
graduates have moved toward the party, but there are fewer of them –
35 in the top two quintiles for numbers of graduates compared to 60 in
the bottom two quintiles.
20
FABIAN SOCIETY
FIGURE 16: CONSTITUENCIES BY SHARE OF GRADUATES
FIGURE 17: LABOUR VOTE SHARE IN TARGET SEATS IN EACH QUINTILE, COMPARED TO NATIONAL LABOUR VOTE SHARE IN THE SAME YEAR

21
FABIAN SOCIETY
7. Social grade (E&W)
Context
Both major parties are cross-class coalitions – and they always have been.
There have always been a significant number of working-class Tories:
Labour’s support base was once overwhelmingly working-class; but the
working class did not all support Labour.xiii Class is complex, but here we
use the NRS/MRS social grade classification, a household measure derived
from the occupation or former occupation of the household member with
the highest income. In recent years, the ‘working-class’ (C2DE) group has
declined in size and has also shifted significantly toward the Conservatives,
especially in 2019.xiv But this obscures differences within this group. It is
important to discuss the large C1 and C2 groups, which tend to be decisive
in elections.
Analysis
- The seats Labour currently holds tend to have high numbers of DE
households, but not C2 households. Two-thirds of Labour 2019 seats
are in the two-fifths of seats with most DE voters. But the C2 group,
often paired with DE, shows a very different political distribution – 60
per cent of Labour’s seats are in the two quintiles with the lowest share
of C2 voters. This shows that places with the most skilled/upper working
class households skew away from Labour, while places with more lower
skilled/lower working class, unemployed and stat pensioner households
skew toward the party.
- Labour’s target seats tend to skew away from AB, slightly toward DE
and C2, and are highly varied in their proportion of voters in C1
households. Figures 18-21 below show the different distributions.

22
FABIAN SOCIETY
FIGURE 18: CONSTITUENCIES BY SHARE OF AB HOUSEHOLDS
FIGURE 19: CONSTITUENCIES BY SHARE OF C1 HOUSEHOLDS

23
FABIAN SOCIETY
FIGURE 20: CONSTITUENCIES BY SHARE OF C2 HOUSEHOLDS
FIGURE 21: CONSTITUENCIES BY SHARE OF DE HOUSEHOLDS

24
FABIAN SOCIETY
8. Housing tenure (E&W)
Context
Historically, the Conservatives have done best among homeowners, and
Labour among social and private renters. This pattern broadly remains but
society has slowly changed over the last 50 years: the number of owner
occupiers has increased while social renting has decreased.xv In 2019, a small
but significant proportion of social renters voted Conservative for the first
time, although first-time Conservative voters were disproportionately
homeowners.xvi xvii
Analysis:
- The seats Labour needs to win are mainly in the middle with respect to
the number of homeowners. In contrast, the seats Labour currently
holds have a very high skew towards places with few homeowners. 80
per cent of Labour seats are in the two-fifths of constituencies with least
home owners (figure 22).
- Labour’s target seats are mainly around two-thirds owner occupier.
Formerly loyal Labour seats tend to have higher concentrations of social
housing (21 per cent) while those not won since 2001 have lower
concentrations (15 per cent).
- The target seats with low levels of homeownership have been moving
away from Labour, even though most of the party’s current seats also
have low homeownership. In the 12 target constituencies in the bottom
fifth of seats for homeownership, Labour’s vote share has plummeted in
recent elections – places like West Bromwich West, or Wolverhampton
North East.
- Some target seats with relatively high homeownership have recently
moved slightly toward the party. The 50 target seats in the top two
quintiles for homeownership became more favourable for the party
between 2017 and 2019.

25
FABIAN SOCIETY
FIGURE 22: CONSTITUENCIES BY SHARE OF OWNER OCCUPIERS
FIGURE 23: LABOUR VOTE SHARE IN TARGET SEATS IN EACH QUINTILE, COMPARED TO NATIONAL LABOUR VOTE SHARE IN THE SAME YEAR

26
FABIAN SOCIETY
9. Ethnicity (E&W)
Context
Labour has tended to attract Black, Asian and minority ethnic voters,
although this group is diverse and the Conservatives have made gains
among some ethnic groups. Labour has historically won the most Black and
ethnic minority voters, both on aggregate and across all minority ethnic
groups. But Labour’s lead has fluctuated, and different groups have very
different voting patterns – ethnic groups are very diverse and don’t vote as a
bloc, as is sometimes assumed.xviii The Conservatives have recently been able
to attract British Chinese and Indian voters.xix
Analysis
- Labour’s target seats are evenly distributed between places with high
and low proportions of minority ethnic voters (figure 24). Twenty-three
seats are in the fifth of seats with the lowest share of ethnic minorities.
These seats are all in villages and towns and as a group they have moved
significantly against Labour since 2005.
- 22 target seats have populations in the fifth of seats with the highest
share of minority ethnic residents. Twelve of these target seats are
constituencies in the north and midlands and have high Asian
populations (such as Keighley and Pendle); 11 have high Black
populations, primarily in the south (such as Milton Keynes North and
Reading West); 14 have both high Black and high Asian populations,
largely in London (such as Harrow East and Kensington). Target seats in
places with the most minority ethnic voters have slightly increased their
support for Labour, compared to the national average.

27
FABIAN SOCIETY
FIGURE 24: CONSTITUENCIES BY SIZE OF MINORITY ETHNIC POPULATION
FIGURE 25: LABOUR VOTE SHARE IN TARGET SEATS IN EACH QUINTILE, COMPARED TO NATIONAL LABOUR VOTE SHARE IN THE SAME YEAR

28
FABIAN SOCIETY
11. Deprivation (England)
Context
Labour has tended to do well in areas that are more deprived. In England,
the index of multiple deprivation (IMD) is a measure, which picks up the
many dimensions of poverty that affect people living in places. While
London does have severe poverty, many of the most deprived constituencies
by this measure are now concentrated in cities and towns outside of the
capital (none are villages). The Conservatives have always held on to less
deprived places, the majority of which are towns and villages – concentrated
in the south, but not exclusively so.
Analysis
- Labour’s target seats are mostly places with average levels of
deprivation. Target seats are concentrated in the middle three quintiles
for deprivation – places like Colne Valley, Morley and Outwood or
Chingford and Woodford Green, which have average levels of
deprivation.
- Labour has been slowly losing relative vote share in more deprived
target seats since 2010 – places like West Bromwich West or Stoke-On-
Trent North have slipped away over the long term.
- Labour has been slowly gaining relative vote share in less deprived
target seats since 2015 – places like Altrincham and Sale West and
Rushcliffe, some of which saw an uptick between 2017 and 2019 relative
to Labour’s national vote share.

29
FABIAN SOCIETY
FIGURE 26: CONSTITUENCIES BY LEVEL OF DEPRIVATION
FIGURE 27: LABOUR VOTE SHARE IN TARGET SEATS IN EACH QUINTILE, COMPARED TO NATIONAL LABOUR VOTE SHARE IN THE SAME YEAR

30
FABIAN SOCIETY
12. Economic change (E&W)
Context
Relative economic decline has become associated with Euroscepticism, to
the Conservatives’ recent benefit. Most people, wherever they live, share a
deep interest in how their town or city looks and the direction they feel it is
going in.xx The perception of decline in post-industrial or coastal towns was
a major factor in people voting to leave the EU and then to voting
Conservative, especially in the north and midlands.xxi
Analysis
- Labour’s target seats have had very different experiences in terms of
job creation. The party needs to win significant numbers of seats in
places which have had high, medium and low levels of employment
growth between 2010 and 2019 but more of these have had average or
lower levels of employment growth. Places with lower employment
growth, and some places where employment fell, tended to move away
from Labour, while places high employment growth have moved
toward Labour – despite these changes happening under a Conservative
government.
- Many target seats have seen low house price inflation. A third of target
seats are in the bottom quintile for house price growth, which is similar
to some of the seats Labour currently holds, but very different from
Labour’s London seats, which have seen some of the strongest house
price growth in the country.
- Target seats which have experienced relative economic decline since
2010 have generally shifted toward the Conservatives. The places
experiencing the worst relative employment and house price changes
under Conservative governments have been moving away from Labour.
Target seats that have prospered the most have trended towards Labour.

31
FABIAN SOCIETY
FIGURE 28: CONSTITUENCIES BY PER CENT RESIDENT EMPLOYMENT GROWTH (2010-19)
*Some constituencies saw a decline in employment
FIGURE 29: LABOUR VOTE SHARE IN TARGET SEATS IN EACH QUINTILE, COMPARED TO NATIONAL LABOUR VOTE SHARE IN THE SAME YEAR

32
FABIAN SOCIETY
FIGURE 30: CONSTITUENCIES BY EXTENT OF HOUSE PRICE INFLATION (2010-19)
FIGURE 31: LABOUR VOTE SHARE IN TARGET SEATS IN EACH QUINTILE, COMPARED TO NATIONAL LABOUR VOTE SHARE IN THE SAME YEAR
*Some constituencies saw a decline in employment

33
FABIAN SOCIETY
13. Brexit vote (E&W)
Context
The Conservatives have profited significantly from the Brexit divide. In
the North and Midlands, support for leaving the EU reflected a complex and
longer term political change, rooted in the economic decline of many post-
industrial towns. The Conservatives exploited this effectively in 2019: 86 per
cent of the Conservatives’ new voters in 2019 had voted Brexit (and they
were distributed efficiently in former Labour Red Wall seats).xxii The seats
Labour lost where overwhelmingly leave-voting.xxiii Despite Britain having
now left the EU, the consequences of Brexit still work their way through our
politics, particularly in England. Only a few people define their primary
political identity by their Brexit vote, but few have changed their mind on
the issue either.xxiv xxv
Analysis
- The seats Labour needs to win are mostly more Brexit-leaning than the
ones they currently hold. Target seats are concentrated in places with
average and above average levels of Brexit vote – 75 per cent of the
Labour target seats in England and Wales are in the three-fifth of seats
that were most Brexit-leaning. Only 7 per cent are in the most remain-
leaning fifth of seats (a huge share of strong remain seats are already
Labour).
- Labour was losing ground in leave-voting target seats long before
Brexit: many of the target seats in the two-fifths of constituencies which
had the most Brexit voters in 2016 were already slipping away between
2005 and 2010. Labour’s relative vote share in target seats in the
strongest leave voting quintile declined at every election after 2005.
Some target seats in the three-fifths of seats with average or below
average levels of Brexit support have been moving towards Labour – but
at a much slower pace.

34
FABIAN SOCIETY
FIGURE 32: CONSTITUENCIES BY EXTENT OF SUPPORT FOR BREXIT
FIGURE 33: LABOUR VOTE SHARE IN TARGET SEATS IN EACH QUINTILE, COMPARED TO NATIONAL LABOUR VOTE SHARE IN THE SAME YEAR

35
FABIAN SOCIETY
CONCLUSIONS
There is no shortcut to a Labour government. This analysis shows that
Labour has a tough task ahead to appeal to a broad range of people and win
seats across the length and breadth of the country. The seats Labour needs to
win do not fit into easy stereotypes: they are different from one another and
mainly very different from the seats Labour currently holds.
Many of the seats Labour needs to win are at neither extreme – they are
concentrated within the middle three quintiles for the characteristics we
have reported. That said, the target seats tend to have fewer graduates, more
voters in C2 and DE households, more leave voters, lower house price
inflation and lower employment growth.
Looking forward, Labour should have four priorities:
1. Win over ‘swing’ seats and seats last won in 2005. There are 51 seats in
England and Wales in this group: 34 last voted Labour in 2005; 17 have
switched more than once between the parties in the last five elections.
Together they make up a major, and recently overlooked, group of
constituencies.
2. Reverse the decline in formerly loyal seats. There are 41 seats in
England and Wales that were formerly loyal to Labour. While the
majorities tend to be smaller, they have been moving away from Labour
for some time and this could be challenging to reverse.
3. Win back seats in Scotland. The opinion polls show a country still split
on independence but with a little appetite for an immediate
referendum. A large percentage of Scots want to see stronger
cooperation between Scotland and the rest of the UK. Labour needs to
demonstrate it is the party that can build a strong partnership between
the nations, with a vision for a progressive Britain that devolves power
away from Westminster and into the nations and regions.
4. Exploit smaller, slower-moving demographic changes in previous ‘no-
go’ areas. Thirty-three seats that are within reach, have never or rarely
voted Labour (ie 2001 at the most recent), though many of these have
substantial majorities to overcome. Winning a few extra seats by
capitalising on demographic changes would be the icing on the cake,

36
FABIAN SOCIETY
but seats like this are too few in number to put Labour in range of
minority government, let alone a majority.
Geographically, Labour’s priority is towns in the North, the Midlands, and
Wales – particularly those that are not part of major cities – as well as
Scotland. This doesn’t just include places recently lost, although many are –
it also includes traditional swing seats and places not won since 2005,
alongside some of the places Labour has never won.
Labour’s task of winning the next election is hard but not impossible. This
analysis might appear to pull the party in different directions, and the
mountain to climb is not to be underestimated: Labour needs to win a large
number of very different seats. But this is always the case for any party
coming from opposition. In the past, Labour has won towns, cities and
villages in every corner of the country; the Conservatives have done so
since 2010 – often against all odds, and flying in the face of traditional
assumptions and data analysis. It is not beyond the abilities of a well-
organised, focused Labour party to form the next government.

1
FABIAN SOCIETY
Annex 1: Target seats summaryxxvi
1 = Highest --> 5 =lowest
CO
NSTI
TUEN
CY
PO
LITI
CA
L H
ISTO
RY
SW
ING
REQ
UIR
ED
REG
ION
AN
D N
ATI
ON
CIT
Y T
OW
N A
ND
VIL
LAG
E
PER
CEN
T A
GED
50 A
ND
OLD
ER
PER
CEN
T W
ITH
NV
Q4
+
AB
- S
OC
IAL
GRA
DE
C1
- S
OC
IAL
GR
AD
E
C2
- S
OC
IAL
GR
AD
E
DE -
SO
CIA
L G
RA
DE
HO
USIN
G T
EN
UR
E -
PER
CEN
T O
WN
ER
OC
CU
PIE
R
WH
ITE E
THN
ICIT
Y
IMD
20
19
(EN
GLA
ND
)
RESID
EN
T EM
PLO
YM
EN
T G
RO
WTH
HO
USE P
RIC
E I
NFL
ATI
ON
REM
AIN
VO
TE
Bury North Swing seat
0.1% North West
Town in
conurbation 3 4 3 2 4 3 2 4 4 4 4 3
Kensington Swing seat 0.2% London Core City 4 1 1 1 5 5 5 5 3 5 1 1
Bury South Formerly loyal Labour
0.4% North West Town in conurbation 4 2 3 2 4 3 2 4 4 5 3 3
Bolton North East Formerly loyal Labour 0.4% North West Other City 4 4 4 4 3 1 4 4 5 2 4 4
High Peak Swing seat 0.5% East Midlands Village or smaller* 2 3 2 4 2 3 2 1 2 5 4 2
Gedling Swing seat
0.7% East Midlands Town in conurbation 3 4 3 2 2 4 1 3 2 5 3 3
Heywood and Middleton Formerly loyal Labour
0.7% North West Town in conurbation 3 5 4 4 2 2 3 3 5 5 4 5
Blyth Valley Formerly loyal Labour 0.9% North East Town 2 5 5 2 3 2 3 1 4 5 4 4
Stoke-On-Trent Central Formerly loyal Labour 1.0% West Midlands Other City 4 4 5 4 3 1 5 4 5 4 3 5
Chipping Barnet
Rarely or never
Labour 1.1% London Core City 4 1 1 1 5 5 3 5 2 1 1 1
Delyn Formerly loyal Labour 1.1% Wales Town 1 5 3 5 1 2 1 1 . 5 5 3
North West Durham Formerly loyal Labour 1.2% North East Village or smaller* 2 5 4 4 2 2 2 1 4 4 5 3
Chingford and Woodford Green Rarely or never Labour 1.3% London Core City 4 2 2 1 5 4 2 5 3 1 1 2
Bridgend Formerly loyal Labour 1.4% Wales Town 2 3 3 3 3 3 2 2 . 1 4 2
Dewsbury Swing seat 1.4% Yorkshire and The Humber Town 4 5 3 5 3 2 2 5 4 4 5 4
Warrington South Swing seat 1.6% North West Town 3 2 1 2 4 4 1 3 2 3 4 2
Clwyd South Formerly loyal Labour 1.7% Wales Village or smaller* 2 4 4 5 1 2 4 1 . 1 5 4
Burnley Formerly loyal Labour 1.7% North West Town 3 4 5 5 2 1 3 4 5 5 4 5

2
FABIAN SOCIETY
Birmingham, Northfield Formerly loyal Labour 1.9% West Midlands Core City 4 5 5 4 3 1 5 4 5 5 2 5
Wolverhampton South West Swing seat 2.0% West Midlands Other City 4 2 3 3 4 2 4 5 4 1 4 3
Leigh Formerly loyal Labour 2.1% North West Town 3 4 4 3 2 2 3 2 4 2 2 5
Keighley Swing seat 2.1% Yorkshire and The Humber Town 2 3 3 4 3 3 2 4 4 3 5 3
West Bromwich East Formerly loyal Labour
2.2% West Midlands Town in conurbation 4 4 5 5 1 1 4 5 5 1 4 5
Vale Of Clwyd Swing seat 2.5% Wales Town 2 4 4 4 2 2 3 2 . 4 5 4
Ynys Mon Formerly loyal Labour 2.7% Wales Village or smaller* 1 3 4 5 1 2 3 1 . 4 5 2
Peterborough Swing seat 2.7% East Town 4 4 5 5 3 1 4 5 5 5 3 5
Derby North Swing seat 2.7% East Midlands Other City 4 2 3 3 4 3 4 4 3 3 4 3
Stroud Swing seat 2.9% South West Village or smaller* 2 2 2 4 2 4 1 1 1 3 3 2
Wrexham Formerly loyal Labour 3.2% Wales Town 3 4 4 5 3 1 4 3 . 5 5 4
Aberconwy Last won in 2005 3.2% Wales Village or smaller* 1 4 3 4 2 3 2 2 . 2 5 3
Pudsey Last won in 2005 3.2% Yorkshire and The Humber Town 4 1 1 2 4 5 1 3 2 1 4 2
Vale Of Glamorgan Last won in 2005 3.2% Wales Town 2 2 3 2 3 3 2 2 . 3 4 3
Lincoln Swing seat 3.5% East Midlands Town 4 4 4 3 3 2 4 3 4 4 4 4
Hyndburn Formerly loyal Labour 3.5% North West Town 3 4 5 5 1 1 3 4 5 4 5 5
Hastings and Rye Last won in 2005 3.7% South East Town 2 5 4 2 2 2 4 3 5 1 2 3
Wakefield Formerly loyal Labour 3.7% Yorkshire and The Humber Town 3 5 4 4 2 2 4 4 4 3 5 5
Darlington Formerly loyal Labour 3.8% North East Town 3 4 4 4 3 2 4 3 4 3 5 4
Watford Last won in 2005
3.8% East
Town in
conurbation 5 2 2 1 4 4 3 5 2 3 1 3
Hendon Last won in 2005 3.8% London Core City 5 1 2 2 5 3 5 5 3 1 1 1
Wycombe Rarely or never Labour 3.8% South East Town 4 5 2 3 4 4 3 5 2 4 2 2
Truro and Falmouth Rarely or never Labour 3.9% South West Town 2 2 2 2 3 4 3 2 3 3 4 2
Don Valley Formerly loyal Labour 4.0% Yorkshire and The Humber Town 2 5 5 5 1 2 2 2 4 3 5 5
Reading West Last won in 2005 4.1% South East Other City 4 2 2 3 3 3 4 4 3 4 1 3
Colne Valley Swing seat 4.2% Yorkshire and The Humber Town 2 3 2 3 3 3 1 4 3 4 4 2
Southport
Rarely or never
Labour 4.3% North West Town 1 2 3 2 4 3 2 2 3 3 5 2
Redcar Formerly loyal Labour 4.3% North East Town 2 5 5 5 2 1 3 1 5 4 5 5
Southampton, Itchen Formerly loyal Labour 4.7% South East Other City 5 3 4 3 2 2 5 4 4 1 3 4
Arfon Last won in 2005 4.8% Wales Village or smaller* 4 3 3 2 3 3 4 3 . 3 5 1
Stockton South Swing seat 4.8% North East Town 3 3 3 2 4 3 1 3 3 3 5 4
Broxtowe Last won in 2005
4.8% East Midlands
Town in
conurbation 3 1 2 2 4 4 1 4 1 4 3 3
Calder Valley Last won in 2005 5.0% Yorkshire and The Humber Village or smaller* 2 2 2 3 3 4 2 2 3 3 5 3
Milton Keynes North Last won in 2005 5.0% South East Other City 5 2 2 2 4 3 4 5 2 3 2 2
Norwich North Last won in 2005 5.1% East Other City 3 3 4 3 2 2 3 3 3 4 2 4
Workington Formerly loyal Labour 5.0% North West Town 1 5 4 5 1 2 3 1 4 1 5 4

3
FABIAN SOCIETY
Filton and Bradley Stoke Rarely or never Labour 5.3% South West
Town in conurbation 4 1 2 1 4 5 2 4 1 2 2 2
Milton Keynes South Last won in 2005 5.4% South East Other City 4 3 2 2 4 3 4 5 3 3 1 3
Sedgefield Formerly loyal Labour 5.4% North East Village or smaller* 2 4 4 4 2 2 3 1 4 4 5 4
West Bromwich West Formerly loyal Labour
5.5% West Midlands
Town in
conurbation 4 5 5 5 1 1 5 5 5 1 4 5
Ipswich Swing seat 5.5% East Town 4 4 4 4 3 2 5 4 4 3 2 3
Altrincham and Sale West Rarely or never Labour 5.6% North West
Town in conurbation 3 1 1 3 5 5 1 4 1 4 2 1
Blackpool South Formerly loyal Labour 5.6% North West Town 2 5 5 4 3 1 4 2 5 5 5 5
Northampton South Last won in 2005 5.8% East Midlands Other City 5 4 4 3 4 2 5 4 4 2 2 4
Shipley Rarely or never Labour 5.8% Yorkshire and The Humber Town 2 1 2 1 4 4 1 3 3 3 5 3
Bolsover Formerly loyal Labour 5.8% East Midlands Town 2 5 5 5 1 1 3 1 4 2 4 5
Wolverhampton North East Formerly loyal Labour 6.0% West Midlands Other City 4 5 5 5 1 1 5 5 5 3 2 5
Preseli Pembrokeshire
Rarely or never
Labour 6.0% Wales Village or smaller* 1 4 4 5 1 2 2 1 . 2 5 3
Barrow and Furness Formerly loyal Labour 6.3% North West Town 2 3 4 5 1 2 1 1 4 5 5 4
Rushcliffe
Rarely or never
Labour 6.3% East Midlands Village or smaller* 3 1 1 2 5 5 1 3 1 2 3 1
Cities Of London and Westminster Rarely or never Labour 6.3% London Core City 5 1 1 1 5 5 5 5 2 2 1 1
Rother Valley Formerly loyal Labour 6.5% Yorkshire and The Humber Town 2 3 4 4 1 3 1 2 3 5 4 5
South Swindon Last won in 2005 6.5% South West Other City 4 4 3 4 4 3 4 4 3 5 2 3
Loughborough Last won in 2005 6.6% East Midlands Town 4 4 2 2 3 4 3 4 2 3 3 2
Worcester Last won in 2005 6.6% West Midlands Town 4 3 3 3 4 3 4 3 3 3 4 3
Copeland Formerly loyal Labour 6.9% North West Village or smaller* 1 3 3 5 1 2 2 1 4 5 5 4
Pendle Last won in 2005 7.0% North West Town 4 4 5 5 1 1 3 5 5 5 4 5
Northampton North Last won in 2005 7.0% East Midlands Other City 4 3 4 3 3 2 3 4 4 4 2 4
East Worthing and Shoreham Rarely or never Labour 7.0% South East Town 2 3 3 1 2 4 1 3 2 1 2 3
Morecambe and Lunesdale Last won in 2005 7.0% North West Town 2 5 4 4 1 2 2 1 4 4 5 4
Penistone and Stocksbridge Formerly loyal Labour 7.3% Yorkshire and The Humber Town 1 3 3 3 2 4 1 2 2 1 4 4
Wimbledon
Rarely or never
Labour 7.4% London Core City 5 1 1 3 5 5 4 5 1 3 1 1
Ashfield Formerly loyal Labour 7.4% East Midlands Town 2 5 5 5 1 1 2 1 4 5 4 5
Uxbridge and South Ruislip Rarely or never Labour 7.5% London Core City 5 1 3 1 3 5 3 5 2 5 1 4
Stoke-On-Trent North Formerly loyal Labour 7.8% West Midlands Other City 4 5 5 5 1 1 4 4 5 4 3 5
Crewe and Nantwich Swing seat 7.9% North West Town 3 5 3 4 3 2 2 3 3 3 4 4
Harrow East Last won in 2005 8.3% London Core City 4 1 2 3 4 4 3 5 2 2 1 2
Newcastle-Under-Lyme Formerly loyal Labour 8.3% West Midlands Town 3 3 4 4 3 2 3 3 3 5 5 5
Crawley Last won in 2005 8.4% South East Town 5 5 4 1 2 3 4 5 3 3 1 4
Clwyd West Rarely or never Labour 8.4% Wales Town 1 3 3 4 1 3 2 2 . 5 5 3

4
FABIAN SOCIETY
Corby Last won in 2005 8.5% East Midlands Town 3 4 4 5 2 2 3 3 3 1 2 4
Scunthorpe Formerly loyal Labour 8.5% Yorkshire and The Humber Town 3 5 5 5 1 1 3 3 4 4 5 5
Camborne and Redruth Rarely or never Labour 8.6% South West Town 2 4 4 5 1 2 2 1 4 1 4 4
Colchester
Rarely or never
Labour 8.8% East Town 5 4 3 1 4 3 4 4 3 1 1 3
Bishop Auckland Formerly loyal Labour 8.9% North East Village or smaller* 2 5 5 5 1 1 3 1 4 3 4 4
Carmarthen East and Dinefwr Rarely or never Labour 8.9% Wales Village or smaller* 1 3 4 5 1 3 1 1 . 4 5 3
Stevenage Last won in 2005 9.0% East Town 4 1 3 2 3 3 4 4 3 3 1 4
Bolton West Formerly loyal Labour 9.0% North West Town 3 3 3 3 3 3 2 3 3 2 4 3
Bournemouth East Rarely or never Labour 8.9% South West Other City 4 3 3 1 4 3 4 4 3 1 3 3
York Outer
Rarely or never
Labour 9.0% Yorkshire and The Humber Town 2 2 1 2 4 5 1 3 1 2 3 2
Carmarthen West and South
Pembrokeshire Last won in 2005
9.2% Wales Village or smaller* 1 3 4 5 1 2 2 1 . 5 5 3
Shrewsbury and Atcham Rarely or never Labour 9.5% West Midlands Town 2 3 2 4 2 4 2 2 2 3 4 3
Gloucester Last won in 2005 9.6% South West Town 4 4 4 2 2 2 3 4 3 3 3 4
Carlisle Last won in 2005 9.7% North West Town 2 4 5 5 2 1 3 1 3 3 5 4
Rossendale and Darwen Last won in 2005 9.8% North West Town 3 3 3 4 2 3 2 3 4 2 5 4
Finchley and Golders Green Rarely or never Labour 9.8% London Core City 5 1 1 2 5 5 5 5 2 5 2 1
Monmouth
Rarely or never
Labour 9.9% Wales Town 1 2 1 4 3 4 1 1 . 2 3 2
Macclesfield Rarely or never Labour 9.9% North West Town 1 3 1 2 4 4 1 2 2 4 3 2
Scarborough and Whitby Rarely or never Labour 10.3% Yorkshire and The Humber Town 1 5 4 5 1 2 3 2 4 2 5 5
Croydon South Rarely or never Labour 10.4% London Core City 4 1 1 1 5 5 2 5 2 4 1 2
South Ribble Last won in 2005 10.4% North West Town 2 3 2 2 3 4 1 2 2 5 5 4
Welwyn Hatfield
Rarely or never
Labour 10.5% East Town 5 2 2 1 4 4 5 4 2 1 1 3
Morley and Outwood Formerly loyal Labour 10.8% Yorkshire and The Humber Town 3 4 3 1 2 4 1 3 3 5 4 4
South Thanet Rarely or never Labour 11.0% South East Town 1 3 4 4 3 2 4 3 4 4 2 5
Erewash Last won in 2005 10.9% East Midlands Town 3 4 4 4 1 2 2 2 3 4 3 5
Bournemouth West Rarely or never Labour 11.0% South West Other City 4 3 3 1 3 3 4 3 3 1 3 4
Blackpool North and Cleveleys Last won in 2005 11.1% North West Town 1 4 5 2 3 1 3 2 5 1 5 5
Great Grimsby Formerly loyal Labour 11.1% Yorkshire and The Humber Town 4 5 5 5 2 1 4 2 5 5 5 5
Ceredigion
Rarely or never
Labour 11.1% Wales Village or smaller* 1 2 3 2 1 4 3 2 . 5 5 2
Kingswood Last won in 2005 11.4% South West Core City 3 4 3 2 1 4 1 3 2 4 2 4
Hexham Rarely or never Labour 11.4% North East Village or smaller* 1 2 1 4 3 4 2 1 1 4 5 2

5
FABIAN SOCIETY
Bromley and Chislehurst Rarely or never Labour 12.0% London Core City 4 1 1 1 5 5 3 4 2 3 1 2
Thurrock Last won in 2005 12.1% East Town 5 4 5 2 2 2 4 4 3 1 1 5
Dover Last won in 2005 12.1% South East Town 2 5 4 2 2 2 3 2 3 3 2 5
Middlesbrough South and East
Cleveland Formerly loyal Labour
12.2% North East Other City 2 4 4 5 2 2 3 2 4 4 5 5
Telford Formerly loyal Labour 12.8% West Midlands Town 4 5 5 5 2 1 4 3 5 2 3 5
Basingstoke Rarely or never Labour 13.0% South East Town 4 3 2 2 4 4 4 4 2 1 2 3

1
FABIAN SOCIETY
Annex 2: Scottish target seats
Swing required Remain vote share in EU referendum
SNP vote share in 2019
Kirkcaldy and Cowdenbeath 1.3% 56.7% 35.2%
East Lothian 3.3% 64.6% 36.2%
Glasgow North East 3.8% 59.3% 46.9%
Rutherglen and Hamilton West 4.9% 62.4% 44.2%
Coatbridge, Chryston and Bellshill 5.8% 61.2% 47.0%
Midlothian 5.9% 62.1% 41.5%
Airdrie and Shotts 6.5% 60.2% 45.1%
Glasgow South West 6.6% 59.1% 47.9%
Motherwell and Wishaw 7.1% 62.3% 46.4%
Glasgow East 7.2% 56.2% 47.7%
Glasgow North 7.7% 78.4% 46.9%
Glasgow Central 8.1% 71.2% 49.2%
Na h-Eileanan An Iar 8.4% 56.1% 45.1%
Inverclyde 9.4% 63.8% 48.4%
Glasgow South 9.5% 71.8% 48.1%
Dunfermline and West Fife 10.0% 60.6% 44.4%
Glasgow North West 10.5% 68.5% 49.5%
West Dunbartonshire 10.6% 62.0% 49.6%
Edinburgh North and Leith 10.8% 78.2% 43.7%
Lanark and Hamilton East 10.8% 64.0% 41.9%
Edinburgh East 10.9% 72.4% 48.4%
East Kilbride, Strathaven and Lesmahagow 11.8% 63.1% 46.4%
Paisley and Renfrewshire North 12.0% 64.5% 47.0%
Paisley and Renfrewshire South 12.4% 65.2% 50.2%
Livingston 12.5% 56.7% 46.9%

2
FABIAN SOCIETY
Endnotes
i Harrop, Andrew. 2019. Another Mountain to Climb. Fabian Society. https://fabians.org.uk/another-
mountain-to-climb/ ii Electoral Calculus. 2020. 'Example new seat boundaries for 2023'
https://www.electoralcalculus.co.uk/bdy2023_ec_auto.html iii The party's vote has fallen even more in seats t does not hold outside the 150 iv Stannard, Henry and Evie Robertson. 2021. The Third Scotland Scottish Parliament Election 2021
What Happened, and What Next? Our Scottish Future. https://ourscottishfuture.org/wp-
content/uploads/2021/05/OSF-Morning-After-Poll-final-release-200521.pdf v Details on how the House of Commons categorised these places can be found here:
https://commonslibrary.parliament.uk/research-briefings/cbp-8322 vi ‘Town in conurbation’ refers to constituencies that are ‘attached to’, near to or contiguous with
‘core cities’: https://commonslibrary.parliament.uk/research-briefings/cbp-8322/ vii Ipsos Mori, in Labour Together. 2020. Election Review.
https://docs.labourtogether.uk/Labour%20Together%202019%20Election%20Review.pdf viii McDonnell A and Chris Curtis. 2019. How Britain voted in the 2019 general election. YouGov.
https://yougov.co.uk/topics/politics/articles-reports/2019/12/17/how-britain-voted-2019-
general-election ix Surridge, Paula. 2018. Do universities liberalise students? Why education should be taken seriously in
political analysis. LSE. https://blogs.lse.ac.uk/politicsandpolicy/the-education-effect/ x Sobolewska, Maria and Robert Ford. 2020. Brexitland: Identity, Diversity and the Reshaping of British
Politics. Cambridge University Press. xi Ipsos Mori, in Labour Together. 2020. Election Review. https://www.labourtogether.uk/review
Sobolewska and Ford. 2020
Gethin, Amory Clara Martínez-Toledano and Thomas Piketty. 2021. Brahmin Left versus
Merchant Right: Changing Political Cleavages in 21 Western Democracies, 1948-2020.
https://wid.world/wp-
content/uploads/2021/05/WorldInequalityLab_WP2021_15_PoliticalCleavages_WesternDem
ocracies.pdf
McDonnell A and Chris Curtis. 2019. How Britain voted in the 2019 general election. YouGov.
https://yougov.co.uk/topics/politics/articles-reports/2019/12/17/how-britain-voted-2019-
general-election xii Surridge, Paula. 2021. New Con' defined as Con in 2019 but not in 17 or 15 Some demographics
(pop figs). Twitter. 8 May 2021. https://twitter.com/p_surridge/status/1391023259701891072 xiii Kellner, Peter. 2021. The deep roots of Labour’s red wall decline. The New European.
https://www.theneweuropean.co.uk/brexit-news-peter-kellner-on-the-labour-party-crisis-
7960234/
xv Lloyd, C and James Gleeson. 2018. Housing Tenure Change in England. Centre for Spatial
Demographics and Research, University of Liverpool. https://popchange-
data.liverpool.ac.uk/Briefing3/PopChange3_HousingTenureEngland.pdf

3
FABIAN SOCIETY
xvi Surridge, Paula. 2021. New Con' defined as Con in 2019 but not in 17 or 15 Some demographics
(pop figs). https://twitter.com/p_surridge/status/1391023259701891072
xviii Ballinger, Steve. 2015. New research shows ethnic minority votes increasingly up for grabs.
British Future. https://www.britishfuture.org/ethnic-minority-votes-up-for-grabs/
Jennings, Will and Isla Glaister. 2021. ‘The 'ethnic data gap' on voters - and why it matters to
parties and pollsters’. Sky News. https://news.sky.com/story/the-ethnic-data-gap-on-voters-
and-why-it-matters-to-parties-and-pollsters-12365500 xix Katwala, Sunder. 2019. The Conservatives, ethnic minority voters, and the election. Next to no
progress. Conservative Home. https://www.conservativehome.com/platform/2019/12/sunder-
katwala-the-conservatives-ethnic-minority-voters-and-the-election-next-to-no-progress.html xx Dijkstra Lewis, Hugo Poelman and Andres Rodríguez-Pose. 2018. The geography of EU discontent.
European Union.
https://www.tandfonline.com/doi/abs/10.1080/00343404.2019.1654603?journalCode=cres20 xxi Note that recent economic trajectory is very different to deprivation. This explains why Labour
still performs relatively well in deprived areas in cities, but not in post-industrial towns. xxii Surridge, Paula. 2021. xxiii Cooper, Luke and Christabel Cooper. 2020. Get Brexit Done’: The New Political Divides of
England and Wales at the 2019 Election. The Political Quarterly , 91: 751-761..
https://onlinelibrary.wiley.com/doi/full/10.1111/1467-923X.12918 xxiv The Together Initiative. 2021. Our Chance to Reconnect: Final Report of the Talk Together Project.
British Future. https://together.org.uk/Our-Chance-to-Reconnect.pdf xxv Curtice, John. 2021. ‘Labour's post-Brexit electoral strategy’. Progressive Review. IPPR.
https://onlinelibrary.wiley.com/doi/full/10.1111/newe.12228 xxvi Constituency data: election results. House of Commons Library 2021.
City & Town Classification of Constituencies & Local Authorities. House of Commons
Library 2021.
Constituency data: population by age. House of Commons Library 2021.
Annual population survey. Jan 2020-Dec 2020. Office for National Statistics 2021.
Census 2011. QS611EW - Approximated Social Grade. Office for National Statistics 2013.
Constituency data: housing tenure. House of Commons Library 2021.
Constituency data: ethnicity. House of Commons Library 2020.
Constituency data: Indices of deprivation. House of Commons Library 2020.
Annual population survey. Apr 2009-Dec 2010; Apr 2018-Dec 2019. Office for National
Statistics 2021.
Constituency data: house prices. House of Commons Library 2021.
EU Referendum: constituency results. House of Commons Library 2017.