
Window Film and Energy Project Final
19
ENERGY EFFICIENCY OF V-KOOL 40 WINDOW FILM ABSTRACT At Texas A&M University, a recent push to become greener has engulfed the campus. The most important push is to reduce the amount of energy consumed especially in the older buildings. The following paper will discuss the use of V-KOOL 40 Window Film and the possible savings associated with the installation. With the assistance of University Energy Services along with funding provided by the Aggie Green Fund, this pilot program may be beneficial both economically but for the occupants working in this older buildings Kameron Johnson Geos 405
-
Upload
kameron-johnson -
Category
Documents
-
view
146 -
download
0
Transcript of Window Film and Energy Project Final

ENERGY EFFICIENCY OF
V-KOOL 40 WINDOW
FILM
ABSTRACT At Texas A&M University, a recent push to become
greener has engulfed the campus. The most
important push is to reduce the amount of energy
consumed especially in the older buildings. The
following paper will discuss the use of V-KOOL 40
Window Film and the possible savings associated
with the installation. With the assistance of
University Energy Services along with funding
provided by the Aggie Green Fund, this pilot program
may be beneficial both economically but for the
occupants working in this older buildings
Kameron Johnson Geos 405
ENERGY EFFICIENCY OF
V-KOOL 40 WINDOW
FILM
ABSTRACT At Texas A&M University, a recent push to become
greener has engulfed the campus. The most
important push is to reduce the amount of energy
consumed especially in the older buildings. The
following paper will discuss the use of V-KOOL 40
Window Film and the possible savings associated with
the installation. With the assistance of University
Energy Services along with funding provided by the
Aggie Green Fund, this pilot program may be
beneficial both economically but for the occupants
working in this older buildings
Kameron Johnson Geos 405

Geos 405 Environmental Geoscience Kameron Johnson Dr. Brendan Roark Spring 2015
pg. 1
Introduction
In the Southeast United States, the cost to cool large educational, business, or
residential buildings can be one of the biggest expenses the operators deal with on a day to day
basis. Especially during the summer months, the increase in electricity usage has continually
driven the price higher and higher. The U.S. Energy Information Administration (EIA) states in
their most recent energy forecast, Projected U.S. sales of electricity to the commercial sector
increase by 1.7% this year and by 1.4% in 2016. Projected industrial electricity sales rise by 1.3%
in 2015 and by 1.1% in 2016 (1). With these projections continuing to show increase sells and
higher rates, how can we reduce the amount of energy consumed to still provide a comfortable
environment?
For most office buildings in the United States, about 30% of their operating expenses
are used on utilities with an energy cost exceeding $30,000 per year. According to Managing
Energy Cost in Office Buildings, HVAC systems account for 28 percent of electricity and 86
percent of natural gas consumed by office buildings. During closed hours and on weekends,
turn temperature settings down in heating seasons and up in cooling seasons (2). They also
recommending adjusting the temperature by 0.5-1oF during peak working hours. University
Energy Services at Texas A&M have sensors that control the temperature of the chilled water
and the air circulating throughout the rooms. Overall, lighting, cooling, and ventilation are
responsible for more than 60 percent of electricity use by office buildings, and heating
dominates natural gas consumption (2).
Texas A&M University (TAMU) produces its own electricity at the on campus power
plant under the authority of University Energy Services (UES). The plant chills or heats water

Geos 405 Environmental Geoscience Kameron Johnson Dr. Brendan Roark Spring 2015
pg. 2
then sends it through underground pipes to buildings throughout the campus. In addition UES is
responsible for heating and cooling all the building on campus (see Table 1 for current energy
rates). The Eller Oceanography and Meteorology Building (O&M) receives the pre-treated water
and re-condition the water to the specified temperature. It then uses the chilled water to cool
auxiliary air and condition all fifteen floors of the building. UES installed monitoring equipment
on the O&M HVAC system in order to measure the difference in water/air flow temperature
allowing for any change to be noted.
The O&M’s design encompasses floor to ceiling windows on the twelfth floor and
concrete and windows from the second to eleventh. When the building was built in 1973,
energy conservation wasn’t a priority in either building practices or codes. As a result all the
windows are single pane non-tinted windows have emergency efficiency rate of 1.0 U-factor
rating due to glass being a very poor insulator. U-factor is the inverse of another widely used
measure, R-value. With R-values, a higher number is better (4). The College of Geosciences at
TAMU is interested in finding out the building envelope of floor-ceiling windows in the O&M
and Halbouty Building. The article “Improving Glass Walls Thermal Resistance in Air-
TAMU UES Commodity 2015 Unit Rates
Electricity $ 0.087 / kWH
Chilled Water $ 15.264 / mmBtu
Heating Hot Water $ 14.971 /mmBtu
Steam $ 15.166 /mlbs
Domestic Cold Water $ 1.888 /mgal
Domestic Hot Water $ 12.795 /mgal
Waste Water Treatment $ 3.133 /mgal
Storm Drainage $ 4.432 / msqft/month
Solide Waste & Recycling $ 128.847 / ton
Table 1: Texas A&M Utility and
Energy Services 2015 Rates. (3)
[Cite your source here.]

Geos 405 Environmental Geoscience Kameron Johnson Dr. Brendan Roark Spring 2015
pg. 3
Conditioned Buildings” the definition of the building envelope is given as the area consisting of
the surfaces that separate the inside from the buildings outside (5).
The project was introduced by Maureen Reap a facilities coordinator for the College of
Geosciences in an attempt to reduce the energy cost for the building. An initial V-Kool
transparent window film was installed on the second floor of the Halbouty building facing the
southwest in order to collect data for the decision to expand the project. The initial results that
were measured using temperature data loggers along with radiation readings convinced Mrs.
Reap to acquire additional funding. With the assistance of the University Energy Services (UEV),
after collecting data over a 10 day period, “the film reduced the at-the-pane temperatures by 6
to 8 degrees” (Maureen pg. 2). The results showed that the films are effective in reflecting both
UV and IR radiation. In fact, Evan Library installed window films about 10 years ago to protect
their books from degradation. With these positive results, a larger database needs to be
collected over a larger sample size.
What we are proposing, is to install V-Kool 40 UV Window Film to 116 windows to see if
the data reveals any potential energy savings. The V-Kool 40 Window Film is completely
transparent and uses gold and silver atoms sprayed on the surface of the film. The atoms act
like a prism reflecting a projected 90% IR and 99% UV radiation. In order to test the efficiency of
the film, radiation data logging will take place before and after the film is installed on the 2nd-
12th Floor of the O&M building. I will continue monitoring and collected radiation and
temperature data throughout this summer. In order to confirm or deny the results calculated
by UES, our determined baseline temperature and air flow movement (in terms of cubic feet

Geos 405 Environmental Geoscience Kameron Johnson Dr. Brendan Roark Spring 2015
pg. 4
per minute (CFM) data will be used by future Geos 4005 students who will continue collecting a
full year’s worth of data.
The funding for this project is being provided by the Aggie Green Fund with an amount
estimated budget of $30,000. The project was originally proposed by Maureen Reap, Facilities
Coordinator for the College of Geosciences, who has been the driving force in acquiring funding
for this project. The College of Geosciences Energy Steward Amy Chen and UES who are
providing a tremendous amount of data and labor hours to help get this process in motion. The
difference between the two operating efficiencies can be translated into energy and cost
savings. Due to the high energy use of the equipment, even small increases in efficiency will
result in large savings.
Methods
In order to test the efficiency of the V-Kool 40 window film, we installed 2 Hobo Solar
Radiance Sensors on the 2nd floor skywalk in the Halbouty Geoscience building. One sensor is
installed on a window with the V-KOOL 40 installed and the other on a window with no film.
The sensors measure the amount of UV coming through the windows every 10 minutes. The
data is then sent to the Hobo Micro Station Data Logger-H21-002 and downloaded to a laptop
every couple of days. Hoboware Graphing and Analysis Software was used to process and
analyze the data. Measured data was also compared to daily solar radiation readings,
temperature, and cloud cover data from the KCLL weather station at Easterwood Airport to
quantify the environmental factors including incoming radiation on the windows. The data we
collect from the 2nd floor skywalk in Halbouty will be the base values for the UV and

Geos 405 Environmental Geoscience Kameron Johnson Dr. Brendan Roark Spring 2015
pg. 5
temperature. The purpose of this data is to measure the actual amount of solar radiation being
reflected by the V-KOOL 40 in order to compare to the manufacturers quoted radiation
reduction.
Once the Halbouty portion of the measurements were completed the 2 Hobo
Solar Radiance Sensors were deployed to the multiple rooms on the 2nd and 12th floors in the
O&M. 4 Hobo Pendant Temperature/Light Data Logger were deployed to measure temperature
and light intensity. The rooms of interest in the O&M are; 202JB, 202G, 1210E, 1210F, 1210G,
and 1210L, however we only had time to measure the office of Dr. Thomas: 1204 B&C and Dr.
Dessler: 1210B. Dr. Thomas’s office is located on the southwest side of the building will Dr.
Dessler’s is facing northeast. Both offices have thermostats located inside where the sensors
are located, however, the area controlled by the thermostat consists of several other rooms.
Therefore other UV sensors will be placed on the windows of the adjacent rooms along with
temperature measurements to test the difference between the rooms. We will then compare
this data with the daily high temperature and UV values from the Easterwood Airport weather
station.
After we collect data values for the rooms of interest, we will use the Radiance Equation
“1/R=QA/ΔT” to calculate the total amount of UV reflected by the UV film. The R represents the
value of insulation, QA is the heat transfer per unit of time, and ΔT is the difference in auxiliary
temp to room temperature. The values we calculate using the equation will then be compared
to values UES calculated using V-Kool’s projected radiation reflection perimeters. If results we
calculate are similar to UES, they will provide extra funding to outfit the entire building with the

Geos 405 Environmental Geoscience Kameron Johnson Dr. Brendan Roark Spring 2015
pg. 6
V-Kool 40 UV Window Film. Allowing for future Geos 405 students to continue this energy
conservation project by collecting UV and temperature data for an entire year.
The next step will be to calculate the average daily temperature and radiation values.
When making their prediction, UES uses the month of July’s monthly averages to determine the
building envelope of the O&M. However, from looking at max UV potential, the month of June
is the key month we should be looking at since the sun will reach its solar maximum angle of
23.43o on June 21. July is generally warmer temperature wise but the solar zenith angle will
have already started decreasing after the summer solstice.
To find the potential energy savings in terms of BTUs, we will have to look at the HVAC
system used to cool the individual rooms in the O&M. Thanks to UES, auxiliary temperature
sensors have already been installed on the 12th floor along with air flow sensors (Cubic Feet per
Minute “CFM”). These two factors will be the keys in calculating the potential reduction in BTUs
and air flow amount to provide a comfortable building environment. As mentioned earlier, the
current energy cost is $3.00 to cool the building with a projected reduction of $0.60 a square
foot per day once the film is installed throughout the building. UES projects the grand potential
energy savings of $58,000 which comes out to $5,000 in yearly savings. Another question we
will be looking at is the effectiveness of individual thermostats located throughout the offices
that to keep a desired temperature for the individual rooms.
The main focus on the project will be the efficiency of the films on air flow and energy
consumption reduction for the O&M building. Before we start any data collecting, we will send
a pre survey out to professors that are allowing us to install the radiation film in their offices.
Geos 405 Environmental Geoscience Kameron Johnson Dr. Brendan Roark Spring 2015
pg. 7
Basic questions asked pertained to overall room comfort satisfaction, use of blinds, and if a
fan/space heater is used to achieve a desired room temperature. The results of the survey will
be collected before any testing and will be beneficial in determining comfort levels prior to
installation and if we are on the right track with our hypothesis.
Results and Discussion
The pre-experiment survey was sent out to the professors participating in this
experiment asking several questions pertaining to the rooms comfort level. 75% of the received
responses rank room comfort satisfaction at 3 out of 10, however all the responses have been
received by those who don’t have thermostats located in their rooms. Midday and afternoon
seem to be the times the occupants are in their offices including always being in during the
summer months. Once the offices are outfitted with the film, the survey will be sent out to the
occupants again to identify any changes from their original responses.
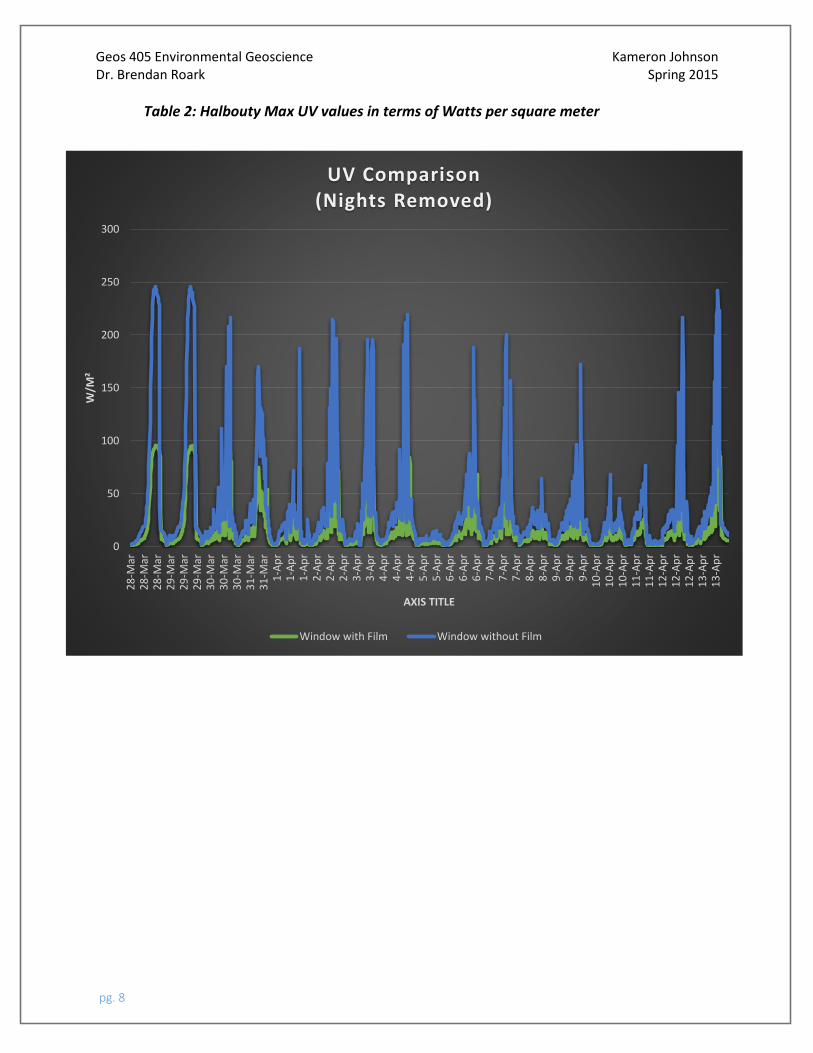
The Hobo UV Sensors installed in Halbouty Geosciences Building on the filmed and non-
filmed windows on the 2nd floor skywalk started collecting data the last few days of March.
However, data analysis was started on April 1st in order to calculate with a month’s worth of
solar radiation data. The sensors collected the incoming solar radiation from the un-filmed
window sensor and the window outfitted with the V-Kool 40 window film for two 18 days of
data, while we recorded daily UV Index forecasts from Easterwood Airport in College Station.
Upon removing the radiation sensors, 2 Hobo Pendant Temperature/ Light sensors were placed
to begin collecting temperature readings. Table 2 below shows the maximum recorded UV
values for the un-filmed and filmed windows and the percent difference between two.
Geos 405 Environmental Geoscience Kameron Johnson Dr. Brendan Roark Spring 2015
pg. 8
Table 2: Halbouty Max UV values in terms of Watts per square meter
0
50
100
150
200
250
300
28
-Mar
28
-Mar
28
-Mar
29
-Mar
29
-Mar
29
-Mar
30
-Mar
30
-Mar
30
-Mar
31
-Mar
31
-Mar
1-A
pr
1-A
pr
1-A
pr
2-A
pr
2-A
pr
2-A
pr
3-A
pr
3-A
pr
4-A
pr
4-A
pr
4-A
pr
5-A
pr
5-A
pr
6-A
pr
6-A
pr
6-A
pr
7-A
pr
7-A
pr
7-A
pr
8-A
pr
8-A
pr
9-A
pr
9-A
pr
9-A
pr
10
-Ap
r1
0-A
pr
10
-Ap
r1
1-A
pr
11
-Ap
r1
2-A
pr
12
-Ap
r1
2-A
pr
13
-Ap
r1
3-A
pr
W/M
²
AXIS TITLE
UV Comparison(Nights Removed)
Window with Film Window without Film

Geos 405 Environmental Geoscience Kameron Johnson Dr. Brendan Roark Spring 2015
pg. 9
Table 3: The 18 days of Radiation Data 2nd Floor Skywalk Halbouty Geoscience Building (Percentage Difference: V-KOOL 40 Filmed Window vs Un-Filmed Window)
April 5 saw the smallest amount of radiation reach the windows with the non-filmed
window receiving 16 W/m2. This can be explained by the weather as it was storming the entire
day blocking almost 95% of the incoming solar radiation. The maximum values we calculated
have several factors that could have affected the amount of light reaching the sensors. The
maximum observed incoming solar radiation, 246 W/m2 occurred on March 29 thanks to clear
skies. The filmed windows allowed only 7 W/m2 on April 5 while the highest values were
observed on March 27-28 at 96 W/m2. Variables such as cloud cover and sky view obstruction
Date Unfilmed Max W/m² V-Kool Max W/m² Difference (Unfilmed vs V-Kool)
27-Mar-15 242 96 60%
28-Mar-15 243 96 61%
29-Mar-15 246 94 62%
30-Mar-15 217 89 59%
31-Mar-15 137 56 59%
1-Apr-15 187 77 59%
2-Apr-15 214 84 61%
3-Apr-15 196 79 59%
4-Apr-15 219 91 59%
5-Apr-15 16 7 56%
6-Apr-15 188 77 59%
7-Apr-15 201 86 57%
8-Apr-15 64 28 56%
9-Apr-15 172 72 58%
10-Apr-15 68 32 53%
11-Apr-15 77 37 52%
12-Apr-15 217 87 60%
13-Apr-15 217 88 59%
14-Apr-15 242 96 60%
Average Max UV 177 72 58%

Geos 405 Environmental Geoscience Kameron Johnson Dr. Brendan Roark Spring 2015
pg. 10
from nearby buildings. From the maximum values we collected off the data logger, we
compared the values to those recorded from the airport (Table 4).
Table 4: Easterwood Airport Max UV Index Values compared to the Max UV Values collected from the Hobo UV Sensors. It also shows the percentage of radiation reflected by the filmed & non-filmed window.
Cloud
Conditions
Max Radiation
(W/m²) Un-Filmed
%
Reflected V-Kool
%
Reflected
Overcast 200 187 7% 77 62%
Mostly Cloudy 100 214 -114% 84 16%
Partly Cloudy 75 196 -161% 79 -6%
Overcast 225 219 2% 91 60%
Overcast 127.5 16 88% 7 95%
Partly Cloudy 185 188 -2% 77 58%
Partly Cloudy 225 201 11% 86 62%
Overcast 175 64 63% 28 84%
Mostly Cloudy 150 172 -15% 72 52%
Overcast 125 68 46% 32 74%
Overcast 100 77 23% 37 63%
Mostly Cloudy 225 217 4% 87 61%
Clear 225 217 4% 88 61%
Partly Cloudy 250 242 3% 96 62%
Avg Max UV 171 163 -3% 67 57%
The amount of UV reflected or absorbed by the V-Kool window film has average to
reduce over half the amount of radiation passing into the building thru the normal window. The
performance of the V-Kool UV Window Film is positive blocking over half the available UV
throughout the day. The average amount of UV reflected at the window was just over 61
percent, including a 57 percent reduction during the peak radiation period. The average
amount of radiation blocked by the film is consistent with a previous study on UV Films in 2005.
Humayer Chowdhury at el…(2007) used the same V-Kool window film also calculating a 60%
refection rate, outperforming all other manufacturers.

Geos 405 Environmental Geoscience Kameron Johnson Dr. Brendan Roark Spring 2015
pg. 11
Table 5: Halbouty 2nd Floor Skywalk Radiation Difference (Non-Filmed vs Filmed) 3PM-7PM for March 28-April 14.
The un-filmed window shows how inefficient the building standards were place at the
time of construction. The results are still positive for the overall objective of this research
project since it shows the inability of the current windows are at reducing solar radiation
inflow. It shows a great possibility of being one of the factors contributing to warmer office
temperatures and higher energy consumption. Table 6 shows the temperature measurements
at peak times (2-6PM).
0
50
100
150
200
250
3/2
8/2
01
5
3/2
9/2
01
5
3/3
0/2
01
5
3/3
1/2
01
5
4/1
/20
15
4/2
/20
15
4/3
/20
15
4/4
/20
15
4/5
/20
15
4/6
/20
15
4/7
/20
15
4/8
/20
15
4/9
/20
15
4/1
0/2
01
5
4/1
1/2
01
5
4/1
2/2
01
5
4/1
3/2
01
5
W/m
²
Date
Halbouty 2nd Floor Skywalk(3PM-7PM)
Unfilmed Window
Filmed WIndow

Geos 405 Environmental Geoscience Kameron Johnson Dr. Brendan Roark Spring 2015
pg. 12
Table 6: Four day temperature comparison between no-filmed vs filmed window during
Peak Radiation Load (2-6PM)
Currently the energy rates are “$3.00 per square feet (sqft/day) to cool the O&M
building with a cost projection of $2.40 (sqft/day) after the film is installed” (UES). The amount
of energy used to condition the O&M environment is 13.6 BTUs w/o the window film installed.
(UES) The UES also projects a $58,000 consumption savings if the entire building was outfitted
with the UV film in turn paying for the project in 5 years. In order to confirm or deny the results
calculated by UES, we will determine a baseline temperature and air flow movement (in terms
of cubic feet per minute (CFM). If the results look promising, future Geos 4005 students will
continue collecting a full year’s worth of data.
0
10
20
30
40
50
De
gre
es
C
Temperature
No Film
Film

Geos 405 Environmental Geoscience Kameron Johnson Dr. Brendan Roark Spring 2015
pg. 13
With the data we obtained from our experiments, we ran an ANOVA test comparing the
amount of radiation reflected during the 2-6PM peak times. We obtained a P value w answers
the question: If all the populations really have the same mean (the treatments are ineffective),
what is the chance that random sampling would result in means as far apart (or more so) as
observed in this experiment? (6) Our calculated p-value= 1.55*10-7 which is reassuring since
the smaller a p-value number is the more likelihood our original hypothesis will be proven
correct.
Table 7: Solar insulation amount measured at the windows during peak 2-6PM
(Radiation is in W/m2)
The next step in our research is to begin collecting and analyzing data for the 12th Floor
of the O&M. The current location we are measuring the office of Dr. Thomas (1204 B&C) and
Dr. Dessler (1210B). Both offices have thermostats located inside where the sensors are
located, however, the area controlled by the thermostat consists of several other rooms.
Therefore other radiation sensors will be placed on the windows of the adjacent rooms along
Geos 405 Environmental Geoscience Kameron Johnson Dr. Brendan Roark Spring 2015
pg. 14
with temperature measurements to test the difference between the rooms. During the
summer, we will continue to measure solar radiation, temperature, and light intensity for the
12th floor of the O&M. The goal is to get a baseline data set before the window film is installed
and begin recording data after installation. Once we have the sufficient amount of data, can we
determine the baseline temperature range from which future Geos 405 research teams will use
to calculate a more accurate reduction in energy consumption and overall costs savings.
Conclusion
The amount of solar radiation being able to enter the building through the original and
still installed windows, the V-Kool 40 Window Film is effective in reducing over half the amount
than the window alone. The results from the pre-survey show the current professors believe
their rooms are too hot/too cold and use their blinds to reduce the amount of light directly
entering the room. Our calculations are similar to those that Utility and Energy Services with
the project paying itself off between 4-5 years. Figure 1 below shows the 12th floor rooms and
orientation and figure 2 showing the air flow (CFM) along with thermostat locations.
Policy Implications
This project is full of policy implications that could be highly beneficial not only Texas
A&M but for potential residential use throughout the nation. In Bryan/College Station, new city
ordinances have been past Section 402.15 Single pane windows shall not be allowed in the
building envelope along with Insulation And Fenestration Requirements By Component defined
by deleting the 0.30 solar heat gain coefficient in the Glazed Fenestration SHGC column for
Climate Zone 2 and requiring a solar heat gain of 0.35 (6). If the project is successful in showing
Geos 405 Environmental Geoscience Kameron Johnson Dr. Brendan Roark Spring 2015
pg. 15
a reduction in energy consumption (BTUs) and air movement (CFMS), other buildings could be
outfitted with the V-KOOL 40 window film providing more savings throughout the older
buildings on the campus of Texas A&M University.

Geos 405 Environmental Geoscience Kameron Johnson Dr. Brendan Roark Spring 2015
pg. 16
Figures
1) O&M Building 12th Floor Map Layout, Provided by UES:
2) Air Flow Chart 12th Floor of the O&M Building, Provided by UES:

Geos 405 Environmental Geoscience Kameron Johnson Dr. Brendan Roark Spring 2015
pg. 17
Faculty and Staff who have gone above and beyond in assisting with this project:
1) Texas A&M University Energy Services (UES)
2) Maureen Reap, College of Geosciences Facilities Coordinator: Texas A&M University
3) Amy Chen, O&M Energy Steward: Texas A&M University
4) Dr. Brendan Roark, Department of Geosciences: Texas A&M University
5) Aggie Green Fund

Geos 405 Environmental Geoscience Kameron Johnson Dr. Brendan Roark Spring 2015
pg. 18
References
1) U.S. Energy Information Administration: Short-Term Energy and Summer Fuels Outlook
(STEO) April 2015.
2) Simpkins, Dulcey. "Managing Energy Cost In Office Buildings." Managing Energy Costs in
Office Buildings (n.d.): n. pag. E Source Customer Direct, 2010. Web. 11 May 2015
3) "Cost and Fees for Utility Services FY2015." Utilities Energy Services. Texas A&M
University, n.d. Web. 12 May 2015
4) Kozlowski, Dave. "Improved Window Technology Can Handle Many Energy Challenges."
Facilitiesnet. Building Operating Management, Oct. 2006. Web. 11 May 2015.
5) Kaluib, A.M. “Improving Glass Walls Thermal Resistance in Air-Conditioned Buildings.”
Tenth International Conference for Enhanced Building Operations, Kuwait. 26 October
2012
6) Hampton, K “Bryan Building Code Policy”, The City of Bryan 24 May 2011
7) V-KOOL. “KOOL & CLEAR.” V-KOOL The Cool and Clear Window Solution. Accessed
(March 1, 2015)
8) Reap, E. Maureen, “Geosciences Window Film”, Facilities Coordinator College of
Geosciences, Texas A&M October 2014
9) Ashrae Standard, “Energy Standards for Buildings Except Low-Rise Residential
Buildings”, SI edition.