Parametric Study of Drivetrain Dynamics of a Wind Turbine ...
NREL is a national laboratory of the U.S. Department of Energy, Office of Energy Efficiency and Renewable Energy, operated by the Alliance for Sustainable Energy, LLC.
Wind Turbine Drivetrain Condition Monitoring An Overview
Shuangwen (Shawn) Sheng,
NREL
Wenxian Yang, University of Newcastle
ASME Turbo Expo 2013
June 5, 2013
San Antonio, TX
NREL/PR-5000-58774 Photo by Dennis Schroeder, NREL 19018
NATIONAL RENEWABLE ENERGY LABORATORY
Agenda
Introduction Drivetrain Condition Monitoring
(CM) Case Studies and Discussions Concluding Remarks
2
U.S
. Dep
artm
ent o
f Ene
rgy
1.5
-MW
win
d tu
rbin
e, P
hoto
by
Lee
Jay
Fing
ersh
, NRE
L 17
245
NATIONAL RENEWABLE ENERGY LABORATORY
Introduction
3
Global Wind Energy
Wind Turbine Gearbox Reliability Challenge
Gearbox Reliability Collaborative
Benefits of Condition Monitoring
Operation and Maintenance of Wind Plants
NATIONAL RENEWABLE ENERGY LABORATORY
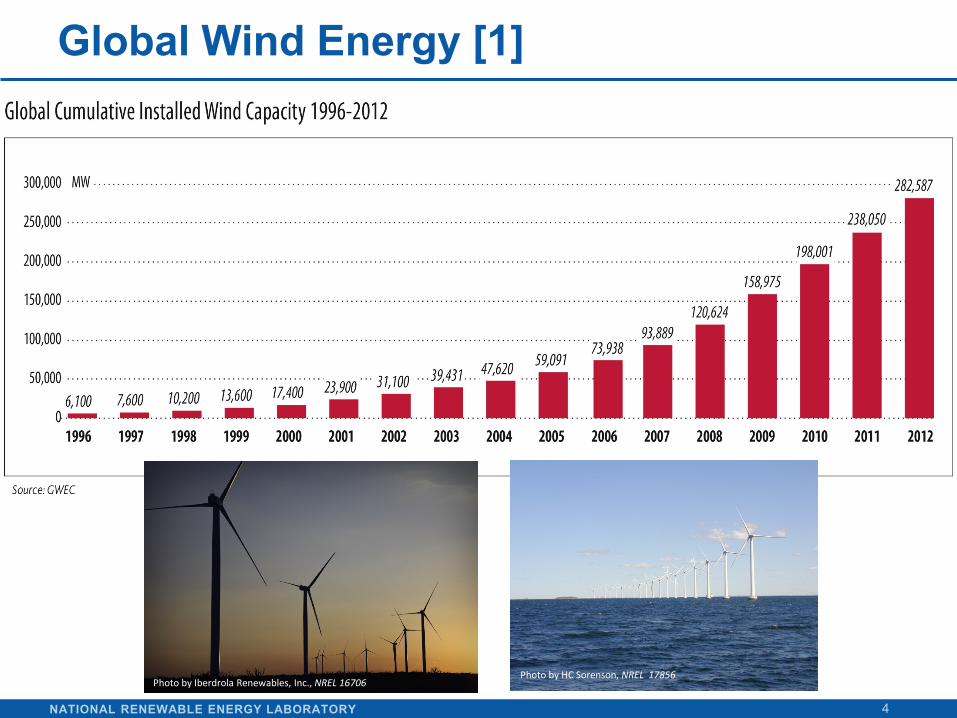
Global Wind Energy [1]
4
Photo by HC Sorenson, NREL 17856 Photo by Iberdrola Renewables, Inc., NREL 16706
NATIONAL RENEWABLE ENERGY LABORATORY
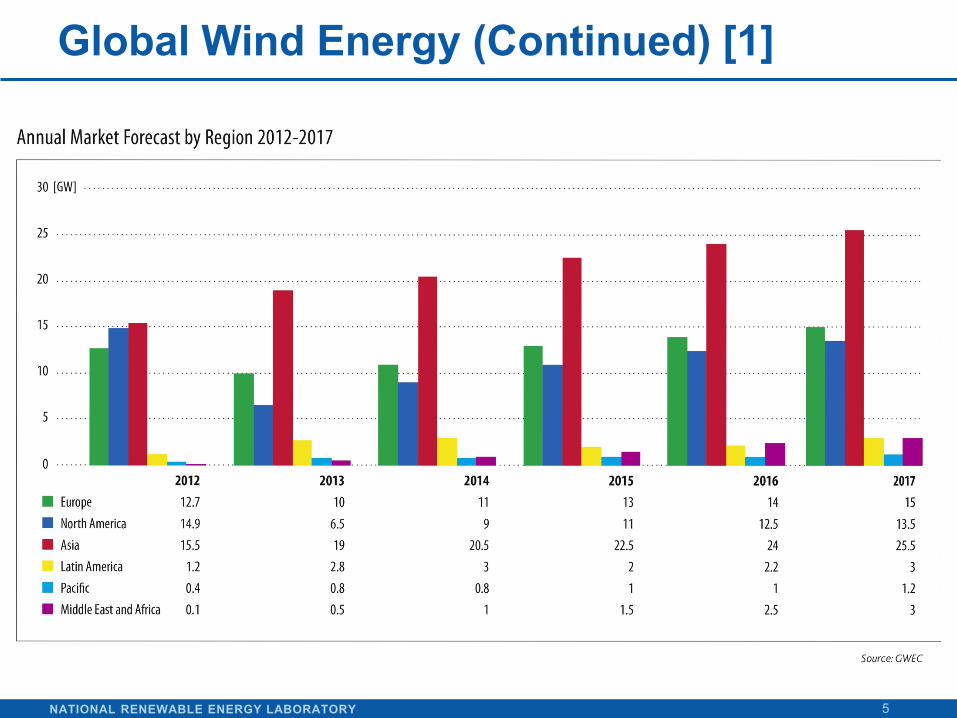
Global Wind Energy (Continued) [1]
5

NATIONAL RENEWABLE ENERGY LABORATORY
Reliability and Downtime of Turbine Subassemblies [2,3]
6
Drive Train
Generator
Gearbox
Rotor Blades
Mechanical Brake
Rotor Hub
Yaw System
Hydraulic System
Other
Electrical Control
Electrical System LWK Failure Rate, approx 5800 Turbine Years
WMEP Failure Rate, approx 15400 Turbine Years
LWK Downtime, approx 5800 Turbine Years
WMEP Downtime, approx 15400 Turbine Years
1 0.75 0.5 0.25 0 2 4 6 8 10 12 14
Failure/turbine/year Downtime per failure (days)
Failure/turbine/year and downtime from two large surveys of land-based European wind turbines over 13 years
• WMEP: the Wissenschaftliches Mess- und Evaluierungsprogramm (WMEP) database was accomplished from 1989 to 2006 and contains failure statistics from 1,500 wind turbines.
• LWK: failure statistics published by Landwirtschaftskammer Schleswig-Holstein (LWK) from 1993 to 2006. It contains failure data from more than 650 wind turbines.
NATIONAL RENEWABLE ENERGY LABORATORY
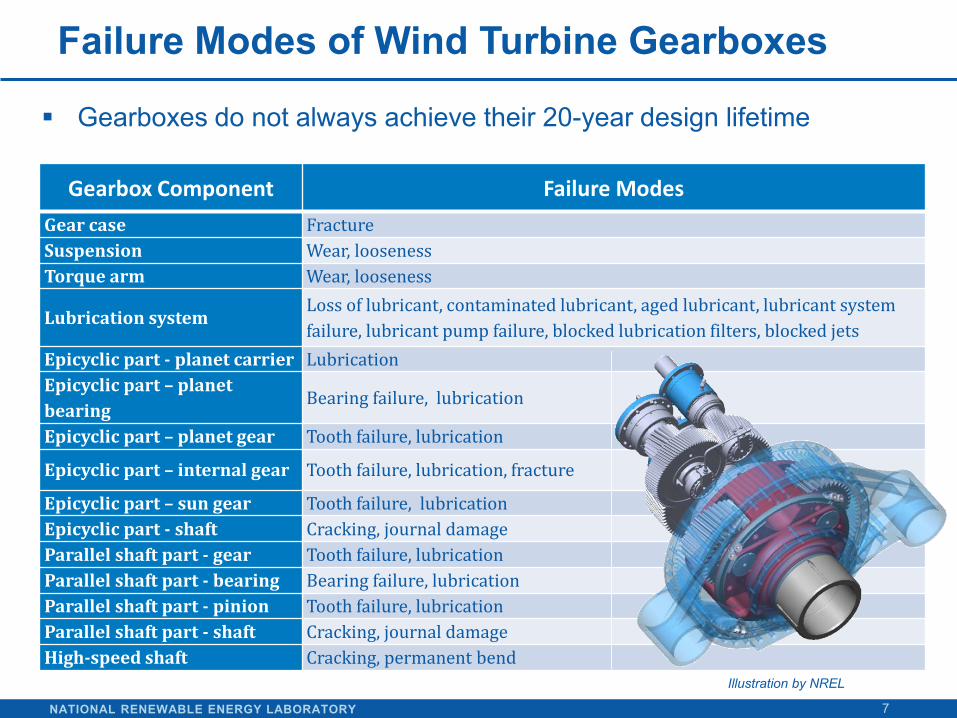
Failure Modes of Wind Turbine Gearboxes
7
Gearbox Component Failure Modes Gear case Fracture Suspension Wear, looseness Torque arm Wear, looseness
Lubrication system Loss of lubricant, contaminated lubricant, aged lubricant, lubricant system failure, lubricant pump failure, blocked lubrication filters, blocked jets
Epicyclic part - planet carrier Lubrication Epicyclic part – planet bearing
Bearing failure, lubrication
Epicyclic part – planet gear Tooth failure, lubrication
Epicyclic part – internal gear Tooth failure, lubrication, fracture
Epicyclic part – sun gear Tooth failure, lubrication Epicyclic part - shaft Cracking, journal damage Parallel shaft part - gear Tooth failure, lubrication Parallel shaft part - bearing Bearing failure, lubrication Parallel shaft part - pinion Tooth failure, lubrication Parallel shaft part - shaft Cracking, journal damage High-speed shaft Cracking, permanent bend
Gearboxes do not always achieve their 20-year design lifetime
Illustration by NREL
NATIONAL RENEWABLE ENERGY LABORATORY
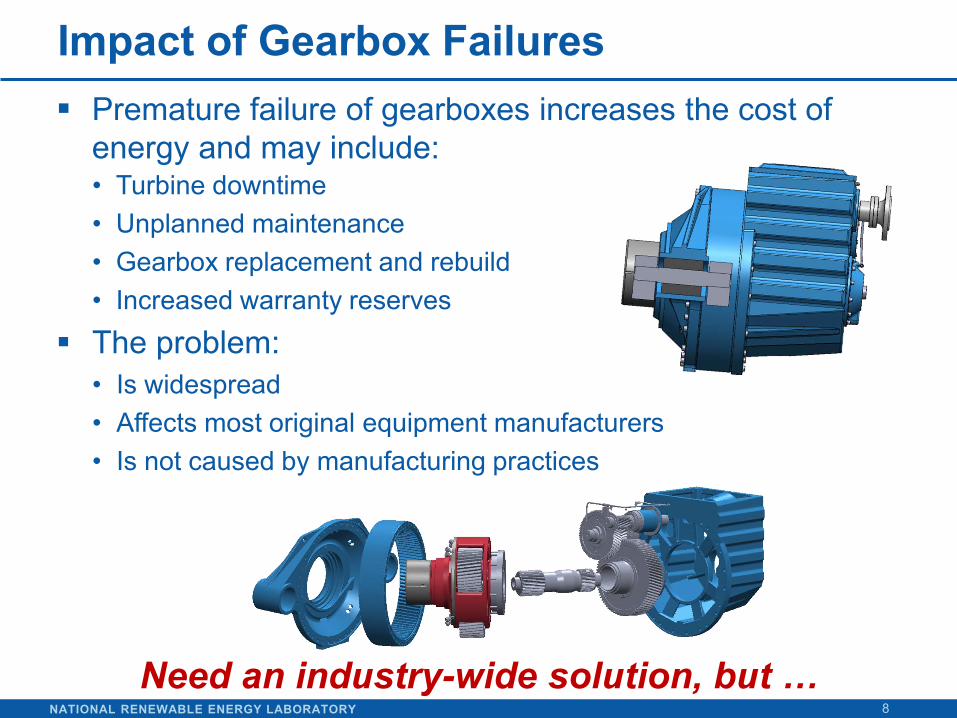
Impact of Gearbox Failures
8
Premature failure of gearboxes increases the cost of energy and may include: • Turbine downtime • Unplanned maintenance • Gearbox replacement and rebuild • Increased warranty reserves
The problem: • Is widespread • Affects most original equipment manufacturers • Is not caused by manufacturing practices
Need an industry-wide solution, but …
NATIONAL RENEWABLE ENERGY LABORATORY
Gearbox Reliability Collaborative (GRC)
9
Facilitate dialog among all parties • Designers and consultants • Suppliers and rebuilders • Operation and maintenance organizations
Understand gearbox response to specific loading • Pure torque, bending, and thrust (dynamometer) • Turbulence (field)
Understand the physics of premature wind turbine gearbox failure
Identify gaps in the design process
Suggest improvements in design practices and analytical tools
NATIONAL RENEWABLE ENERGY LABORATORY
Gearbox Reliability Collaborative (Continued)
10
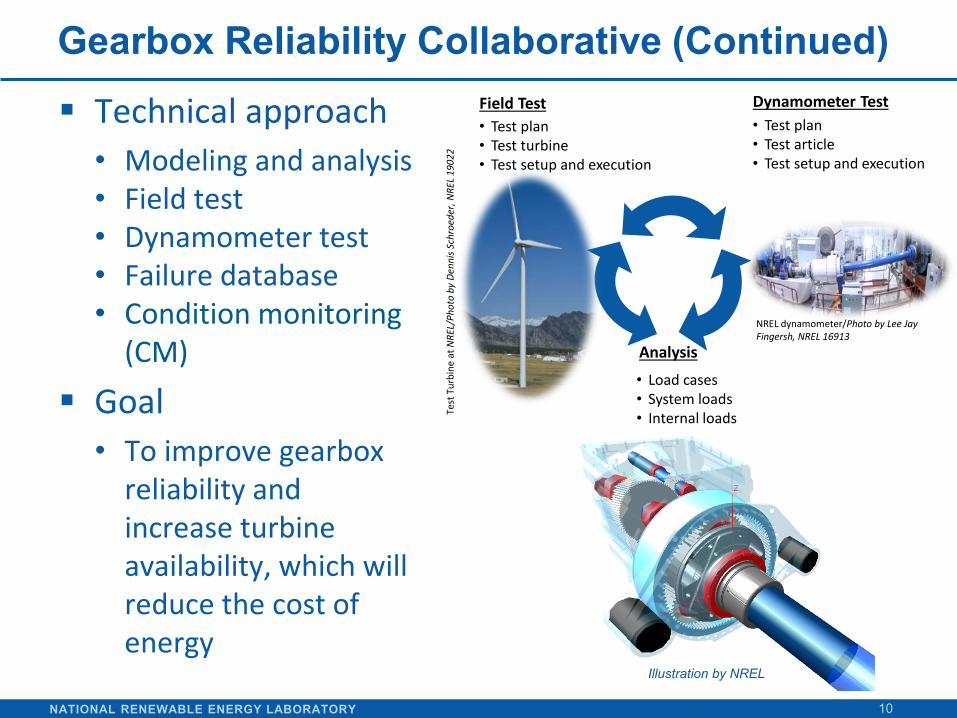
Technical approach • Modeling and analysis • Field test • Dynamometer test • Failure database • Condition monitoring
(CM)
Goal • To improve gearbox
reliability and increase turbine availability, which will reduce the cost of energy
Field Test Dynamometer Test • Test plan • Test article • Test setup and execution
• Test plan • Test turbine • Test setup and execution
Analysis • Load cases • System loads • Internal loads Te
st T
urbi
ne a
t NRE
L/Ph
oto
by D
enni
s Sch
roed
er, N
REL 1
9022
NREL dynamometer/Photo by Lee Jay Fingersh, NREL 16913
Illustration by NREL
NATIONAL RENEWABLE ENERGY LABORATORY
Benefits of Condition Monitoring
11
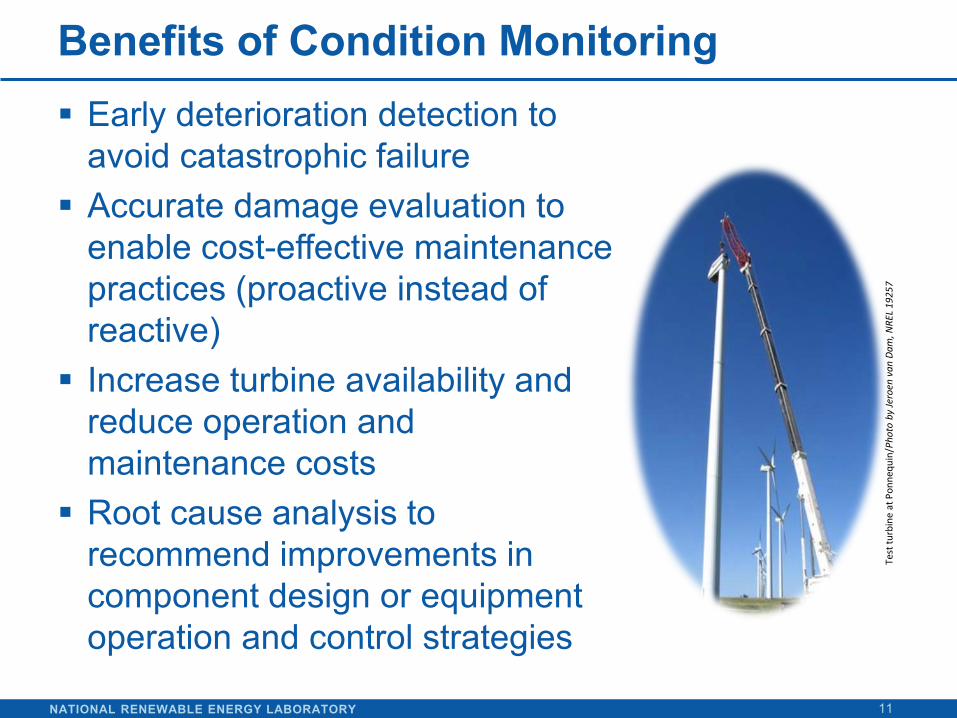
Early deterioration detection to avoid catastrophic failure Accurate damage evaluation to
enable cost-effective maintenance practices (proactive instead of reactive) Increase turbine availability and
reduce operation and maintenance costs Root cause analysis to
recommend improvements in component design or equipment operation and control strategies
Test
turb
ine
at P
onne
quin
/Pho
to b
y Je
roen
van
Dam
, NRE
L 192
57
NATIONAL RENEWABLE ENERGY LABORATORY
Operation and Maintenance of Wind Plants
12
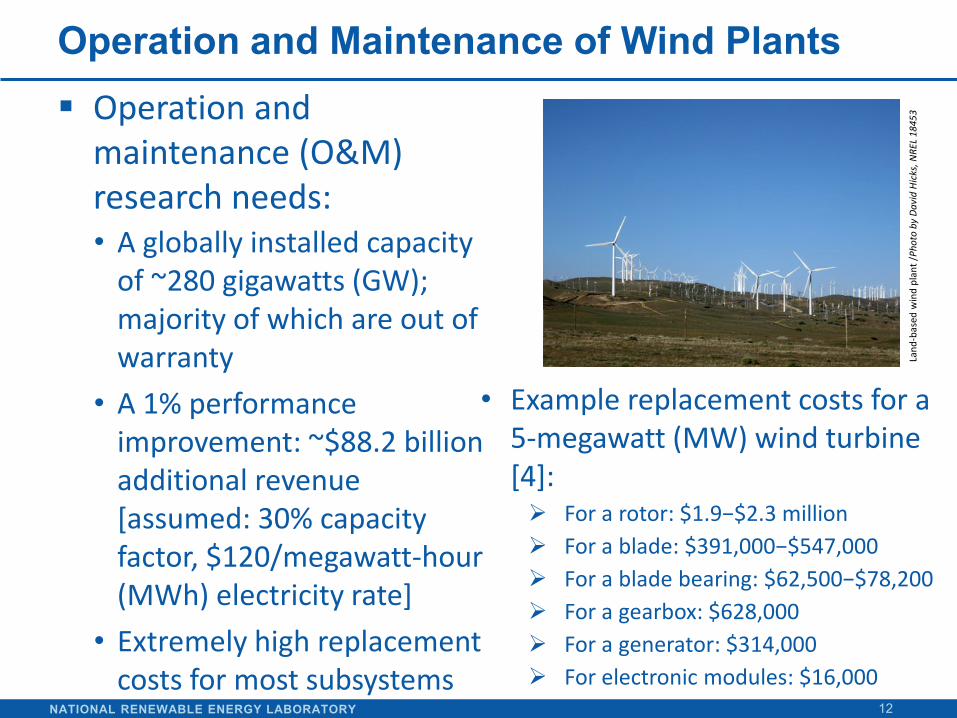
Operation and maintenance (O&M) research needs: • A globally installed capacity
of ~280 gigawatts (GW); majority of which are out of warranty
• A 1% performance improvement: ~$88.2 billion additional revenue [assumed: 30% capacity factor, $120/megawatt-hour (MWh) electricity rate]
• Extremely high replacement costs for most subsystems
• Example replacement costs for a 5-megawatt (MW) wind turbine [4]: For a rotor: $1.9−$2.3 million For a blade: $391,000−$547,000 For a blade bearing: $62,500−$78,200 For a gearbox: $628,000 For a generator: $314,000 For electronic modules: $16,000
Land
-bas
ed w
ind
plan
t /Ph
oto
by D
avid
Hic
ks, N
REL 1
8453
NATIONAL RENEWABLE ENERGY LABORATORY
O&M of Wind Plants (Continued)
13
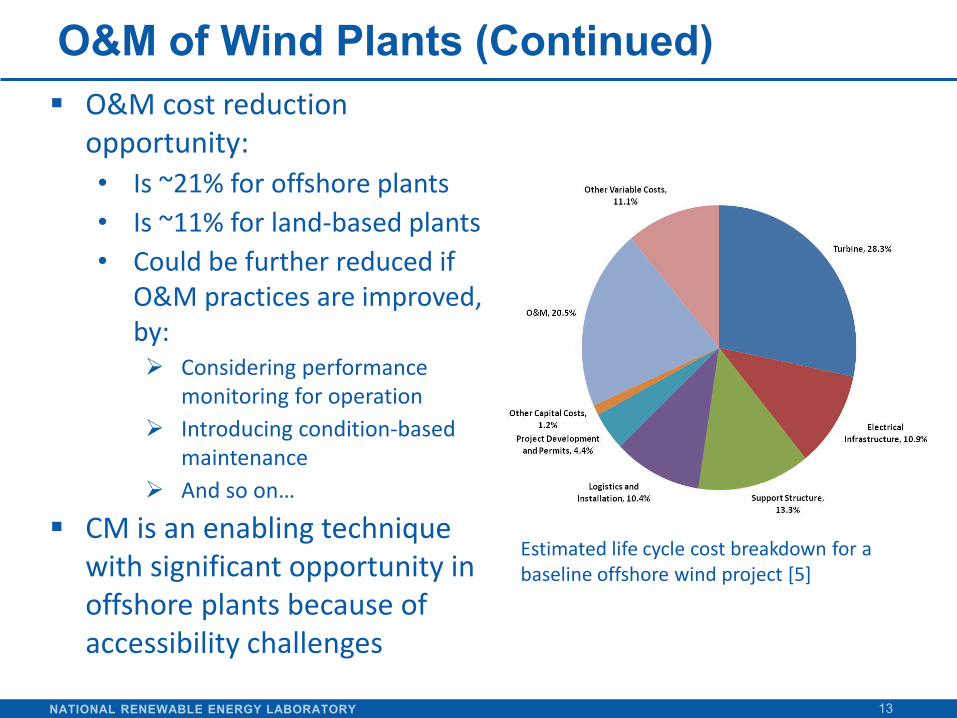
O&M cost reduction opportunity: • Is ~21% for offshore plants • Is ~11% for land-based plants • Could be further reduced if
O&M practices are improved, by: Considering performance
monitoring for operation Introducing condition-based
maintenance And so on…
CM is an enabling technique with significant opportunity in offshore plants because of accessibility challenges
Estimated life cycle cost breakdown for a baseline offshore wind project [5]
NATIONAL RENEWABLE ENERGY LABORATORY
Drivetrain Condition Monitoring
14
Downtime caused by turbine subsystems
Typical drivetrain CM practices
Wind farm/Photo by Iberdrola Renewables, Inc., NREL 16707
NATIONAL RENEWABLE ENERGY LABORATORY
Downtime Caused by Subsystems
15
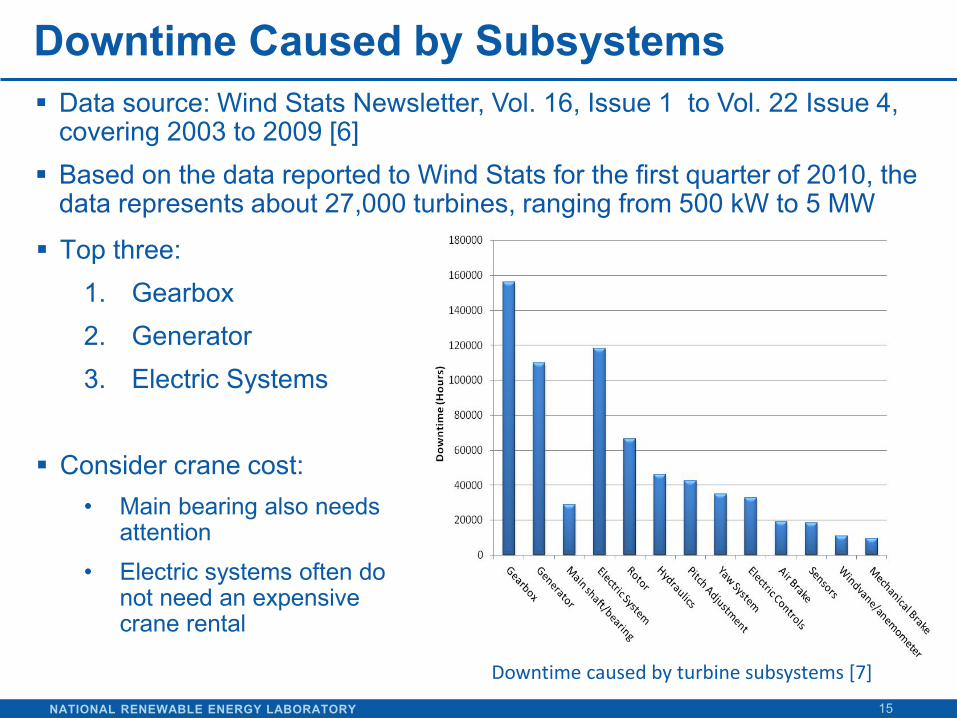
Data source: Wind Stats Newsletter, Vol. 16, Issue 1 to Vol. 22 Issue 4, covering 2003 to 2009 [6]
Based on the data reported to Wind Stats for the first quarter of 2010, the data represents about 27,000 turbines, ranging from 500 kW to 5 MW
Top three: 1. Gearbox 2. Generator 3. Electric Systems
Consider crane cost: • Main bearing also needs
attention • Electric systems often do
not need an expensive crane rental
Downtime caused by turbine subsystems [7]
NATIONAL RENEWABLE ENERGY LABORATORY
Typical Drivetrain CM Practices
16
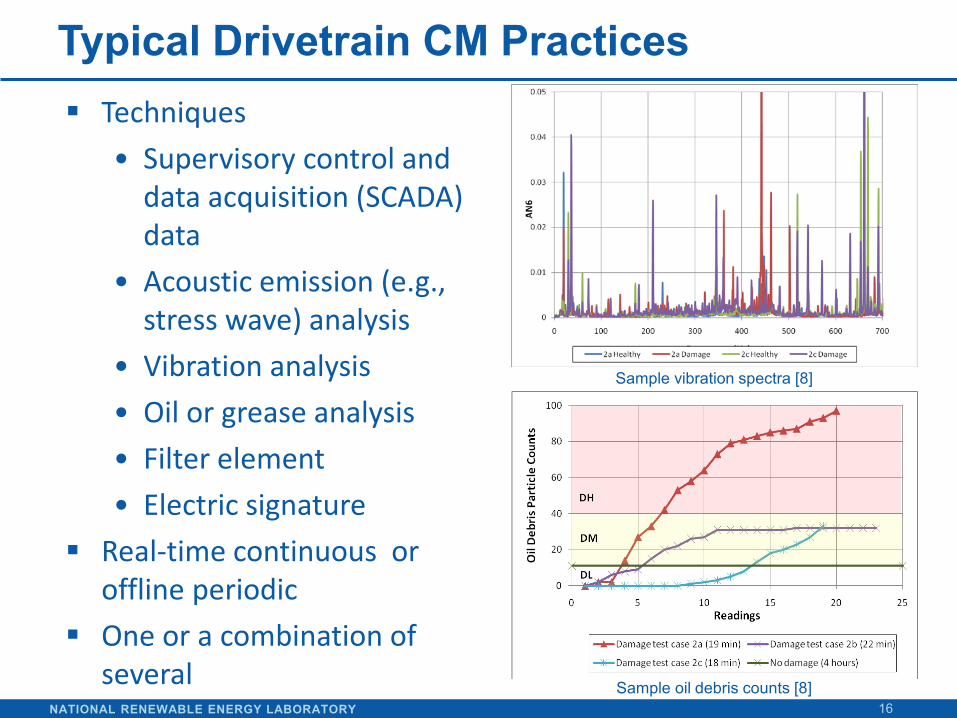
Techniques • Supervisory control and
data acquisition (SCADA) data
• Acoustic emission (e.g., stress wave) analysis
• Vibration analysis • Oil or grease analysis • Filter element • Electric signature
Real-time continuous or offline periodic
One or a combination of several
Sample vibration spectra [8]
Sample oil debris counts [8]
NATIONAL RENEWABLE ENERGY LABORATORY
Case Studies and Discussions
17
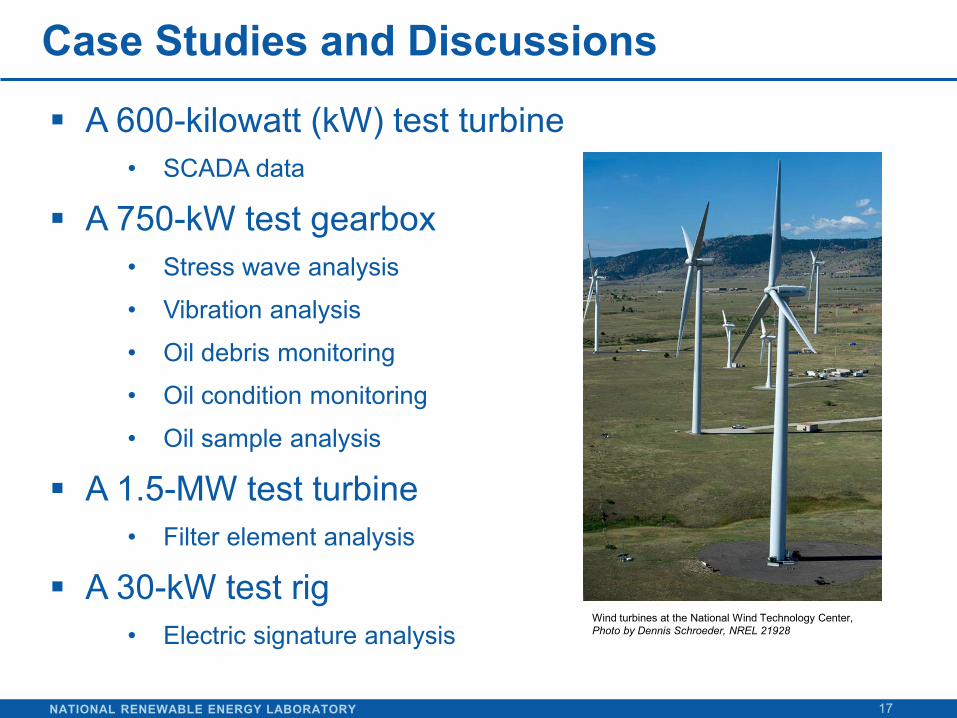
A 600-kilowatt (kW) test turbine • SCADA data
A 750-kW test gearbox • Stress wave analysis
• Vibration analysis
• Oil debris monitoring
• Oil condition monitoring
• Oil sample analysis
A 1.5-MW test turbine • Filter element analysis
A 30-kW test rig • Electric signature analysis
Wind turbines at the National Wind Technology Center, Photo by Dennis Schroeder, NREL 21928
NATIONAL RENEWABLE ENERGY LABORATORY
SCADA Data
18
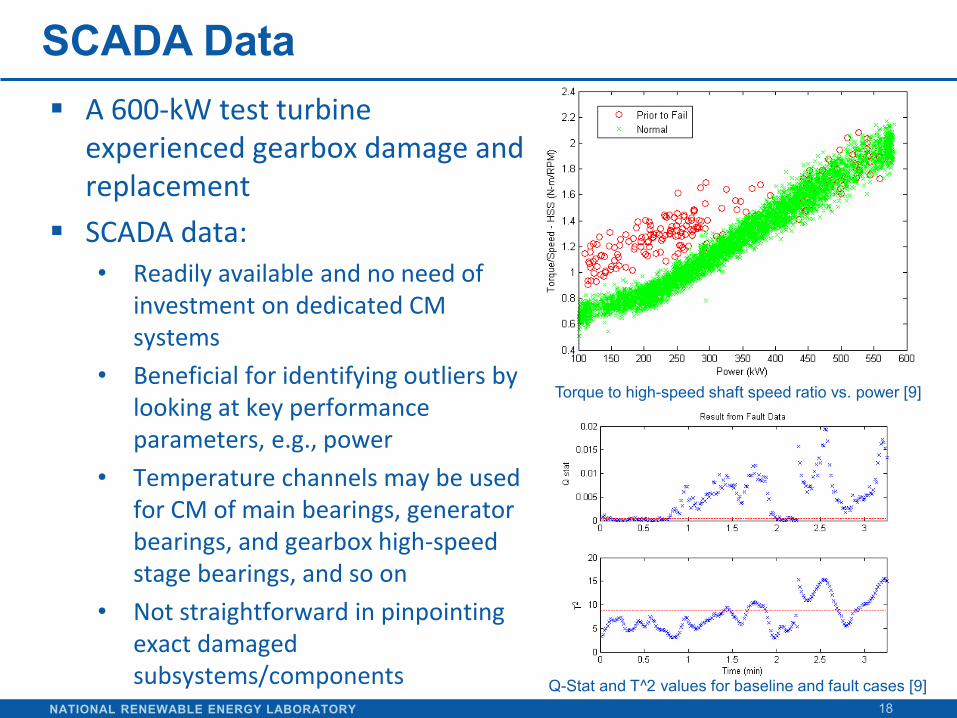
A 600-kW test turbine experienced gearbox damage and replacement
SCADA data: • Readily available and no need of
investment on dedicated CM systems
• Beneficial for identifying outliers by looking at key performance parameters, e.g., power
• Temperature channels may be used for CM of main bearings, generator bearings, and gearbox high-speed stage bearings, and so on
• Not straightforward in pinpointing exact damaged subsystems/components
Torque to high-speed shaft speed ratio vs. power [9]
Q-Stat and T^2 values for baseline and fault cases [9]
NATIONAL RENEWABLE ENERGY LABORATORY
A 750-kW Test Gearbox
19
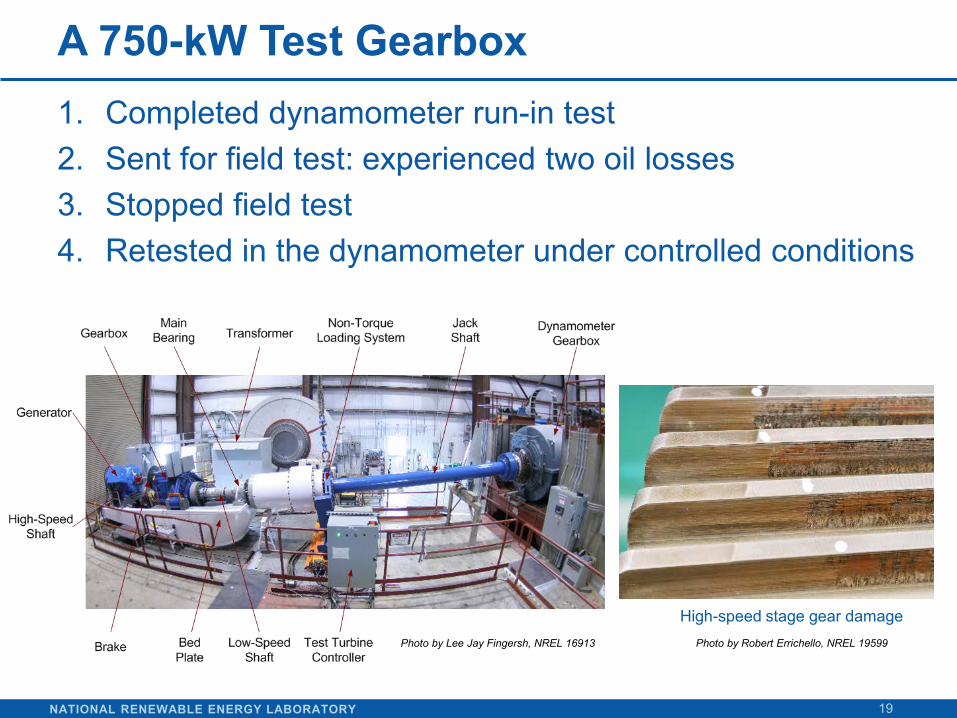
1. Completed dynamometer run-in test 2. Sent for field test: experienced two oil losses 3. Stopped field test 4. Retested in the dynamometer under controlled conditions
High-speed stage gear damage Photo by Lee Jay Fingersh, NREL 16913 Photo by Robert Errichello, NREL 19599
NATIONAL RENEWABLE ENERGY LABORATORY
Stress Wave Analysis [10]
20
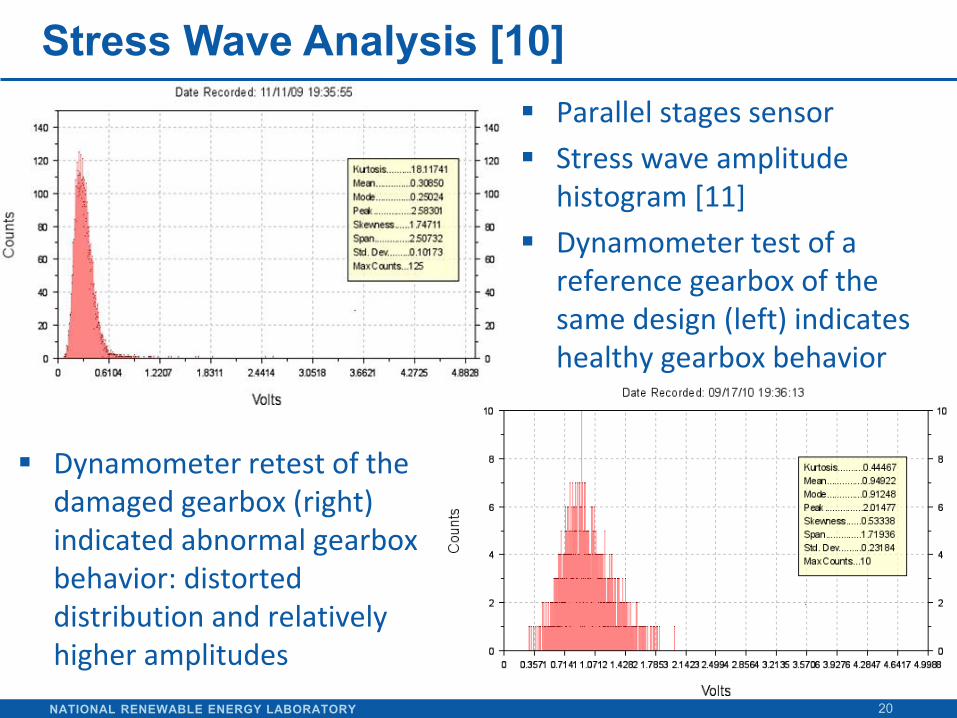
Dynamometer retest of the damaged gearbox (right) indicated abnormal gearbox behavior: distorted distribution and relatively higher amplitudes
Parallel stages sensor Stress wave amplitude
histogram [11] Dynamometer test of a
reference gearbox of the same design (left) indicates healthy gearbox behavior
NATIONAL RENEWABLE ENERGY LABORATORY
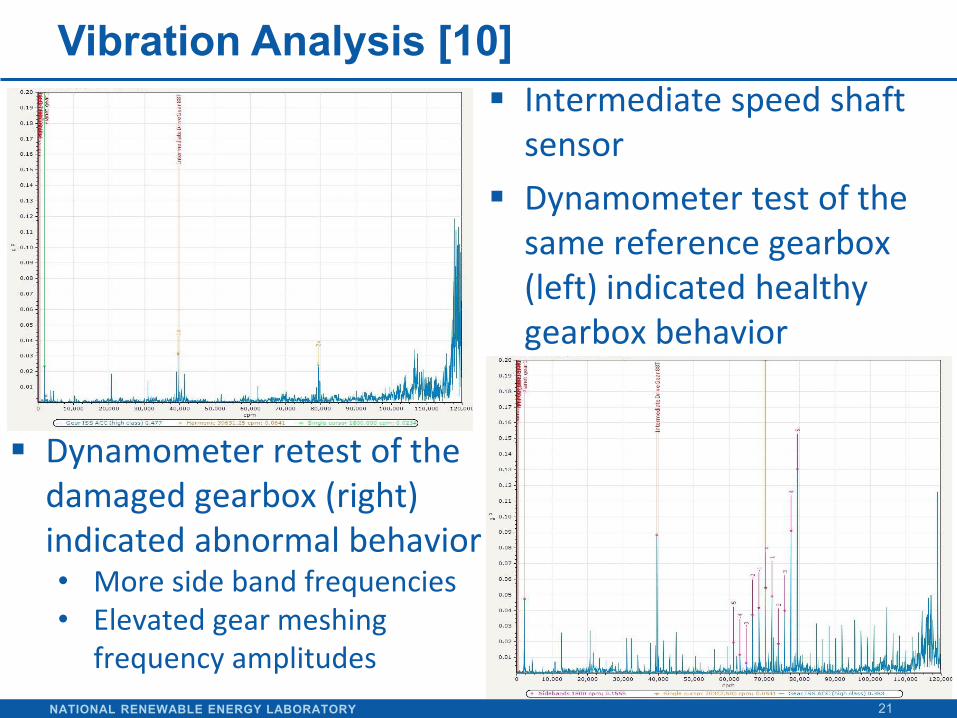
Vibration Analysis [10]
21
Intermediate speed shaft sensor
Dynamometer test of the same reference gearbox (left) indicated healthy gearbox behavior
Dynamometer retest of the damaged gearbox (right) indicated abnormal behavior • More side band frequencies • Elevated gear meshing
frequency amplitudes
NATIONAL RENEWABLE ENERGY LABORATORY
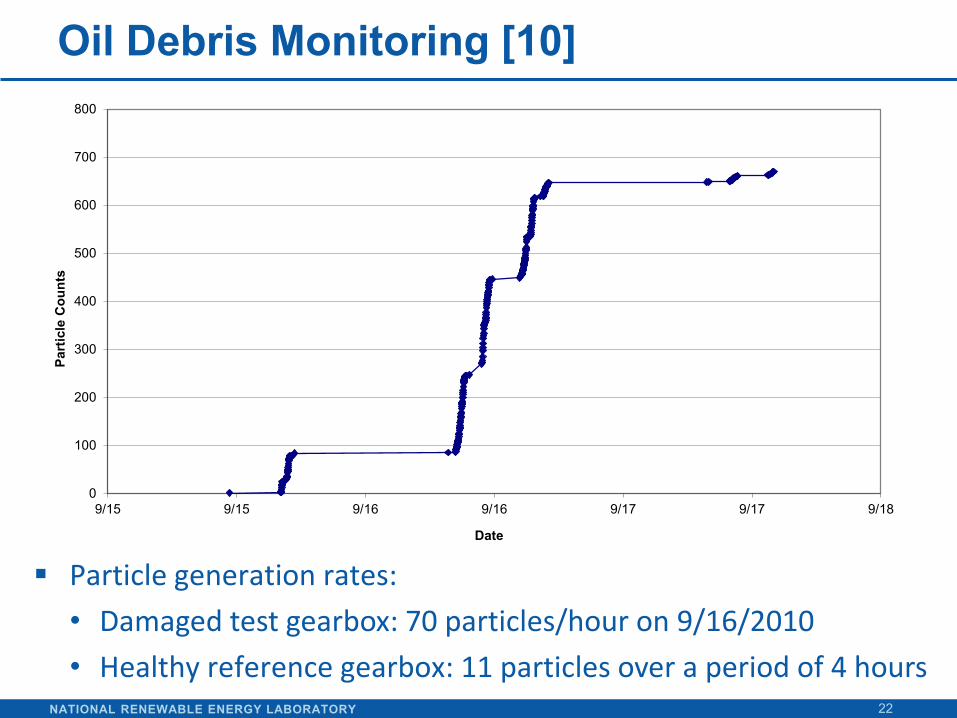
Oil Debris Monitoring [10]
22
0
100
200
300
400
500
600
700
800
9/15 9/15 9/16 9/16 9/17 9/17 9/18
Part
icle
Cou
nts
Date
Particle generation rates: • Damaged test gearbox: 70 particles/hour on 9/16/2010 • Healthy reference gearbox: 11 particles over a period of 4 hours
NATIONAL RENEWABLE ENERGY LABORATORY
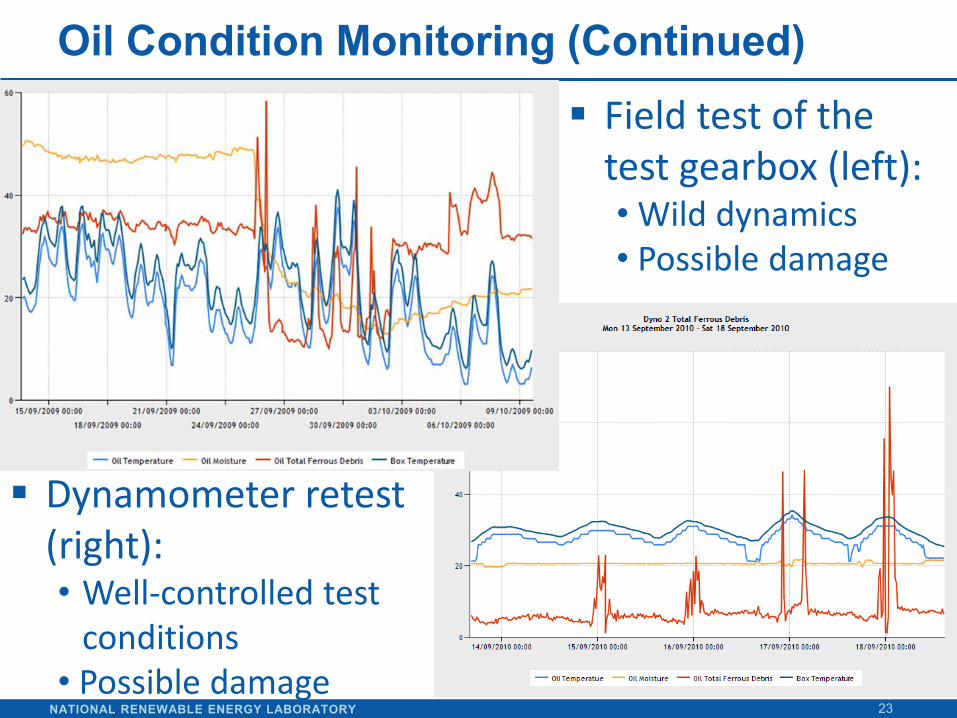
Oil Condition Monitoring (Continued)
23
Field test of the test gearbox (left): • Wild dynamics • Possible damage
Dynamometer retest (right): • Well-controlled test
conditions • Possible damage
NATIONAL RENEWABLE ENERGY LABORATORY
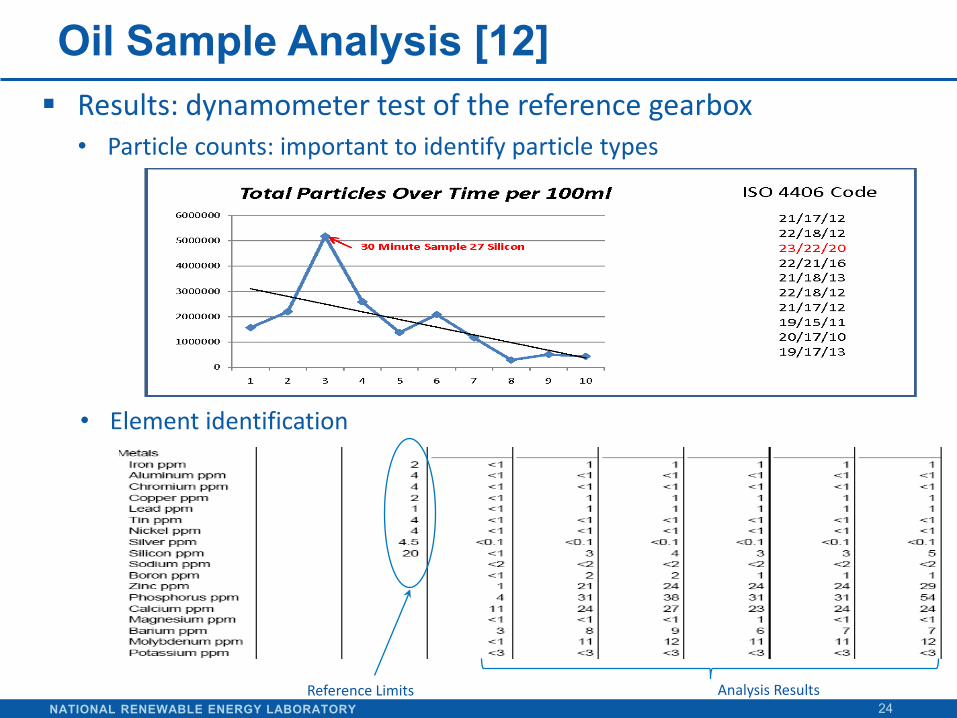
Oil Sample Analysis [12]
24
Results: dynamometer test of the reference gearbox • Particle counts: important to identify particle types
Analysis Results Reference Limits
• Element identification
NATIONAL RENEWABLE ENERGY LABORATORY
A 1.5-MW Test Turbine [13]
25
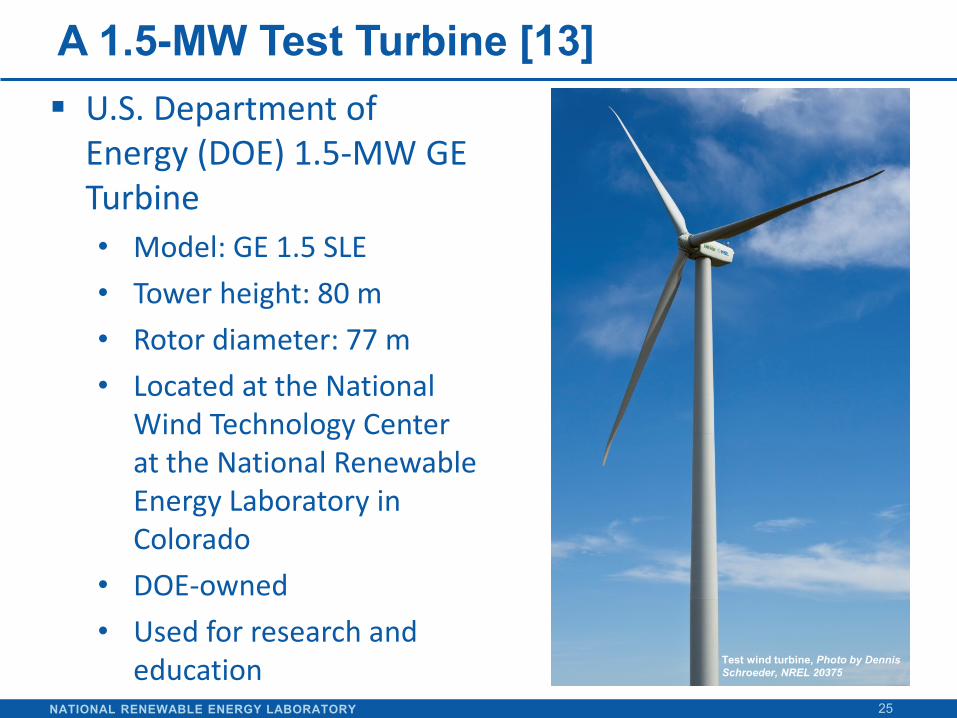
U.S. Department of Energy (DOE) 1.5-MW GE Turbine • Model: GE 1.5 SLE • Tower height: 80 m • Rotor diameter: 77 m • Located at the National
Wind Technology Center at the National Renewable Energy Laboratory in Colorado
• DOE-owned • Used for research and
education
Test wind turbine, Photo by Dennis Schroeder, NREL 20375
NATIONAL RENEWABLE ENERGY LABORATORY
Filter Element Analysis [13]
26
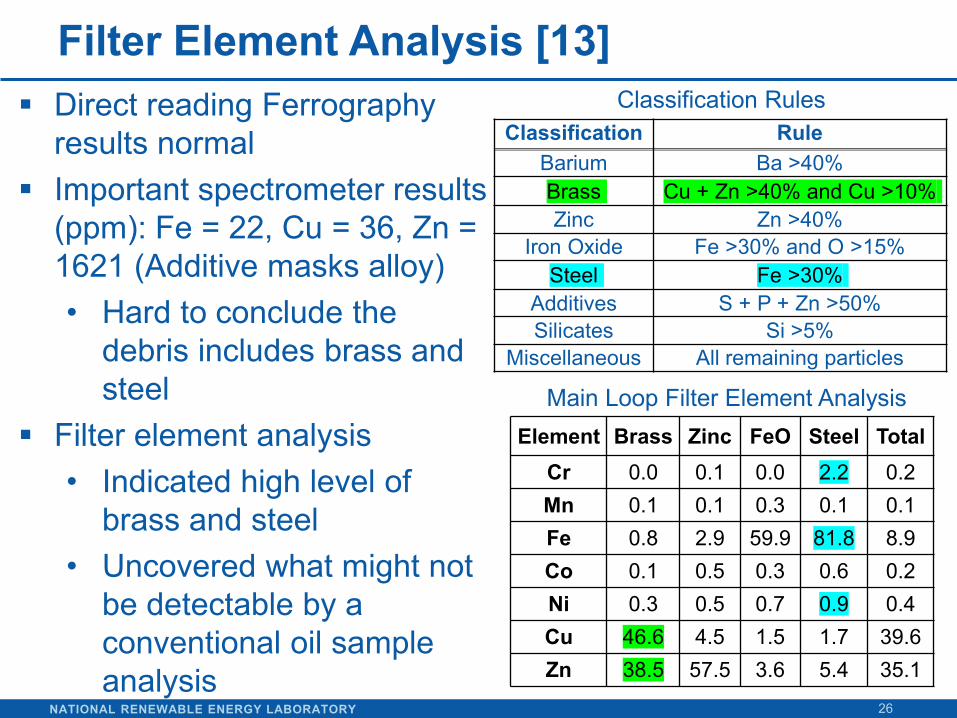
Element Brass Zinc FeO Steel Total Cr 0.0 0.1 0.0 2.2 0.2 Mn 0.1 0.1 0.3 0.1 0.1 Fe 0.8 2.9 59.9 81.8 8.9 Co 0.1 0.5 0.3 0.6 0.2 Ni 0.3 0.5 0.7 0.9 0.4 Cu 46.6 4.5 1.5 1.7 39.6 Zn 38.5 57.5 3.6 5.4 35.1
Classification Rule Barium Ba >40% Brass Cu + Zn >40% and Cu >10% Zinc Zn >40%
Iron Oxide Fe >30% and O >15% Steel Fe >30%
Additives S + P + Zn >50% Silicates Si >5%
Miscellaneous All remaining particles
Direct reading Ferrography results normal
Important spectrometer results (ppm): Fe = 22, Cu = 36, Zn = 1621 (Additive masks alloy) • Hard to conclude the
debris includes brass and steel
Filter element analysis • Indicated high level of
brass and steel • Uncovered what might not
be detectable by a conventional oil sample analysis
Classification Rules
Main Loop Filter Element Analysis
NATIONAL RENEWABLE ENERGY LABORATORY
Electric Signature Analysis
27
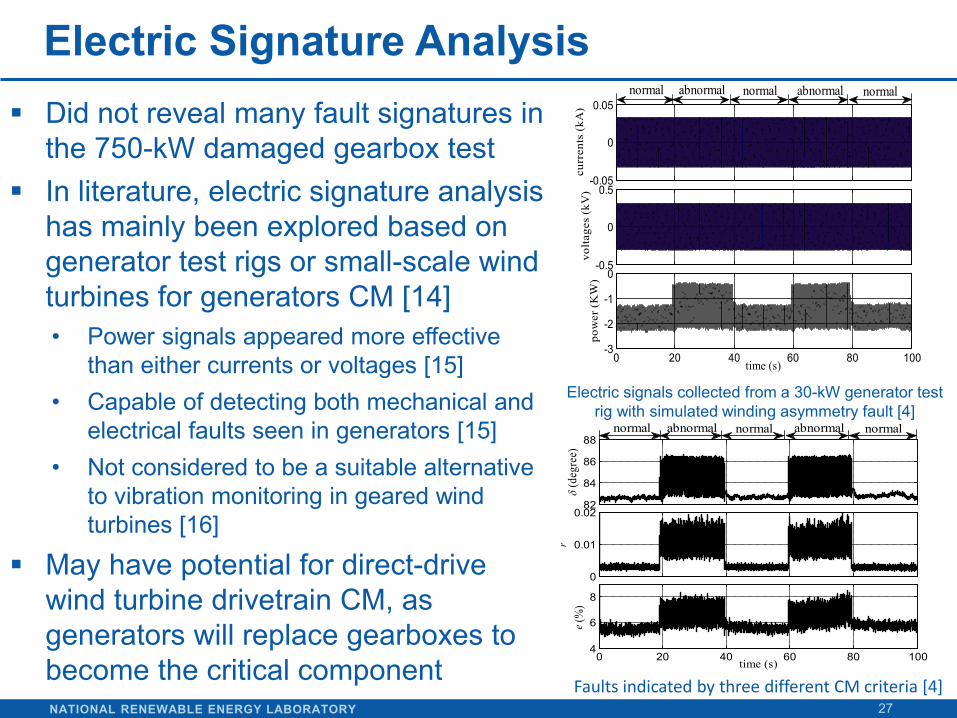
Did not reveal many fault signatures in the 750-kW damaged gearbox test
In literature, electric signature analysis has mainly been explored based on generator test rigs or small-scale wind turbines for generators CM [14] • Power signals appeared more effective
than either currents or voltages [15] • Capable of detecting both mechanical and
electrical faults seen in generators [15] • Not considered to be a suitable alternative
to vibration monitoring in geared wind turbines [16]
May have potential for direct-drive wind turbine drivetrain CM, as generators will replace gearboxes to become the critical component
-0.05
0
0.05
curr
ents
(kA
)
-0.5
0
0.5
volta
ges
(kV
)
0 20 40 60 80 100-3
-2
-1
0
pow
er (K
W)
time (s)
normal abnormal normal abnormal normal
82
84
86
88
δ (d
egre
e)0
0.01
0.02
r
0 20 40 60 80 1004
6
8
e (%
)
time (s)
normal abnormal normal abnormal normal
Electric signals collected from a 30-kW generator test rig with simulated winding asymmetry fault [4]
Faults indicated by three different CM criteria [4]
NATIONAL RENEWABLE ENERGY LABORATORY
Discussions
28
SCADA data are beneficial for identifying abnormal turbines by tracking key performance parameters, but are limited when carrying out a full condition monitoring of wind turbine subsystems/components.
Temperature channels may be used for the CM of main bearings, generator bearings, or gearbox high-speed stage bearings, and so on.
Stress wave analysis (amplitude histogram) appears effective for detecting gearbox abnormal health conditions, but the sensors may be prone to environmental noises.
Spectrum analysis of the vibration signal (or stress waves) can, to a certain extent, pinpoint the location of damaged gearbox components, but may have challenges with low-speed components, such as gearbox planet stage bearings or main bearings.
NATIONAL RENEWABLE ENERGY LABORATORY
Discussions (Continued)
29
Oil debris monitoring, specifically particle counts, is effective for monitoring gearbox component damage, but not effective for pinpointing damage locations
Damaged gearbox releases particles at increased rates Oil condition monitoring, specifically moisture, total
ferrous debris, and oil quality: • Oil total ferrous debris appears indicative for gearbox
component damage • More data is required to understand oil moisture and quality
When obtaining particle counts through oil sample analysis, attention should be given to identifying particle types
Periodic oil sample analysis may help pinpoint failed component and root cause analysis
NATIONAL RENEWABLE ENERGY LABORATORY
Discussions (Continued)
30
Filter element analysis may reveal what is typically missed in conventional oil sample analysis
Electric current analysis appears effective for generator mechanical and electric fault detections:
• Only verified on laboratory test rigs or small-scale wind turbines thus far
• Some validations on utility-scale wind turbines are needed before the technique can have a bigger impact
• Direct-drive wind turbines may present a good opportunity for electric signature analysis
Given the diverse and complex failure modes seen in wind turbine drivetrains, an integration approach is recommended, starting with an initial digest of SCADA data and then fusing several dedicated techniques by considering their advantages and disadvantages.
NATIONAL RENEWABLE ENERGY LABORATORY
Concluding Remarks
31
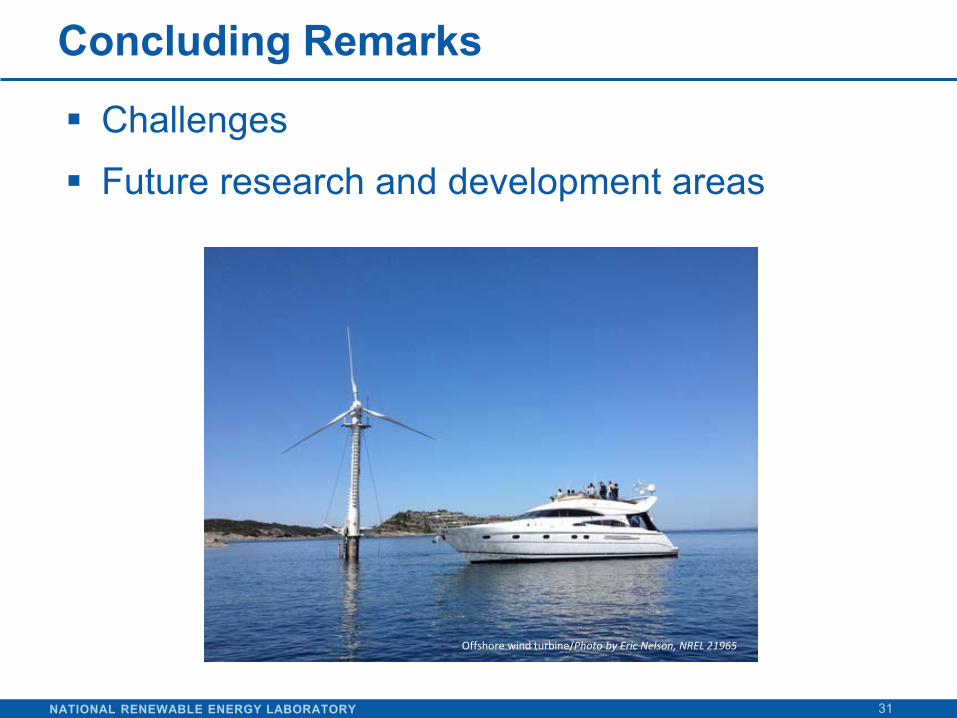
Challenges Future research and development areas
Offshore wind turbine/Photo by Eric Nelson, NREL 21965
NATIONAL RENEWABLE ENERGY LABORATORY
Challenges [17]
32
Justification of cost benefits for CM: each wind turbine has a relatively lower revenue stream than traditional power generation and site variations
Limited machine accessibility: makes retrofitting of CM systems or taking oil/grease samples difficult
Cost-effective and universal measurement strategy: sensor readings are affected by mounting locations and various drivetrain and gearbox configurations
Diagnostics: variable-speed and load conditions and very low rotor speeds challenge traditional diagnostic techniques developed for other applications
NATIONAL RENEWABLE ENERGY LABORATORY
Challenges (Continued) [17]
33
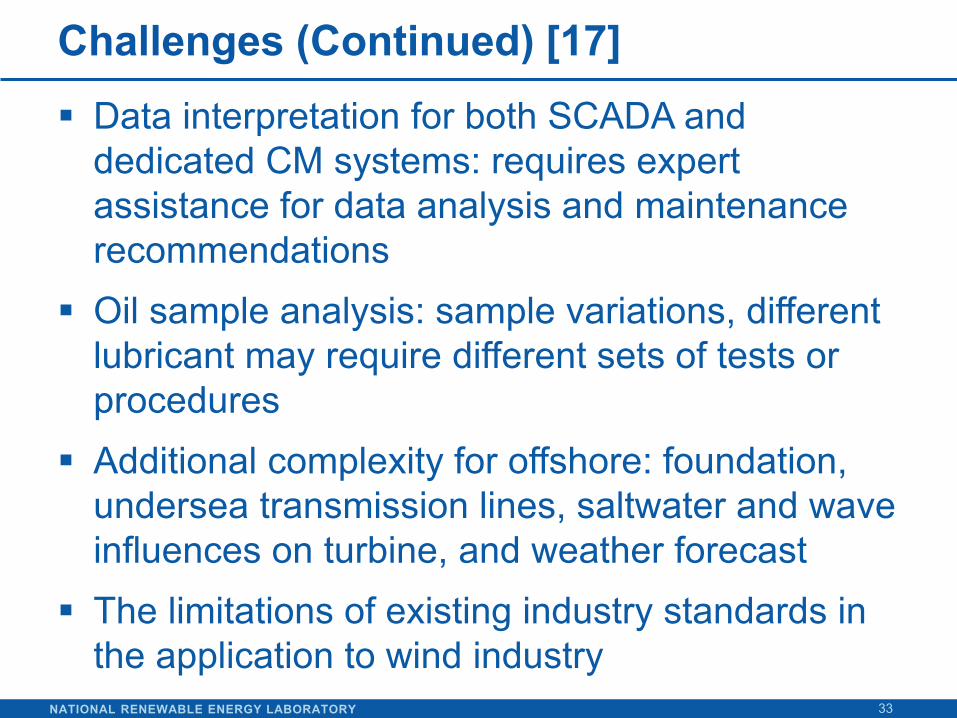
Data interpretation for both SCADA and dedicated CM systems: requires expert assistance for data analysis and maintenance recommendations
Oil sample analysis: sample variations, different lubricant may require different sets of tests or procedures
Additional complexity for offshore: foundation, undersea transmission lines, saltwater and wave influences on turbine, and weather forecast
The limitations of existing industry standards in the application to wind industry
NATIONAL RENEWABLE ENERGY LABORATORY
Future Research and Development Areas [17]
34
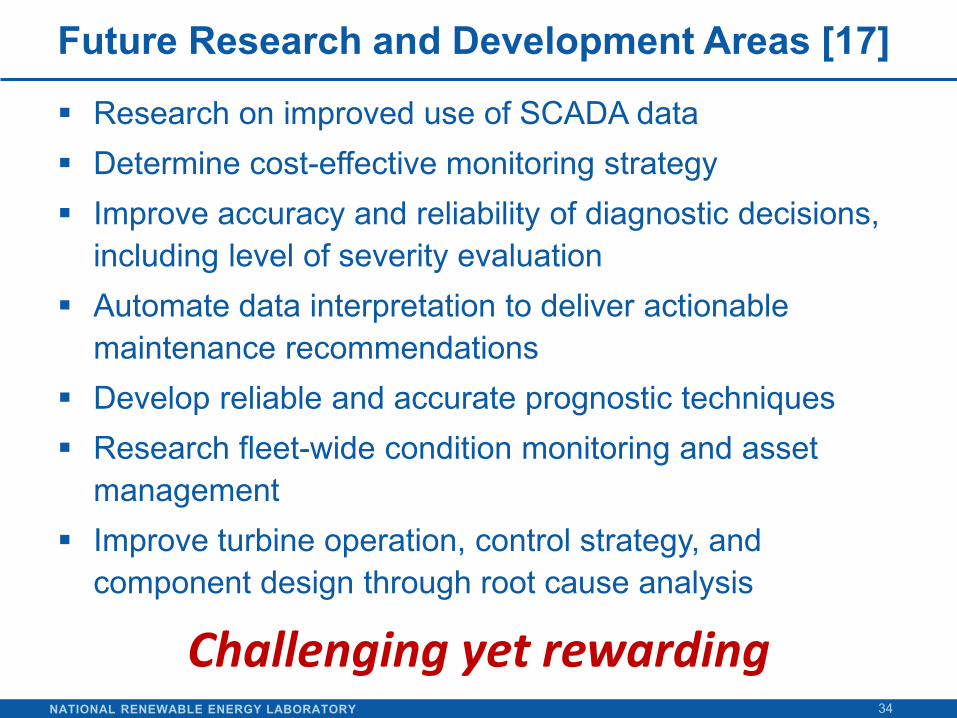
Research on improved use of SCADA data Determine cost-effective monitoring strategy Improve accuracy and reliability of diagnostic decisions,
including level of severity evaluation Automate data interpretation to deliver actionable
maintenance recommendations Develop reliable and accurate prognostic techniques Research fleet-wide condition monitoring and asset
management Improve turbine operation, control strategy, and
component design through root cause analysis Challenging yet rewarding
NATIONAL RENEWABLE ENERGY LABORATORY
References
35
1. Global Wind Energy Council. (2012). Global Wind Report Annual Market Update 2012. http://www.gwec.net/wp-content/uploads/2012/06/Annual_report_2012_LowRes.pdf. [Accessed 05/15/2013].
2. Feng, Y.; Tavner, P.; (2010). Introduction to Wind Turbines and Their Reliability & Availability, presented at the European Wind Energy Conference, April 20-23, Warsaw, Poland.
3. Tavner, P.; Spinato, F.; van Bussel, G.J.W.; Koutoulakos, E. (2008). Reliability of Different Wind Turbine Concepts with Relevance to Offshore Application, presented at the European Wind Energy Conference, March 31 – April 3, Brussels, Belgium.
4. Yang W.; Sheng S.; Court, R. (2012). Operational-Condition-Independent Criteria Dedicated to Monitoring Wind Turbine Generators: Preprint. 9 pp.; NREL Report No. CP-5000-55195.
5. Meadows R. (2012). “Offshore Wind O&M Challenges,” Wind Turbine Condition Monitoring Workshop, Broomfield, CO, September 19−21, 2011.
6. Wind Stats Newsletter. (2003–2009). Vol. 16, No. 1 to Vol. 22, No. 4, Haymarket Business Media, London, UK.
7. Sheng S.; Link H.; LaCava W.; van Dam J.; McNiff B.; Veers P.; Keller J.; Butterfield S.; Oyague F. (2011). “Wind Turbine Drivetrain Condition Monitoring During GRC Phase 1 and Phase 2 Testing,” 58 pp., NREL Report No. TP-5000-52748.
8. Dempsey, P.; Sheng, S. (2011). “Investigation of Data Fusion for Health Monitoring of Wind Turbine Drivetrain Components,” presented at the 2011 American Wind Energy Association WINDPOWER Conference, Anaheim, CA, USA, May 22−25, 2011.
9. Parthasarathy G.; Kim K.; Foslien W.; Uluyol O.; Sheng S.; Fleming P. (2011). “Use of SCADA Data for Failure Detection in Wind Turbines,” published in the 2011 Energy Sustainability Conference and Fuel Cell Conference Proceedings, Washington DC, USA, August 7−10, 2011.
NATIONAL RENEWABLE ENERGY LABORATORY
References (Continued)
36
10. Sheng, S. (2011). “Investigation of Various Condition Monitoring Techniques Based on a Damaged Wind Turbine Gearbox,” 8th International Workshop on Structural Health Monitoring 2011 Proceedings, Stanford, CA, September 13-15, 2011.
11. Board, D. B. (2003). “Stress Wave Analysis Provides Early Detection of Lubrication Problems,” Practicing Oil Analysis magazine.
12. Sheng, S. (2011). “Investigation of Oil Conditioning, Real-time Monitoring and Oil Sample Analysis for Wind Turbine Gearboxes,” presented at the 2011 AWEA Project Performance and Reliability Workshop, January 12–13, 2011, San Diego, CA.
13. Sheng S.; Herguth, W.; Roberts D. (2013). “Condition Monitoring of Wind Turbine Gearboxes Through Compact Filter Element Analysis,” presented at the 2013 Society of Tribologists and Lubrication Engineers Annual Meeting and Exhibition, Detroit, MI, USA, May 6−9, 2013.
14. Gong, X. (2012). Online Nonintrusive Condition Monitoring and Fault Detection for Wind Turbines. Dissertation. University of Nebraska Lincoln, August 2012.
15. Yang W.; Tavner P.; Crabtree C.; Wilkinson M. (2010). “Cost Effective Condition Monitoring for Wind Turbines,” IEEE Transactions on Industrial Electronics, Vo. 57, No. 1, pp. 263−271.
16. Madsen, B. (2011). Condition Monitoring of Wind Turbines by Electric Signature Analysis. Thesis. Technical University of Denmark, October 2011.
17. Sheng, S.; Veers, P. (2011). “Wind Turbine Drivetrain Condition Monitoring – An Overview,” Machinery Failure Prevention Technology (MFPT) Society 2011 Conference Proceedings, Virginia Beach, VA, May 10−12, 2011.
NATIONAL RENEWABLE ENERGY LABORATORY
HC Sorensen, Middelgrunden Wind Turbine Cooperative, Photo by HC Sorensen, NREL 17855
Thanks for Your Attention!
37
Special thanks go to DOE and the condition monitoring research partners!
[email protected] 303-384-7106