Wind Turbine Design Methods Robert Scott [email protected] November 1, 2007.
20
-
Upload
beryl-cook -
Category
Documents
-
view
214 -
download
0
Transcript of Wind Turbine Design Methods Robert Scott [email protected] November 1, 2007.

Advantages of Wind Power
• Clean• Flexible• Large Potential for Growth• Economically Viable (most of the time – peak
opportunity)

Design
• Siting• Configurations• Sizing• Rotor• Tower• Generator

Siting
• Wind speed• Climate Conditions• Inland or at sea• Terrain• Surrounding
Community

Configurations
• Vertical Axis– Darrieus– H-Type– Savonius
• Disadvantages– Size limits– Reliability

Configurations
• Horizontal Axis– 3-bladed most
common, structures and dynamic considerations
– 1 and 2-bladed designs exist, but don’t even bother.
– Upwind or Downwind

Sizing
• Designs exist for capacities of <1 kW up to 5 MW.
• What are you designing for?– Utilities– Individual Use– Special Use

Rotor• Diameter
– Larger = higher capacity and higher costs, helps for lower windspeed
• Blades– Airfoils– Shape (Twist)
• Control– Stall/Pitch regulated– Rotational Speed
0.00
0.50
1.00
1.50
2.00
2.50
3.00
3.50
4.00
0 20 40 60 80 100 120
Rotor Diameter (m)
Rat
ed C
apac
ity
(MW
)

Rotor
• Control– Stall/Pitch regulated– Rotational Speed– Cut-in, rated, cut-out
velocities
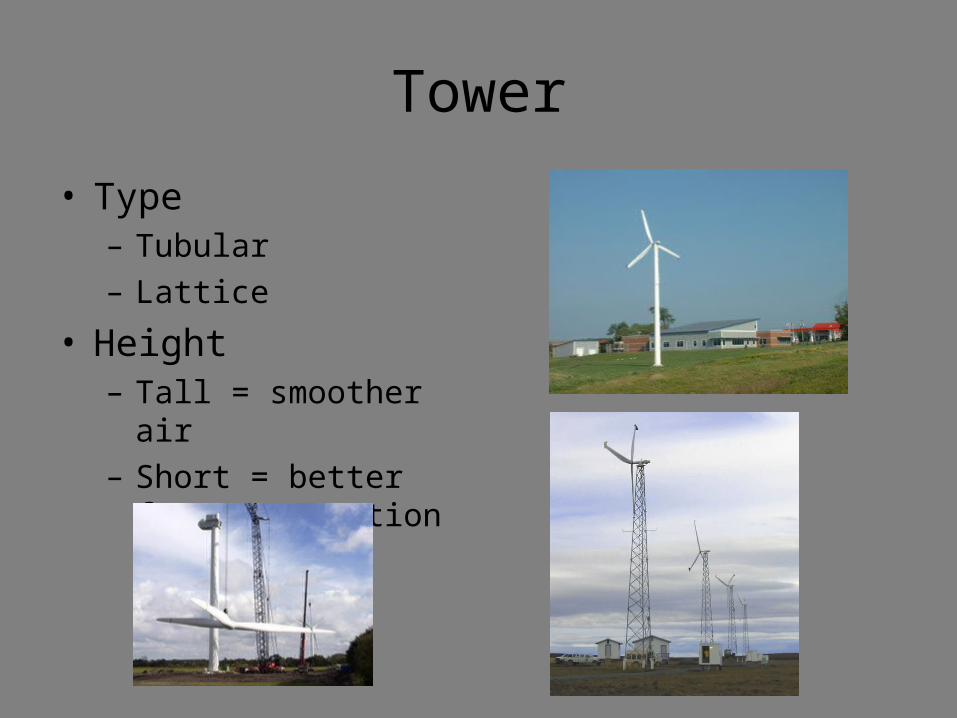
Tower
• Type– Tubular– Lattice
• Height– Tall = smoother air– Short = better for
construction

Wind Variability
• The terrain of the site affects the wind speed.
• Higher roughness lengths slow the wind down more at low elevations.
0
0
ln
ln)(
zz
zz
zU
zU
anem
hub
anem
hub

Generator
• Enclosed?• Gearbox?• Direct-drive?

Design Process
• Performance– Efficiency– Reliability
• Economics– Infrastructure (~ $1.7 Million per MW)– Construction – Operational Costs (~ 2% of acquisition
costs/yr)– Subsidies

The Power Curve
Published power curve for a 1.5 megawatt wind turbine.Nordex S70. Vc-o≈ 2VR

Wind Variability
• Model the wind as a probability density function– The Weibull
distribution
kxk
exk
kxf
1
,;
22
U
eU
Uf
k
x
ekxF
1,;
For wind,
2
1
U
eUF
0
0.02
0.04
0.06
0.08
0.1
0.12
0.14
0.16
0 5 10 15 20 25
wind speed (m/s)
pro
b d
ist
fun
ct,
ƒ
Ū = 5 m/s
Ū = 7 m/s
Ū = 9 m/s
Ū = 11 m/s
0
0.2
0.4
0.6
0.8
1
1.2
0 5 10 15 20 25
wind speed (m/s)
cum
ul.
dis
t, F
Ū = 5 m/s
Ū = 7 m/s
Ū = 9 m/s
Ū = 11 m/s

What does all this tell us?Capacity Factor:
max
0
E
E
tP
Pdt
CFrated
t
A capacity factor of 35% for a wind turbine is considered good.
Ū = 5 m/s CF = 0.05
Ū = 7 m/s CF = 0.18
Ū = 9 m/s CF = 0.42
Ū = 11 m/s CF = 0.73
0
0.02
0.04
0.06
0.08
0.1
0.12
0.14
0.16
0 0.1 0.2 0.3 0.4 0.5 0.6 0.7 0.8 0.9 1
Capacity Factor
pro
b d
ist
fun
ct, ƒ
Ū = 5 m/s
Ū = 7 m/s
Ū = 9 m/s
Ū = 11 m/s
0
0.1
0.2
0.3
0.4
0.5
0.6
0.7
0.8
0.9
1
0 0.1 0.2 0.3 0.4 0.5 0.6 0.7 0.8 0.9 1
Capacity Factor
1 -
F
Ū = 5 m/s
Ū = 7 m/s
Ū = 9 m/s
Ū = 11 m/s

Sensitivity Studies – HOMER
Sensitivity to wind speedŪ = 5 m/s:225,000K kWh/yr @ $0.15/kWh
Ū = 14 m/s:1,000,000K kWh/yr @ $0.055/kWh
Sensitivity to hub heightzH = 40 m500,000K kWh/yr @ $0.087/kWh
Ū = 5 m/s:675,000K kWh/yr @ $0.07/kWh

The Power Coefficient
The power output normalized to the energy density of the wind and the rotor area.
AU
PC p 3
21
0
0.05
0.1
0.15
0.2
0.25
0.3
0.35
0.4
0.45
0.5
0 5 10 15 20 25
wind speed (m/s)
po
wer
co
eff
Cp
Measures the amount of power actually converted out of the power available in the wind

Optimized Costs of Energy• High wind speed areas, U > 10 m/s
consistently• Maximized hub heights, zH = 100 m• Large development – Economies of
scale reduce per unit price of turbines.
Optimized Cost of Energy: • $0.038/kWh (3% interest)• $0.040/kWh (4% interest)• $0.042/kWh (5% interest)• $0.044/kWh (6% interest)
Comparison with other fuels:
Coal $0.02 – 0.03/kWh
Natural Gas $0.05 – 0.08/kWh
Nuclear $0.02 – 0.03/kWh
Note: Other fuels, especially coal and nuclear, benefit from not having to include their high external costs in the price of energy. Wind energy also receives a $0.015/kWh tax credit.

Useful Websites
• List of wind farms: http://www.fplenergy.com/portfolio/contents/portfolio_by_source.shtml
• Wind turbine Manufacturers– http://www.skystreamenergy.com/skystream/– http://www.enercon.de/en/_home.htm– http://www.nordex-online.com/en/– http://www.gamesa.es/index.php/en– http://www.suzlon.com/
• Current Events– http://www.cnn.com/2007/TECH/science/10/09/pip.wind.energy/– www.wind-watch.org