Wind Travelling Ahead in Asia Pacific - Underlying Opportunities and Challenges
16
Wind Travelling Ahead in Asia Pacific: Underlying Opportunities and Challenges Suchitra Sriram Program Manager, Energy Practice, Frost & Sullivan November 2010
-
Upload
frost-sullivan -
Category
Business
-
view
1.340 -
download
3
Transcript of Wind Travelling Ahead in Asia Pacific - Underlying Opportunities and Challenges

Wind Travelling Ahead in Asia Pacific:Underlying Opportunities and
Challenges
Suchitra Sriram
Program Manager, Energy Practice, Frost & Sullivan
November 2010

Table of Contents
Wind Travelling Ahead in Asia Pacific: Underlying Opportunities and Challenges
11
22
33
44
Asia Pacific Region Redefining the Global Demand for Wind Power
Key Driving Factors
Major Challenges Restricting Growth
Asia Pacific Market Forecasts
Hot spots for Wind Power in Asia Pacific
Investment Patterns in Asia Pacific
Asia Pacific Region Redefining the Global Demand for Wind Power
Key Driving Factors
Major Challenges Restricting Growth
Asia Pacific Market Forecasts
Hot spots for Wind Power in Asia Pacific
Investment Patterns in Asia Pacific
55
66

Rest of World59.3%
Asia Pacific40.7%
Rest of World74.0%
Asia Pacific26.0%
Rest of World90.5%
Asia Pacific9.5%
Source: Frost & Sullivan
Wind Energy Market: Key Figures (World and Asia Pacific), 2009 and 2015
World Asia Pacific
2009 2015 2009 2015
Total Installed Capacity (MW) 157,900 ~491,000 41,130 ~200,000
Market Growth Rate (Y-o-Y) 30.2% 21.3% 57.8% 25.0%
Market Stage Growth Growth Growth Growth
New Capacity Additions (MW) 37,446 ~86,000 15,216 ~40,000
Incremental Capacity Leader China China China China
20002000
20092009
20152015
Wind Energy Market: Cumulative Installed Capacity by Geographic Region (World), 2000-2015Wind Energy Market: Cumulative Installed Capacity by Geographic Region (World), 2000-2015
11 Asia Pacific Region Redefining the Global Demand for Wind Power
Increase over previous year’s share Decrease from previous year’s share No change Increase over previous year’s share Decrease from previous year’s share No change
11Asia Pacific Region Redefining the Global Demand for Wind Power
(Contd…)
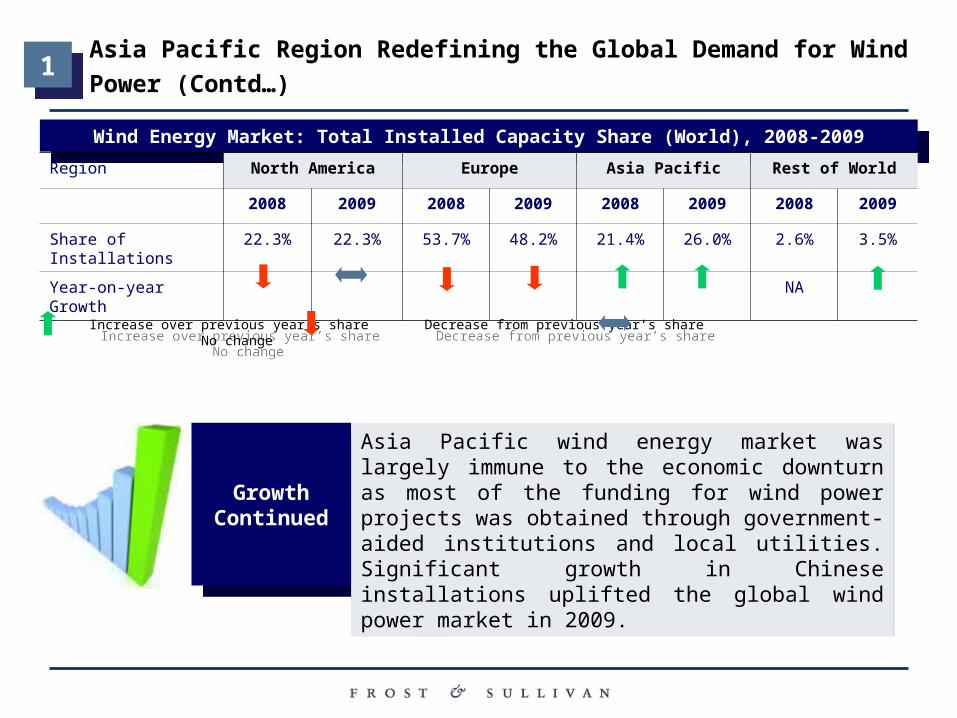
Wind Energy Market: Total Installed Capacity Share (World), 2008-2009Wind Energy Market: Total Installed Capacity Share (World), 2008-2009
Region North America Europe Asia Pacific Rest of World
2008 2009 2008 2009 2008 2009 2008 2009
Share of Installations 22.3% 22.3% 53.7% 48.2% 21.4% 26.0% 2.6% 3.5%
Year-on-year Growth NA
Growth Continued
Growth Continued
Asia Pacific wind energy market was largely immune to the economic downturn as most of the funding for wind power projects was obtained through government-aided institutions and local utilities. Significant growth in Chinese installations uplifted the global wind power market in 2009.
Asia Pacific wind energy market was largely immune to the economic downturn as most of the funding for wind power projects was obtained through government-aided institutions and local utilities. Significant growth in Chinese installations uplifted the global wind power market in 2009.

22 Key Driving Factors
Wind Energy Market: Market Drivers (Asia Pacific), 2010-2015Wind Energy Market: Market Drivers (Asia Pacific), 2010-2015
Presence of targets, incentives and
subsidies
Growing need for energy security
Untapped wind potential
Volatile oil and gas price
Volatile oil and gas price
Source: Frost & Sullivan

Source: Frost & Sullivan
High dependence on government
support
Zoning and permitting issues
Grid interconnection
issues
Growing popularity of small hydro and solar
energy
33 Major Challenges Restricting Growth
Wind Energy Market: Industry Challenges (Asia Pacific), 2010-2015Wind Energy Market: Industry Challenges (Asia Pacific), 2010-2015
High initial investment outlay
High initial investment outlay

0.0
10.0
20.0
30.0
40.0
50.0
60.0
70.0
80.0
90.0
100.0
2006 2007 2008 2009 2010 2011 2012 2013 2014 2015
Revenues (
$ B
illio
n)
0.0
10.0
20.0
30.0
40.0
50.0
60.0
70.0
80.0
90.0
100.0
Year
Revenue G
row
th R
ate
(%
)
Revenues ($ Billion) Revenue Growth Rate (%)
44 Asia Pacific Market Forecasts
Wind Energy Market: Market Forecasts (Asia Pacific), 2006-2015Wind Energy Market: Market Forecasts (Asia Pacific), 2006-2015
CAGR (2009-2015): 18.6%CAGR (2009-2015): 18.6%
Source: Frost & Sullivan

44 Asia Pacific Market Forecasts (Contd…)
Wind Energy Market: Market Forecasts Assumptions (Asia Pacific), 2010-2015Wind Energy Market: Market Forecasts Assumptions (Asia Pacific), 2010-2015
201
0 to
201
320
14
an
d b
eyo
nd
China continues to grow at a rapid pace and spearheads Asia Pacific growth.
The Indian market grows on account of Generation based Incentives (GBI).
Australia grows due to $20-billion investment in renewables and the Mandatory
Renewable Energy Target (MRET).
New Zealand market is expected to decline in 2010, but is forecast to pick up once the
hydropower sites reach saturation.
Japan to experience slow growth because key regions rich in wind potential are battered
by typhoons and land available for development is limited.
Growth is anticipated in Thailand, The Philippines and South Korea.
Growth in China is likely to decline as the effect of stimulus package subsides and due to
lack of infrastructure support.
Growth is anticipated in Vietnam, Taiwan, and South Korea.
As solar energy approaches large-scale commercialization, its attractiveness may
overshadow wind.

55 Hot Spots for Wind Power in Asia Pacific
• Key markets in Asia Pacific during the next decade – China, India, and Australia
• Onshore installations to dominate. Offshore potential identified in China, Taiwan, South Korea, and Japan.
• Key markets in Asia Pacific during the next decade – China, India, and Australia
• Onshore installations to dominate. Offshore potential identified in China, Taiwan, South Korea, and Japan. Source: Compiled by Frost & Sullivan
10,926 MWInstalled
1,712 MWInstalled
1,271 MW in 2009
65 GW potential
406 MW in 2009
178 MW in 2009
2,056 MWInstalled
25,104 MWInstalled
436 MWInstalled
78 MW in 2009
348 MWInstalled
112 MW in 2009
150 GW potential
13,000 MW in 2009

55 Hot Spots for Wind Power in Asia Pacific (Contd…)
Country 1-2 Years 3-4 Years > 5 Years
China
India
Japan
South Korea
Taiwan
Malaysia -- -- --
Indonesia --
The Philippines
Vietnam
Thailand
Australia
New Zealand
Source: Frost & Sullivan
Key:
Very High
High
Moderate
Low
Key:
Very High
High
Moderate
Low
Market attractiveness for wind
projects have been given
based on the existing policies,
government support in the
form of incentives and
subsidies, untapped wind
potential, technology
availability, and private sector
participation.
Market attractiveness for wind
projects have been given
based on the existing policies,
government support in the
form of incentives and
subsidies, untapped wind
potential, technology
availability, and private sector
participation.
Wind Energy Market: Market Attractiveness (Asia Pacific), 2010-2015Wind Energy Market: Market Attractiveness (Asia Pacific), 2010-2015

66 Investment Patterns in Asia Pacific
• Historically - venture capital and private equity have been limited. Largely undertaken through the CDM initiative and by government bodies.
• Recently - inflow of funds from foreign investors and utilities.
• Historically - venture capital and private equity have been limited. Largely undertaken through the CDM initiative and by government bodies.
• Recently - inflow of funds from foreign investors and utilities.
Uptake of renewable energy (the amount that actually reaches the grid)
Cost of other resources (land, labour, and others)
Legislative environment, availability of subsidies
Price regime for output
Capacity factor
Component/Turbine cost
Factorsconsidered
before investing
Wind Energy Market: Factors Influencing Investment Decisions (Asia Pacific), 2009
Source: Frost & Sullivan

66 Investment Patterns in Asia Pacific (Contd…)
ChinaChina
Local/State-owned Utilities80.0%
Private Investment
20.0%
Wind Energy Market: Investment Contribution (China), 2009
Source: Frost & Sullivan
Huaneng Group, Longyuan Power
Group, and others
2009:
• Investments in China’s wind energy market unaffected by
recession.
Outlook beyond 2009:
• Foreign investments to expand ‘from a trickle to a
waterfall’.
• Removal of restrictions wherein 70.0% of the components
were to be sourced from domestic suppliers.
• Improves scope for acquisitions of/partnerships with
domestic component manufacturers.
• Domestic investment to continue in the development of
indigenous wind turbine manufacturing as companies
target overseas markets.
FDI to improve as restrictions on foreign investment is relaxed;
however, domestic investment is likely to dominate
FDI to improve as restrictions on foreign investment is relaxed;
however, domestic investment is likely to dominate
Domestic Investment
90.0%
Foreign Investment
10.0%
66 Investment Patterns in Asia Pacific (Contd…)
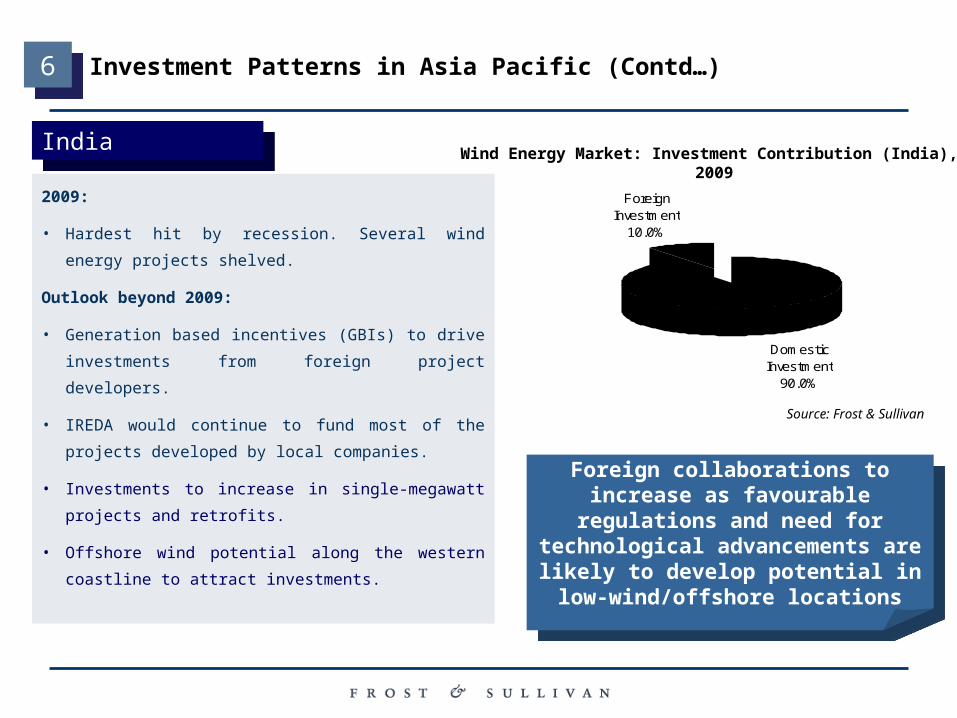
IndiaIndia
2009:
• Hardest hit by recession. Several wind energy projects
shelved.
Outlook beyond 2009:
• Generation based incentives (GBIs) to drive investments
from foreign project developers.
• IREDA would continue to fund most of the projects
developed by local companies.
• Investments to increase in single-megawatt projects and
retrofits.
• Offshore wind potential along the western coastline to
attract investments.
Wind Energy Market: Investment Contribution (India), 2009
Source: Frost & Sullivan
Foreign collaborations to increase as favourable regulations and need for
technological advancements are likely to develop potential in
low-wind/offshore locations
Foreign collaborations to increase as favourable regulations and need for
technological advancements are likely to develop potential in
low-wind/offshore locations
Domestic Investment
92.0%
Foreign Investment
8.0%
66 Investment Patterns in Asia Pacific (Contd…)
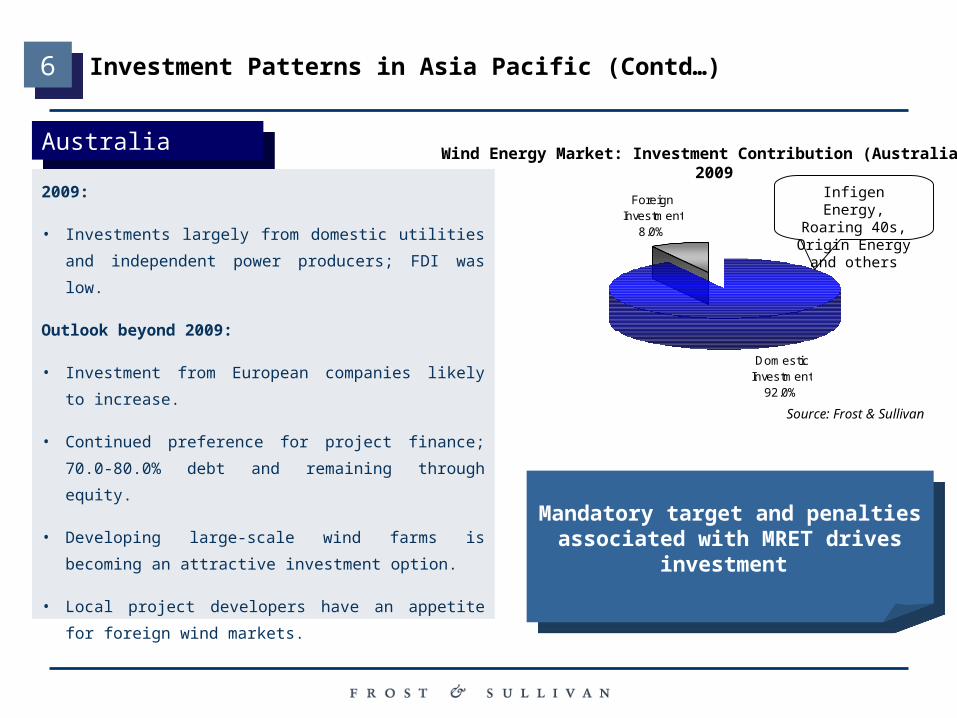
AustraliaAustralia
2009:
• Investments largely from domestic utilities and
independent power producers; FDI was low.
Outlook beyond 2009:
• Investment from European companies likely to increase.
• Continued preference for project finance; 70.0-80.0% debt
and remaining through equity.
• Developing large-scale wind farms is becoming an
attractive investment option.
• Local project developers have an appetite for foreign wind
markets.
Wind Energy Market: Investment Contribution (Australia), 2009
Source: Frost & Sullivan
Mandatory target and penalties associated with MRET drives
investment
Mandatory target and penalties associated with MRET drives
investment
Infigen Energy, Roaring 40s, Origin Energy and others

For Additional Information
Donna JeremiahCorporate CommunicationsAsia Pacific+603 6204 [email protected]
Carrie LowCorporate CommunicationsAsia Pacific+603 6204 [email protected]
Suchitra SriramProgram ManagerEnergy & Power Systems+91 44 4204 [email protected]

FROST & SULLIVAN
A GLOBAL GROWTH CONSULTING COMPANY