WIND Telecomunicazioni - Windgroup · WIND Telecomunicazioni First Half 2015 Results Delivering...
20
WIND Telecomunicazioni First Half 2015 Results Delivering Solid Performance August 7, 2015
Transcript of WIND Telecomunicazioni - Windgroup · WIND Telecomunicazioni First Half 2015 Results Delivering...

WIND Telecomunicazioni First Half 2015 Results
Delivering Solid Performance
August 7, 2015
2
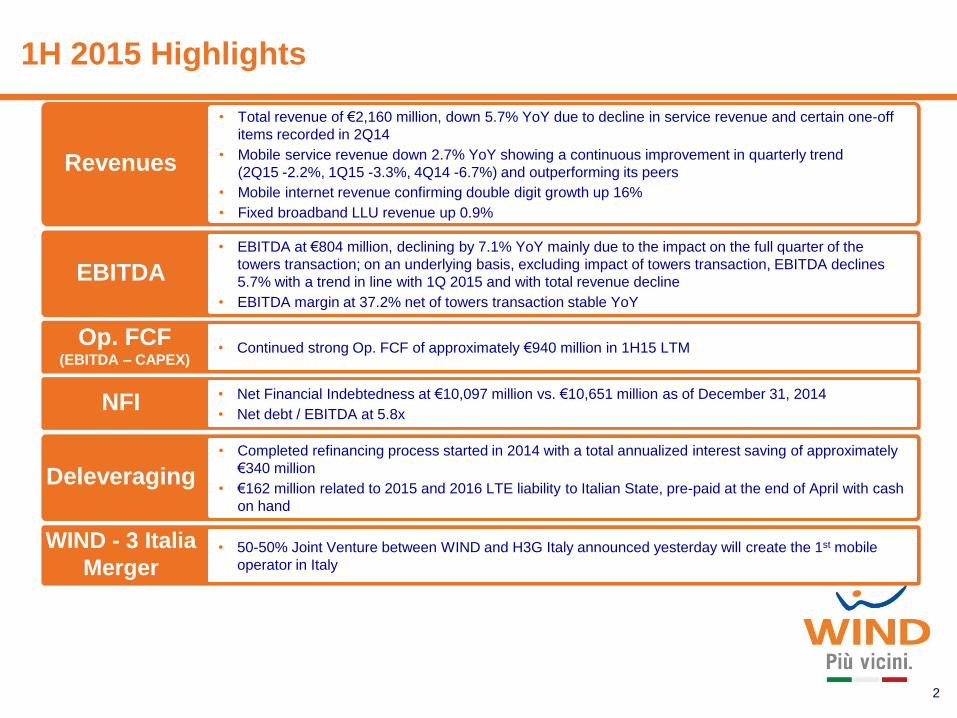
1H 2015 Highlights
Revenues
• Total revenue of €2,160 million, down 5.7% YoY due to decline in service revenue and certain one-off
items recorded in 2Q14
• Mobile service revenue down 2.7% YoY showing a continuous improvement in quarterly trend
(2Q15 -2.2%, 1Q15 -3.3%, 4Q14 -6.7%) and outperforming its peers
• Mobile internet revenue confirming double digit growth up 16%
• Fixed broadband LLU revenue up 0.9%
EBITDA
• EBITDA at €804 million, declining by 7.1% YoY mainly due to the impact on the full quarter of the
towers transaction; on an underlying basis, excluding impact of towers transaction, EBITDA declines
5.7% with a trend in line with 1Q 2015 and with total revenue decline
• EBITDA margin at 37.2% net of towers transaction stable YoY
Op. FCF (EBITDA – CAPEX)
• Continued strong Op. FCF of approximately €940 million in 1H15 LTM
NFI • Net Financial Indebtedness at €10,097 million vs. €10,651 million as of December 31, 2014
• Net debt / EBITDA at 5.8x
Deleveraging
• Completed refinancing process started in 2014 with a total annualized interest saving of approximately
€340 million
• €162 million related to 2015 and 2016 LTE liability to Italian State, pre-paid at the end of April with cash
on hand
WIND - 3 Italia
Merger • 50-50% Joint Venture between WIND and H3G Italy announced yesterday will create the 1st mobile
operator in Italy
3
Mobile Market Share* New Era for Italian Telecoms
WIND-3 Italia Merger: Creating the 1st mobile operator in Italy
• More than 31 million mobile customers and 2.8
fixed customers of which 2.2 million broadband
• N° 1 mobile operator in Italy with a combined
market share of approximately 36%*
• Leading fixed-line alternative broadband operator in
Italy
• Enhanced convergence opportunity thanks to a
larger scale
• Innovative, integrated fixed and mobile services to
consumer and B2B customers
• Improved distribution footprint and CRM
opportunities
* As of March 2015, excluding MVNO’s
32%
36%
34%
35% 34%
29%
2010 2011 2012 2013 2014 1Q 2015
WIND + 3 Italia Telecom Italia Vodafone
Investment and Innovation
• Superior customer experience through best-in-class
service quality and focus on digital innovation
• Enlarged and improved network
• Accelerated roll-out of 4G/LTE services
• Expansion of LLU footprint and fiber offering
4
* Source: CSC (Sep ‘14), ISTAT (Nov ‘14)
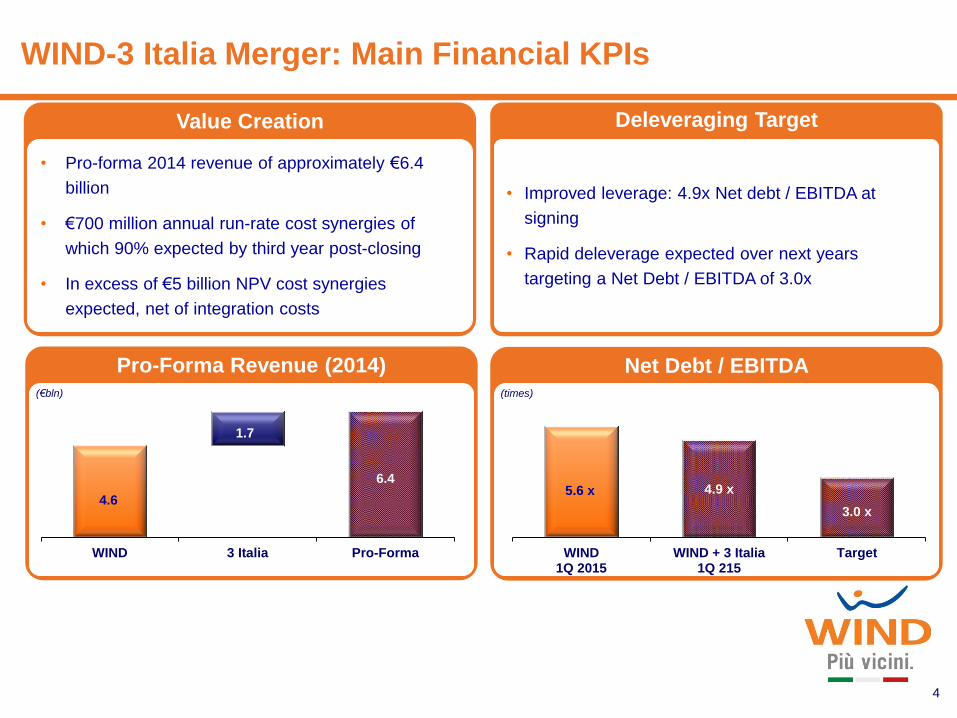
Deleveraging Target
Pro-Forma Revenue (2014) Net Debt / EBITDA
Value Creation
• Pro-forma 2014 revenue of approximately €6.4
billion
• €700 million annual run-rate cost synergies of
which 90% expected by third year post-closing
• In excess of €5 billion NPV cost synergies
expected, net of integration costs
• Improved leverage: 4.9x Net debt / EBITDA at
signing
• Rapid deleverage expected over next years
targeting a Net Debt / EBITDA of 3.0x
4.6
6.4
1.7
WIND 3 Italia Pro-Forma
5.6 x 4.9 x
3.0 x
WIND1Q 2015
WIND + 3 Italia1Q 215
Target
(€bln) (times)
WIND-3 Italia Merger: Main Financial KPIs

Highlights
Transaction Structure
• 50-50% JV of VimpelCom (VIP) and CK Hutchison Holdings (CKHH)
• VIP to contribute WIND with its existing debt
• CKHH to contribute 3 Italia on a cash and debt free basis
• No further cash contributions expected from VIP or CKHH
• Transaction conditional on parties being satisfied with regulatory approvals
Timing
• Expected closing within next 12 months subject to receiving clearance from relevant authorities
• Filing with European and Italian authorities
Management
• Company to be led by Maximo Ibarra, with an experienced combined management team
Governance
• Substantive shareholder agreement to ensure successful JV
• Board consisting of 6 directors (3 nominated by VIP, 3 by CKHH)
• Chairman rotating every 18 months, with casting vote to ensure no grid lock, first appointed by
CKHH
5
VIP CKHH
50% 50%
Holdco
WIND 3 Italia
WIND-3 Italia Merger: Key Transaction Highlights
6
* Source: CSC (Sep ‘14), ISTAT (Nov ‘14)
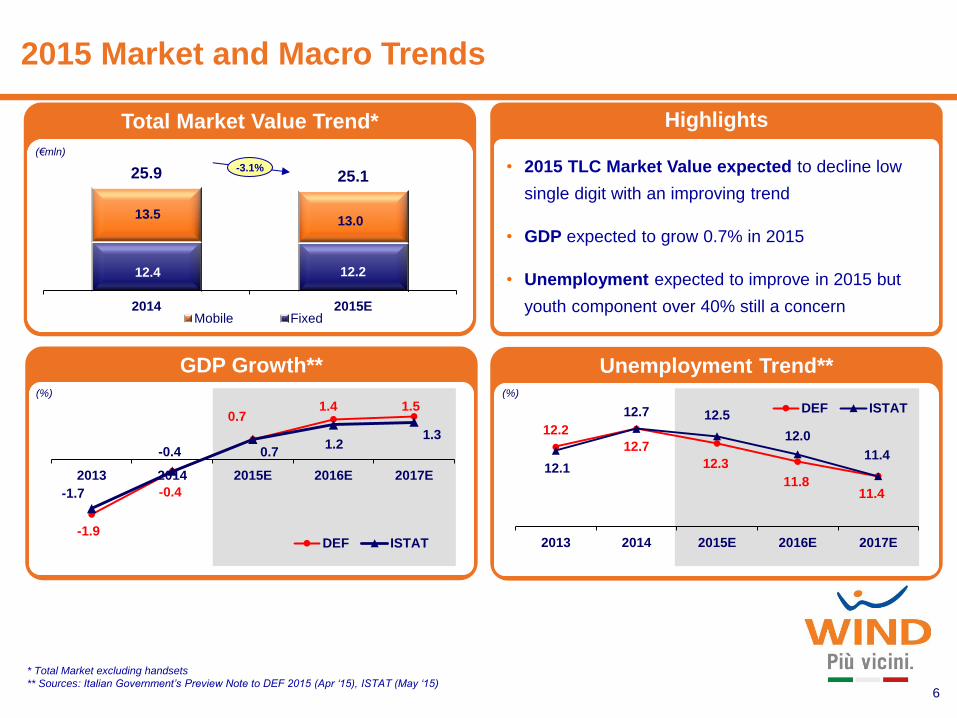
2015 Market and Macro Trends
Highlights
GDP Growth** Unemployment Trend**
12.2
12.7
12.3
11.8 11.4
12.1
12.7 12.5
12.0
11.4
2013 2014 2015E 2016E 2017E
DEF ISTAT
-1.9
-0.4
0.7 1.4 1.5
-1.7
-0.4 0.7 1.2
1.3
2013 2014 2015E 2016E 2017E
DEF ISTAT
• 2015 TLC Market Value expected to decline low
single digit with an improving trend
• GDP expected to grow 0.7% in 2015
• Unemployment expected to improve in 2015 but
youth component over 40% still a concern
Total Market Value Trend*
(€bln)
* Total Market excluding handsets
** Sources: Italian Government’s Preview Note to DEF 2015 (Apr ‘15), ISTAT (May ‘15)
(%) (%)
12.4 12.2
13.5 13.0
25.9 25.1
2014 2015EMobile Fixed
-3.1%
(€mln)

7
* Mobile Internet includes customers that have performed at least one mobile Internet event in the previous month
** Mobile average data usage measured on mobile Internet users
Outperforming in Mobile Data
Highlights
• Strong performance in data revenue with double digit
growth YoY
• Mobile internet customer base continues to increase
+13.5%
• 1.4 GB average monthly usage of active customers: 4G
data customers monthly data usage 1.5 times the
average data user
•
Mobile Internet Revenue
Mobile Internet CB*
269 312
1H 2014 1H 2015
9.7 11.0
1H 2014 1H 2015
(€mln)
(mln)
+13.5%
+16.0%
Upselling Growing Data Demand**
1.1 1.2
1.3 1.2
1.4 1.4
1Q 14 2Q 14 3Q 14 4Q 14 1Q 15 2Q 15
(GB month)
Basic
bundle
allowance
1 GB
8
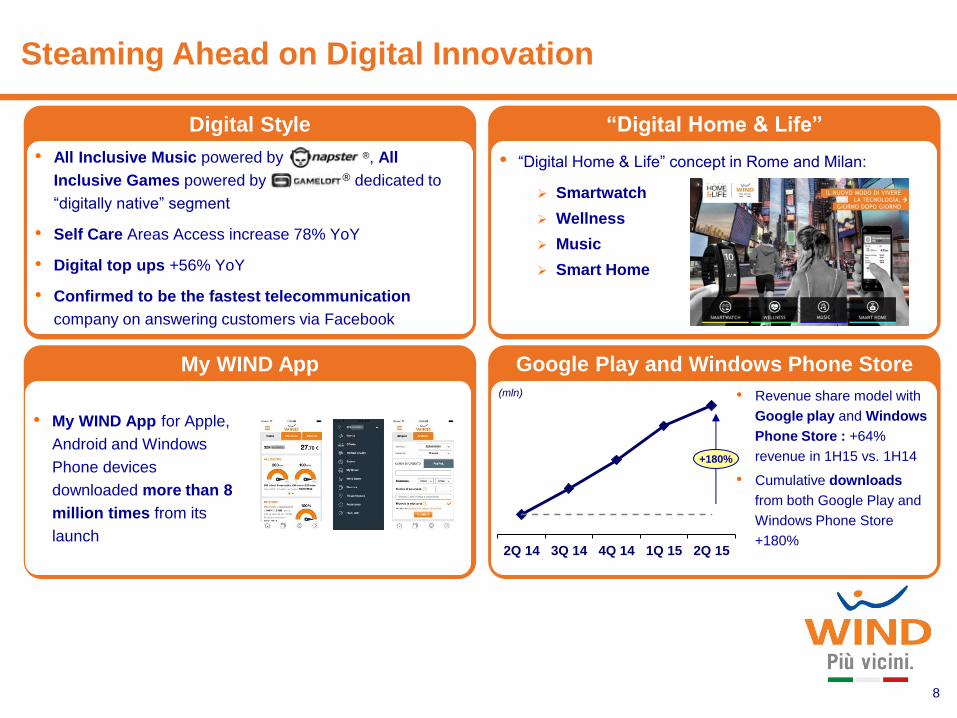
Steaming Ahead on Digital Innovation
Digital Style
• All Inclusive Music powered by ®, All
Inclusive Games powered by ® dedicated to
“digitally native” segment
• Self Care Areas Access increase 78% YoY
• Digital top ups +56% YoY
• Confirmed to be the fastest telecommunication
company on answering customers via Facebook
My WIND App
• My WIND App for Apple,
Android and Windows
Phone devices
downloaded more than 8
million times from its
launch
“Digital Home & Life”
• “Digital Home & Life” concept in Rome and Milan:
Smartwatch
Wellness
Music
Smart Home
Google Play and Windows Phone Store
• Revenue share model with
Google play and Windows
Phone Store : +64%
revenue in 1H15 vs. 1H14
• Cumulative downloads
from both Google Play and
Windows Phone Store
+180% 2Q 14 3Q 14 4Q 14 1Q 15 2Q 15
+180%
(mln)
CAPEX
9
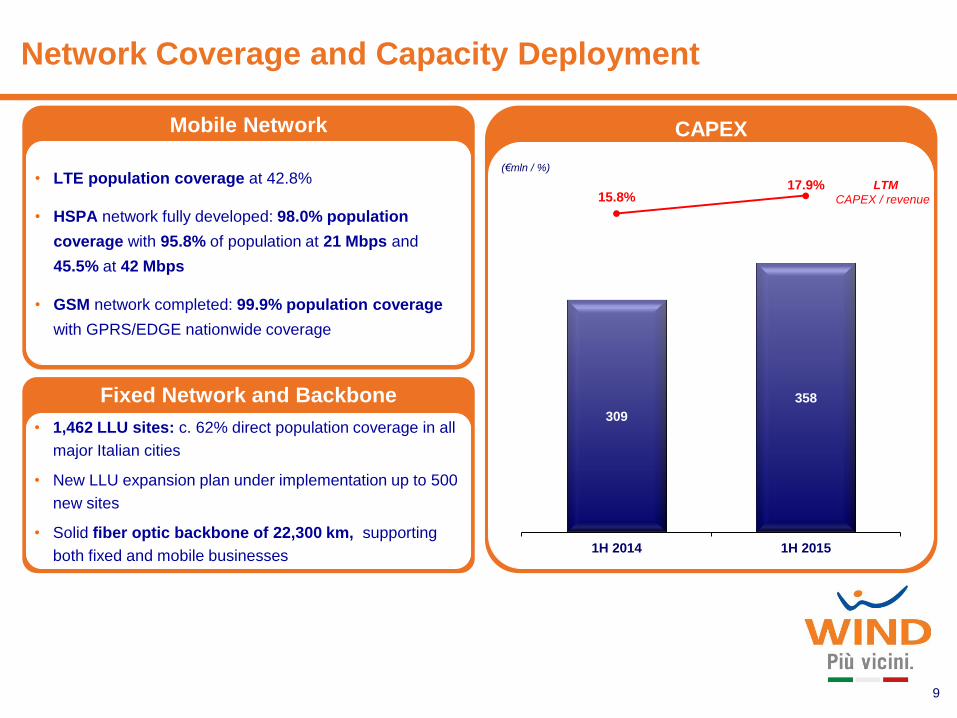
Network Coverage and Capacity Deployment
309
358
1H 2014 1H 2015
LTM
CAPEX / revenue
(€mln / %)
15.8% 17.9%
Mobile Network
• LTE population coverage at 42.8%
• HSPA network fully developed: 98.0% population
coverage with 95.8% of population at 21 Mbps and
45.5% at 42 Mbps
• GSM network completed: 99.9% population coverage
with GPRS/EDGE nationwide coverage
Fixed Network and Backbone
• 1,462 LLU sites: c. 62% direct population coverage in all
major Italian cities
• New LLU expansion plan under implementation up to 500
new sites
• Solid fiber optic backbone of 22,300 km, supporting
both fixed and mobile businesses

10
Solid Mobile Commercial Performance
Highlights
• Mobile customer base at 21.4 million declining
2.3% YoY
• Stable market share
• Total ARPU stable YoY at €11.0 increasing
versus previous quarter after more than 5 years
trend of decline in the overall market, confirming
WIND’s expectation of market recovery
• Data ARPU accounting 42% of total ARPU
increasing 8% completely offsetting the decline in
voice ARPU
Customer Base
ARPU
21.9 21.4
1H 2014 1H 2015
11.0 11.0
1H 2014 1H 2015
-2.3%
stable
% Data
on Total
(mln)
38.6% 41.6%
(€ / %)

11
Stable Performance in Fixed-Line
Voice Subscribers
Dual-play Subscribers
487 422
2,415 2,391
1H 2014 1H 2015
Indirect
Direct -1.0%
2,902 (‘000)
2,814
Broadband Subscribers
Highlights
• Fixed customer base decline mainly due to contraction of
indirect segment as a consequence of the company focus
on the direct CB
• Direct customer base marginal decline (-1.0%)
• Fixed Broadband customers up 1.5% with solid LLU
performance
• Higher value dual play customers increasing 3.9% to
almost 2 million customers
(‘000)
2,180 2,212
1H 2014 1H 2015
+1.5%
1,881 1,954
1H 2014 1H 2015
+3.9%
(‘000)
1H 2015 Financial
Performance
13
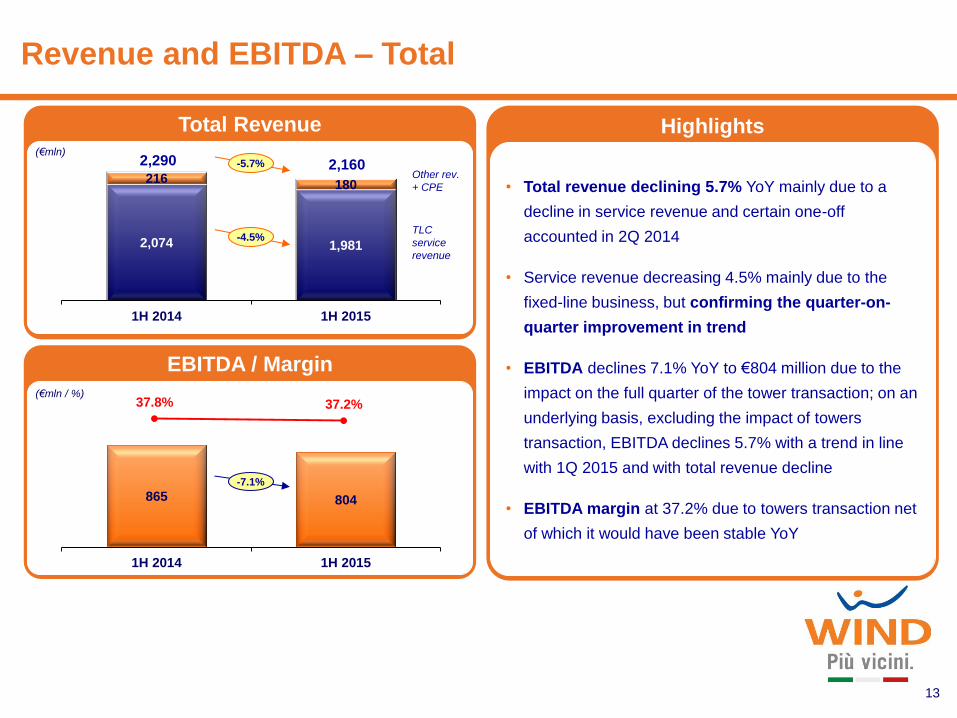
Revenue and EBITDA – Total
Highlights
• Total revenue declining 5.7% YoY mainly due to a
decline in service revenue and certain one-off
accounted in 2Q 2014
• Service revenue decreasing 4.5% mainly due to the
fixed-line business, but confirming the quarter-on-
quarter improvement in trend
• EBITDA declines 7.1% YoY to €804 million due to the
impact on the full quarter of the tower transaction; on an
underlying basis, excluding the impact of towers
transaction, EBITDA declines 5.7% with a trend in line
with 1Q 2015 and with total revenue decline
• EBITDA margin at 37.2% due to towers transaction net
of which it would have been stable YoY
Total Revenue
EBITDA / Margin
2,074 1,981
216 180
1H 2014 1H 2015
(€mln / %)
2,290 (€mln)
Other rev.
+ CPE
TLC
service
revenue
865 804
1H 2014 1H 2015
37.8% 37.2%
-5.7%
-4.5%
-7.1%
2,160

14
Revenue and EBITDA – Mobile
Highlights
• Total mobile revenue declining 4.8% with a further
improvement in service revenue trend
• Service revenue down 2.7%YoY showing a significant
improvement in trend QoQ (2Q15 -2.2%, 1Q15 -3.3%,
4Q14 -6.7%)
• Strong performance in mobile Internet with revenue up
16.0%
• EBITDA decreasing 7.8% due to the impact on the full
quarter of the tower transaction
• EBITDA Margin at 40.4% due to the towers transaction
impact net of which it would have been almost stable
Total Revenue
EBITDA / Margin
(€mln / %)
(€mln)
692 639
1H 2014 1H 2015
41.7% 40.4%
-7.8%
1,465 1,425
194 155
1H 2014 1H 2015
1,660 -4.8% 1,580
-2.7%
Other rev.
+ CPE
TLC
service
revenue

15
Revenue and EBITDA – Fixed-Line
Highlights
• Total fixed-line revenue declining 8.1% YoY with
service revenue decrease of 8.8% due to the decline in
voice volumes as a result of the decrease in pay per
use traffic coming from the increased penetration of
bundles
• EBITDA at €165 million decreasing 4.5% YoY mainly
due to the decline in revenue
• EBITDA margin increasing 1.1 p.p. to 28.4%
Total Revenue
EBITDA / Margin
609 556
22 24
1H 2014 1H 2015
(€mln / %)
(€mln)
173 165
1H 2014 1H 2015
27.4% 28.4%
-8.1%
-8.8%
-4.5%
631
Other rev.
+ CPE
TLC
service
revenue
580
16
P&L Highlights
P&L 1H 2015
(€mln) 1H 2015 1H 2014Change
(%)Highlights
Revenues 2,103 2,186 (3.8)%
Other revenues 57 104 (45.2)%
Total Revenues 2,160 2,290 (5.7)%
EBITDA 804 865 (7.1)%
D&A (104) (612) n.m.D&A impacted by the capital gain arising from the towers transaction in
1Q 2015
EBIT 700 253 n.m.
Financial Income and
expenses(276) (695) n.m.
Financial Income reflects interest savings resulting from 2014 and 2015
refinancing transactions
EBT 424 (442) n.m.
Income Tax (57) 39 n.m. Increase in Income tax due to higher taxable income
Net result 367 (403) n.m.
17
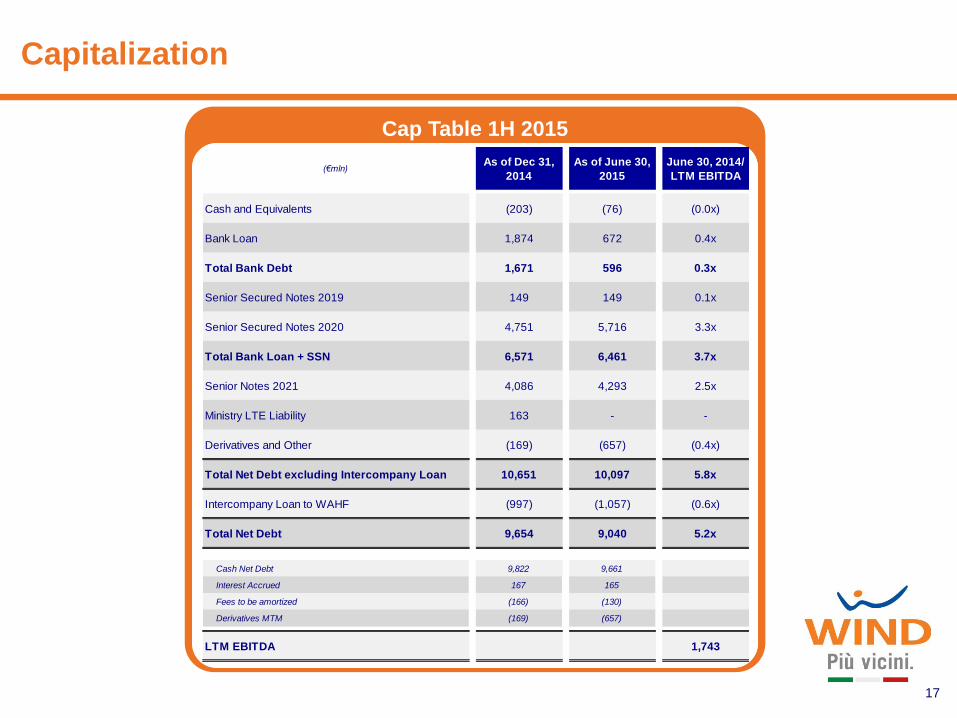
Capitalization
Cap Table 1H 2015
(€mln)As of Dec 31,
2014
As of June 30,
2015
June 30, 2014/
LTM EBITDA
Cash and Equivalents (203) (76) (0.0x)
Bank Loan 1,874 672 0.4x
Total Bank Debt 1,671 596 0.3x
Senior Secured Notes 2019 149 149 0.1x
Senior Secured Notes 2020 4,751 5,716 3.3x
Total Bank Loan + SSN 6,571 6,461 3.7x
Senior Notes 2021 4,086 4,293 2.5x
Ministry LTE Liability 163 - -
Derivatives and Other (169) (657) (0.4x)
Total Net Debt excluding Intercompany Loan 10,651 10,097 5.8x
Intercompany Loan to WAHF (997) (1,057) (0.6x)
Total Net Debt 9,654 9,040 5.2x
Cash Net Debt 9,822 9,661
Interest Accrued 167 165
Fees to be amortized (166) (130)
Derivatives MTM (169) (657)
LTM EBITDA 1,743

18 Notional amounts. USD tranche has been converted at CCS EUR/USD Exchange Rate
1H 2015
(€mln)
775 700
3,513
150
425
575
3,779
2015 2016 2017 2018 2019 2020 2021
Tap to SSN 2020 + FRN 2020 New Senior Credit Facility New Senior Secured Notes 2020 Senior Secured FRN
Senior Secured Notes 2020 New FRN 2020 New Senior Notes 2021
Highly Efficient Debt Maturity Profile
Thank You
Q&A
19
This document contains “forward-looking statements”, as the phrase is defined in Section 27A of the Securities Act of 1933, as
amended, and Section 21E of the Securities Exchange Act of 1934, as amended. These statements relate to, among other things,
future market developments and trends, anticipated benefits from the Italy transaction, the ability to complete the Italy transaction and
anticipated interest cost savings. The forward-looking statements included in this presentation are based on management’s best
assessment of the Company’s strategic and financial position and of future market conditions and trends. These discussions involve
risks and uncertainties. The actual outcome may differ materially from these statements as a result of economic volatility, unforeseen
developments from competition, governmental regulation of the telecommunications industries.
20
Disclaimer


![Annual lists of contractors [2004-2013]...FM SERVIZI SCARL Operational Services for EFSA 1,216,368.25 € WIND TELECOMUNICAZIONI SPA Fixed Telephony and Data Services 204,848.61 €](https://static.fdocuments.in/doc/165x107/5fb1455ae3951a00ee4c9078/annual-lists-of-contractors-2004-2013-fm-servizi-scarl-operational-services.jpg)