Wind Power Report 2010
50
© ABS Energy Research 2010 The Wind Power Re port Seventh Edition, 2010
Transcript of Wind Power Report 2010

8/3/2019 Wind Power Report 2010
http://slidepdf.com/reader/full/wind-power-report-2010 1/50
© ABS Energy Research 2010
The Wind Power Report
Seventh Edition, 2010

8/3/2019 Wind Power Report 2010
http://slidepdf.com/reader/full/wind-power-report-2010 2/50
Page 2 of 6
The Wind Power Report
Seventh Edition, 2010
Introduction
This report provides an outline of the world wind energy industry and market, with market
surveys of each of 5 major markets and 21 intermediate markets, together with national
policies and support plans and incentives. Analysis of the manufacturing base, supply chain,
wind power developers and owners.Historical analysis from 1990 and forecasts of capacity
to 2012, with forecasts to 2020 for the major markets. National targets and incentives arelisted. Factors affecting wind power are outlined and crucial issues such as variability and
intermittency, dispatchability, capacity factors and capacity credits are discussed and as-
sessed.
Outline of the report:* please see table of contents for further details
• The development of wind energy: the market in 2009
• The future of wind power, 2009 to 2012
• Assessment of factors affecting wind power; terminology, issues and the opera-
tional experience of the most experienced wind power operators
• National policies for renewable energy – targets, support mechanisms, RPS policy
and feed-in tariffs
• National wind power markets – comprehensive surveys of the 5 market leaders, sur-
vey of the 21 intermediate wind power markets, brief profiles of 22 new entrants
• Wind Industry Supply Chain- vertical integration, supply chain in the electro-
technical industry, raw material, lead times, turbine production capacity, compo-
nents balance of plant, tire 1 and tier 2 – rotor blades, gear boxes, bearings, cast
iron and forged components, towers, transformers
• O&M issues and delays
• The rare earths supply crisis
• Weather forecasting
• Energy storage
• Development of wind turbine size
• Wind Farm Developers and Owners
• Manufacturing Base
• Off-Shore Wind Power
• Promising technologies

8/3/2019 Wind Power Report 2010
http://slidepdf.com/reader/full/wind-power-report-2010 3/50
Page 3 of 6
Executive Summary
2009 was a record year for offshore wind investment, which ABS feels is unwarranted given
the major bottlenecks in the offshore supply chain – a lack of offshore vessels and subsea
cabling. In the onshore sector there are no immediate supply chain bottlenecks. However,
the growing trend towards large scale turbines may be slowed somewhat in 2010 due to the
logistics of transporting large, bulky turbines and the high costs involved. Additionally, larger
turbines require the use of expensive carbon fibres and specialised plastics to replace cheap
glass fibre used in small scale turbines. Supplies of carbon fibres may hit a bottleneck by
2017.
With the sector entering the mature phase, there is a greater pressure towards the stan-
dardisation of components especially because of the sector’s high operating and mainte-
nance costs. To reduce high O&M costs many developers are opting to purchase gearless
rather than geared turbines. However, gearless turbines use neodymium, which hit the
headlines recently due to concerns that China’s export policy for rare earth metals would
lead to near term supply shortages.
On the plus side, for European and American manufacturers, competition from manufactur-
ers shipping products from India and China is unlikely to affect their dominance in local
markets. Due to the high costs of transporting turbines and towers, and uncertainty over
whether carbon emissions reductions will apply to the shipping sector, localised supply
chains will be the future of the sector. Complete supply chains have already formed in North
America, Europe and Asia.
Overall 2010 is expected to be a good year for the wind sector, especially in the China, the
USA and Eastern Europe.
Lack of access to financing and poor grid infrastructure still remains as the biggest barrier to
project development.

8/3/2019 Wind Power Report 2010
http://slidepdf.com/reader/full/wind-power-report-2010 4/50
Page 4 of 6
ABS Intelligence: Market Highlights
2009
The Chinese and American markets performed well, along with some emerging markets -
notably Mexico, Canada, Chile, Poland and a few other Eastern European countries.
More mature markets of Japan and the EU experienced slow, and in some cases no growth
at all.
Repowering happened at a slower rate than anticipated because of height restrictions on
planning permission for some sites, and most turbines are not yet past the 15 year mark.
Offshore wind took off; however, no measures were in place to ease bottlenecks in the
supply chain – mainly an anticipated shortage of all types of vessels (installation, O&M etc.)
and subsea cabling. No supply shortage is likely for onshore wind sector.
2010 and Beyond
Continued growth in the sector is expected with gearless turbines performing well particu-
larly in the offshore sector, due to their lower operation and maintenance costs.
Several countries may experience slowed growth due to the removal of government incen-
tives, stricter planning or approval regulations or an uncertain political climate – Canada
(non-renewal of EcoEnergy), Greece, Spain (introduction of Registry) etc., with the anticipa-
tion of less generous subsidies in Italy and other European countries in the future.
Growth in Eastern Europe, South American and North African countries is expected but
concerns about grid capacity will mean that many targets for 2015 will not be met.
Key markets for growth include Finland, Morocco and Turkey.
Manufacturers will experience moderate growth. Several manufacturers have unused stock
from 2010 and will not actually manufacture that much new capacity. REpower may per-
form well with its 5 MW turbine along with Chinese companies producing large, certified
turbines.
Chinese manufacturers are likely to enter the export market in a big way because there has
been a shift from licensing technology with export restrictions to forming joint venture and
conducting in-house research.
This year may see some turbine manufacturers acquiring offshore suppliers (especially
cabling and vessel manufacturers), and developers acquiring more offshore companies to
ensure security of supply.

8/3/2019 Wind Power Report 2010
http://slidepdf.com/reader/full/wind-power-report-2010 5/50
Page 5 of 6
More repowering is expected in Europe as there is a significant international market for
used turbines and limited on land sites with good wind resources.
Barriers to Development
Growth in demand for gearless turbines in 2015 and beyond will be hampered by shortage
of the rare earth metal neodymium. China may further restrict exports in the next year or
two because of domestic needs, and government initiatives worldwide to source local or
international supplies will not bridge the supply gap. It is estimated that it will take 15 years
before a decent US rare earth metal industry is in place.
A supply shortage of carbon fibres may hit the sector from 2017 onwards - carbon fibres are
used to reinforce the blades of large turbines.
But, by far, the biggest barrier to development is a poor grid infrastructure. In some Eastern
European countries the grid system can’t cope with any more than 3 GW of installed capac-
ity without significant investments in the infrastructure e.g. Poland (3GW maximum), Czech
Republic (1.2 GW) and Hungary (330 MW). This problem applies to most wind markets. Even
when the grid has sufficient capacity of installed projects, intermittency is a huge issue
despite denials by the wind industry. Last year there was almost a blackout in Texas because
of a sudden loss of wind. In Spain wind turbine had to be switched off due to over-supply in
the night at time of minimum demand and the spot price of electricity fell to zero.
With the exception of chemical storage of heat for the solar sector, few of the energy
storage technologies are close to commercialisation. Pumped hydro storage looks the most
promising, especially as there are over a hundred pumped storage facilities in operation in
China.
Turbine Size
The maximum turbine size in operation is 6.5 MW onshore and a 20 MW turbine has been
developed. Clipper is planning to manufacturer its 7.5 MW turbine in 2012, with both
Clipper and Sway developing a 10 MW prototype.
Although, very large turbines are unlikely to be commercially viable because they require
special reinforced materials, bespoke lifting vehicles and the logistics of transporting the
turbines will eventually hamper growth in turbine size.
ABS Intelligence Projects the Following
Slowed growth in developing megawatt turbines with efforts focused on streamlining
products- reducing the number of parts, increasing efficiency etc, because of the high
operation costs of gearboxes and turbine parts.

8/3/2019 Wind Power Report 2010
http://slidepdf.com/reader/full/wind-power-report-2010 6/50
Page 6 of 6
More M&A’s to secure “local” supply chains for wind turbine manufacturers.
Expect growth in cold weather countries following the development of cold resilient tur-bines, Finland and Russia, for example.
Price of report - £2,150
*For US Dollar and Euro prices please refer to www.absenergyresearch.com
*To purchase this report please complete the order form or for more information please
contact: [email protected] or call +44(0) 20 8432 6378

8/3/2019 Wind Power Report 2010
http://slidepdf.com/reader/full/wind-power-report-2010 7/50
Page 3 of 695
Table of Contents
Executive Summary ............................................................................................................41 Wind power development in 2009 ................................ ................................ .............. 41 Wind power development in 2010 ................................ ................................ .............. 42 Outlook to 2012 ................................ ................................ ................................ .......... 42 Offshore developments to 2012 ................................ ................................ .................. 43 Long term outlook: 2020. ................................ ................................ ............................ 43 Renewables subsidies................................ ................................ ................................ .. 44 Manufacturing base ................................ ................................ ................................ .... 44 Developers ................................ ................................ ................................ .................. 45 Turbine technology ................................ ................................ ................................ ..... 45
1 The development of wind energy: the market in 2010...............................................47 1.1 Market value................................ ................................ ................................ .... 51 1.2 Regional Analysis ................................ ................................ ............................. 51
1.2.1 Europe ................................ ................................ ................................ ..... 51 1.2.2 North America................................ ................................ .......................... 52 1.2.3 Latin America ................................ ................................ ........................... 53 1.2.4 Asia ................................ ................................ ................................ .......... 53 1.2.5 Pacific................................ ................................ ................................ ....... 53 1.2.6 Africa and Middle East ................................ ................................ ............. 53
2 The future market for wind power; until 2012 ...........................................................59 3 An assessment of factors affecting wind power .........................................................66
3.1 Terminology................................ ................................ ................................ ..... 66 3.1.1 Variations of demand ................................ ................................ ............... 66 3.1.2 Base load................................ ................................ ................................ .. 67 3.1.3 Peak load ................................ ................................ ................................ . 67 3.1.4
Intermediate load ................................ ................................ .................... 68

8/3/2019 Wind Power Report 2010
http://slidepdf.com/reader/full/wind-power-report-2010 8/50
Page 4 of 695
3.1.5 Intermittency and variability ................................ ................................ .... 68 3.1.6 Capacity factor ................................ ................................ ......................... 69 3.1.7 Loss of Load Probability (LOLP)................................ ................................ . 70 3.1.8 Capacity credit ................................ ................................ ......................... 70 3.1.9 Spinning reserve................................ ................................ ....................... 71
3.2 Issues for wind power ................................ ................................ ...................... 72 3.2.1 Grid balancing ................................ ................................ .......................... 72 3.2.2 Grid extension................................ ................................ .......................... 73 3.2.3 Storage................................ ................................ ................................ ..... 73 3.2.4 Capacity credit ................................ ................................ ......................... 73 3.2.5 Mis-match of supply and demand ................................ ............................ 74 3.2.6 Load following................................ ................................ .......................... 74 3.2.7 Dispersion ................................ ................................ ................................ 74 3.2.8 Inadequacy of weather forecasting ................................ .......................... 74 3.2.9 Spinning reserve/back-up................................ ................................ ......... 74 3.2.10 Wake effects ................................ ................................ ............................ 74
3.3 The operational experiences of wind power ................................ .................... 75 3.3.1 E.On Netz Wind Report, 2004................................ ................................ ... 75 3.3.2 Grid balancing ................................ ................................ .......................... 80 3.3.3 Grid balancing congestion ................................ ................................ ........ 80 3.3.4 E.On Netz Wind Report, 2005................................ ................................ ... 81 3.3.5 E.On conclusions about wind power................................ ......................... 81 3.3.6 Western Denmark 2005 ................................ ................................ ........... 82 3.3.7 ESB report in Ireland 2004................................ ................................ ........ 83 3.3.8 USA experience ................................ ................................ ........................ 83 3.3.9 Spain ................................ ................................ ................................ ........ 84 3.3.10 ENTSO-E................................ ................................ ................................ ... 85 3.3.11 Reduction in carbon emissions ................................ ................................ . 86 3.3.12 EU legislation, April 2009................................ ................................ .......... 86

8/3/2019 Wind Power Report 2010
http://slidepdf.com/reader/full/wind-power-report-2010 9/50
Page 5 of 695
3.3.13 Building consent times ................................ ................................ ............. 92 3.4 THE WAY FORWARD ................................ ................................ ........................ 93
3.4.1 3.1. Investing in the future competitiveness of the EU wind energy
industry................................ ................................ ................................ .. 93 3.4.2 3.2. Adopting a more strategic, coordinated approach to offshore
developments ................................ ................................ ........................ 96 3.4.3 3.3. Maximising the environmental benefits of offshore wind.................. 97 3.4.4 3.4. Integrating large-scale offshore wind in the grid of the future ........... 98 3.4.5
Copenhagen ................................ ................................ ............................. 99
3.4.6 Targets ................................ ................................ ................................ ..... 99 3.4.7 The Flexible Mechanisms ................................ ................................ ....... 100 3.4.8 Technology transfer ................................ ................................ ............... 101
4 National policies for renewable energy .................................................................... 102 4.1 Renewable energy targets ................................ ................................ ............. 102 4.2 Support mechanisms for renewables ................................ ............................. 103 4.3 The evolution of RPS Policy in the United States ................................ ............ 131 4.4 Comparison of feed-in tariffs and RPS ................................ ............................ 133 4.5 Europe the EU Renewable Energy Directive ................................ ................ 133 4.6 Investor confidence, price, and policy cost................................ ..................... 133 4.7 Effectiveness................................ ................................ ................................ .. 134 4.8 Innovation and technology diversity ................................ .............................. 134 4.9 Ownership structure ................................ ................................ ...................... 134 4.10 Conclusion ................................ ................................ ................................ ..... 134 4.11 Feed-in tariffs in the United States................................ ................................ . 135
5 National wind power markets and support plans: Major markets ...........................137 5.1 United States ................................ ................................ ................................ . 137
5.1.1 The start of wind power ................................ ................................ ......... 138 5.1.2 Market size and forecast ................................ ................................ ........ 139 5.1.3 Offshore................................ ................................ ................................ . 154

8/3/2019 Wind Power Report 2010
http://slidepdf.com/reader/full/wind-power-report-2010 10/50
Page 6 of 695
5.1.4 Intermittency ................................ ................................ ......................... 158 5.1.5 Grid Infrastructure ................................ ................................ ................. 158 5.1.6 Manufacturers ................................ ................................ ....................... 159 5.1.7 Ownership of facilities................................ ................................ ............ 167 5.1.8 The US small wind market ................................ ................................ ...... 170 5.1.9 Low speed wind technology ................................ ................................ ... 170 5.1.10 Cost of wind energy generation................................ .............................. 172 5.1.11 Technology development in the USA................................ ...................... 173
5.1.11.1 Making longer, stronger blades ................................ ................ 174 5.1.11.2 Designing taller towers ................................ ............................. 174 5.1.11.3 Building multi-megawatt turbines................................ ............. 175
5.1.12 Understanding turbulent wind patterns ................................ ................. 175 5.1.13 R&D ................................ ................................ ................................ ....... 176 5.1.14 Government support................................ ................................ .............. 176 5.1.15 Production tax credits ................................ ................................ ............ 177 5.1.16 Investment tax credits................................ ................................ ............ 177 5.1.17 Property tax reductions................................ ................................ .......... 178 5.1.18 Accelerated depreciation ................................ ................................ ....... 178 5.1.19 Direct production incentives ................................ ................................ .. 178 5.1.20 Direct investment incentives (grants) ................................ ..................... 178 5.1.21 Government subsidised loans ................................ ................................ 178 5.1.22 "Standard offer contracts" for small and distributed projects................. 179 5.1.23 Net metering or net billing ................................ ................................ ..... 179 5.1.24 Site prospecting, review and permitting ................................ ................. 179 5.1.25 Renewable Portfolio Standard (RPS)................................ ....................... 179 5.1.26 Auctioned contracts ................................ ................................ ............... 179 5.1.27 Green marketing/pricing ................................ ................................ ........ 179 5.1.28 State mandates ................................ ................................ ...................... 180 5.1.29 The Utility Wind Integration Group ................................ ........................ 180

8/3/2019 Wind Power Report 2010
http://slidepdf.com/reader/full/wind-power-report-2010 11/50
Page 7 of 695
5.1.30 UWIG members as of 14th
April 2010 ................................ ..................... 180 5.1.31 Bills in Congress ................................ ................................ ..................... 183
5.2 China ................................ ................................ ................................ ............. 186 5.2.1 Installed wind capacity ................................ ................................ ........... 186 5.2.2 Future targets ................................ ................................ ........................ 188 5.2.3 Wind resources ................................ ................................ ...................... 188 5.2.4 Barriers to growth ................................ ................................ .................. 190 5.2.5 Present Status of Development ................................ .............................. 191 5.2.6 Future development................................ ................................ ............... 192 5.2.7 Offshore wind power ................................ ................................ ............. 192 5.2.8 Renewable Energy Law 2006 ................................ ................................ .. 196 5.2.9 Chinese government wind development support ................................ ... 197 5.2.10 Wind power concessions................................ ................................ ........ 197 5.2.11 Non-Concession tenders ................................ ................................ ........ 198 5.2.12 2008 amendment................................ ................................ ................... 198 5.2.13 2009 amendment................................ ................................ ................... 199 5.2.14 Feed-in tariffs................................ ................................ ......................... 200 5.2.15 Costs ................................ ................................ ................................ ...... 200 5.2.16 Financing................................ ................................ ................................ 201 5.2.17 Foreign assistance ................................ ................................ .................. 201 5.2.18 Chinese manufacturing capability................................ ........................... 205 5.2.19 Medium and large wind turbines................................ ............................ 205 5.2.20 Chinese wind turbine companies................................ ............................ 206
5.2.20.1 Xinjiang Goldwind Co ................................ ................................ 208 5.2.20.2 Sinovel Wind Co................................. ................................ ....... 209 5.2.20.3 Dongfang Electric Group ................................ ........................... 210 5.2.20.4 Other Chinese wind companies ................................ ................ 211
5.2.21 Micro and small wind turbines ................................ ............................... 211 5.2.22 Bearings ................................ ................................ ................................ . 212

8/3/2019 Wind Power Report 2010
http://slidepdf.com/reader/full/wind-power-report-2010 12/50
Page 8 of 695
5.2.23 Blades ................................ ................................ ................................ .... 212 5.2.24 Gearboxes ................................ ................................ .............................. 213
5.3 Germany ................................ ................................ ................................ ........ 213 5.3.1 Market size and forecast ................................ ................................ ........ 214 5.3.2 Market share in Germany................................ ................................ ....... 215 5.3.3 Repowering trend ................................ ................................ .................. 215 5.3.4 Offshore................................ ................................ ................................ . 217 5.3.5 Wind turbine size ................................ ................................ ................... 225 5.3.6 Regional distribution of wind turbines................................ .................... 227 5.3.7 Wind power and the German TSOs ................................ ........................ 231 5.3.8 Grid infracture................................ ................................ ........................ 233 5.3.9 Government support and R&D in Germany ................................ ............ 233 5.3.10 Stromeinspeisungsgesetz - Electricity Feed Law (EFL) ............................. 234 5.3.11 Renewable Energy Sources Act (Erneuerbare-Energien-Gesetz / EEG).... 234 5.3.12 Investment assistance ................................ ................................ ............ 236 5.3.13 Planning privileges ................................ ................................ ................. 236 5.3.14 250 Megawatt Programme................................ ................................ ..... 236 5.3.15 REISI - A new and further-reaching Information System based on ISEE
and WISY................................ ................................ .............................. 236 5.3.16 Technology area wind energy................................ ................................ . 236 5.3.17 Product information................................ ................................ ............... 236 5.3.18 Development of wind energy use in Germany ................................ ........ 237 5.3.19 Operational results................................ ................................ ................. 237 5.3.20 External conditions of operation ................................ ............................ 237 5.3.21 Download of measured data ................................ ................................ .. 237 5.3.22 El Dorado ................................ ................................ ............................... 238 5.3.23 Regional incentives ................................ ................................ ................ 238 5.3.24 Research and Development (R&D) ................................ ......................... 238 5.3.25 Manufacturing Base ................................ ................................ ............... 238

8/3/2019 Wind Power Report 2010
http://slidepdf.com/reader/full/wind-power-report-2010 13/50
Page 9 of 695
5.4 Spain................................ ................................ ................................ .............. 240 5.4.1 Future targets for wind power in Spain ................................ .................. 241 5.4.2 Onshore resources ................................ ................................ ................. 242 5.4.3 Offshore resources................................ ................................ ................. 245 5.4.4 Intermittancy ................................ ................................ ......................... 246 5.4.5 Manufacturing industry................................ ................................ .......... 248 5.4.6 Wind developers ................................ ................................ .................... 253 5.4.7 Wind turbine size ................................ ................................ ................... 255 5.4.8 Government support in Spain................................ ................................ . 255
5.4.8.1 R&D technology development ................................ .................. 255 5.4.8.2 Guaranteed market price................................ .......................... 256 5.4.8.3 Fixed tariff option ................................ ................................ ..... 257 5.4.8.4 Register ................................ ................................ .................... 257 5.4.8.5 Research projects ................................ ................................ ..... 257
5.5 India ................................ ................................ ................................ .............. 258 5.5.1 Market size and forecast ................................ ................................ ........ 258 5.5.2 Future targets ................................ ................................ ........................ 262 5.5.3 Wind energy resources in India ................................ .............................. 262 5.5.4 Cost................................ ................................ ................................ ........ 264 5.5.5 R&D Technology development in India................................ ................... 265
5.5.5.1 The Centre for Wind Energy Technology (C-WET) ..................... 265 5.5.6 Government support................................ ................................ .............. 265
5.5.6.1 2009 developments ................................ ................................ .. 265 5.5.6.2 2010 developments ................................ ................................ .. 266 5.5.6.3 Renewable Portfolio Standard ................................ .................. 266 5.5.6.4 Grid infrastructure investment ................................ ................. 266 5.5.6.5 Proposed schemes ................................ ................................ .... 266 5.5.6.6 MNES - Ministry of Non-Conventional Energy Sources.............. 267 5.5.6.7 IREDA - Indian Renewable Energy Development Agency Ltd ..... 267

8/3/2019 Wind Power Report 2010
http://slidepdf.com/reader/full/wind-power-report-2010 14/50
Page 10 of 695
5.5.6.8 Financial incentives and manufacturer benefits ........................ 269 5.5.6.9 State incentives ................................ ................................ ........ 269
5.5.7 Manufacturing base ................................ ................................ ............... 270 5.5.7.1 Suzlon................................ ................................ ....................... 275
5.5.8 Small wind turbine markets................................ ................................ .... 278 5.5.8.1 Wind Energy Producers Association (WINPRO) ......................... 278 5.5.8.2 Indian Wind Turbine Manufacturers Association (IWTMA) ....... 278
5.5.9 Developers ................................ ................................ ............................. 279 6 National wind power markets and support plans; Intermediate countries -
Europe ......................................................................................................................281 6.1 Austria ................................ ................................ ................................ ........... 281
6.1.1 National renewable energy targets ................................ ........................ 284 6.1.2 Future developments ................................ ................................ ............. 285 6.1.3 Market shares in Austria ................................ ................................ ........ 285 6.1.4 Manufacturers ................................ ................................ ....................... 285 6.1.5 Wind Developers................................ ................................ .................... 286
6.2 Denmark ................................ ................................ ................................ ........ 286 6.2.1 Market size and forecast ................................ ................................ ........ 288 6.2.2 Geographical dispersion of wind turbines in Denmark............................ 289 6.2.3 Production of electricity from wind turbines ................................ .......... 290 6.2.4 Wind turbine size and repowering................................ .......................... 291 6.2.5 Offshore projects ................................ ................................ ................... 294 6.2.6 Future targets in Denmark ................................ ................................ ..... 296 6.2.7 Interface with other renewables ................................ ............................ 296 6.2.8 Wind power ownership ................................ ................................ .......... 297 6.2.9 The energy policy role of power companies ................................ ........... 298 6.2.10 Power companies' ownership of wind power................................ ......... 298 6.2.11 Pricing for wind power ................................ ................................ ........... 298 6.2.12 Grid connection, grid reinforcement ................................ ...................... 299

8/3/2019 Wind Power Report 2010
http://slidepdf.com/reader/full/wind-power-report-2010 15/50
Page 11 of 695
6.2.13 Wind resources ................................ ................................ ...................... 299 6.2.14 Wind generation structure ................................ ................................ ..... 299 6.2.15 R&D technology development in Denmark................................ ............. 300
6.2.15.1 The role of Risoe National Laboratory and others ..................... 300 6.2.15.2 The role of power companies in R&D ................................ ........ 300 6.2.15.3 New concepts ................................ ................................ ........... 300 6.2.15.4 Government support ................................ ................................ 301 6.2.15.5 Funding Levels................................ ................................ .......... 301 6.2.15.6 Ministry of Environment and Energys Energy Research
Programme (EFP) ................................ ................................ ...... 301 6.2.15.7 Ministry of Environment and Energys Programme for
Development, Demonstration and Information on Renewable
Energy (UVE)................................ ................................ ............. 301 6.2.15.8 Priorities................................ ................................ ................... 302 6.2.15.9 Legislation ................................ ................................ ................ 302 6.2.15.10
Windmill Law ................................ ................................ ............ 302
6.2.15.11 Energy 21................................ ................................ .................. 302 6.2.15.12 Danish Energy Agency................................ ............................... 302 6.2.15.13 Electricity reform ................................ ................................ ...... 303 6.2.15.14 Export assistance ................................ ................................ ...... 303 6.2.15.15 Renewable Energy Island ................................ .......................... 303 6.2.15.16 Promotion of local initiatives ................................ .................... 303
6.2.16 Danish manufacturing base ................................ ................................ .... 303 6.2.17 The Danish Wind Industry Association Members................................ .... 307
6.2.17.1 Blades................................ ................................ ....................... 307 6.2.17.2 Composites................................ ................................ ............... 308 6.2.17.3 Consulting and analysis................................ ............................. 309 6.2.17.4 Fans, cooling solutions and environmental control ................... 313 6.2.17.5 Electrical systems................................ ................................ ...... 313

8/3/2019 Wind Power Report 2010
http://slidepdf.com/reader/full/wind-power-report-2010 16/50
Page 12 of 695
6.2.17.6 Energy companies................................ ................................ ..... 317 6.2.17.7 Engineering consultancy ................................ ........................... 317 6.2.17.8 Fall protection systems ................................ ............................. 318 6.2.17.9 Foundations................................ ................................ .............. 319 6.2.17.10 Generators ................................ ................................ ............... 319 6.2.17.11 Gearboxes ................................ ................................ ................ 319 6.2.17.12 Heat exchangers ................................ ................................ ....... 319 6.2.17.13 Hydraulics................................ ................................ ................. 320 6.2.17.14 Investments................................ ................................ .............. 321 6.2.17.15 Lighting systems ................................ ................................ ....... 321 6.2.17.16 Mechanical components................................ ........................... 322 6.2.17.17 Metal processing ................................ ................................ ...... 324 6.2.17.18 Nacelles ................................ ................................ .................... 326 6.2.17.19 Offshore ................................ ................................ ................... 327 6.2.17.20 Oil system and lubrication ................................ ........................ 329 6.2.17.21 Operation and maintenance ................................ ..................... 330 6.2.17.22 Other associations ................................ ................................ .... 330 6.2.17.23 Plastic processing................................ ................................ ...... 331 6.2.17.24 Project development ................................ ................................ 331 6.2.17.25 Service ................................ ................................ ...................... 332 6.2.17.26 Servicelifts ................................ ................................ ................ 333 6.2.17.27 Software ................................ ................................ ................... 334 6.2.17.28 Surface treatment................................ ................................ ..... 334 6.2.17.29 Towers................................ ................................ ...................... 335 6.2.17.30 Training ................................ ................................ .................... 336 6.2.17.31 Transport and handling................................ ............................. 337 6.2.17.32 Wind turbines ................................ ................................ ........... 339
6.3 France................................ ................................ ................................ ............ 339 6.3.1 Government support................................ ................................ .............. 340
8/3/2019 Wind Power Report 2010
http://slidepdf.com/reader/full/wind-power-report-2010 17/50
Page 13 of 695
6.3.2 Barriers to development ................................ ................................ ........ 341 6.3.3 Offshore wind power ................................ ................................ ............. 341 6.3.4 Size of turbines................................ ................................ ....................... 342 6.3.5 Manufacturers ................................ ................................ ....................... 348 6.3.6 Domestic Production................................ ................................ .............. 348
6.3.6.1 Vergnet................................ ................................ ..................... 348 6.3.6.2 Other turbine manufacturers................................ .................... 348
6.3.7 Components and services................................ ................................ ....... 348 6.3.8 Developers ................................ ................................ ............................. 349
6.4 Greece ................................ ................................ ................................ ........... 349 6.4.1 Government Support ................................ ................................ ............. 350 6.4.2 Wind resources ................................ ................................ ...................... 352 6.4.3 Offshore................................ ................................ ................................ . 353 6.4.4 Barriers to development ................................ ................................ ........ 354 6.4.5 Size of wind turbines ................................ ................................ .............. 354 6.4.6 Manufacturing capability ................................ ................................ ....... 354 6.4.7 Wind farm operators and developers ................................ ..................... 356 6.4.8 Research and Development................................ ................................ .... 360
6.5 Ireland ................................ ................................ ................................ ........... 361 6.5.1 Regional development ................................ ................................ ........... 361 6.5.2 Offshore developments................................ ................................ .......... 362 6.5.3 Manufacturers ................................ ................................ ....................... 365 6.5.4 Government support................................ ................................ .............. 366 6.5.5 Wind resources ................................ ................................ ...................... 367 6.5.6 Wind variability ................................ ................................ ...................... 368 6.5.7 Operators................................ ................................ ............................... 370
6.6 Italy................................ ................................ ................................ ................ 371 6.6.1 Government policy................................ ................................ ................. 372 6.6.2 Regional plans ................................ ................................ ........................ 373

8/3/2019 Wind Power Report 2010
http://slidepdf.com/reader/full/wind-power-report-2010 18/50
Page 14 of 695
6.6.3 Wind farms ................................ ................................ ............................ 374 6.6.4 Offshore................................ ................................ ................................ . 375 6.6.5 Legal commitment to renewable energy ................................ ................ 375 6.6.6 Wind problems................................ ................................ ....................... 376 6.6.7 Italian manufacturers ................................ ................................ ............. 377 6.6.8 Wind developers ................................ ................................ .................... 379
6.7 Netherlands ................................ ................................ ................................ ... 379 6.7.1 Offshore developments in the Netherlands................................ ............ 380 6.7.2 Regional distribution of wind farms................................ ........................ 382 6.7.3 National renewable energy targets ................................ ........................ 386 6.7.4 Repowering................................ ................................ ............................ 386 6.7.5 Government policies, financial incentives and market stimulation ......... 386 6.7.6 Developments in 2009 ................................ ................................ ........... 387 6.7.7 Developments in 2010 ................................ ................................ ........... 388 6.7.8 Manufacturers ................................ ................................ ....................... 388 6.7.9 Developers ................................ ................................ ............................. 389
6.8 Norway ................................ ................................ ................................ .......... 389 6.8.1 Government support................................ ................................ .............. 391 6.8.2 Offshore wind power ................................ ................................ ............. 392 6.8.3 Wind power companies ................................ ................................ ......... 393
6.9 Poland ................................ ................................ ................................ ........... 393 6.9.1 Wind resources ................................ ................................ ...................... 396 6.9.2 Offshore................................ ................................ ................................ . 396 6.9.3 Future developments ................................ ................................ ............. 399 6.9.4 Government initiatives................................ ................................ ........... 399 6.9.5 Manufacturers ................................ ................................ ....................... 399 6.9.6 Developers ................................ ................................ ............................. 399
6.10 Portugal ................................ ................................ ................................ ......... 400 6.10.1 Renewables target ................................ ................................ ................. 401

8/3/2019 Wind Power Report 2010
http://slidepdf.com/reader/full/wind-power-report-2010 19/50
Page 15 of 695
6.10.2 Geographical distribution of wind capacity................................ ............. 401 6.10.3 Offshore wind power ................................ ................................ ............. 406 6.10.4 Government support................................ ................................ .............. 407 6.10.5 Manufacturers ................................ ................................ ....................... 407 6.10.6 Wind developers ................................ ................................ .................... 408
6.11 Sweden................................ ................................ ................................ .......... 410 6.11.1 Offshore wind power ................................ ................................ ............. 412 6.11.2 Government support................................ ................................ .............. 413 6.11.3 Manufacturers ................................ ................................ ....................... 413 6.11.4 Wind developers ................................ ................................ .................... 414
6.12 Turkey................................ ................................ ................................ ............ 414 6.12.1 Wind resources ................................ ................................ ...................... 415 6.12.2 Onshore capacity ................................ ................................ ................... 416 6.12.3 Offshore wind ................................ ................................ ........................ 419 6.12.4 Grid infrastructure ................................ ................................ ................. 419 6.12.5 Future developments ................................ ................................ ............. 419 6.12.6 Barriers to development ................................ ................................ ........ 419 6.12.7 Government support................................ ................................ .............. 420 6.12.8 Developers ................................ ................................ ............................. 420 6.12.9 Manufacturing base ................................ ................................ ............... 421
6.13 United Kingdom ................................ ................................ ............................. 422 6.13.1 Wind resources ................................ ................................ ...................... 422 6.13.2 Offshore wind power ................................ ................................ ............. 430 6.13.3 Round 1................................ ................................ ................................ .. 431 6.13.4 Round 2................................ ................................ ................................ .. 432 6.13.5 Round 3................................ ................................ ................................ .. 434 6.13.6 Wind resources ................................ ................................ ...................... 440 6.13.7 Barriers to development ................................ ................................ ........ 441 6.13.8 Future targets ................................ ................................ ........................ 441

8/3/2019 Wind Power Report 2010
http://slidepdf.com/reader/full/wind-power-report-2010 20/50
Page 16 of 695
6.13.9 Government support................................ ................................ .............. 443 6.13.10 Election ................................ ................................ ................................ .. 444 6.13.11 Grid extension................................ ................................ ........................ 445 6.13.12 Manufacturing Base ................................ ................................ ............... 446
6.13.12.1 Manufacturers of wind turbines >50kw ................................ .... 446 6.13.12.2 Turbine Components ................................ ................................ 446
6.13.13 Small System Suppliers................................ ................................ ........... 447 7 National wind power markets and support plans Intermediate countries
Asia Pacific ................................................................................................................ 448 7.1 Australia ................................ ................................ ................................ ........ 448
7.1.1 Wind power by state ................................ ................................ .............. 449 7.1.2 Future developments ................................ ................................ ............. 451 7.1.3 Government initiatives................................ ................................ ........... 451 7.1.4 State initiatives ................................ ................................ ...................... 452 7.1.5 Retail initiatives................................ ................................ ...................... 453 7.1.6 Wind resources ................................ ................................ ...................... 455 7.1.7 Certified Wind Farms Australia (CWFA) ................................ .................. 456 7.1.8 Recent developments................................ ................................ ............. 456 7.1.9 Future developments ................................ ................................ ............. 456 7.1.10 Manufacturing base ................................ ................................ ............... 456 7.1.11 Developers................................ ................................ ............................. 456 7.1.12 Finance ................................ ................................ ................................ .. 457
7.2 Japan ................................ ................................ ................................ ............. 457 7.2.1 Environmental and renewables policy ................................ .................... 459 7.2.2 Technical issues................................ ................................ ...................... 459 7.2.3 Future target for wind power ................................ ................................ . 460 7.2.4 Offshore................................ ................................ ................................ . 460 7.2.5 Government programmes ................................ ................................ ...... 461 7.2.6 Local authorities................................ ................................ ..................... 461

8/3/2019 Wind Power Report 2010
http://slidepdf.com/reader/full/wind-power-report-2010 21/50
Page 17 of 695
7.2.7 Manufacturing base ................................ ................................ ............... 461 7.2.8 Manufacturers market shares ................................ ............................... 462 7.2.9 Costs ................................ ................................ ................................ ...... 462 7.2.10 Wind farm developments................................ ................................ ....... 463 7.2.11 R&D ................................ ................................ ................................ ....... 463 7.2.12 Wind Farm Operators................................ ................................ ............. 463
7.3 Korea, ROK................................ ................................ ................................ ..... 465 7.3.1 Future targets ................................ ................................ ........................ 467 7.3.2 Government support................................ ................................ .............. 468 7.3.3 Local authorities................................ ................................ ..................... 468 7.3.4 R&D ................................ ................................ ................................ ....... 468 7.3.5 Constraints to development ................................ ................................ ... 468 7.3.6 Offshore wind ................................ ................................ ........................ 469 7.3.7 Manufacturing base ................................ ................................ ............... 470 7.3.8 Ship builders ................................ ................................ .......................... 470
7.3.8.1 Hyundai ................................ ................................ .................... 470 7.3.8.2 Samsung ................................ ................................ ................... 471 7.3.8.3 Daewoo ................................ ................................ .................... 472 7.3.8.4 STX ................................ ................................ ........................... 472
7.3.9 Component manufacturers ................................ ................................ .... 473 7.3.10 Wind developers ................................ ................................ .................... 473
7.4 Taiwan ................................ ................................ ................................ ........... 474 7.4.1 Onshore developments ................................ ................................ .......... 475 7.4.2 Offshore developments................................ ................................ .......... 476 7.4.3 Recent developments................................ ................................ ............. 476 7.4.4 Barriers to development ................................ ................................ ........ 476 7.4.5 Wind resources ................................ ................................ ...................... 476 7.4.6 Government support................................ ................................ .............. 476 7.4.7 Manufacturing base ................................ ................................ ............... 477
8/3/2019 Wind Power Report 2010
http://slidepdf.com/reader/full/wind-power-report-2010 22/50
Page 18 of 695
7.4.8 Developers ................................ ................................ ............................. 477 8 National wind power markets and support plans Intermediate countries
Africa ........................................................................................................................478 8.1 Egypt ................................ ................................ ................................ ............. 478
8.1.1 Future development................................ ................................ ............... 479 8.1.2 Government support................................ ................................ .............. 480 8.1.3 Wind resources ................................ ................................ ...................... 480
8.2 Morocco ................................ ................................ ................................ ........ 481 8.2.1 Wind farms ................................ ................................ ............................ 482 8.2.2 Future developments ................................ ................................ ............. 484 8.2.3 The Mediterranean Solar Plan ................................ ................................ 486 8.2.4 Manufacturers ................................ ................................ ....................... 487 8.2.5 Developers ................................ ................................ ............................. 488 8.2.6 Costs ................................ ................................ ................................ ...... 489 8.2.7 Recent developments................................ ................................ ............. 489
9 National wind power markets and support plans Intermediate countries -
Americas ................................................................................................................... 490 9.1 Brazil................................ ................................ ................................ .............. 490
9.1.1 Future wind developments ................................ ................................ .... 490 9.1.2 Wind resources ................................ ................................ ...................... 491 9.1.3 Government promotion of renewables ................................ .................. 494 9.1.4 Government promotion of local manufacturers ................................ ..... 494 9.1.5 Costs ................................ ................................ ................................ ...... 495 9.1.6 Future development................................ ................................ ............... 495 9.1.7 Manufacturers ................................ ................................ ....................... 495 9.1.8 Wind developers ................................ ................................ .................... 496
9.2 Canada................................ ................................ ................................ ........... 497 9.2.1 Future developments ................................ ................................ ............. 503 9.2.2 Off shore................................ ................................ ................................ . 507

8/3/2019 Wind Power Report 2010
http://slidepdf.com/reader/full/wind-power-report-2010 23/50
Page 19 of 695
9.2.3 R&D in Canada ................................ ................................ ....................... 509 9.2.4 Federal and Provincial government production incentive....................... 509 9.2.5 Proposed incentives ................................ ................................ ............... 509 9.2.6 Provincial incentives................................ ................................ ............... 509 9.2.7 Grid infrastructure ................................ ................................ ................. 511 9.2.8 Manufacturers ................................ ................................ ....................... 511 9.2.9 Financials ................................ ................................ ............................... 513 9.2.10 Developers ................................ ................................ ............................. 514
10 Up and coming countries - Europe............................................................................ 516 10.1 Belgium................................ ................................ ................................ .......... 516
10.1.1 Offshore................................ ................................ ................................ . 516 10.2 Bulgaria................................ ................................ ................................ .......... 516
10.2.1 Future developments ................................ ................................ ............. 517 10.2.2 Government incentives ................................ ................................ .......... 517 10.2.3
Barriers to development ................................ ................................ ........ 518
10.2.4 Financing................................ ................................ ................................ 518
10.3 Czech Republic................................ ................................ ............................... 518 10.3.1 Barriers to development ................................ ................................ ........ 519 10.3.2 Future developments ................................ ................................ ............. 520 10.3.3 Government incentives ................................ ................................ .......... 520 10.3.4 Manufacturers ................................ ................................ ....................... 520 10.3.5 Developers ................................ ................................ ............................. 522
10.4 Estonia................................ ................................ ................................ ........... 523 10.4.1 Government incentives ................................ ................................ .......... 524
10.5 Finland................................ ................................ ................................ ........... 525 10.5.1 Offshore................................ ................................ ................................ . 529 10.5.2 Future developments ................................ ................................ ............. 529 10.5.3 Government incentives ................................ ................................ .......... 529

8/3/2019 Wind Power Report 2010
http://slidepdf.com/reader/full/wind-power-report-2010 24/50
Page 20 of 695
10.5.4 R&D ................................ ................................ ................................ ....... 530 10.5.5 Manufacturers ................................ ................................ ....................... 530 10.5.6 Developers ................................ ................................ ............................. 531
10.6 Hungary ................................ ................................ ................................ ......... 531 10.6.1 Barriers to development ................................ ................................ ........ 532 10.6.2 Manufacturers ................................ ................................ ....................... 532
10.7 Latvia................................ ................................ ................................ ............. 533 10.8 Lithuania................................ ................................ ................................ ........ 533
10.8.1 Government incentives ................................ ................................ .......... 536 10.9 Romania ................................ ................................ ................................ ........ 536
10.9.1 Future developments ................................ ................................ ............. 537 10.9.2 Government incentives ................................ ................................ .......... 537 10.9.3 Manufacturers ................................ ................................ ....................... 538 10.9.4 Developers ................................ ................................ ............................. 538
10.10 Russia ................................ ................................ ................................ ............ 538 10.11 Ukraine ................................ ................................ ................................ .......... 538
10.11.1 Future developments ................................ ................................ ............. 539 10.11.2 Government incentives ................................ ................................ .......... 539 10.11.3 Barriers to development ................................ ................................ ........ 539 10.11.4 Manufacturers ................................ ................................ ....................... 540
11 Up and coming countries Asia Pacific ....................................................................... 541 11.1 New Zealand ................................ ................................ ................................ .. 541
11.1.1 Wind resources ................................ ................................ ...................... 541 11.1.2 Barriers to development ................................ ................................ ........ 544 11.1.3 Government incentives ................................ ................................ .......... 545 11.1.4 Costs ................................ ................................ ................................ ...... 545 11.1.5 Manufacturers ................................ ................................ ....................... 545 11.1.6 Developers ................................ ................................ ............................. 546

8/3/2019 Wind Power Report 2010
http://slidepdf.com/reader/full/wind-power-report-2010 25/50
Page 21 of 695
11.2 Vietnam ................................ ................................ ................................ ......... 548 12 Up and coming countries - Africa..............................................................................549
12.1 Cape Verde ................................ ................................ ................................ .... 549 12.2 Ethiopia ................................ ................................ ................................ ......... 549 12.3 Kenya................................ ................................ ................................ ............. 550
12.3.1 Government incentives ................................ ................................ .......... 551 12.3.2 Wind resources ................................ ................................ ...................... 551
12.4 Senegal ................................ ................................ ................................ .......... 552 12.5 South Africa ................................ ................................ ................................ ... 553
12.5.1 Future developments ................................ ................................ ............. 554 12.5.2 Government incentives ................................ ................................ .......... 554
12.6 Tunisia ................................ ................................ ................................ ........... 554 12.7 Other countries................................ ................................ .............................. 554
13 Up and coming countries - Americas ........................................................................ 556 13.1 Argentina ................................ ................................ ................................ ....... 557
13.1.1 Government incentives ................................ ................................ .......... 557 13.1.2 Manufacturers ................................ ................................ ....................... 557 13.1.3 Developers ................................ ................................ ............................. 557
13.2 Chile ................................ ................................ ................................ .............. 557 13.2.1 Barriers to development ................................ ................................ ........ 558 13.2.2 Recent developments................................ ................................ ............. 558 13.2.3 Government incentives ................................ ................................ .......... 559 13.2.4 Manufacturers ................................ ................................ ....................... 559 13.2.5 Developers ................................ ................................ ............................. 559
13.3 Mexico ................................ ................................ ................................ ........... 559 13.3.1 Wind resources ................................ ................................ ...................... 560 13.3.2 Barriers to development ................................ ................................ ........ 560 13.3.3 Government incentives ................................ ................................ .......... 561

8/3/2019 Wind Power Report 2010
http://slidepdf.com/reader/full/wind-power-report-2010 26/50
Page 22 of 695
13.3.4 Manufacturers ................................ ................................ ....................... 561 14 Up and coming countries - Middle East ....................................................................562 15 Wind industry supply chain ...................................................................................... 563
15.1 The wind industry supply chain ................................ ................................ ...... 563 15.2 Vertical integration ................................ ................................ ........................ 564 15.3 Background to the supply chain in the electro-technical industry .................. 566 15.4 Raw materials ................................ ................................ ................................ 567 15.5
Lead times ................................ ................................ ................................ ..... 572
15.6 Wind turbine production capacity................................ ................................ .. 572 15.7 Components - Balance of plant, Tier 1 and Tier 2 capacity ............................. 573 15.8 Rotor blades ................................ ................................ ................................ .. 574 15.9 Gear boxes................................ ................................ ................................ ..... 575 15.10 Bearings................................ ................................ ................................ ......... 575 15.11 Cast iron and forged components ................................ ................................ .. 576 15.12 Towers................................ ................................ ................................ ........... 576 15.13 Transformers ................................ ................................ ................................ . 576 15.14 Local supply chains ................................ ................................ ........................ 577
16 Rare Earth Metals ..................................................................................................... 578 17 Operation and maintenance ..................................................................................... 583 18 Weather forecasting technologies ............................................................................ 588 19 Energy storage ..........................................................................................................595
19.1 Mechanical Storage ................................ ................................ ....................... 596 19.2 Electrochemical storage................................ ................................ ................. 597 19.3 Electromagnetic storage ................................ ................................ ................ 598 19.4 Coupling to new energies................................ ................................ ............... 599 19.5 Developments................................ ................................ ................................ 599

8/3/2019 Wind Power Report 2010
http://slidepdf.com/reader/full/wind-power-report-2010 27/50
Page 23 of 695
20 Wind farm developers and owners........................................................................... 600 21 Advantages and disadvantages of wind energy compared with other forms of
energy.......................................................................................................................613 22 Manufacturing base.................................................................................................. 617
22.1 The top nine wind turbine companies ................................ ............................ 621 22.1.1 Vestas ................................ ................................ ................................ .... 621 22.1.2 GE Energy................................ ................................ ............................... 629 22.1.3 Sinovel ................................ ................................ ................................ ... 630 22.1.4 Enercon................................ ................................ ................................ .. 631 22.1.5 Goldwind................................ ................................ ................................ 632 22.1.6 Gamesa Corporación Tecnológica ................................ .......................... 632 22.1.7 Dongfang ................................ ................................ ............................... 634 22.1.8 Suzlon ................................ ................................ ................................ .... 634 22.1.9 Siemens Power Generation ................................ ................................ .... 637 22.1.10
Other manufacturers................................ ................................ .............. 639
22.1.10.1 REpower Systems AG ................................ ................................ 639 22.1.10.2 Mitsubishi................................ ................................ ................. 640 22.1.10.3 Nordex................................ ................................ ...................... 641
23 Offshore wind power................................................................................................643 23.1 Investments ................................ ................................ ................................ ... 646 23.2 Distance from shore................................ ................................ ....................... 647 23.3 Manufacturers ................................ ................................ ............................... 647 23.4 Developers................................ ................................ ................................ ..... 649 23.5 Supply chain................................ ................................ ................................ ... 651 23.6 Future developments................................ ................................ ..................... 657 23.7 The benefits................................ ................................ ................................ ... 657
23.7.1 Higher wind speeds ................................ ................................ ................ 657 23.7.2 More stable winds................................ ................................ .................. 658

8/3/2019 Wind Power Report 2010
http://slidepdf.com/reader/full/wind-power-report-2010 28/50
Page 24 of 695
23.7.3 Huge offshore wind resources................................ ................................ 658 23.7.4 Low surface roughness: cheaper turbines ................................ .............. 658 23.7.5 Lower turbulence: longer lifetime ................................ .......................... 659 23.7.6 Shipping and transport ................................ ................................ ........... 659 23.7.7 Closer to demand centres ................................ ................................ ...... 659 23.7.8 NIMBY................................ ................................ ................................ .... 659
23.8 The challenges ................................ ................................ ............................... 659 23.8.1 Costs ................................ ................................ ................................ ...... 659 23.8.2 Foundations ................................ ................................ ........................... 663 23.8.3 Installation vessels ................................ ................................ ................. 667 23.8.4 Operation and maintenance................................ ................................ ... 668 23.8.5 Port facilities ................................ ................................ .......................... 669 23.8.6 Subsea cabling................................ ................................ ........................ 670 23.8.7 Maritime spacial planning ................................ ................................ ...... 670 23.8.8 Technical expertise................................ ................................ ................. 670 23.8.9 A European Offshore Grid ................................ ................................ ...... 671
23.9 Project Financing ................................ ................................ ........................... 674 24 Repowering............................................................................................................... 675
24.1 Market for old turbines................................ ................................ .................. 677 24.2 Recycling turbines................................ ................................ .......................... 680
25 Forecasting a new technology - Experience Curves and Progress Ratios (PR)...........681 26 Development of wind turbine size............................................................................ 684
26.1 Onshore................................ ................................ ................................ ......... 684 26.2 Offshore................................ ................................ ................................ ......... 688
27 Promising Technologies ............................................................................................692 27.1 Direct drive turbines................................ ................................ ...................... 692 27.2 Blade de-icing ................................ ................................ ................................ 693 27.3 Hydraulic transmissions ................................ ................................ ................. 693

8/3/2019 Wind Power Report 2010
http://slidepdf.com/reader/full/wind-power-report-2010 29/50
Page 25 of 695
27.4 Technologies for operation and maintenance ................................ ................ 694 28 Community Power Ownership Model ...................................................................... 695

8/3/2019 Wind Power Report 2010
http://slidepdf.com/reader/full/wind-power-report-2010 30/50
Page 26 of 695
List of Figures
Figure 1. Global wind power installed capacity, GW 1990-2014................................ ... 47 Figure 2. Development of installed capacity from 2000, MW, top five countries.......... 48 Figure 3. Development of installed capacity from 2000, MW, next five countries ........ 49 Figure 4. Forecast of global wind energy development to 2012, MW........................... 60 Figure 5. Base, Intermediate and Peak Load by time of Day ................................ ......... 68 Figure 6. Capacity factors by month for wind power for Denmark, Sweden,
Germany, Netherlands ................................ ................................ .................. 70
Figure 7. The contribution of wind power to covering peak load in 2003 ..................... 76 Figure 8. Fluctuations in wind power feed-in ................................ ............................... 77 Figure 9. Rapid decrease in wind power feed-in................................ ........................... 78 Figure 10. Wind below forecast ................................ ................................ .................... 79 Figure 11. Wind continues to blow longer than forecast ................................ ................ 80 Figure 12. Wind capacity that needs to be installed per year in a high scenario, MW .... 90 Figure 13. Capacity for low and high scenarios for both onshore and offshore wind
in the EU, MW ................................ ................................ ............................... 91 Figure 14. Annual installations in the EU, 2010-2014 ................................ ..................... 92 Figure 15. Average building consent time in the EU, months ................................ ......... 93 Figure 16. Wind Energy Investments in the EU, 2000-2030................................ ............ 95 Figure 17. Capital costs of onshore and offshore wind in the EU, /kW ......................... 96 Figure 18. National renewable energy policies in EU countries ................................ .... 106 Figure 19. US States with Renewable and Alternative Energy Portfolio Standards,
end 2009 ................................ ................................ ................................ ..... 132 Figure 20. Percentage of new capacity additions in the USA ................................ ........ 140 Figure 21. Growth in wind power capacity in the United States, MW, 2000-2020........ 141 Figure 22. Objectives of wind power development in the United States to 2010 ......... 142 Figure 23. Installed capacity in the United States, by state, MW, end 2009.................. 143 Figure 24. Estimates of Windy 1 Land Area and Wind Energy Potential by State for
Areas >= 30% Capacity Factor at 80m, February 4, 2010, MW ..................... 144

8/3/2019 Wind Power Report 2010
http://slidepdf.com/reader/full/wind-power-report-2010 31/50
Page 27 of 695
Figure 25. Projects under construction ................................ ................................ ........ 151 Figure 26. Potential market: wind project development to meet the 20% by 2030
wind target................................ ................................ ................................ .. 153 Figure 27. Scenario of new manufacturing employment to meet the 20% by 2030
wind target................................ ................................ ................................ .. 154 Figure 28. Onshore and offshore wind resources in the United States ......................... 155 Figure 29. Wind resources in the Great Lakes ................................ ............................. 156 Figure 30. US transmission scenario (new transmission in red) ................................ .... 158 Figure 31.
Manufacturers market share in the United States, MW, 2009 ..................... 160
Figure 32. Manufacturers market share of projects under construction in the United
States, MW, end 2009 ................................ ................................ ................. 161 Figure 33. Market share of installations in the United States, by MW, 2005 - 2009...... 164 Figure 34. Turbine manufacturer locations, current or announced for 2010 ................ 165 Figure 35. Breakdown of companies in the wind power supply chain in each state...... 166 Figure 36. Major owners of wind facilties in the United States, end 2009 .................... 169 Figure 37.
Wind resources in the United States ................................ ........................... 171
Figure 38. Cost of wind energy 1980 to 2008, $/MWh ................................ ................. 173 Figure 39. Advanced tower design ................................ ................................ .............. 175 Figure 40. The growth of wind power capacity in China, MW 2000-2020..................... 187 Figure 41. Chinese wind potential by region ................................ ............................... 189 Figure 42. Potential output of 1.5 MW wind turbines in China, % of maximum
output over time ................................ ................................ ......................... 190 Figure 43.
DC-grid under construction around Guangzhou................................ ........... 191
Figure 44. Offshore wind potential ................................ ................................ .............. 193 Figure 45. Offshore wind projects in the pipeline................................ ......................... 196 Figure 46. Capacity shares of manufacturers in China, 2009, %................................ .... 208 Figure 47. Growth of the wind power market in Germany, MW, 2000-2020................ 214 Figure 48. Objectives for wind power development in Germany to 2010 MW ............. 215 Figure 49. German North Sea and Baltic Sea development status, Q1 2010 ................. 223

8/3/2019 Wind Power Report 2010
http://slidepdf.com/reader/full/wind-power-report-2010 32/50
Page 28 of 695
Figure 50. Annual onshore and offshore build and repowering in Germany, MW,
1993 to 2030 ................................ ................................ ............................... 224
Figure 51. Cumulative installed capacity, onshore and offshore in Germany, MW
1993 to 2030 ................................ ................................ ............................... 224 Figure 52. Trend in wind turbine sizes in Germany, 1997-2009 ................................ .... 225 Figure 53. Installed wind capacity in German states, end 2009 ................................ .... 228 Figure 54. Capacity by region, Germany, MW, 2009 ................................ .................... 229 Figure 55. Number of turbines by region, Germany, 2009................................ ............ 229 Figure 56.
Map of regional distribution of wind turbines in Germany, by turbinecapacity................................ ................................ ................................ ....... 230
Figure 57. Map of regional distribution of wind turbines in Germany, by turbine
capacity, 2007 ................................ ................................ ............................. 231 Figure 58. Manufacturers shares in Germany, end 2009, % ................................ ........ 239 Figure 59. The growth of the wind power market in Spain, MW, 2000-2020................ 241 Figure 60. Objectives for wind power development to 2010 ................................ ........ 242 Figure 61. Installed wind power capacity in Spain, 2009 ................................ .............. 244 Figure 62. Aerial view of a mountain wind farm in Spain................................ .............. 245 Figure 63. Monthly electricity supply from wind, 2003-2009 ................................ ....... 247 Figure 64. Manufacturers shares in Spain, end 2009 ................................ ................... 248 Figure 65. Wind turbine size in Spain, MW, 1995 to 2008 ................................ ............ 255 Figure 66. The growth of wind power capacity in India, MW, 2000 - 2020 ................... 259 Figure 67. Map of installed wind power in India by state, 2009................................ .... 261 Figure 68.
Wind resources of India................................ ................................ .............. 263
Figure 69. Market share of manufacturers in India, March 2009, MW ......................... 277 Figure 70. The top 10 Independent Power Producers in March 2009 ........................... 280 Figure 71. Installed wind power capacity in Austria, MW, 1990-2012 .......................... 281 Figure 72. Regional distribution of installed wind capacity in Austria, 2009, MW ......... 282 Figure 73. Market shares of wind turbine manufacturers in Austria, 2009 ................... 285 Figure 74. Growth of the wind power market in Denmark, MW, 1990-2012................ 288 Figure 75. Location of wind and CHP plants in Denmark, 2009................................ ..... 290

8/3/2019 Wind Power Report 2010
http://slidepdf.com/reader/full/wind-power-report-2010 33/50
Page 29 of 695
Figure 76. Capacity and production of wind powered electricity in Denmark, 1977 to
2007................................ ................................ ................................ ............ 291
Figure 77. Number of wind turbines and capacity in Denmark (MW), 1977 to 2007 .... 292 Figure 78. Location of offshore wind farms in Denmark ................................ ............... 294 Figure 79. New installed capacity in Demark, 2000-2009, MW................................ ..... 295 Figure 80. Total installed capacity in Denmark, 1999-2009, MW ................................ .. 295 Figure 81. Generation of electricity from biomass in Denmark, GWh, 1980 to 2007 .... 297 Figure 82. Turnover of Danish wind industry manufacturers in DKK billion, 1999
2009................................ ................................ ................................ ............ 304
Figure 83. Danish exports by country of destination, 2005 and 2006 ........................... 305 Figure 84. Average turbine size in Denmark, 1999-2009, kW ................................ ....... 306 Figure 85. Forecasted sales of turbines, 2006 - 2012................................ .................... 306 Figure 86. Installed wind power capacity in France, MW, 1990-2012........................... 340 Figure 87. Installed wind capacity in France................................ ................................ . 347 Figure 88. Installed wind power capacity in Greece, MW, 1990-2012 .......................... 350 Figure 89. Distribution of wind plants in Greece by region, 2006 ................................ . 352 Figure 90. Wind resources in Greece ................................ ................................ ........... 353 Figure 91. Market shares of wind turbine manufacturers in Greece, 2006 ................... 355 Figure 92. Breakdown of market shares for turbine manufacturers for new capacity,
2009................................ ................................ ................................ ............ 356 Figure 93. Wind developers market share of new installed capacity, 2009.................. 360 Figure 94. Installed wind power capacity in Ireland, MW, 1990-2012 .......................... 361 Figure 95. Distribution of Wind Capacity in Ireland, February 2010.............................. 362 Figure 96. Location of planned windfarms in Ireland................................ .................... 364 Figure 97. Manufacturers market shares, Ireland, MW, 2008 ................................ ..... 366 Figure 98. Installed wind power capacity in Italy, MW, 1990-2012............................... 372 Figure 99. Wind power capacity by region in Italy, 2009 ................................ .............. 374 Figure 100. Market share of installed wind turbines manufacturers in Italy 2008, MW.. 377 Figure 101. Market share of installed wind turbines manufactureres in Italy 2009,
MW ................................ ................................ ................................ ............. 378

8/3/2019 Wind Power Report 2010
http://slidepdf.com/reader/full/wind-power-report-2010 34/50
Page 30 of 695
Figure 102. Installed wind power capacity in Netherlands, 1990-2012, MW.................. 380 Figure 103. Wind plants in the Netherlands, Q1 2010 ................................ .................... 384 Figure 104. Market share of installed wind turbines in Netherlands as of 14
thApril
2010, MW ................................ ................................ ................................ ... 389 Figure 105. Projected installed wind power capacity in Norway, MW, 1990-2012 ......... 390 Figure 106. Percentage electricity generated from wind power, end Q1 2010 ............... 394 Figure 107. Offshore wind farm connection vision until 2030 ................................ ..... 397 Figure 108. Offshore wind farm connection - vision until 2050 ................................ ...... 397 Figure 109. Installed wind power capacity in Portugal, MW, 1990-2012 ........................ 400 Figure 110. Regional distribution of wind installations in Portugal in 2009, MW ............ 402 Figure 111. Breakdown of capacity of wind farms in 2009, MW................................ ..... 406 Figure 112. Market share of installed wind turbines manufacturers in Portugal, 2009,
%................................ ................................ ................................ ................. 408 Figure 113. Market share of wind developers in Portugal, 2009................................ ..... 409 Figure 114. Installed wind power capacity in Sweden, MW, 1990-2012......................... 410 Figure 115. Installed wind power capacity in Turkey, MW, 1990-2012........................... 415 Figure 116. Wind resources in Turkey ................................ ................................ ........... 416 Figure 117. Regional distribution of 1 November 2007 wind farm applications.............. 419 Figure 118. Manufacturers market share in Turkey, 2009, MW ................................ .... 421 Figure 119. Growth in wind power capacity in the United Kingdom, MW, 1990-2012.... 423 Figure 120. Round 1 offshore wind farms in the UK ................................ ....................... 431 Figure 121. Round 2 offshore wind farms in the UK ................................ ....................... 433 Figure 122. Round 3 offshore wind farms in the UK ................................ ....................... 434 Figure 123. Breakdown of offshore Round 3 capacity awarded, MW ............................. 435 Figure 124. Round 3 annual build out profile for the 32 GW awarded ........................... 436 Figure 125. Cumulative installed UK small wind capacity (MW) ................................ ..... 447 Figure 126. Installed wind power capacity in Australia, MW, 1990-2012 ....................... 448 Figure 127. Installed wind power in the Australian States, MW ................................ ..... 450 Figure 128. Wind speeds at select locations in Australia ................................ ................ 455

8/3/2019 Wind Power Report 2010
http://slidepdf.com/reader/full/wind-power-report-2010 35/50
Page 31 of 695
Figure 129. Market share of the top 6 wind farm owners by capacity in Australia,
2009, MW ................................ ................................ ................................ ... 457
Figure 130. Installed wind power capacity in Japan, MW, 1990-2012 ............................ 458 Figure 131. Manufacturers % market shares, Japan 2007 ................................ ............. 462 Figure 132. Installed wind power capacity in Korea, MW, 1990-2012 ............................ 466 Figure 133. Location of offshore winds ................................ ................................ .......... 469 Figure 134. Installed wind power capacity in Taiwan, MW, 1990-2012 .......................... 474 Figure 135. Installed wind power capacity in Egypt, MW, 1990-2012............................. 478 Figure 136. Wind resources in Egypt ................................ ................................ ............. 481 Figure 137. Installed wind power capacity in Morocco, MW, 1990-2012 ....................... 482 Figure 138. Wind resources in Morocco ................................ ................................ ........ 485 Figure 139. The Mediterranean solar plan ................................ ................................ .... 487 Figure 140. Market share turbine manufacturers in Morocco, 2009, MW ...................... 488 Figure 141. Market share of developers in Morocco, 2009, MW ................................ .... 489 Figure 142. The growth of wind power capacity in Brazil, MW, 2004-2012 .................... 490 Figure 143. Map of wind resources in Brazil ................................ ................................ . 492 Figure 144. Map of installed energy capacity and energy reserves in Canada, 2008....... 498 Figure 145. The growth of wind power capacity in Canada, MW, 1990-2012................. 499 Figure 146. Wind energy installed capacity in Canadian provinces, Q1 2010.................. 500 Figure 147. Wind capacity approved or under construction in Canada, MW .................. 507 Figure 148. Map of mean wind speed at 50 metres above ground in Canada ................ 508 Figure 149. Market share of manufacturers in Canada, April 2010, MW ........................ 512 Figure 150. Market share of developers in Canada in April 2010, MW ........................... 514 Figure 151. Map of wind resources at 80 metres in Bulgaria................................ .......... 517 Figure 152. Installed wind projects in the Czech Republic, Q1 2010 ............................... 519 Figure 153. Manufacturers market share in the Czech Republic, end 2009 .................... 521 Figure 154. Average turbine size of new installed capacity in the Czech Republic, kW ... 522 Figure 155. Top ten developers in the Czech Republic, MW................................ ........... 523 Figure 156. Map of wind resources in Estonia................................ ............................... 524

8/3/2019 Wind Power Report 2010
http://slidepdf.com/reader/full/wind-power-report-2010 36/50
Page 32 of 695
Figure 157. Location of wind farms in Finland................................ ............................... 526 Figure 158. Wind atlas of Finland ................................ ................................ .................. 527 Figure 159. Manufacturers market share in Finland, end 2009 ................................ ...... 530 Figure 160. Developers market share in Finland, end 2009 ................................ ............ 531 Figure 161. Map of wind resources in Hungary ................................ ............................. 532 Figure 162. Map of wind resources in Latvia ................................ ................................ . 533 Figure 163. Average wind turbine size in Lithuania, kW ................................ ................. 534 Figure 164. Average capacity factor in Lithuania, % ................................ ....................... 535 Figure 165. Map of wind resources in Lithuania ................................ ........................... 536 Figure 166. Map of wind resources in Romania ................................ ............................ 537 Figure 167. Map of wind resources in the Ukraine ................................ ......................... 539 Figure 168. Location of operating projects and projects under construction in New
Zealand, Q1 2010 ................................ ................................ ........................ 542 Figure 169. Existing and publically discussed wind farms ................................ ............... 544 Figure 170. Market share of manufacturers in New Zealand, end 2009 ......................... 546 Figure 171. Market share of developers in New Zealand, end 2009 ............................... 546 Figure 172. Electricity generator Trust Fund is major relailer in New Zealand ................ 547 Figure 173. Annual mean wind speeds in Kenya at a height of 50 metres ...................... 552 Figure 174. Map of wind resources in South Africa ................................ ........................ 553 Figure 175. Total installed and added capacity, 2009 ................................ ..................... 556 Figure 176. Turbine parts ................................ ................................ .............................. 566 Figure 177. Steel and copper prices compared to the 2008 peak, % .............................. 569 Figure 178. Supply and demand of curves for carbon fibers ................................ ........... 570 Figure 179. Predicted demand for carbon fiber................................ .............................. 571 Figure 180. How much neodymium will the offshore sector need?................................ 579 Figure 181. Prices of 99% Neodymium Oxide, US$/kg on an FOB China basis................. 580 Figure 182. Lifecycle breakdown of wind energy investment project costs, %................ 583 Figure 183. Frequency of "failure rate" with increasing operational age ........................ 584 Figure 184. Downtime per component failure, days ................................ ...................... 585

8/3/2019 Wind Power Report 2010
http://slidepdf.com/reader/full/wind-power-report-2010 37/50
Page 33 of 695
Figure 185. Weak point analysis for wind turbine subassemblies including failure
causes ................................ ................................ ................................ ......... 586
Figure 186. Salt structures and existing gas storage site in Europe................................ . 597 Figure 187. Top wind energy developers in the world, MW 2006 - 2008........................ 600 Figure 188. Top wind energy developers in the world, MW 2009 ................................ .. 601 Figure 189. Investment costs, $/MW ................................ ................................ ............ 612 Figure 190. Estimated investment costs, /kW ................................ ............................. 613 Figure 191. Estimated operation and maintenance costs, /kW/annum........................ 614 Figure 192. Levelised Cost of Electricity, cents/kWh................................ .................... 614 Figure 193. Value of global turbine market, billions, 2005 2009 ............................... 618 Figure 194. Global market share of wind turbine manufacturers 2005 2008, % .......... 619 Figure 195. Global market share of the top ten wind turbine manufacturers, 2009,% ... 620 Figure 196. Submitted wind patent applications, 2009 ................................ .................. 621 Figure 197. Vestas revenue 2001 to 2009 millions ................................ ...................... 622 Figure 198. Vestas, distribution of revenue, 2009 ................................ .......................... 623 Figure 199. MW sold by Gamesa in 2008 and 2009 ................................ ....................... 633 Figure 200. Suzlon sales in MW, 2009 ................................ ................................ ........... 635 Figure 201. Forecast Suzlon sales 2009 2013 ................................ .............................. 636 Figure 202. Offshore wind installations by country MW, 2009 ................................ ....... 643 Figure 203. Locations of offshore wind farms in the EU, Q1 2010 ................................ .. 644 Figure 204. Market share of offshore turbine manufacturers, % ................................ .... 649 Figure 205. Market share EU offshore developers, end 2009, and % ............................. 650 Figure 206. Buyers for the offshore wind supply chain................................ .................. 657 Figure 207. Investment in wind farms, £ million per MW, 2009 prices ........................... 660 Figure 208. ETP BLUE Map scenario projections for the development of onshore and
offshore wind investment costs ($ million/MW)................................ .......... 662 Figure 209. Offshore wind foundation structures ................................ ......................... 664 Figure 210. Floating turbines................................ ................................ ......................... 665 Figure 211. Offshore operating conditions................................ ................................ .... 669

8/3/2019 Wind Power Report 2010
http://slidepdf.com/reader/full/wind-power-report-2010 38/50
Page 34 of 695
Figure 212. Plans for an offshore grid in the North Sea and the Mediterranean............. 673 Figure 213. Repowering of the Bassens Windfarm in Lower Saxony, Germany .............. 675 Figure 214. Estimates new annual EU wind energy capacity, 2000-2030........................ 677 Figure 215. Price of used turbines compared to the price when new, % ........................ 678 Figure 216. Increase in turbine size, world average, 1997-2009 (kW)............................. 684 Figure 217. Average turbine size top 5 countries, MW................................ ................... 686 Figure 218. Average turbine size key European countries, MW................................ ...... 686 Figure 219. American states with 2 MW + turbines................................ ........................ 687 Figure 220. Expected market increase to meet demand for larger turbines ................... 688 Figure 221. Average wind turbine size for new offshore capacity additions, MW........... 689 Figure 222. Average wind turbine size for new offshore capacity additions in Europe,
MW ................................ ................................ ................................ ............. 689 Figure 223. Timeline of future developments in offshore turbine size ........................... 690 Figure 224. Growth in size of wind turbines since 1980 ................................ ................. 691 Figure 225. Siemens 3.6 MW gearless turbine A and Siemens geared turbine B ............ 693

8/3/2019 Wind Power Report 2010
http://slidepdf.com/reader/full/wind-power-report-2010 39/50
Page 35 of 695
List of Tables
Table 1. The 1 GW Club in 2009................................ ................................ .................. 50 Table 2. Installed wind generating capacity, 1990, 1995, 2000, 2005-2010, MW ........ 54 Table 3. National forecasts of wind energy development 2007 to 2012 ...................... 61 Table 4. Growth hot spots 2009 2012................................ ................................ ...... 65 Table 5. Typical capacity factors for different generating technologies....................... 69 Table 6. National targets under 2009 EU renewable legislation ................................ .. 87 Table 7. Renewable installed capacity projections ................................ ...................... 89 Table 8. Summary of the Copenhagen Accord ................................ ............................ 99 Table 9. Wind CDM projects, March 2010................................ ................................ 100 Table 10. Renewables targets and support schemes of European countries ............... 107 Table 11. Non-European countries with renewable energy targets and plans............. 120 Table 12. State RPS resource tiers................................ ................................ .............. 136 Table 13. Wind projects completed in the United States, 2009, >5MW ...................... 145 Table 14. Wind projects under construction in United States, as of December 2009 .. 149 Table 15. The ten largest wind farms operating in the United States, Q1 2010 ........... 152 Table 16. Offshore Exploration Leases for Wind Energy Production............................ 155 Table 17. States with offshore targets ................................ ................................ ........ 157 Table 18. Major owners of wind facilties in the United States, end 2009 .................... 168 Table 19. Sales of small wind turbines in the United States, units, 2008 ..................... 170 Table 20. US Bills in Congress ................................ ................................ ..................... 184 Table 21. Commercial production of turbines for domestic market ............................ 195 Table 22. Offshore wind projects in the pipeline................................ ......................... 195 Table 23. Feed-in tariffs in China ................................ ................................ ................ 200 Table 24. Approved wind projects ................................ ................................ .............. 202 Table 25. Decomissioned turbines ................................ ................................ .............. 216 Table 26. Offshore installations operating, under construction and planned in
Germany, Q1 2010 ................................ ................................ ...................... 218

8/3/2019 Wind Power Report 2010
http://slidepdf.com/reader/full/wind-power-report-2010 40/50
Page 36 of 695
Table 27. Shares of wind turbines by power group in the potential annual energy
yield, Germany, 1989 to 2008................................ ................................ ...... 226
Table 28. Capacity of installed wind turbines ................................ .............................. 227 Table 29. Number of wind turbines and capacity of each German TSO, February
2010 ................................ ................................ ................................ ............ 232 Table 30. Wind turbine capacity of major German distribution companies, February
2010, >100 MW................................ ................................ ........................... 232 Table 31. National and autonomous-region targets for wind energy 2010 to 2019,
MW ................................ ................................ ................................ ............. 242 Table 32. Regional distribution of wind power capacity (MW), 2009 .......................... 243 Table 33. Gamesa Eólicas international portfolio of farm wind farms ........................ 249 Table 34. Gamesa Eólicas turbine units sold ................................ .............................. 250 Table 35. ACCIONA Energys renewable energy portfolio ................................ ........... 251 Table 36. Location of ACCIONA projects ................................ ................................ ..... 251 Table 37. ACCIONA operating or completed wind turnkey projects ............................ 252 Table 38. Spanish wind developers share, 2009................................ ......................... 254 Table 39. Installed capacity of wind power by state, MW, 2003 - 2009 and
estimated potential ................................ ................................ ..................... 260 Table 40. Number of Approved Wind Farmable Sites by state, May 2009................... 264 Table 41. Economics of a typical wind farm in India................................ .................... 264 Table 42. Proposed wind farms in India ................................ ................................ ...... 267 Table 43. Loan schemes offered by IREDA for development of wind power, 2009 ...... 268 Table 44. Manufacturers approved by MNES, India, December 2009 ......................... 271 Table 45. Presence of Power Producers in the wind industry................................ ...... 279 Table 46. Wind parks in Austria > 10 MW (Accounting for 820 MW)........................... 283 Table 47. Offshore installations operating, under construction and planned in
Denmark ................................ ................................ ................................ ..... 293 Table 48. Number, capacity and average size of turbines installed annually ............... 342 Table 49. Windfarms in France > 15 MW, 2009 ................................ .......................... 343 Table 50. Status of projects in the pipelin in Greece at the end of 2009...................... 350

8/3/2019 Wind Power Report 2010
http://slidepdf.com/reader/full/wind-power-report-2010 41/50
Page 37 of 695
Table 51. Wind energy developers in Greece, 2007 ................................ .................... 357 Table 52. Major wind farms in Greece > 10 MW, end March 2010.............................. 358 Table 53. Consortia with offshore licences to 2003................................ ..................... 363 Table 54. Overall net cost benefit of 1,000 MW of additional offshore wind capacity . 365 Table 55. Wind farms in Ireland, 2009 > 10 MW ................................ ......................... 369 Table 56. Wind farms in Italy >20 MW ................................ ................................ ....... 374 Table 57. Off shore wind projects in operation, under construction and planned in
the Netherlands ................................ ................................ .......................... 381 Table 58. Wind energy generation by province, April 2010 ................................ ......... 382 Table 59. Wind farms in the Netherlands > 20 MW, end 2009 ................................ .... 385 Table 60. Wind farms in Norway > 20 MW, 2009 ................................ ........................ 391 Table 61. Operating wind farm > 20 MW, Q1 2010 ................................ ..................... 395 Table 62. Projects under construction, end Q1 2010 ................................ .................. 396 Table 63. Investments in the expansion of the grid system in Poland ......................... 398 Table 64. Wind farms under construction in Portugal, end 2009 ................................ 403 Table 65. Wind farms in Portugal > 20 MW ................................ ............................... 404 Table 66. Planned wind projects >10 MW, January 2010 ................................ ............ 411 Table 67. Offshore wind farms in operation, under construction and planned in
Sweden, end 2009................................ ................................ ....................... 412 Table 68. Operational wind farms, Turkey, February 2010 ................................ .......... 417 Table 69. Wind farms under construction, February 2010 ................................ .......... 418 Table 70. Status of wind farm development in the UK, MW, April 2010 ...................... 424 Table 71. UK wind farms in operation > 20 MW, 2009 ................................ ................ 425 Table 72. New projects entering planning in the UK since the last report ................... 428 Table 73. Contracts awarded for 9 exclusivity zones ................................ ................... 435 Table 74. Offshore wind farms UK, 2009................................ ................................ .... 436 Table 75. Offshore wind farms planned in the UK, 2009 ................................ ............. 439 Table 76. Offshore plans by political party ................................ ................................ .. 444 Table 77. New schemes in Australia in 2009 ................................ ............................... 449

8/3/2019 Wind Power Report 2010
http://slidepdf.com/reader/full/wind-power-report-2010 42/50
Page 38 of 695
Table 78. seven projets in the pipeline at the end of 2009................................ .......... 449 Table 79. Wind farms in Australia that offset desalination plants ............................... 450 Table 80. Utility feed-in tariffs for different states, 2010 ................................ ............ 453 Table 81. Operational wind farms in South Korea, end 2009 ................................ ...... 466 Table 82. Projects under development in South Korea, end 2009 ............................... 466 Table 83. Supply chain for wind components in South Korea ................................ ...... 473 Table 84. Planned phase 3 projects in Taiwan................................ ............................. 475 Table 85. Current installed capacity in operation, end 2009 ................................ ....... 483 Table 86. Renewable energy projects in Morocco, status end 2009 ............................ 484 Table 87. Wind farms in Brazil ................................ ................................ ................... 493 Table 88. Wind farms in Canada > 10 MW, Q1 2010 ................................ ................... 501 Table 89. Canadian Wind Energy Projects with a signed Power Purchase Agreement
and/or already under construction, as of April 2010................................ .... 504 Table 90. Provincial initiatives in Canada, Q1 2010 ................................ ..................... 510 Table 91. Small wind turbine manufacturers in Canada ................................ .............. 513 Table 92. Planned capacity in the north east region of Bulgaria, end 2009 ................. 516 Table 93. Projects added in 2009 in Czech Republic................................ .................... 519 Table 94. Planned onshore projects, end 2009 ................................ ........................... 528 Table 95. Planned offshore projects, end 2009 ................................ ........................... 529 Table 96. Wind projects in operation in New Zealand, end Q1 2010 ........................... 541 Table 97. Wind projects under construction and underdevelopment, end 2009 ......... 543 Table 98. Wind projects in the appeals process ................................ .......................... 543 Table 99. Projects in development stage in Kenya ................................ ...................... 550 Table 100. Projects in development in other countries in Africa ................................ ... 555 Table 101. Wind projects in operation in Chile, end 2009 ................................ ............. 558 Table 102. Wind projects in operation in Mexico, end 2009 ................................ ......... 560 Table 103. Wind projects under construction in Mexico, end 2009............................... 560 Table 104. Major wind turbine manufacturers and their main suppliers....................... 565 Table 105. Rough estimate of material cost without work per MW .............................. 568
8/3/2019 Wind Power Report 2010
http://slidepdf.com/reader/full/wind-power-report-2010 43/50
Page 39 of 695
Table 106. Requirements for rare earth metals ................................ ............................ 578 Table 107. Companies outside of China involved in rare earth metal exploration ......... 581 Table 108. Development stage of rare earth metal companies ................................ ..... 582 Table 109. Extreme changes in output (ramp rates) ................................ ..................... 588 Table 110. Overview of Operational and Commercial Wind Power Forecasting
Systems, November 2009 ................................ ................................ ............ 589 Table 111. Energy storage technologies................................ ................................ ........ 595 Table 112. Latest prices for energy storage in Great Britain and Germany.................... 595 Table 113. Companies investigating the use of battery storage ................................ .... 598 Table 114. Wind energy developers................................ ................................ .............. 602 Table 115. Water footprint of different primary energy carriers ................................ ... 615 Table 116. Advantages and disadvantages of different types of renewable energy ...... 616 Table 117. Global installed base of Vestas wind turbines by country, end 2009............ 623 Table 118. Global installed base of Vestas wind turbines by size (output), end 2009 .... 626 Table 119. Vestas facilities 2010 ................................ ................................ .................. 627 Table 120. Siemens Power Generation sale of turbines ................................ ............. 637 Table 121. Nordex sales of turbines................................ ................................ ........... 641 Table 122. Development of offshore and near shore in future key markets based on
planned activity to 2020, as of April 2010 ................................ .................... 645 Table 123. Offshore projects funded by the European Economic Recovery Plan........... 646 Table 124. Planned capacity in MW, end 2009 ................................ ............................ 651 Table 125. EU companies with proven experience in offshore wind ............................. 652 Table 126. Past and confirmed supply contracts for offshore wind farms ..................... 653 Table 127. Known patent applications related to offshore wind, 2009 ......................... 655 Table 128. Typical component costs of offshore wind turbines ................................ .... 661 Table 129. Offshore vs. onshore costs ................................ ................................ .......... 661 Table 130. Advantages and disadvantages of different offshore foundations ............... 666 Table 131. EU manufacturers of offshore wind foundations ................................ ......... 667

8/3/2019 Wind Power Report 2010
http://slidepdf.com/reader/full/wind-power-report-2010 44/50
Page 40 of 695
Table 132. Selection of vessels and jack-up barges currently active in wind
installation with an operating depth of < 30m................................ ............. 667
Table 133. Ports with deep water and reinforced quaysides for heavy wind turbines... 670 Table 134. Advantages and disadvantages of repowering................................ ............. 676 Table 135. Trading companies for used turbines ................................ .......................... 679 Table 136. Recyclable components of a wind turbine ................................ ................... 680 Table 137. Progress ratios for wind turbines ................................ ............................... 682 Table 138. Technology characteristics of wind turbines ................................ ................ 683

8/3/2019 Wind Power Report 2010
http://slidepdf.com/reader/full/wind-power-report-2010 45/50
Page 47 of 695
1 The development of wind energy: the market in 2010
World wind energy installed capacity was 158 GW by the end of 2009, with 37 GW added
during the year, this represents a 31% increase on 2008 and is an even greater percentage year on year increase than we saw between 2006 and 2007 (26%).
Last year was a better year than expected with an extra 12.5 GW installed compared to
estimates from the GWEC.
1990 1991 1992 1993 1994 1995 1996 1997 1998 1999 2000 2001 2002 2003 2004 2005 2006 2007 2008 2009 2010 2011 2012 2013 2014
GW 2.4 2.7 3 3.1 3.8 4.9 6 7 9.7 13 17.5 24.3 31.1 39.2 47.5 59.1 74 93.8 121 158.5 199.9 243.9 292 346.5 409
0
50
100
150
200
250
300
350
400
450
Figure 1. Global wind power installed capacity, GW 1990-2014
Source; GWEC
It is estimated that it will reach 200 GW by the end of 2010. This would represent 26%
growth on 2009, the slowing in the market due to the global economic environment, con-tinued uncertainty and the difficulty to raise capital.
The growth in 2009 was primarily associated with China, where a record 13.8 GW was
added more than doubling the capacity to 26 GW, and USA, where 10 GW was added,
increasing the capacity by 40% to 35 GW.
However, outside of these two countries, capacity growth within the remaining Top Ten
countries remained at 9%, so in order to maintain momentum we are beginning to see the
process of globalisation of the wind industry as more countries begin to make significant
investment, particularly in South America, North Africa and Eastern Europe. While the Top
Ten countries still accounted for approximately 87% of the global market in 2009 (the same

8/3/2019 Wind Power Report 2010
http://slidepdf.com/reader/full/wind-power-report-2010 46/50
Page 191 of 695
Figure 43. DC-grid under construction around Guangzhou
Source; Siemens
The far north of China experiences sub zeros temperatures, and therefore needs cold
resilient turbines.
5.2.5 Present Status of Development
There have been three stages in the development of grid-connected wind farms.
In the initial demonstration period (1986-1993), the main activity was to build small-scale
demonstration wind farms by utilising grants from foreign donor countries and loans.
Support from the government was mainly in terms of financial backing, such as investment in wind farm projects or in the development of wind turbines.
In the industrialisation period (1994-2003), the former Ministry of Electric Power proposed a
wind power industrialisation programme, including the early stages of wind farm construc-
tion in 1993. The following year it was decided that the grid utility should facilitate the
connection of wind farms to the nearest grid and all the electricity generated by wind farms
should be purchased. The grid tariff would be calculated as the sum of power generation
costs, loan payments and a reasonable profit. The difference between the wind electricity

8/3/2019 Wind Power Report 2010
http://slidepdf.com/reader/full/wind-power-report-2010 47/50
Page 353 of 695
Figure 90 . Wind resources in Greece
Source; CRES
6.4.3 Offshore
Greece has extensive offshore wind resources.
Several offshore projects are in the planning stages:
216 MW project off the coast of Thrace being developed by Copelouzos;
600 MW project off the coast of Thrace being developed by Terna;
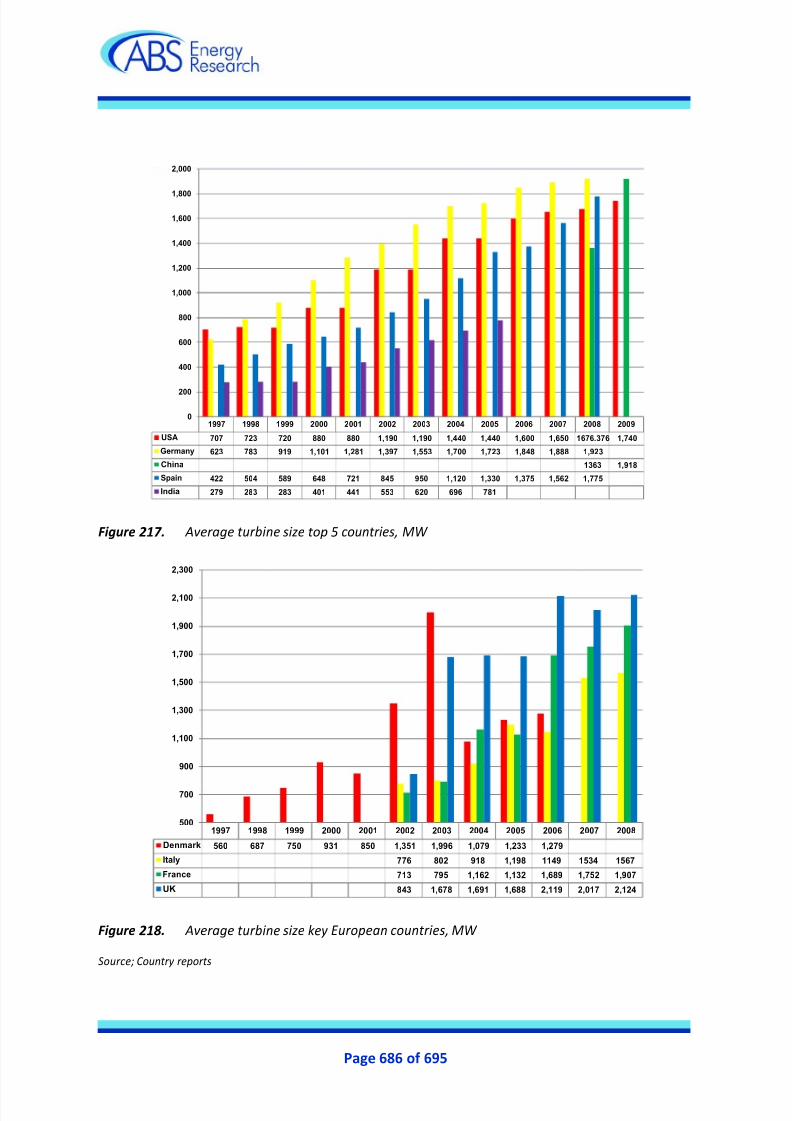
8/3/2019 Wind Power Report 2010
http://slidepdf.com/reader/full/wind-power-report-2010 48/50
Page 686 of 695
1997 1998 1999 2000 2001 2002 2003 2004 2005 2006 2007 2008 2009
USA 707 723 720 880 880 1,190 1,190 1,440 1,440 1,600 1,650 1676.376 1,740
Germany 623 783 919 1,101 1,281 1,397 1,553 1,700 1,723 1,848 1,888 1,923
China 1363 1,918
Spain 422 504 589 648 721 845 950 1,120 1,330 1,375 1,562 1,775
India 279 283 283 401 441 553 620 696 781
0
200
400
600
800
1,000
1,200
1,400
1,600
1,800
2,000
Figure 217 . Average turbine size top 5 countries, MW
1997 1998 1999 2000 2001 2002 2003 2004 2005 2006 2007 2008
Denmark 560 687 750 931 850 1,351 1,996 1,079 1,233 1,279
Italy 776 802 918 1,198 1149 1534 1567
France 713 795 1,162 1,132 1,689 1,752 1,907
UK 843 1,678 1,691 1,688 2,119 2,017 2,124
500
700
900
1,100
1,300
1,500
1,700
1,900
2,100
2,300
Figure 218 . Average turbine size key European countries, MW
Source; Country reports

8/3/2019 Wind Power Report 2010
http://slidepdf.com/reader/full/wind-power-report-2010 49/50
Page 688 of 695
capacity blades. Only one turbine manufacturer, Vestas, has submitted patents for compos-
ite materials for wind turbines so far. Over the next seven years the market for 1.5 MW+ will increase to meet demand for larger
turbines. There will still be a market for small turbines, mainly from developing countries,
remote locations and for companies generating their own electricity needs. Forecast of
market share for different turbine sizes, %:
0
10
20
30
40
50
60
70
80
90
100
2005 2006 2007 2008 2009 2010 2011 2012 2013 2014 2015 2016 2017
< 750kW 751kW-1,500kW 1,501 kW-2,500 kW > 2,500 kW
Figure 220 . Expected market increase to meet demand for larger turbines
26.2 Offshore
Since the first offshore turbine was installed in 1992, offshore turbines have been increasing
in size both size and capacity at a faster rate than onshore turbines. Between 2001 and 2009
there was an in the average rating of new installed capacity in Europe. The largest turbines
in operation are the 5 MW Multibrid and 5 MW REpower turbines at the Alpha Ventus and
Hooksiel wind farms in Germany. REpower claims its 5 MW offshore turbine can operate at
6 MW.

8/3/2019 Wind Power Report 2010
http://slidepdf.com/reader/full/wind-power-report-2010 50/50
ORDER FORM
Name of Report Quantity Price
*Add hard copy costs
*Add hard copy and PDF costs
Total
PLEASE CONFIRM THE FOLLOWING DETAILS:
Name……………………………………………………………………………………………Title Mr/Mrs/Miss/Ms/Dr/Other (Please circle)
Job Title…………………………………………………………………………Department…………………………………………………………………….
Company…………………………………………………………………………………………………………………………………………………………………
Address…………………………………………………………………………………………………………………………………………………………………...
Postcode…………………………City……………………………………………………County/State…………………………………………………….
Country……………………………………………… Email………………………………………………………………………………………………………..
Tel……………………………………………………………… Fax……………………………………………………………………………
Your preferred method of delivery:
Hard copy PDF (via email – 1-3 users only) PDF & Hard copy
* Add i t i ona l cha rges : PDF (1-3 users only ): No extra costsHardcopy: UK - £40, Europe - £60/€100, Rest of world - £75/$150Hardcopy and PDF(1-3 users only): UK - £85,Europe - £105/€175, Rest of world - £120/$240Courier costs are inclusiveFor mul t ip le users o f PDF f i les and mu l t ip le har d copies p lease contact in fo@absenergyr esearch.com
Please note VAT is added wher e appl icab le for UK customers
Payment method:
Credit Card Bank Transfer Cheque Invoice
I enclose a cheque payable to ABS Energy Research for the sum of …………………………………
Please debit my credit card (please tick choice) AMEX □ Mastercard□ Visa □
Card No ………………………………………………………………………………Expiry Date………………………………………….
Card Verification Number (last 3 numbers on back of card)…………………………………………………………..
Signature …………………………………………………………………………………………………………………………………………..
VAT/TVA Number……………………………………………………………………………………………………………………………….
Please send me details of other ABS products and services
Are you responsible for ad hoc market research? If not please confirm details of the person responsible:
Name………………………………………………………………………… Tel…………………………………………………
Fax…………………………………………… Email……………………………………………………………………………..
How did you hear about us? Website □ Advert □ Email □ Press release □ Direct mail □ Other – please specify □