Wind Power, an Economic Option for Egypt? - … Power... · Wind Power, an Economic Option for...
22
March 2010 Wind Power, an Economic Option for Egypt? Yasser Sherif – Environics Based on : Clean Energy Investment in Developing Countries: Wind Power In Egypt IISD, Oct. 2009 (El Sobki, M. - Wooders, P. - Sherif, Y.) http://www.iisd.org/pdf/bali_2_copenhagen_egypt_wind.pdf
Transcript of Wind Power, an Economic Option for Egypt? - … Power... · Wind Power, an Economic Option for...

March 2010
Wind Power, an Economic Option for Egypt?
Yasser Sherif – Environics
Based on :Clean Energy Investment in Developing Countries: Wind Power In Egypt
IISD, Oct. 2009 (El Sobki, M. - Wooders, P. - Sherif, Y.)
http://www.iisd.org/pdf/bali_2_copenhagen_egypt_wind.pdf
March 2010
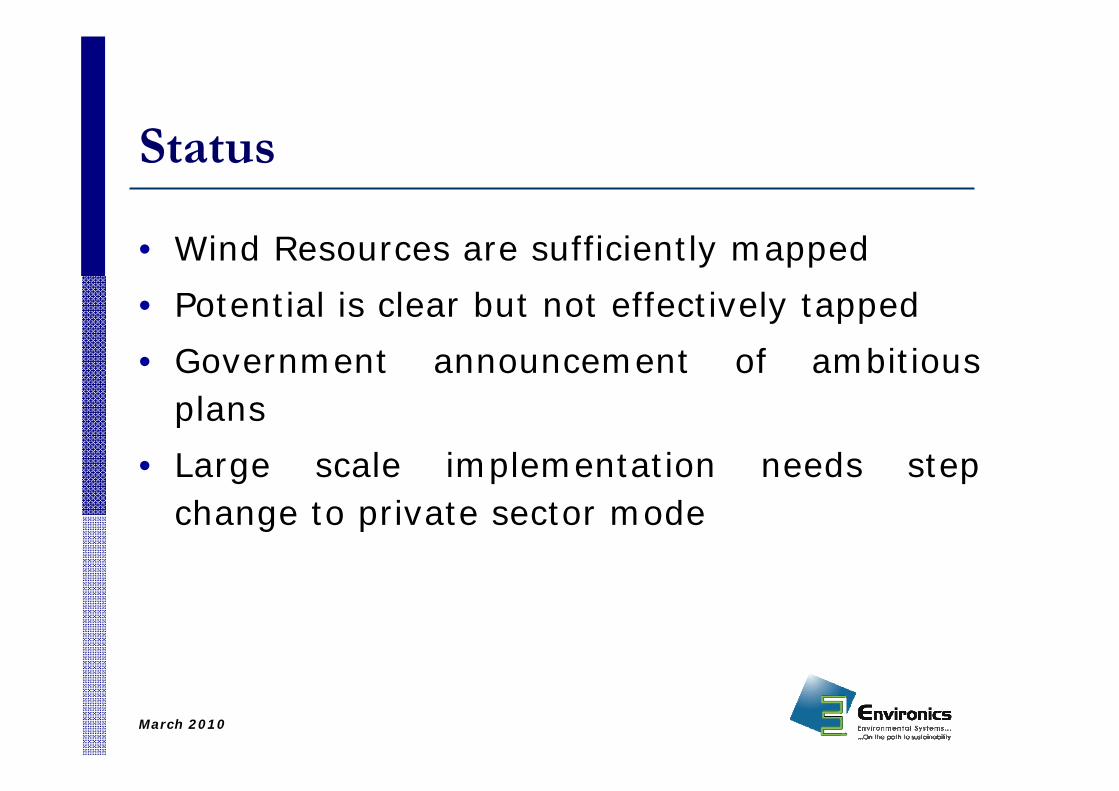
Status
• Wind Resources are sufficiently mapped• Potential is clear but not effectively tapped• Government announcement of ambitious
plans• Large scale implementation needs step
change to private sector mode
March 2010
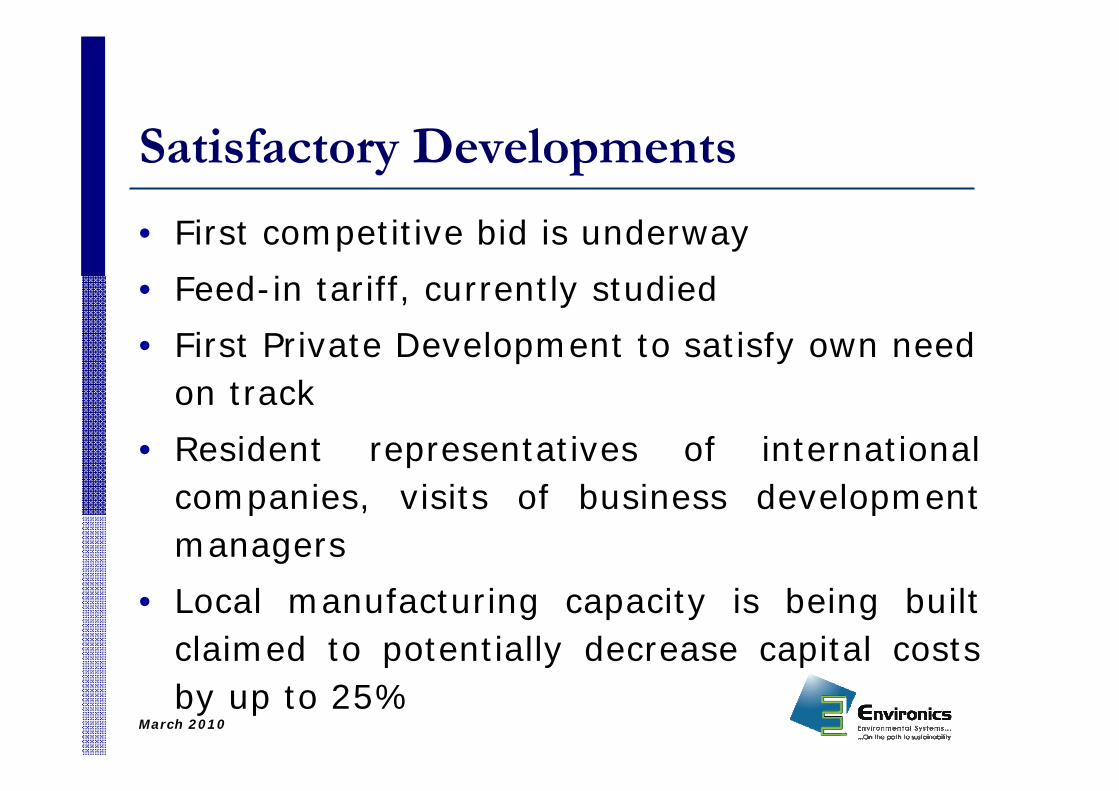
Satisfactory Developments
• First competitive bid is underway• Feed-in tariff, currently studied• First Private Development to satisfy own need
on track• Resident representatives of international
companies, visits of business development managers
• Local manufacturing capacity is being built claimed to potentially decrease capital costs by up to 25%
March 2010
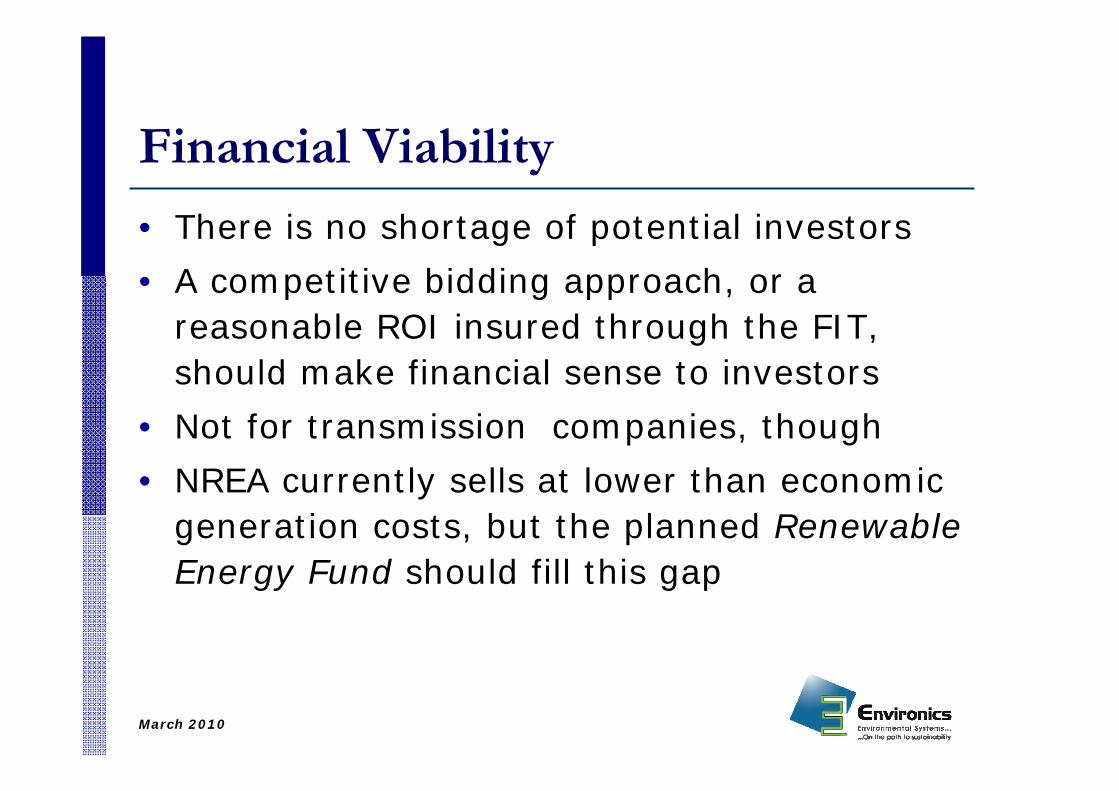
Financial Viability
• There is no shortage of potential investors• A competitive bidding approach, or a
reasonable ROI insured through the FIT, should make financial sense to investors
• Not for transmission companies, though• NREA currently sells at lower than economic
generation costs, but the planned Renewable Energy Fund should fill this gap
March 2010
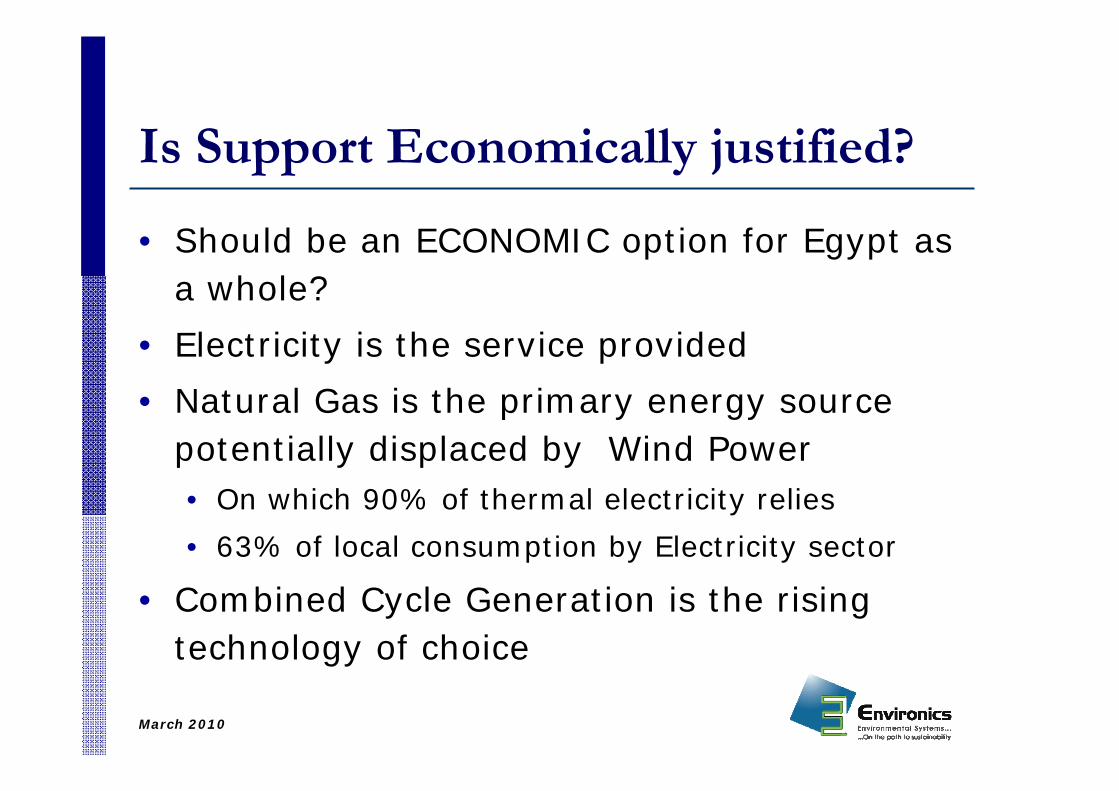
Is Support Economically justified?
• Should be an ECONOMIC option for Egypt as a whole?
• Electricity is the service provided• Natural Gas is the primary energy source
potentially displaced by Wind Power• On which 90% of thermal electricity relies • 63% of local consumption by Electricity sector
• Combined Cycle Generation is the rising technology of choice

March 2010
Generating Capacity, 1980-2006
0
5000
10000
15000
20000
25000
1980 1985 1990 1995 2000 2005
Cap
acity
(MW
)
CombinedCycle GasTurbineGas Turbine
Steam Turbine
Hydro
Source: EEHC annual reports
March 2010
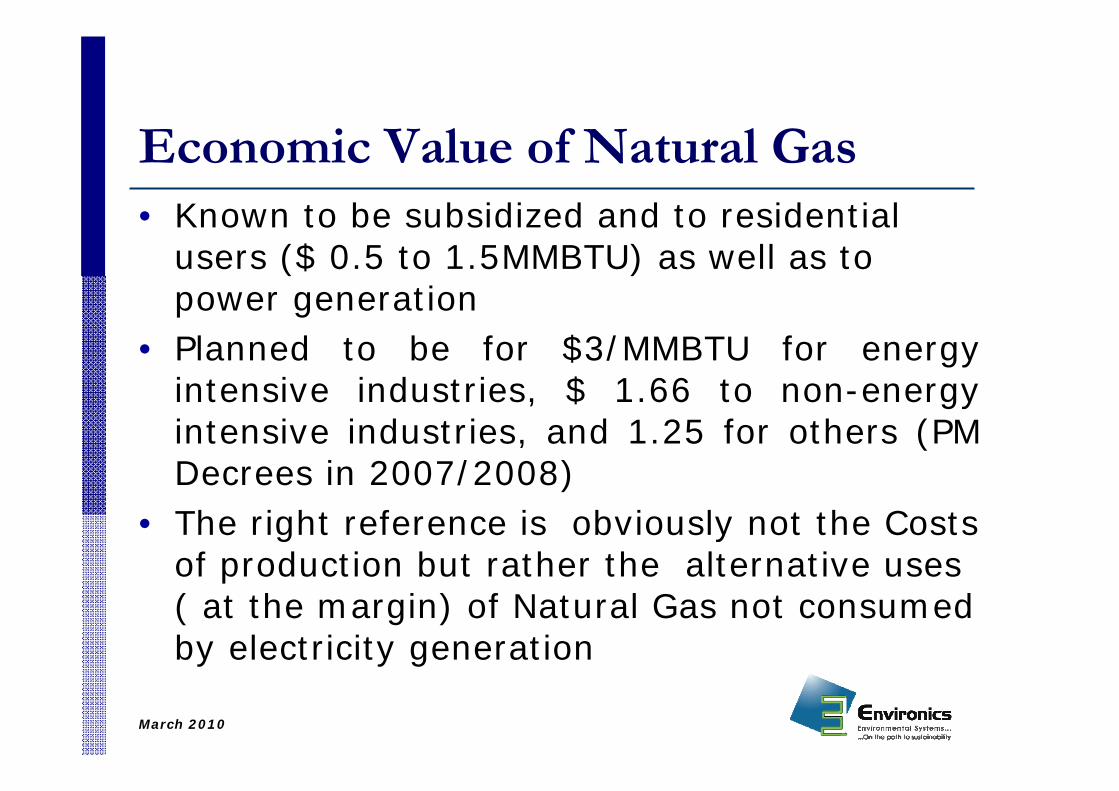
Economic Value of Natural Gas• Known to be subsidized and to residential
users ($ 0.5 to 1.5MMBTU) as well as to power generation
• Planned to be for $3/MMBTU for energy intensive industries, $ 1.66 to non-energy intensive industries, and 1.25 for others (PM Decrees in 2007/2008)
• The right reference is obviously not the Costs of production but rather the alternative uses ( at the margin) of Natural Gas not consumed by electricity generation
March 2010
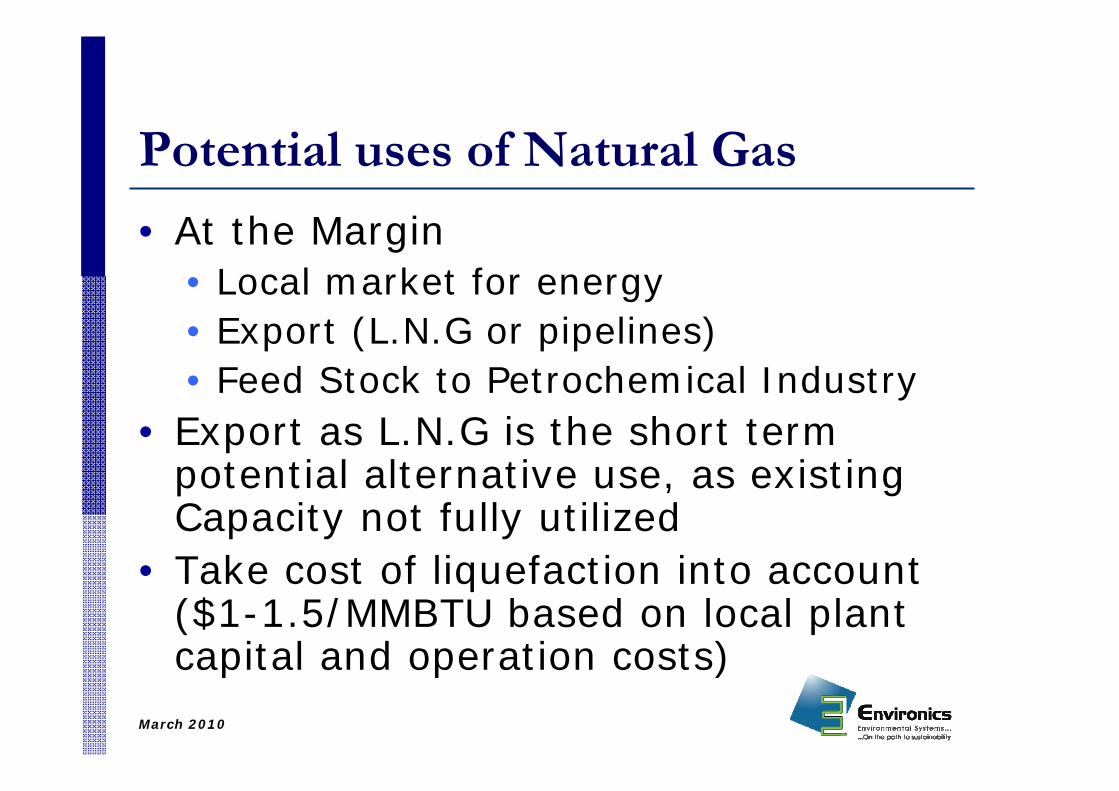
Potential uses of Natural Gas
• At the Margin• Local market for energy• Export (L.N.G or pipelines)• Feed Stock to Petrochemical Industry
• Export as L.N.G is the short term potential alternative use, as existing Capacity not fully utilized
• Take cost of liquefaction into account ($1-1.5/MMBTU based on local plant capital and operation costs)

March 2010
World Market Prices
• There is no single figure • No published figures for LNG export contracts• Figures reported to have been as low as
$2/MMBTU for some older contracts and reached $3-4.5/MMBTU for more recent ones.
• But opportunity Costs are related to future rather than historical prices.

March 2010
Volatile Market PricesMarch 2008- March 2009 March 2009- March 2010
Source: US Nymex-Henry Hub; 2009, 2010
March 2010
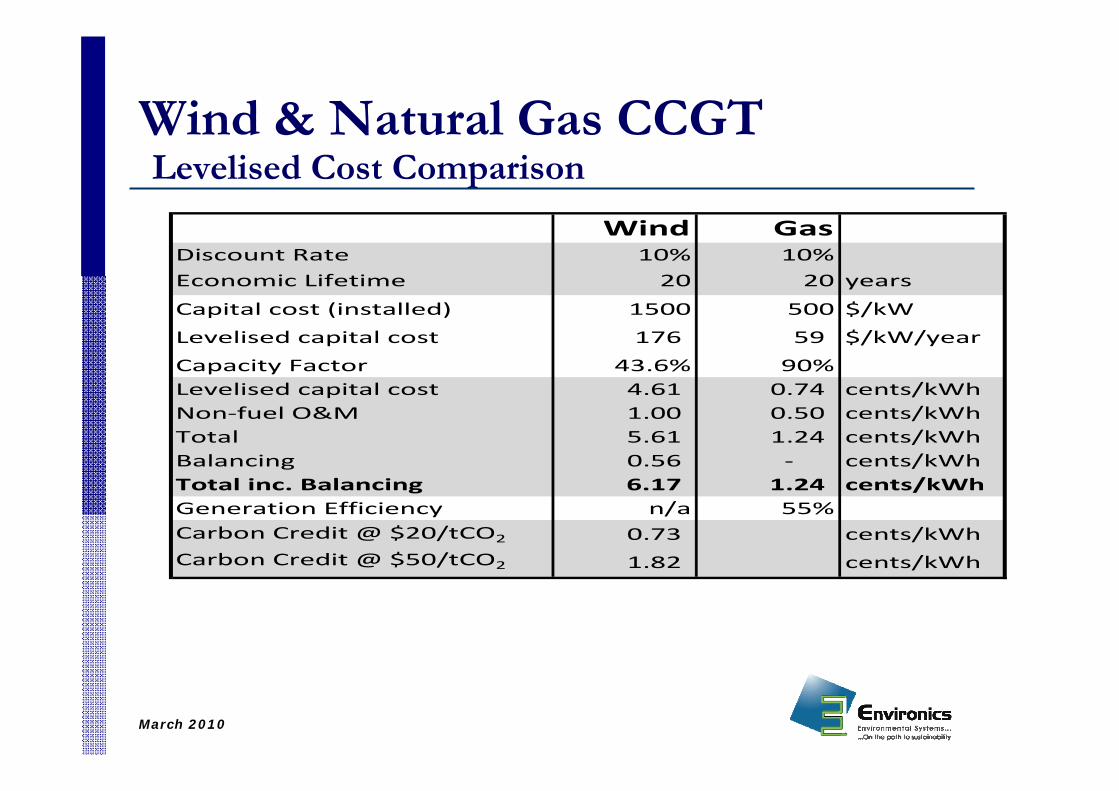
Wind & Natural Gas CCGTLevelised Cost Comparison
Wind GasDiscount Rate 10% 10%Economic Lifetime 20 20 years
Capital cost (installed) 1500 500 $/kW
Levelised capital cost 176 59 $/kW/year
Capacity Factor 43.6% 90%Levelised capital cost 4.61 0.74 cents/kWhNon‐fuel O&M 1.00 0.50 cents/kWhTotal 5.61 1.24 cents/kWhBalancing 0.56 ‐ cents/kWhTotal inc. Balancing 6.17 1.24 cents/kWhGeneration Efficiency n/a 55%Carbon Credit @ $20/tCO2 0.73 cents/kWhCarbon Credit @ $50/tCO2 1.82 cents/kWh
March 2010
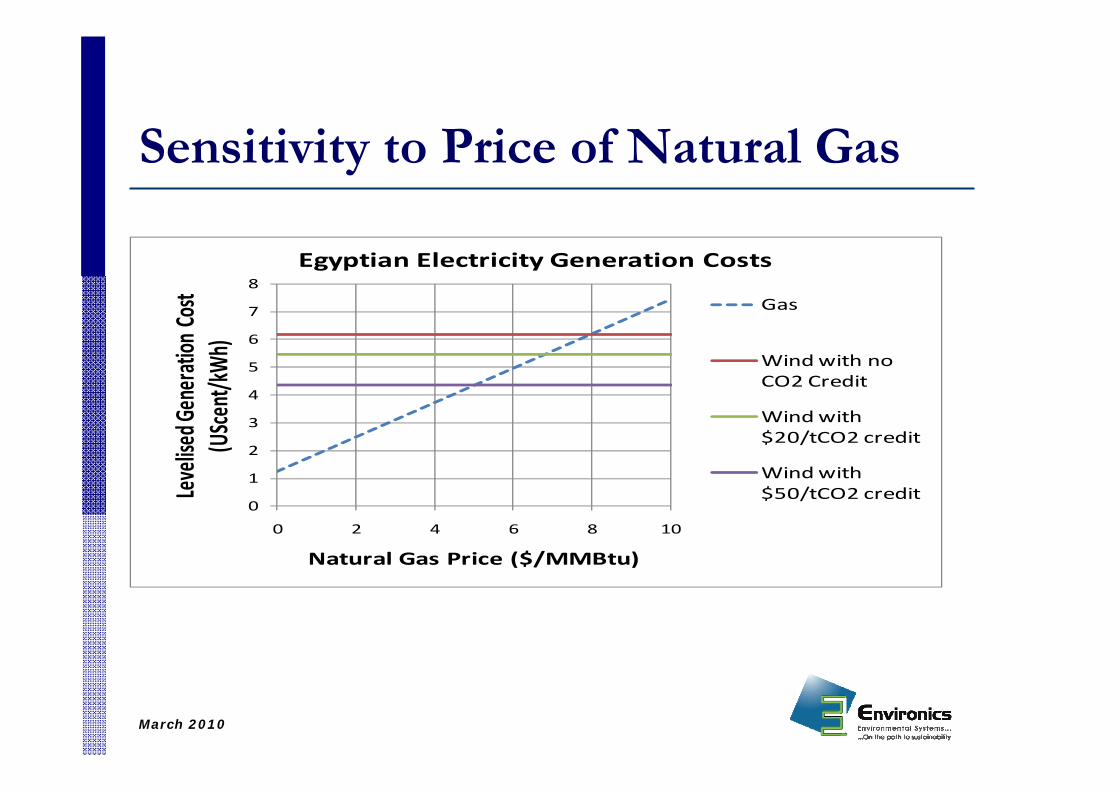
Sensitivity to Price of Natural Gas
0
1
2
3
4
5
6
7
8
0 2 4 6 8 10
Levelised
Gene
ratio
n Co
st (UScen
t/kWh)
Natural Gas Price ($/MMBtu)
Egyptian Electricity Generation Costs
Gas
Wind with no CO2 Credit
Wind with $20/tCO2 credit
Wind with $50/tCO2 credit
March 2010
Tipping points
• Depends on Carbon Credits• Without carbon credits, Gas prices of
$8/MMBTU• With $20/ton CO2, $7/MMBTU• With $50/ton CO2, $5/MMBTU
• CDM Carbon Credits are currently less than $20, but European Renewable Incentives are higher.
March 2010
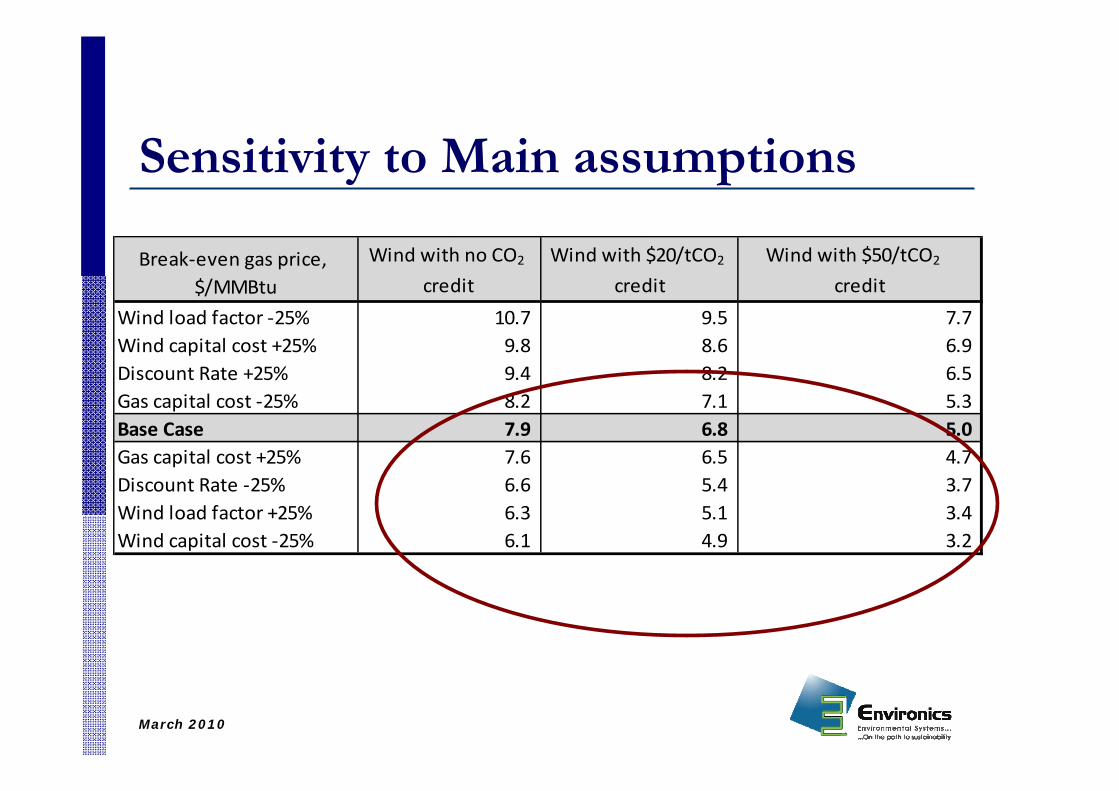
Sensitivity to Main assumptions
Break‐even gas price, $/MMBtu
Wind with $50/tCO2
credit
Wind load factor ‐25% 9.5 7.7 Wind capital cost +25% 9.8 8.6 6.9 Discount Rate +25% 9.4 8.2 6.5 Gas capital cost ‐25% 8.2 7.1 5.3 Base Case 7.9 6.8 5.0 Gas capital cost +25% 7.6 6.5 4.7 Discount Rate ‐25% 6.6 5.4 3.7 Wind load factor +25% 6.3 5.1 3.4 Wind capital cost ‐25% 6.1 4.9 3.2
Wind with no CO2
credit
Wind with $20/tCO2
credit
10.7
March 2010
Statically…
• At today’s prices, marginally feasible economically
• But as we are planning for the future…..• Forecasts for Natural Gas Prices are
consistently above $6/MMBTU and smoothly rising from 2012 onwards.
• First private wind power development coming on line in 2013 will be in this context

March 2010
Energy Security of Supply
• The development of wind power needs to be seen within the context of fossil fuel resources in Egypt
• …And rising local demand for Energy

March 2010
Rising Electricity Demand
Evolution of the Peak Demand till 2027
18430 1964025110
3332043020
54200
010000
2000030000
4000050000
60000
2006
/200
7
2007
/200
8
2011
/201
2
2016
/201
7
2021
/202
2
2024
/202
7
Deman
d (M
W)
Source: Presentation by Dr. Galal Othman, Vice President of World Wind Energy Association,2008
March 2010
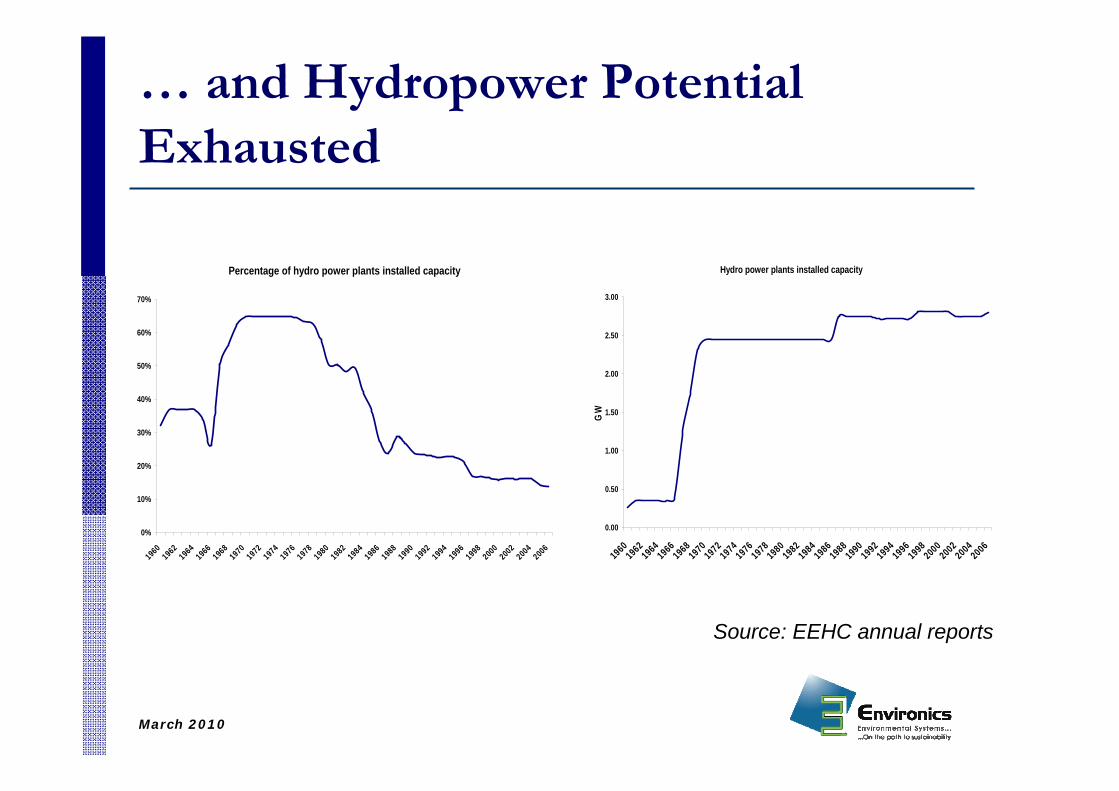
… and Hydropower Potential Exhausted
Hydro power plants installed capacity
0.00
0.50
1.00
1.50
2.00
2.50
3.00
196019621964196619681970197219741976197819801982198419861988199019921994199619982000200220042006
GW
Percentage of hydro power plants installed capacity
0%
10%
20%
30%
40%
50%
60%
70%
196019621964196619681970197219741976197819801982198419861988199019921994199619982000200220042006
Source: EEHC annual reports
March 2010
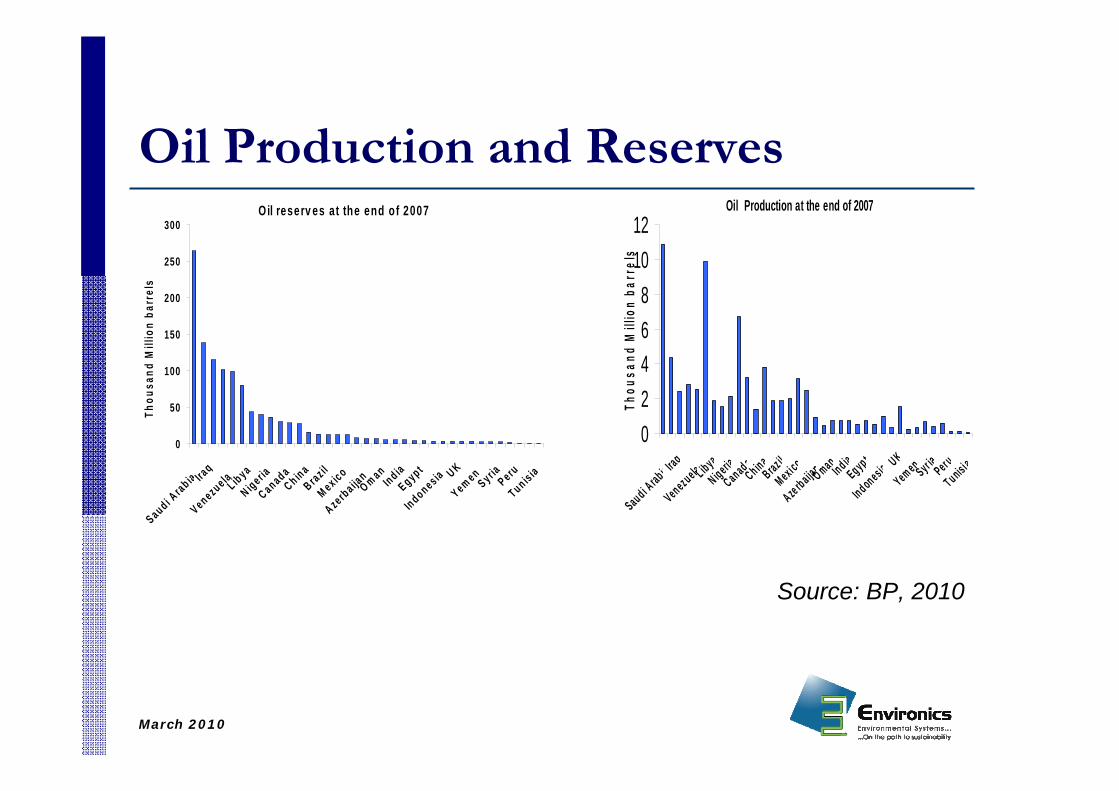
Oil Production and Reserves
Source: BP, 2010
Oil reserv es at the end of 2007
0
50
100
150
200
250
300
Saud i Arab ia Ira
qV enezue laL ib ya
N ige riaC an ada
C h in aB raz il
M ex icoA ze rba ija
nO m an
Ind iaE gyp t
In don es ia U KY em en
Sy ria P e ruTun is ia
Thou
sand
Mill
ion
barr
els
Oil Production at the end of 2007
02468
1012
Saud i A rab ia IraqVenezuelaL ibya
N igeriaCanada
Ch inaB raz il
Mexi coAze rbaijanO man
Ind iaEgyp t
In donesia UKYem en Syr ia Per uTunisi a
Thou
sand
Mill
ion
barr
els
March 2010
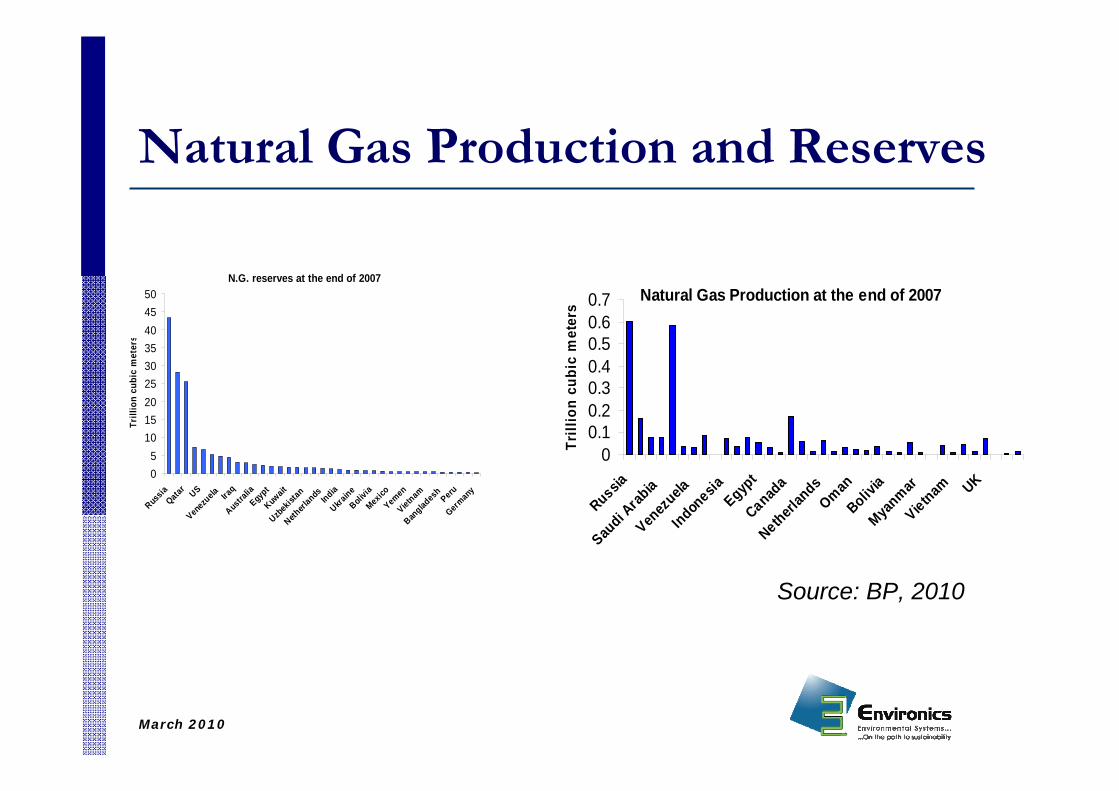
Natural Gas Production and Reserves
N.G. reserves at the end of 2007
05
101520253035404550
Russia
Qatar USVen
ezuela Ira
qAustr
aliaEgyptKuwait
Uzbek
istan
Netherl
andsIndia
Ukraine
Bolivia
MexicoYemenVietnam
Banglad
eshPeru
Germany
Trill
ion
cubi
c m
eter
s
Natural Gas Production at the end of 2007
00.10.20.30.40.50.60.7
RussiaSau
di Arab
iaVen
ezuela
IndonesiaEgyp
tCanad
aNetherl
ands
OmanBoliv
iaMya
nmarVietnam UK
Trill
ion
cubi
c m
eter
sSource: BP, 2010

March 2010
Dynamically…
• Oil Production/Reserves Ratio: 0.06 (compared to World Average of 0.02)
• NG Production/ Reserves Ratio:0.028 (compared to World Average of 0.01)
• As opposed to Oil, Natural Gas Production Expected to double in 2030 while demand for Electricity should triple.
• If trend continues, almost all Natural Gas produced should go to power generation
March 2010
A Change in Perspective
• Given the recent, and potential future, price shocks…. And a thinning local resource buffer
• The life of Egypt’s non-renewable resources has to be expanded
• The question becomes not WHETHER to develop wind resources but HOW to improve the economics of its development• Tap on European Renewable Incentives ?• Reduce capital costs ? Local Manufacturing?• ….Raise the REAL opportunity cost of NG ?