
Wind m s - ecosmagazine.com
2
Over a short time span the wind seems very fickle. However, the average character of the wind at a given spot over months and years is much more regular. information, they have more than made up for this loss in the detail of wind strength presented. This information is important for sci- entists and engineers undertaking wind- energy research. It is also very useful in a wide range of other fields, such as wind- erosion control, evaporation, and pollu- tion dispersal. This characteristic has allowed scien- tists at the CSIRO Division of Land Use Research to compile maps showing the wind's strength over the whole of the Australian continent for each month. The maps are of two sorts: one type shows average wind speed at fixed times — 9 a.m. and 3 p.m. — while the other shows the speed integrated over a day — the daily 'wind-run'. The second group of maps was derived from the first — at first thought an im- possible task — with the help of another map that shows a measure of the distri- bution of wind speeds throughout the day at 73 sites across the country. These wind- speed distributions were ascertained for the major weather stations where Bureau of Meteorology observers record wind speed at 3-hour intervals. The resultant wind maps are the first of their kind to be compiled for Australia. Previously, researchers had to make do with a map of the country upon which a couple of dozen wind 'roses', giving some information on wind direction and inten- sity, were scattered. Although the new maps have sacrificed the wind direction The wind-speed maps are based on data from about 500 stations throughout Aus- tralia, where Bureau of Meteorology ob- servers note the wind strength on the Beaufort scale at 9 a.m. and 3 p.m. This subjective rating (see the box) is ob- viously liable to error. But the researchers averaged and smoothed the readings using a special computer program, and they es- timate that the final mapped figures should be accurate to within 1 metre per second (3•6 km per hour). The 3-hourly wind-speed data obtained from anemometers at the 73 major sta- tions allowed a good estimate of daily wind-run (the average wind speed ex- pressed in terms of kilometres per day) to be calculated for each of these stations. The researchers made use of these cal- culations in deriving wind-run data for all the other stations. First they averaged the 9 a.m. and 3 p.m. wind-speed readings. Then they plotted on a map the ratio of the calculated wind-run figure for each major station to the average of the 9 a.m. and 3 p.m. speeds for that station. Again, computer smoothing of the data was used. As this ratio was found to vary evenly across the continent, they were able to determine for each minor station the ratio needed to obtain a reasonably accurate wind-run figure from the average of the 9 a.m. and 3 p.m. wind-speed values. And so wind-run information for the whole continent is now available in monthly maps. Highest speeds Interestingly, maximum monthly aver- age speeds at 3 p.m. are always 1—2 m per second greater than those at 9 a.m. The highest speeds, 7—8 m per second, are recorded in November, with April being the month with the lowest average speeds. The bulk of the Australian continent has mean wind speeds that don't exceed 5 m per second in any month, a gloomy outlook for wind-power generation. 24 s Wind m
Transcript of Wind m s - ecosmagazine.com

Over a short time span the wind seems very fickle. However, the average character of the wind at a given spot over months and years is much more regular.
informat ion , they have m o r e than made
u p for this l o s s in the deta i l o f w i n d
strength presented.
T h i s in format ion is important for sci
entists and engineers undertaking wind-
energy research. It is also very useful in
a w ide range o f other f ields, s u c h as w ind -
e ros ion con t ro l , evaporat ion, and po l lu
t ion dispersal .
T h i s characterist ic has a l l owed sc ien
tists at the CSIRO D i v i s i o n o f L a n d U s e
R e s e a r c h to c o m p i l e maps s h o w i n g the
w i n d ' s s t rength over the w h o l e o f the
Austral ian con t inen t for each m o n t h .
T h e maps are o f t w o sorts: o n e type
s h o w s average w i n d speed at f ixed t imes
— 9 a.m. and 3 p . m . — wh i l e the other
s h o w s the speed integrated over a day
— the daily 'wind-run ' .
T h e s e c o n d g r o u p o f maps was derived
f rom the first — at first though t an i m
poss ib le task — with the he lp o f another
m a p that s h o w s a measure o f the distri
bu t ion o f w i n d speeds th roughout the day
at 73 sites across the country. T h e s e wind-
speed dis t r ibut ions were ascertained for
the major weather stations w h e r e Bureau
o f M e t e o r o l o g y obse rve r s r e c o r d w i n d
speed at 3-hour intervals.
T h e resultant w i n d maps are the first
o f their k ind to be c o m p i l e d for Austral ia .
Previous ly , researchers had to make d o
wi th a m a p o f the count ry u p o n w h i c h a
c o u p l e o f dozen w i n d ' roses ' , g iv ing s o m e
informat ion o n w i n d d i rec t ion and inten
sity, were scattered. A l t h o u g h the n e w
maps have sacr i f iced the w i n d d i rec t ion
T h e wind- speed maps are based o n data
f rom about 500 stations th roughou t A u s
tralia, where Bureau o f M e t e o r o l o g y o b
servers no t e the w i n d strength o n the
Beaufort scale at 9 a.m. and 3 p .m. T h i s
s u b j e c t i v e ra t ing (see the b o x ) is o b
v ious ly l iable to error. But the researchers
averaged and smoothed the readings using
a special c o m p u t e r p rogram, and they es
timate that the final mapped figures should
be accurate to wi th in 1 metre per s e c o n d
(3 •6 k m per hour ) .
T h e 3-hourly wind-speed data obta ined
f rom anemomete r s at the 73 major sta
t ions a l l o w e d a g o o d es t imate o f dai ly
w i n d - r u n (the average w i n d speed e x
pressed in terms o f k i lometres per day) to
be ca lcu la ted for each o f these stations.
T h e researchers made use o f these cal
cu la t ions in der iving wind- run data for
all the o ther stations. First they averaged
the 9 a.m. and 3 p . m . wind-speed readings .
T h e n they plot ted o n a m a p the ratio o f
the ca lcula ted wind- run figure for each
major station to the average o f the 9 a.m.
and 3 p . m . speeds for that station. A g a i n ,
compu te r s m o o t h i n g o f the data was used.
A s this ratio was found to vary evenly
across the con t inen t , they were able to
de termine for e a c h m i n o r station the ratio
needed to obtain a reasonably accurate
wind-run figure f rom the average o f the
9 a.m. and 3 p .m. wind-speed values . A n d
so wind- run informat ion for the w h o l e
con t inen t is n o w available in m o n t h l y
maps .
Highest speeds
Interest ingly, m a x i m u m mon th ly aver
age speeds at 3 p . m . are always 1—2 m per
s e c o n d greater than those at 9 a.m. T h e
h ighes t speeds , 7—8 m per s e c o n d , are
recorded in N o v e m b e r , wi th Apr i l be ing
the m o n t h wi th the l owes t average speeds .
T h e b u l k o f the Austral ian con t inen t
has mean w i n d speeds that d o n ' t e x c e e d
5 m per s e c o n d in any mon th , a g l o o m y
o u t l o o k for w i n d - p o w e r generat ion.
24
s Wind m
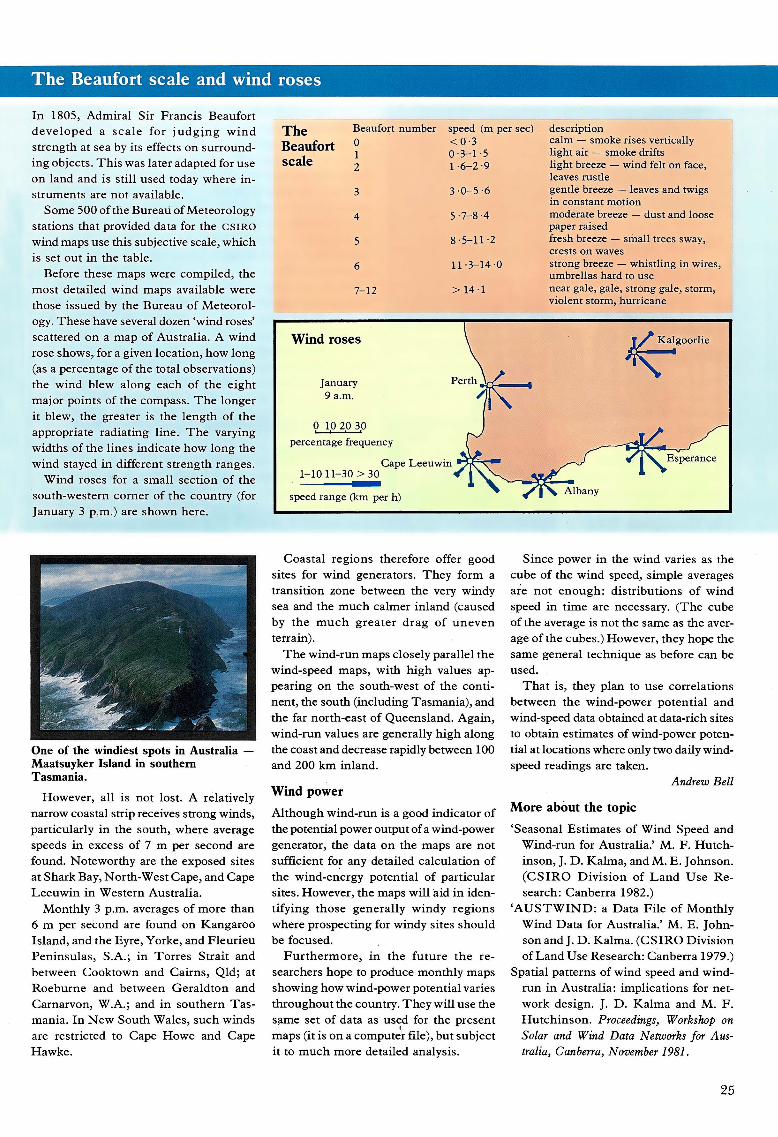
The Beaufort scale and wind roses
In 1805 , A d m i r a l Sir Francis Beaufor t d e v e l o p e d a s c a l e fo r j u d g i n g w i n d strength at sea by its effects o n surrounding ob jec t s . T h i s was later adapted for use o n land and is still used today where instruments are no t available.
S o m e 500 o f the Bureau o f M e t e o r o l o g y stations that p rovided data for the C S I R O wind maps use this subjective scale, w h i c h is set ou t in the table.
Before these maps were c o m p i l e d , the m o s t detailed w i n d maps available were those issued by the Bureau o f M e t e o r o l ogy . T h e s e have several dozen 'w ind roses ' scattered o n a m a p o f Austral ia. A w i n d rose s h o w s , for a g iven loca t ion , h o w l o n g (as a percentage o f the total observa t ions) the w i n d b l e w a long each o f the e igh t major poin ts o f the c o m p a s s . T h e l o n g e r it b l ew , the greater is the leng th o f the appropriate radiating l ine . T h e varying widths o f the l ines indicate h o w l o n g the w i n d stayed in different strength ranges .
W i n d roses for a smal l sec t ion o f the south-western co rne r o f the coun t ry (for January 3 p .m . ) are s h o w n here.
One o f the windiest spots in Australia — Maatsuyker Island in southern Tasmania .
H o w e v e r , all is not lost . A relatively narrow coastal strip receives strong winds , particularly in the south, where average speeds in excess o f 7 m per s e c o n d are found . N o t e w o r t h y are the e x p o s e d sites at Shark Bay, Nor th -Wes t Cape , and Cape L e e u w i n in Western Australia.
M o n t h l y 3 p .m. averages o f m o r e than 6 m per s e c o n d are found o n K a n g a r o o Island, and the Eyre , Y o r k e , and F leu r i eu Pen insu las , S .A. ; in T o r r e s Strait and be tween C o o k t o w n and Cai rns , Q l d ; at R o e b u r n e and be tween G e r a l d t o n and Carnarvon, W . A . ; and in southern T a s mania . In N e w South Wales , such winds are restricted to Cape H o w e and Cape H a w k e .
Coas ta l r e g i o n s therefore offer g o o d sites for w i n d generators. T h e y fo rm a transition zone be tween the very w indy sea and the m u c h ca lmer in land (caused by the m u c h grea te r d rag o f u n e v e n terrain).
T h e wind- run maps c lose ly parallel the wind-speed maps , wi th h i g h values appearing o n the south-west o f the cont i nent, the south ( including Tasmania ) , and the far north-east o f Queens l and . A g a i n , wind-run values are generally h i g h a long the coast and decrease rapidly between 100 and 200 k m inland.
W i n d p o w e r
A l t h o u g h wind- run is a g o o d indicator o f the potential power output o f a wind-power generator, the data o n the maps are not sufficient for any detailed ca lcu la t ion o f the w ind -ene rgy potential o f particular sites. H o w e v e r , the maps wi l l aid in ident i fying t hose gene ra l l y w i n d y r e g i o n s where prospec t ing for w indy sites shou ld be focused .
F u r t h e r m o r e , in the future the researchers h o p e to p r o d u c e mon th ly maps s h o w i n g h o w w i n d - p o w e r potential varies th roughout the country . T h e y wi l l use the same set o f data as used for the present maps (it is o n a compu te r f i le) , but subjec t it to m u c h m o r e detailed analysis.
S ince p o w e r in the w i n d varies as the c u b e o f the w i n d speed, s imple averages are n o t e n o u g h : d is t r ibut ions o f w i n d speed in t ime are necessary. ( T h e c u b e o f the average is not the same as the average o f the cubes . ) H o w e v e r , they h o p e the same general t echn ique as before can be used.
T h a t is, they plan to use correla t ions b e t w e e n the w i n d - p o w e r potent ia l and wind-speed data obtained at data-rich sites to obtain estimates o f w i n d - p o w e r potential at locat ions where on ly two daily wind-speed readings are taken.
Andrew Bell
M o r e a b o u t the t o p i c
'Seasona l Est imates o f W i n d Speed and Wind- run for Australia. ' M . F. H u t c h inson , J. D . K a l m a , and M . E . Johnson . ( C S I R O D i v i s i o n o f L a n d U s e R e search: Canberra 1982.)
' A U S T W I N D : a Data F i l e o f M o n t h l y W i n d Data for Australia. ' M . E. Johnson and J. D . K a l m a . ( C S I R O D i v i s i o n o f L a n d U s e Resea rch : Canberra 1979.)
Spatial patterns o f w i n d speed and w i n d -run in Austral ia : impl ica t ions for netw o r k des ign . J. D . K a l m a and M . F. H u t c h i n s o n . Proceedings, Workshop on Solar and Wind Data Networks for Australia, Canberra, November 1981.
25
The Beaufort scale
Beaufort number speed (m per seel description 0 < 0 · 3 calm — smoke rises vertically 1 0-3-1-5 light air — smoke drifts 2 1-6-2-9 light breeze — wind felt on face,
leaves rustle 3 3-0-5-6 gentle breeze — leaves and twigs
in constant motion 4 5-7-8-4 moderate breeze — dust and loose
paper raised 5 8-5-11-2 fresh breeze — small trees sway,
crests on waves 6 11-3-14-0 strong breeze — whistling in wires,
umbrellas hard to use 7-12 > 1 4 1 near gale, gale, strong gale, storm,
violent storm, hurricane


![Warm weather’s a comin’! - Iowa State Universityhome.engineering.iastate.edu/~jdm/wesep594/Wind Ramp... · 2014-09-20 · 0 2 4 6 8 10 12 14 16] [m/s] Wind velocity Wind velocity](https://static.fdocuments.in/doc/165x107/5e57fcec01e19b3d9a53ea2d/warm-weatheras-a-comina-iowa-state-jdmwesep594wind-ramp-2014-09-20.jpg)


![North Hoyle Offshore Wind Farm 3 Annual /http:/ · PDF fileNorth Hoyle Offshore Wind Farm 3rd Annual Report JULY 2006 – JUNE ... Wind speed (m/s) and wind rose [m/s] Mean wind speed](https://static.fdocuments.in/doc/165x107/5a78fa487f8b9a7b548b9fe4/north-hoyle-offshore-wind-farm-3-annual-http-hoyle-offshore-wind-farm-3rd-annual.jpg)