Wind forcing of sea level variability in a tropical coral ... · the increase in river discharge...
10
797 Lat. Am. J. Aquat. Res., 45(4): 797-806, 2017 DOI: 10.3856/vol45-issue4-fulltext-15 Research Article Wind forcing of sea level variability in a tropical coral reef area in the western Gulf of Mexico Román Rodolfo Vera-Mendoza 1 , David Alberto Salas-de-León 2 David Salas-Monreal 3 & Modesto Ortiz-Figueroa 4 1 Posgrado en Ciencias del Mar y Limnología, Universidad Nacional Autónoma de México 2 Instituto de Ciencias del Mar y Limnología, Universidad Nacional Autónoma de México 3 Instituto de Ciencias Marinas y Pesquerías, Universidad Veracruzana, México 4 Centro de Investigación Científica y de Educación Superior de Ensenada, México Corresponding author: Román Rodolfo Vera-Mendoza ([email protected]) ABSTRACT. Sea level, water temperature, and wind stress data were obtained from the Western Gulf of Mexico to elucidate the relationship between sea level changes and meteorological variables in a tropical coral reef system. Sea level and water temperature data were measured with a series of acoustic Doppler current profilers anchored at a depth of approximately 13 m in the Veracruz Reef System. The barometric and wind stress data were obtained from an automatic coastal weather station. Principal Component Analysis was applied to the series to determine the relative influence of the different meteorological variables on sea level. The seasonal variability of sea level is evident in the year-long data (September 2008 to April 2010) with a thermal expansion during the summer. Barometric pressure was found to be the second strongest forcing mechanism of sea level variability and not the first one. Opposite to what would be expected in protected coastal areas where the wind forcing mechanism on sea level may not be as important. The local winds were the main forcing mechanism of the sea level variability from March to September, while the meridional winds were more important than local winds from October to February. Keywords: sea level variability, ocean-air interaction, tropical coral reef system, Gulf of Mexico, Veracruz Reef System National Park. INTRODUCTION The Gulf of Mexico is a large marine ecosystem that combines the tropical and mid-latitude ecological environments. The Veracruz Reef System National Park (VRSNP) is a protected area of 5210 6 m 2 (DOF, 2012), located in the Western Gulf of Mexico. The VRSNP hereinafter is a productive system with great biodiversity and it represents a high economic input in terms of fisheries and tourism (Birkeland, 1997; Glynn, 1997), the VRSNP is more productive than most of the tropical coral reefs of the western Gulf of Mexico (Avendaño-Alvarez et al., 2017). A detailed description of the study area, type of climate and marine current regime can be found in Avendaño-Alvarez et al. (2017). Coral reef systems, such as the VRSNP, are very fragile because they require stable conditions of temperature, solar radiation, salinity, turbulence, and current velocities, to survive (Hubbard, 1997; Carricart- Ganivet, __________________ Corresponding editor: Nelson Silva 2004). Therefore, changes in sea level (other than tidal changes) can disrupt the vertical growth of corals (Vance, 1989). For that reason, knowledge of sea level variability is essential to fully understand the grow rate on coral reef areas. The VRSNP is used as a case study for tropical coral reef systems in coastal areas of the western Gulf of Mexico. Veracruz is one of the oldest cities in America (founded in 1519); however, few oceanographic studies have been conducted in the area (Granados-Barba et al., 2007; Jiménez-Hernández et al., 2007). This current work is the first study on the barometric forcing of sea level variability in a tropical coral reef area in the western Gulf of Mexico. Previous studies In Chesapeake Bay (USA), one of the most studied areas in North America, Salas-Monreal & Valle- Levinson (2008) found that sea level had a high corre- lation with local winds in summer and a low correlation
-
Upload
trinhhuong -
Category
Documents
-
view
213 -
download
0
Transcript of Wind forcing of sea level variability in a tropical coral ... · the increase in river discharge...

Wind forcing of sea level in the western Gulf of Mexico 797
Lat. Am. J. Aquat. Res., 45(4): 797-806, 2017
DOI: 10.3856/vol45-issue4-fulltext-15
Research Article
Wind forcing of sea level variability in a tropical coral reef area
in the western Gulf of Mexico
Román Rodolfo Vera-Mendoza1, David Alberto Salas-de-León
2
David Salas-Monreal3 & Modesto Ortiz-Figueroa
4
1Posgrado en Ciencias del Mar y Limnología, Universidad Nacional Autónoma de México 2Instituto de Ciencias del Mar y Limnología, Universidad Nacional Autónoma de México
3Instituto de Ciencias Marinas y Pesquerías, Universidad Veracruzana, México 4Centro de Investigación Científica y de Educación Superior de Ensenada, México
Corresponding author: Román Rodolfo Vera-Mendoza ([email protected])
ABSTRACT. Sea level, water temperature, and wind stress data were obtained from the Western Gulf of Mexico to elucidate the relationship between sea level changes and meteorological variables in a tropical coral reef
system. Sea level and water temperature data were measured with a series of acoustic Doppler current profilers anchored at a depth of approximately 13 m in the Veracruz Reef System. The barometric and wind stress data
were obtained from an automatic coastal weather station. Principal Component Analysis was applied to the series to determine the relative influence of the different meteorological variables on sea level. The seasonal
variability of sea level is evident in the year-long data (September 2008 to April 2010) with a thermal expansion
during the summer. Barometric pressure was found to be the second strongest forcing mechanism of sea level variability and not the first one. Opposite to what would be expected in protected coastal areas where the wind
forcing mechanism on sea level may not be as important. The local winds were the main forcing mechanism of the sea level variability from March to September, while the meridional winds were more important than local
winds from October to February.
Keywords: sea level variability, ocean-air interaction, tropical coral reef system, Gulf of Mexico, Veracruz Reef System National Park.
INTRODUCTION
The Gulf of Mexico is a large marine ecosystem that
combines the tropical and mid-latitude ecological
environments. The Veracruz Reef System National
Park (VRSNP) is a protected area of 52106 m2 (DOF,
2012), located in the Western Gulf of Mexico. The
VRSNP hereinafter is a productive system with great
biodiversity and it represents a high economic input in
terms of fisheries and tourism (Birkeland, 1997; Glynn,
1997), the VRSNP is more productive than most of the
tropical coral reefs of the western Gulf of Mexico
(Avendaño-Alvarez et al., 2017). A detailed description
of the study area, type of climate and marine current
regime can be found in Avendaño-Alvarez et al. (2017).
Coral reef systems, such as the VRSNP, are very fragile
because they require stable conditions of temperature,
solar radiation, salinity, turbulence, and current
velocities, to survive (Hubbard, 1997; Carricart- Ganivet,
__________________
Corresponding editor: Nelson Silva
2004). Therefore, changes in sea level (other than tidal
changes) can disrupt the vertical growth of corals
(Vance, 1989). For that reason, knowledge of sea level
variability is essential to fully understand the grow rate
on coral reef areas. The VRSNP is used as a case study
for tropical coral reef systems in coastal areas of the
western Gulf of Mexico. Veracruz is one of the oldest
cities in America (founded in 1519); however, few
oceanographic studies have been conducted in the area
(Granados-Barba et al., 2007; Jiménez-Hernández et al., 2007). This current work is the first study on the
barometric forcing of sea level variability in a tropical coral reef area in the western Gulf of Mexico.
Previous studies
In Chesapeake Bay (USA), one of the most studied
areas in North America, Salas-Monreal & Valle-
Levinson (2008) found that sea level had a high corre-
lation with local winds in summer and a low correlation

798 Latin American Journal of Aquatic Research
in winter. However, the thermosteric and halosteric
effects were also important, producing sea level
variations of up to 10 cm. In the Mediterranean Sea
(Tsimplis, 1995), North Sea, and Baltic Sea (Marc,
2001), the variation in sea level was mainly induced by
winds and barometric pressure. Marc (2001) and
Tsimplis (1995) found that the best correlation in
coastal areas is between sea level and wind stress. In
shallow tropical coastal areas, like the VRSNP, a high
correlation is expected between wind stress and sea
level. However, a shallow reef system with high
evaporation, such as the VRSNP (Salas-Monreal et al., 2009), should also be influenced by thermosteric
effects, unlike other areas at higher latitudes. Finally,
the increase in river discharge (La Antigua, Jamapa,
and Papaloapan rivers) during the rainy season may be
another factor affecting the sea level variability in the
VRSNP. For example, this was the case for Montevideo
and La Paloma systems (Uruguay), where the mean sea
level varied by 9 cm and 13 cm during the year,
respectively, owing to the influence of Río de la Plata River (Mazzetta & Gascue, 1995).
Maul and Hanson (1988) found that the average increase in sea level in the VRSNP from 1953 to 1985 was 1.53 mm year-1. However, using data from January 1966 to December 1976 in the western Gulf of Mexico, the sea level increased around 1.4 mm year-1 (Salas-de-León et al., 2006). At Galveston (USA), Ciudad Madero (Mexico), Veracruz (Mexico), and Progreso (Mexico), annual sea level reaches a maximum from September to October, and two minima; one in July and the other in January (Zavala-Hidalgo et al., 2003). Using data from 1985 to 1986, Ramírez & Candela-Pérez (2003) found that the barometric pressure in the Gulf of Mexico was the most important meteorological forcing at low frequency, affecting the variability of the sea level. Salas-de-León et al. (2006) found that the monthly variability in sea level increased during the winter and summer, and decreased during the spring and autumn, mainly caused by the wind velocity.
Therefore, coastal coral reef areas, such as the VRSNP, are very fragile systems since they are been affected by changes in sea level (other than tidal changes) that can disrupt the vertical growth of corals (Vance, 1989). The aim of this work is to understand the mechanisms that affect the sea level variability in coastal tropical coral reef areas.
MATERIALS AND METHODS
The VRSNP has been described as a platform type coral reef system with two reef shapes: elongated ones (northwest-southeast) and semicircular ones with the same orientation (Gutiérrez et al., 1993). The VRSNP
depth goes from 25 m in the northern area, to 40 m in the southern area. Both areas are naturally divided by the Jamapa River, which has a mean river discharge of 1.89×10⁹ m3 year-1 (Riveron-Enzastiga et al., 2016). The reef system is bounded to the north by La Antigua River (2.82×10⁹ m3 year-1) and to the south by the Papaloapan River (39.17×10⁹ m3 year-1) (Tamayo, 1999). Despite its proximity to the coast and the Jamapa, La Antigua, and Papaloapan rivers, no significant changes of salinity have been reported (Salas-Pérez et al., 2008). However, during a tidal cycle, the salinity varies from 34 to 36.4 g kg-1 in an anchored station in front of the Port of Veracruz (Salas-Monreal et al., 2009).
Eight ADCP stations were used to obtain sea level
data and water temperature every second. The weather
station and the eight acoustic Doppler current profilers
(ADCP, 1200-kHz RDI) recorded data from September
2008 to April 2010. These data were averaged every 15
min. The eight ADCP stations were anchored at a depth
of ~13 m (Table 1) during low tide the same day. The
barometric pressure and wind velocity were obtained
from an automatic weather station, installed in the
village of Anton Lizardo (Fig. 1), inside the Mexican
Navy facilities (Table 1). These data were matched with
the sea level observations in the data set.
The sea level series were filtered using a Lanczos
low-pass filter with a cutoff frequency of 0.8 cpd in a
window of 26 h to remove the tidal effects and other
high frequency fluctuations. Each one of the sea-level
records referred to its corresponding annual mean.
Some gaps were present in the time series due to
organisms that stuck in sensors or interference by
currents generated from nearby boats. The gaps in the
data series were filled with the best linear regression
between nearby stations, whereas less than 3 h gaps
were filled with a linear interpolation between succe-
ssive data of the same series. Time series of water
temperature, barometric pressure, and wind velocity
were used to determine their relative influence on sea
level variability using the method of Principal
Component Analysis (Salas-Monreal & Valle-Levinson,
2008).
The effect of the barometric pressure on sea level
variability was removed by using the hydrostatic
equation following the methodology of Gill (1982), and
Salas-Monreal & Valle-Levinson (2008):
g
p
where = change of sea level, p = water column
pressure change, g = acceleration due to Earth’s gravity,
and = water density.

Wind forcing of sea level in the western Gulf of Mexico 799
Figure 1. Study area and location of sampling instruments. The solid circles indicate where the ADCP's were anchored and
the asterisk the weather station.
Table 1. ADCP's reefs names and weather station
locations.
Reef North latitude West longitude
Topetillo 19.14778 95.84111 Cabezo 19.04944 95.82750
Enmedio 19.10139 95.93028
Blanca 19.08444 95.99778
Sacrificios 19.17361 96.09250
Verde 19.20583 96.06528
Anegada 19.22861 96.06167
Blanquilla 19.22528 96.10000
Weather Station 19.04944 95.97056
RESULTS
The sea level showed a diurnal signal with a fortnightly
tidal modulation of approximately 50 cm from late
August 2008 to February 2009, as was reported by
Salas-Pérez et al. (2008). The sea level in the northern
reef area (Verde and Sacrificios; Fig. 1) showed a
maximum in October 2008 with a value of 30 cm in Verde (Fig. 2a) and 20 cm in Sacrificios (Fig. 2b). The
lowest sea level value at both stations was observed in
September (-40 cm).
In the southern reef area of Topetillo, Enmedio, Cabezo, and Blanca (Fig. 1), the sea level values were obtained from December 2009 to early April 2010. During this period, the sea level did not show a significant difference with respect to the northern reef area; all correlations were higher than 0.75. The maximum sea level values were up to 18 cm, from December to February. However, there was a slight decrease in late January and early February 2010 (approximately -10 cm; Figs. 2c-2f) coinciding with the presence of atmospheric cold fronts (hereinafter northers). The maximum values shown in Figure 2 during late January and February were not considered in the analysis because they correspond to interpolated data. In Anegada and Blanquilla stations (Fig. 1), where sea level was recorded from March to August 2009, the maximum sea level (18 cm) was observed during March, while the minimum values (-10 cm) were observed during April and early May. June and July showed a stable sea level pattern, with values near -5 cm (Figs. 2g-2h).
The water temperature in the northern reef area (Verde and Sacrificios) had the lowest values in September 2008 (29.8°C) and January 2009 (22.3°C) due to a period of strong rain (September) and northern events (September to January; Figs. 2a-2b). During the

800 Latin American Journal of Aquatic Research
Figure 2. Sea level and sea temperature at a) Verde, b) Sacrificios, c) Topetillo, d) Enmedio, e) Cabezo, f) Blanca,
g) Anegada de Adentro, and h) Blanquilla reef stations (solid gray line sea level original data, solid black line filtered, dotted
line temperature).
winter, the strong winds mixed the entire water column, lowering the water temperature (Salas-Monreal et al., 2009). The water temperature recorded at Topetillo, Enmedio, Cabezo, and Blanca reef showed a maximum in December 2008 (25.7°C), while the lowest temperatures were observed in January 2010 with a value of 18.8°C (Figs. 2c-2f). This was attributed to the northers and the associated strong northerly winds. In Anegada and Blanquilla, the temperature had a tendency to increase. The maximum water temperature was recorded in June 2009 (27.5°C) during summer (Figs. 2g-2h). In general, the highest temperatures were found during June and July in the summer (Salas-Pérez et al., 2008). The maximum values were close to 30°C,
while the lowest values of 18°C were observed during January and February (winter in the northern hemisphere) owing to winter cold air fronts. The water temperature varied from 30°C to 18°C within 6 months. This is a large temperature variation for a coral reef system (Salas-Monreal et al., 2009), where organisms must adapt not only to the temperature change of close to 12°C from January to July, but also to changes in turbidity produced by the strong winds observed during winter cold fronts. Further, river runoff affects the turbidity of the costal water from mid-September to early November, which is the rainy season at VRSNP (Riveron-Enzastiga et al., 2016).
Wind forcing of sea level in the western Gulf of Mexico 801
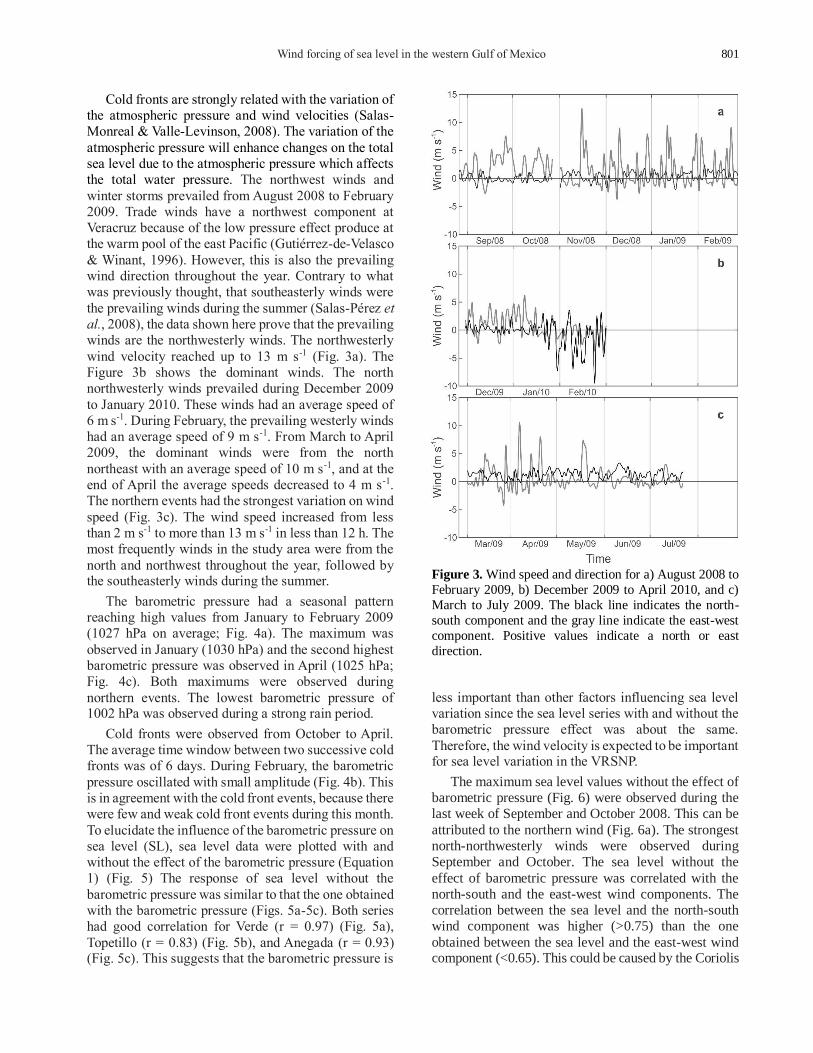
Cold fronts are strongly related with the variation of
the atmospheric pressure and wind velocities (Salas-
Monreal & Valle-Levinson, 2008). The variation of the
atmospheric pressure will enhance changes on the total
sea level due to the atmospheric pressure which affects
the total water pressure. The northwest winds and
winter storms prevailed from August 2008 to February
2009. Trade winds have a northwest component at
Veracruz because of the low pressure effect produce at
the warm pool of the east Pacific (Gutiérrez-de-Velasco
& Winant, 1996). However, this is also the prevailing
wind direction throughout the year. Contrary to what
was previously thought, that southeasterly winds were
the prevailing winds during the summer (Salas-Pérez et al., 2008), the data shown here prove that the prevailing
winds are the northwesterly winds. The northwesterly
wind velocity reached up to 13 m s-1 (Fig. 3a). The
Figure 3b shows the dominant winds. The north
northwesterly winds prevailed during December 2009
to January 2010. These winds had an average speed of
6 m s-1. During February, the prevailing westerly winds
had an average speed of 9 m s-1. From March to April
2009, the dominant winds were from the north
northeast with an average speed of 10 m s-1, and at the
end of April the average speeds decreased to 4 m s-1.
The northern events had the strongest variation on wind
speed (Fig. 3c). The wind speed increased from less
than 2 m s-1 to more than 13 m s-1 in less than 12 h. The
most frequently winds in the study area were from the
north and northwest throughout the year, followed by the southeasterly winds during the summer.
The barometric pressure had a seasonal pattern
reaching high values from January to February 2009
(1027 hPa on average; Fig. 4a). The maximum was
observed in January (1030 hPa) and the second highest
barometric pressure was observed in April (1025 hPa;
Fig. 4c). Both maximums were observed during
northern events. The lowest barometric pressure of 1002 hPa was observed during a strong rain period.
Cold fronts were observed from October to April.
The average time window between two successive cold
fronts was of 6 days. During February, the barometric
pressure oscillated with small amplitude (Fig. 4b). This
is in agreement with the cold front events, because there
were few and weak cold front events during this month.
To elucidate the influence of the barometric pressure on
sea level (SL), sea level data were plotted with and
without the effect of the barometric pressure (Equation
1) (Fig. 5) The response of sea level without the
barometric pressure was similar to that the one obtained
with the barometric pressure (Figs. 5a-5c). Both series had good correlation for Verde (r = 0.97) (Fig. 5a),
Topetillo (r = 0.83) (Fig. 5b), and Anegada (r = 0.93) (Fig. 5c). This suggests that the barometric pressure is
Figure 3. Wind speed and direction for a) August 2008 to
February 2009, b) December 2009 to April 2010, and c)
March to July 2009. The black line indicates the north-
south component and the gray line indicate the east-west
component. Positive values indicate a north or east
direction.
less important than other factors influencing sea level
variation since the sea level series with and without the
barometric pressure effect was about the same.
Therefore, the wind velocity is expected to be important for sea level variation in the VRSNP.
The maximum sea level values without the effect of
barometric pressure (Fig. 6) were observed during the
last week of September and October 2008. This can be
attributed to the northern wind (Fig. 6a). The strongest
north-northwesterly winds were observed during
September and October. The sea level without the
effect of barometric pressure was correlated with the
north-south and the east-west wind components. The
correlation between the sea level and the north-south wind component was higher (>0.75) than the one
obtained between the sea level and the east-west wind component (<0.65). This could be caused by the Coriolis

802 Latin American Journal of Aquatic Research
Figure 4. Barometric pressure for a) August 2008 to February 2009, b) December 2009 to April 2010, c) March
to July 2009.
acceleration, which deflects the water towards the coast
side under north-northwesterly wind conditions
(Riveron-Enzastiga et al., 2016), or perhaps by a
combination of both, Coriolis acceleration and the
deflection of the flow owing to reefs and islands (Salas-
Monreal et al., 2009). The sea level increased when the
north-south wind speed component increased.
However, there was a 6 h lag from both peaks (the
maximum wind speed and the maximum sea level
value; Fig. 6b). This pattern was observed for all the
stations. The north wind component produced a sea
level increase of more than 30%, while the southern
wind component produced a sea level rise of more than
23%. However, the barometric pressure should not be
neglected as it produced a sea level increase of up to
19%. This is the first time that the time lag between the
maximum wind velocity and the maximum sea level is calculated for this area.
To determine the influence of the sea temperature, barometric pressure, and wind velocity on sea level, a
Figure 5. Sea level with (solid black line) and without
(gray dotted line) the effect of the barometric pressure. a)
August 2008 to February 2009 at Verde station, b)
December 2009 to March 2010 at Topetillo station, c) March 2009 to July 2009 at Anegada station.
principal component analysis was performed. The
results show that the higher eigenvalue of the
covariance matrix was 30.44% of the total variance
(Table 2). The corresponding eigenvectors of the first
mode, or principal component variable, indicate that the
sea level had the highest correlation with the north-
south wind component; the second mode corresponded
to the east-west wind component, the third mode to the
barometric pressure effect, and the fourth mode to the thermosteric effect (Table 3).
DISCUSSION
The results indicate that the wind velocity explains
most of the variability of the sea level, followed by the barometric pressure and the thermosteric effect. The
influence of the barometric pressure coincided with studies in the Gulf of Mexico by Ramírez & Candela-

Wind forcing of sea level in the western Gulf of Mexico 803
Figure 6. Sea level without the barometric pressure (soilid
black line), and north-south wind component (gray dotted
line). a) Verde station from August 2008 to March 2009,
b) Topetillo station from December 2009 to April 2010, c)
Anegada station from March 2008 to July 2009.
Pérez (2003) and in the Mediterranean Sea by Calafat
et al. (2012), who reported a significant correlation of
the inverted barometric effect with the sea level
variability. In previous studies, the influence of the
thermosteric changes on sea level variability were
neglected (Miller & Douglas, 2007; Woodworth et al., 2010; Sturges & Douglas, 2011). However, this differs
from the present study in the western Gulf of Mexico
(VRSNP), because the thermosteric effect produced
more than 17% of the sea level variability. This was
attributed to the fact that this is a tropical area with
strong temperature and salinity gradients caused by
seasonal changes from winter to summer and from the
rainy to dry season (Avendaño-Alvarez et al., 2017).
The variability in sea level over long periods of time was correlated with the barometric pressure (Salas-
Monreal & Valle-Levinson, 2008), however, during
shorter periods of times, the wind velocities were the
main mechanisms affecting the variability of the sea level.
The nearby rivers, such as La Antigua, Jamapa, and
Papaloapan, have an influence on the temperature and
salinity of the VRSNP (Salas-Monreal et al., 2009)
during the rainy season. For example, on the coastal
area of Montevideo and La Paloma (Uruguay), the
increased river flow from Río de la Plata River was well
correlated with the increased sea level during the rainy season (Mazzetta & Gascue, 1995).
The results reported here are contrary to those
reported by Ramírez & Candela-Pérez (2003), who
stated that from 1985 to 1986 the barometric pressure
was the main meteorological factor contributing to the
sea level variability in the harbor of Veracruz. It was
found here that the wind was the key forcing agent
affecting the sea level changes on the VRSNP.
Although the VRSNP has a maximum depth of 40 m,
the maximum water speed was not limited by the action
of bottom friction or bathymetric constrictions, such as
reefs and islands, as in other shallow areas (Aboitiz et al., 2008).
In Cadiz (Spain) the east-west winds (perpendicular
to the coast) caused the water to flow against the coast,
and the barometric pressure effect had a major
influence on the sea level variability (Aboitiz et al., 2008). Those result are different to the once found here.
In this study, the parallel wind to the coast was the main
forcing mechanism of the sea level variation, whereas
the barometric pressure was the second mechanism affecting the sea level variability.
In some coastal areas, the wind effect on sea level
pile up water in the opposite direction to the wind
(Clancy, 1968). In this study, the observed wind
velocity pattern suggested that the water pile up in the
VRSNP occurred mainly during winter when the
strongest north-south wind velocity events pile up the water against the coast.
Therefore, the wind pattern was the main forcing
mechanism affecting the changes of sea level. The
principal wind component influencing the sea level
variation was the north-south component. The high-
pressure systems determined the direction of the winds
in the western Gulf of Mexico. During the fall and
winter seasons, the water currents moved southward,
while during the summer the intensification of the
southeast winds move water northward (Caballero-
Rosas, 1990; Zavala-Hidalgo et al., 2003; Riveron-Enzastiga et al., 2016).
The analysis of the sea level, the wind velocities, and the water temperature at a coral reef system in the
western Gulf of Mexico, indicates that the sea level
variations in the VRSNP had a significant seasonal va-

804 Latin American Journal of Aquatic Research
Table 2. Percentage of variance of the correlations between the main components and the variables.
Mode 1 Mode 2 Mode 3 Mode 4 Mode 5
Percentage of variance 30.44% 23.81% 19.13% 17.57% 9.02%
Table 3. Eigenvectors by mode or variable for each principal component (column). The components of each eigenvector
indicate the correlations between the main components and each of the variables.
Variable Mode 1 Mode 2 Mode 3 Mode 4 Mode 5
Sea level 0.3946 -0.4262 0.4767 -0.6510 -0.1067
Temperature -0.5029 -0.6571 -0.3836 -0.2257 0.3421
Barometric pressure 0.8714 0.0122 0.0250 0.1693 0.4593
E-W wind -0.4558 -0.2281 0.7443 0.3989 0.1640
N-S wind 0.3821 -0.7247 -0.1664 0.4649 -0.2914
riation, with maximum values from autumn to winter
and minimum values during the spring and summer,
mainly caused by the wind velocity. The barometric
pressure is the main forcing agent of the low frequency
variability of the sea level in the VRSNP, followed by
temperature. The northern wind component was the
most important factor influencing the sea level
variability at high frequency from September to March,
while the southern wind component was the most important forcing from April to August.
The thermosteric effect on sea level variability was
important in the VRSNP because of the high
temperatures (tropical area) and the rainy season during
the spring and summer. It was surprising to find that the
barometric pressure effect was almost as important as
the east-west wind component velocity on sea level
variation. This was attributed to the fact that the reefs
and islands protect the coastal area from the easterly
winds. Furthermore, the presence of cold fronts on the
western Gulf of Mexico enhances the inverse barometric effect on sea level variability.
It is important to document the wind effects on the
sea level; since the global warming induces wind
velocity changes that affect the coral reef ecosystems
worldwide.
CONCLUSIONS
The results show that the wind velocity explains most
of the correlation with the sea level variability,
followed by the barometric pressure and the
thermosteric effect. The wind pattern was the main
forcing mechanism affecting changes in sea level. The principal wind component influencing the sea level
variation was the north-south component. The sea level
variations in the VRSNP had a significant seasonal
variation caused by the wind velocity, with maximum
values from autumn to winter and minimum values
during the spring and summer. The barometric pressure
is the main forcing agent of the low frequency
variability, followed by the temperature. The northern
wind component was the most important factor
influencing the sea level variability from September to
March, while the southern wind component was the
most important forcing from April to August. The
thermosteric effect on the sea level variability was
important because of the high temperatures (tropical
area) and the rainy season during the spring and
summer seasons. It was surprising to find that the
barometric pressure effect was almost as important as
the east-west wind component velocity on sea level
variation. This was attributed to the fact that the reefs
and islands protect the coastal area from the easterly
winds. Furthermore, the presence of cold fronts on the
western Gulf of Mexico enhances the inverse barometric effect on sea level variability in the VRSNP.
ACKNOWLEDGEMENTS
CONACyT, México, sponsored R.R. Vera-Mendoza
during his Ph.D. program. The authors would like to
acknowledge the Instituto de Ciencias del Mar y
Pesquerías, Universidad Veracruzana, and the
Secretaría de Marina-Armada de México, for providing
data, and of Jorge Castro for drafting the figures.
REFERENCES
Aboitiz, A., B. Tejedor, J.J. Muñoz & J.M. Abarca. 2008.
Relation between daily variations in sea level and
meteorological forcing in Sancti Petri Channel (SW
Spain). Cienc. Mar., 34(4): 491-501.

Wind forcing of sea level in the western Gulf of Mexico 805
Avendaño-Alvarez, O., D. Salas-Monreal, M. Marin-
Hernandez, D.A. Salas-de-Leon & M.A. Monreal-Gomez. 2017. Annual hydrological variation and
hypoxic zone in a tropical coral reef system. Reg. Stud.
Mar. Sci., 9: 145-155.
Birkeland, C. 1997. Life and death of coral reefs.
Chapman & Hall, New York, 539 pp.
Caballero-Rosas, A. 1990. Modelación hidrodinámica
numérica de la circulación por viento en la zona
costera del Puerto de Veracruz y sus proximidades.
Master's Thesis, Universidad Veracruzana, Veracruz,
70 pp.
Calafat, F.M., D.P. Chambers & M.N. Tsimplis. 2012.
Mechanisms of decadal sea level variability in the
eastern north Atlantic and the Mediterranean Sea. J.
Geophys. Res., 117(C9), C09022, doi: 10.1029/2012J
C008285.
Carricart-Ganivet, J.P. 2004. Sea surface temperature and
the growth of the west Atlantic reef-building coral
Montastrea annularis. J. Exp. Mar. Biol. Ecol., 302:
249-260.
Clancy, E.P. 1968. The tides. Pulse of the Earth.
Doublenday & Co., New York, 228 pp.
Diario Oficial de la Federación (DOF). 2012. Diario
Oficial de la Federación 29 de noviembre. México D.F., 29 pp.
Gill, A.E. 1982. Atmosphere ocean dynamics. Academic
Press, New York, 642 pp.
Glynn, P.W. 1997. Bioerosion and coral reefs growth: a
dynamic balance. In: C. Birkeland (ed.). Life and death
of coral reefs. Chapman & Hall, New York, pp. 68-95.
Granados-Barba, A., L.G. Abarca-Arenas & J.M. Vargas-
Hernández. 2007. Investigaciones científicas en el
sistema arrecifal veracruzano. Universidad Autónoma
de Campeche, Campeche, 304 pp.
Gutiérrez-de-Velasco, G. & C.D. Winant. 1996. Seasonal
patterns of wind stress and wind stress curl over the Gulf of Mexico. J. Geophys. Res., 101(C8), 18127-
18140, doi: 10.1029/96JC01442.
Gutiérrez, D., C. García-Sáez, M. Lara & C. Padilla. 1993.
Comparación de arrecifes coralinos: Veracruz y
Quintana Roo. In: S.I. Salazar-Vallejo & N.E. González (eds.). Biodiversidad marina y costera de
México. CONABIO-CIQRO, México, D.F., pp. 785-
806.
Hubbard, D. 1997. Reefs as dynamics systems. In: C.
Birkeland (ed.). Life and death of coral reefs.
Chapman & Hall, New York, pp. 43-67.
Jiménez-Hernández, M.A., A. Granados-Barba & L.
Ortiz-Lozano. 2007. Análisis de la información
científica en el sistema arrecifal veracruzano. In: A.
Granados-Barba, L.G. Abarca-Arenas & J.M. Vargas-
Hernández (eds.). Investigaciones Científicas en el
Sistema Arrecifal Veracruzano, Universidad Autó-
noma de Campeche, Campeche, pp. 1-16.
Marc, L.F. 2001. Analysis and representation of regional
sea-level variability from altimetry and atmospheric-
oceanic data. Geophys. J. Int., 145(1): 1-18, doi:
10.1046/j.1365-246x.2001. 00284.x.
Maul, G.A. & K. Hanson. 1988. Sea level variability in the
Intra American Sea with concentration on Key West as
a regional example. In: G.A. Maul (ed.). Implications
of climatic changes in the wider Caribbean region.
UNEP (OCA)/CAR/W.G.1/INF, 3: 89-102.
Mazzetta, G.V. & F.J. Gascue. 1995. Estudio comparativo
del comportamiento de la salinidad, la temperatura y
el nivel medio del mar en las costas de Montevideo y
La Paloma. Atlántica Río Grande, 17: 5-16.
Miller, L. & B.C. Douglas. 2007. Gyre-scale atmospheric
pressure variations and their relation to 19th and 20th
century sea level rise. Geophys. Res. Let., 34(16):
L16602, doi: 10.1029/2007GL030862.
Ramírez, O.S. & J. Candela-Pérez. 2003. Respuesta del
nivel del mar al forzamiento atmosférico en las costas
del Golfo de México. Ser. Oceanol., 1: 76-84.
Riverón-Enzástiga, M.L. N. Carbajal & D. Salas-Monreal.
2016. Tropical coral reef system hydrodynamics in the
western Gulf of Mexico. Sci. Mar., 80(2). doi:
http://dx.doi.org/10.3989/scimar.04259.15B.
Salas-de-León, D.A., M.A. Monreal-Gómez, D. Salas-
Monreal, M.L. Riveron-Enzastiga & N.L. Sánchez-
Santillán. 2006. Inter annual sea level variability in the
southern Gulf of Mexico. Geophys. Res. Let., 33,
L08610, doi: 10.1029/2006GL025832.
Salas-Monreal, D. & A. Valle-Levinson. 2008. Sea-level
slopes and volume fluxes produced by atmospheric
forcing in estuaries: Chesapeake Bay. J. Coast. Res.,
24(2A): 208-217.
Salas-Monreal, D., D.A. Salas-de-León, M.A. Monreal-
Gómez & M.L. Riverón-Enzástiga. 2009. Current
rectification in a tropical coral reef system. Coral Reef,
28: 871, doi: 10.1007/s00338-009-0521-9.
Salas-Pérez, J.J., D. Salas-Monreal, V.A. Arenas-Fuentes,
D.A. Salas-de-León & M.L. Riveron-Enzastiga. 2008.
Tidal characteristics in a coral reef system from the
western Gulf of Mexico. Cienc. Mar., 34(4): 467-478.
Sturges, W. & B.C. Douglas. 2011. Wind effects on
estimates of sea level rise. J. Gephys. Res., 116(C06),
doi: 10.1029/2010JC006492.
Tamayo, J.L. 1999. Geografía moderna de México.
Trillas, México, D.F., 400 pp.
Tsimplis, M.N. 1995. The response of sea level to
atmospheric forcing in the Mediterranean sea. J. Coast.
Res., 11(4): 1309-1321.

806 Latin American Journal of Aquatic Research
Vance, P.V. 1989. Efectos ecológicos de incrementos en
el nivel del mar y temperaturas superficiales oceánicas
en manglares, arrecifes, praderas marinas y playas
arenosas de Puerto Rico: evaluación preliminar. Sci.
Cienc., 16: 27-39.
Woodworth, P.L., N. Pouvreau & G. Wöppelmann. 2010.
The gyre scale circulation of the north Atlantic and sea
level at Brest. Ocean Sci., 6: 185-190, doi: 10.5194/os-
6-185-2010.
Received: 13 June 2016; Accepted: 20 April 2017
Zavala-Hidalgo, J., S.L. Morey & J.J. O´Brien. 2003.
Seasonal circulation on the western shelf of the Gulf of Mexico using a High resolution numerical model. J.
Geophys. Res., 108(C12), 1-19, doi: 10.1029/2003JC
001879.