Wind Engineering Fundamental Engineering Concepts · Wind Engineering Fundamental Engineering...
145
Wind Engineering Fundamental Engineering Concepts and Design By Moayyad Al Nasra, PhD, P.E.
Transcript of Wind Engineering Fundamental Engineering Concepts · Wind Engineering Fundamental Engineering...
Wind Engineering Fundamental Engineering Concepts
and Design
By
Moayyad Al Nasra, PhD, P.E.
WIND NATURE
and its Interaction with Structures
• Nature of Wind
• Wind/structure interaction
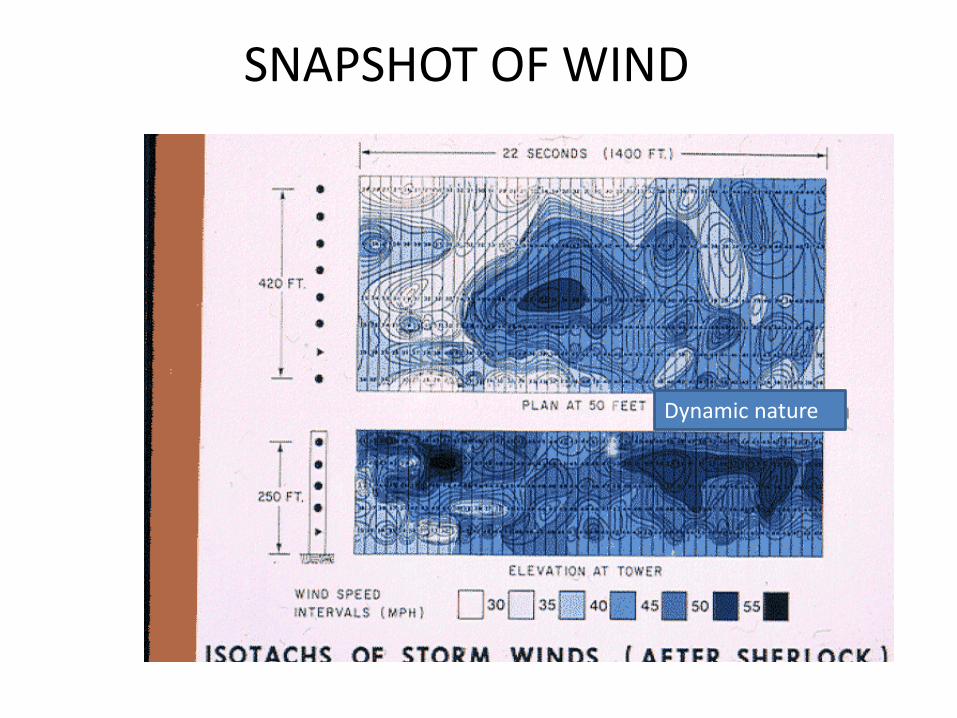
SNAPSHOT OF WIND
Dynamic nature
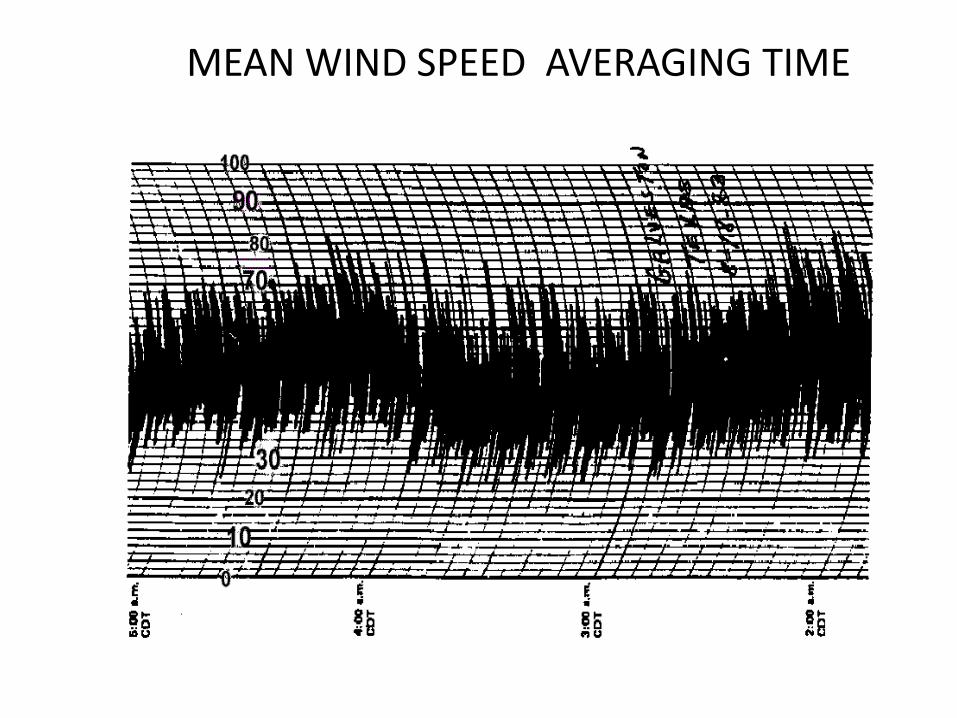
MEAN WIND SPEED AVERAGING TIME
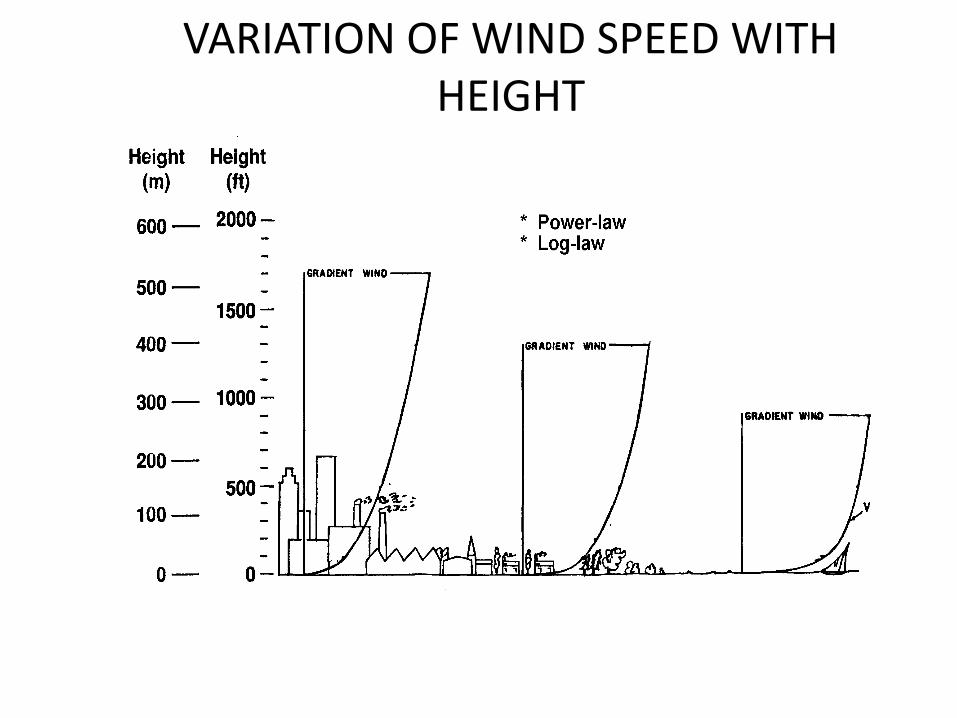
VARIATION OF WIND SPEED WITH HEIGHT
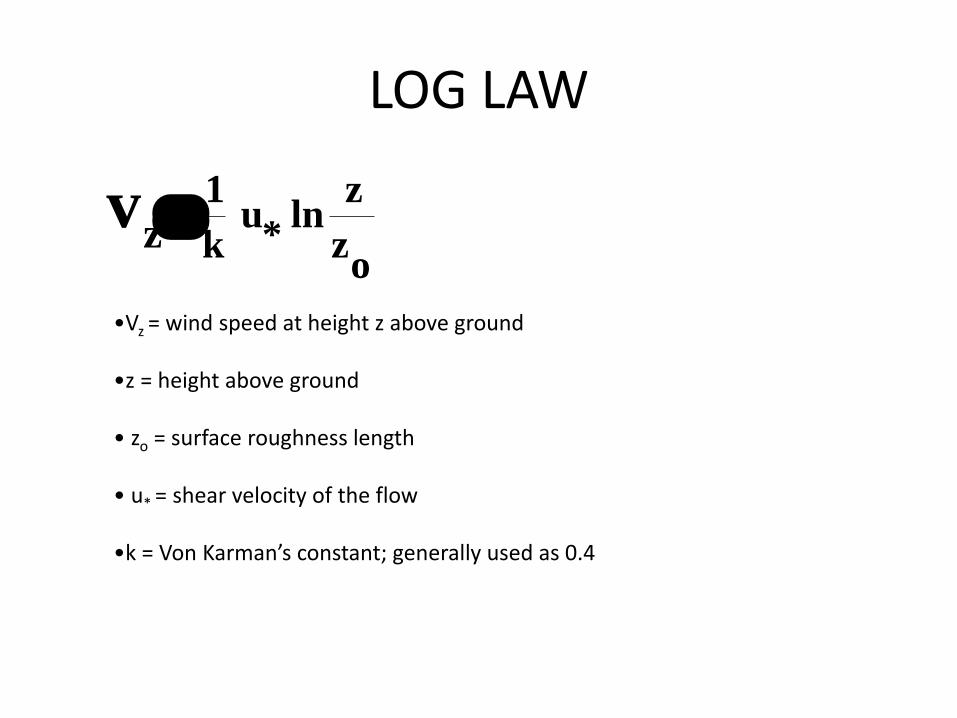
LOG LAW
vz k
uz
zo
1
*ln
•Vz = wind speed at height z above ground •z = height above ground • zo = surface roughness length • u* = shear velocity of the flow •k = Von Karman’s constant; generally used as 0.4
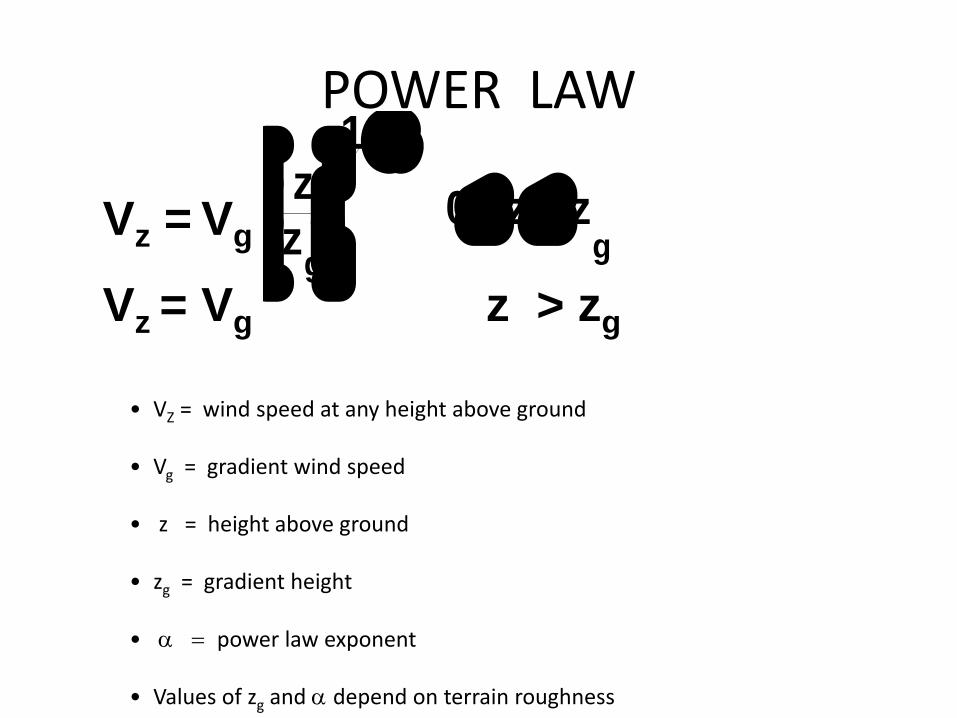
POWER LAW
Vz = Vg
Vz = Vg z > zg
zz
1
0 z zg
g
• VZ = wind speed at any height above ground • Vg = gradient wind speed • z = height above ground • zg = gradient height • power law exponent • Values of zg and depend on terrain roughness
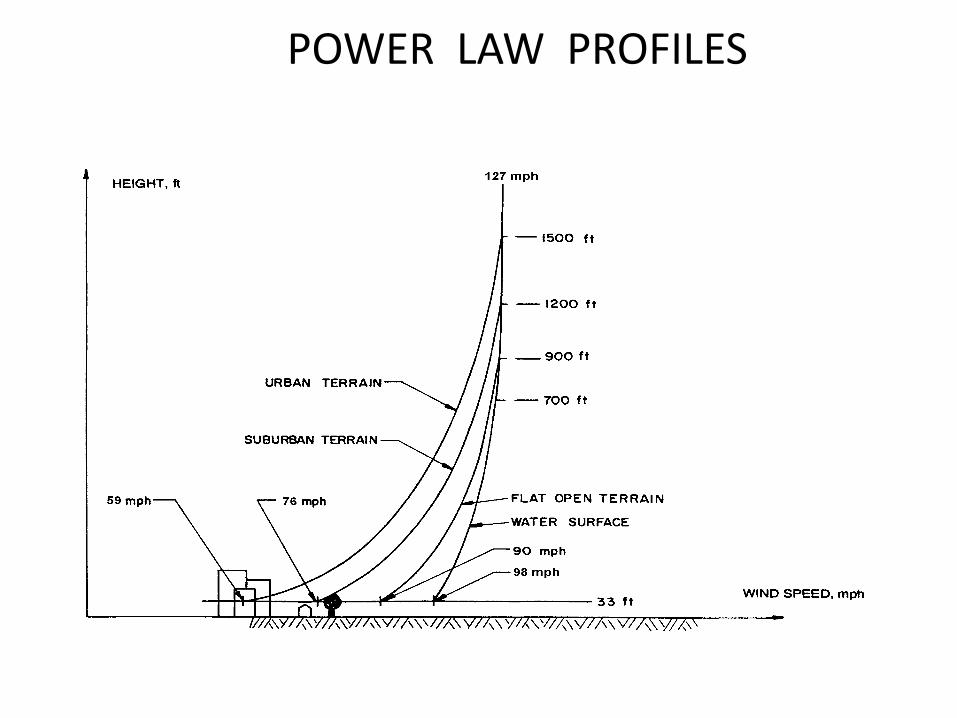
POWER LAW PROFILES
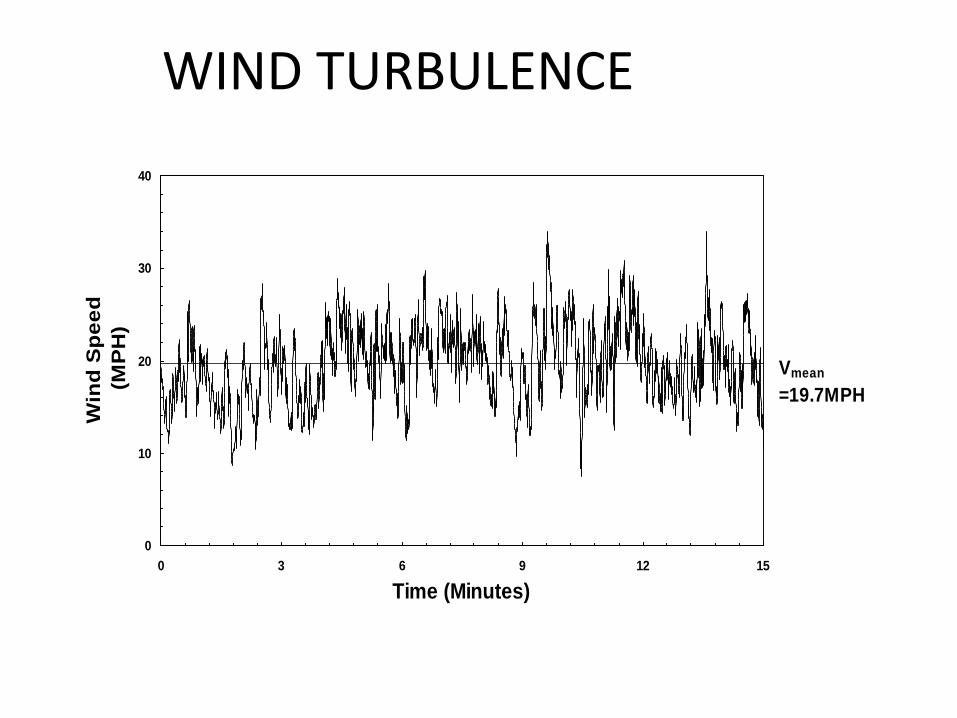
WIND TURBULENCE
Vmean
=19.7MPH
0
10
20
30
40
0 3 6 9 12 15
Time (Minutes)
Win
d S
pe
ed
(MP
H)
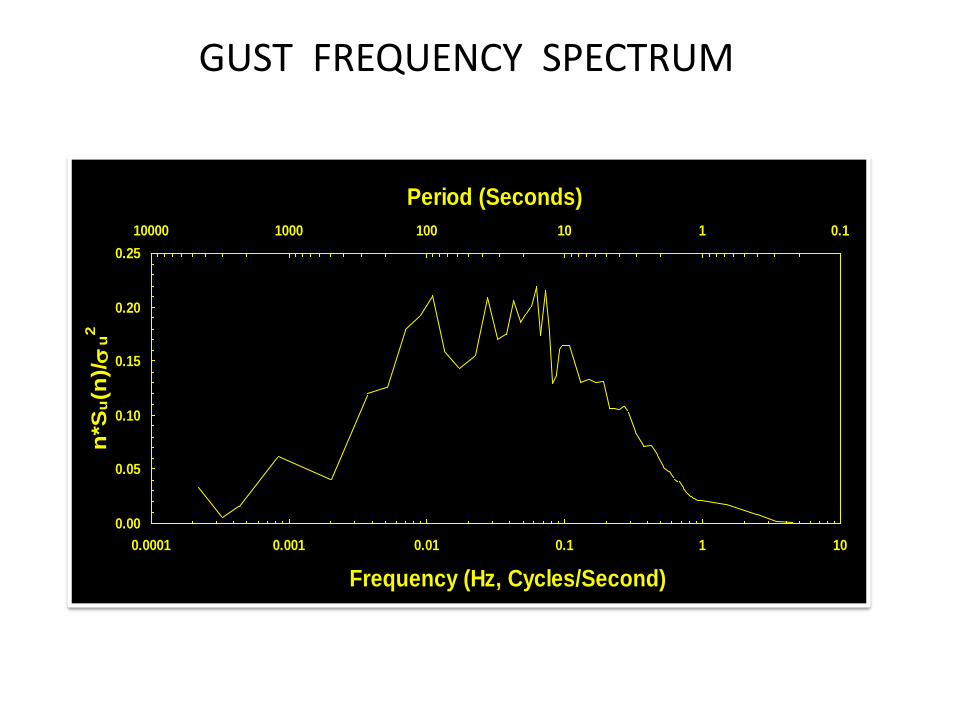
GUST FREQUENCY SPECTRUM
0.00
0.05
0.10
0.15
0.20
0.25
0.0001 0.001 0.01 0.1 1 10
Frequency (Hz, Cycles/Second)
n*S
u(n
)/
u2
0.1110100100010000
Period (Seconds)
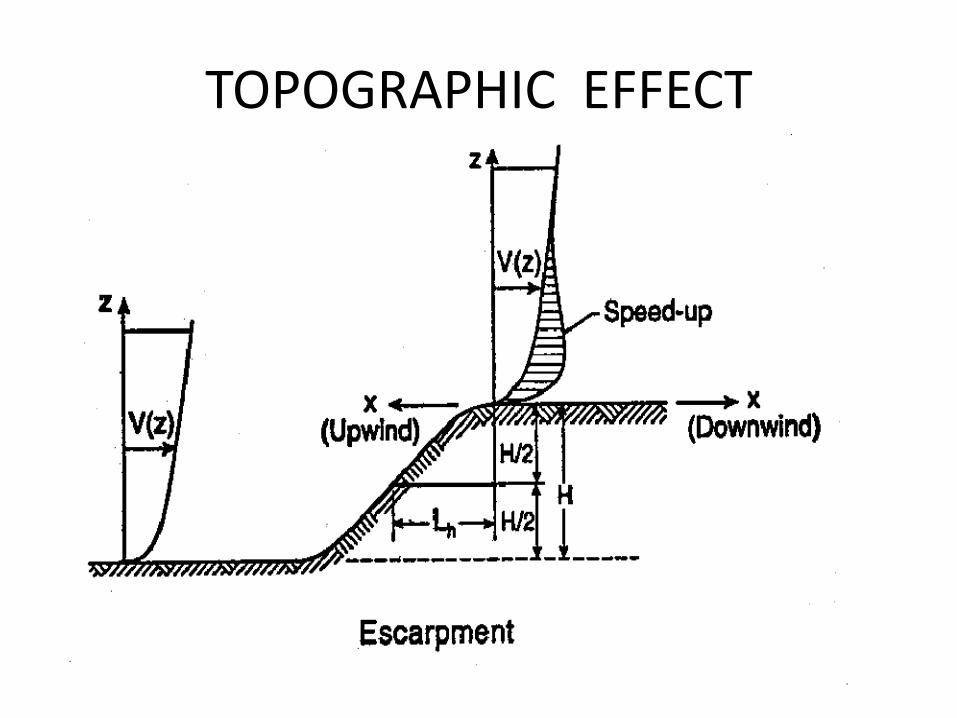
TOPOGRAPHIC EFFECT
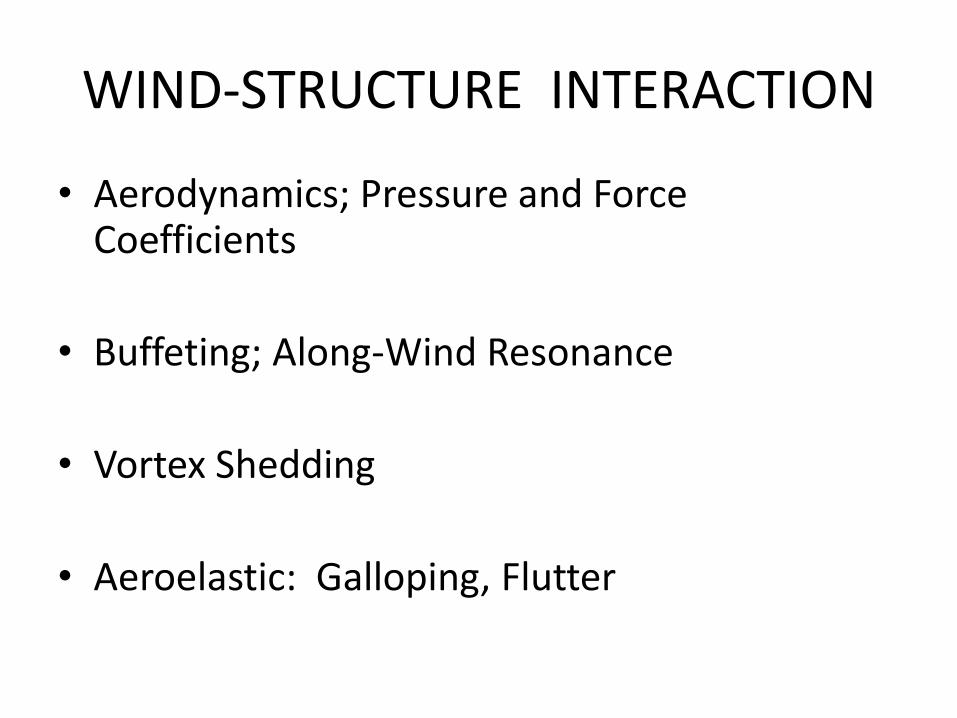
WIND-STRUCTURE INTERACTION
• Aerodynamics; Pressure and Force Coefficients
• Buffeting; Along-Wind Resonance
• Vortex Shedding
• Aeroelastic: Galloping, Flutter
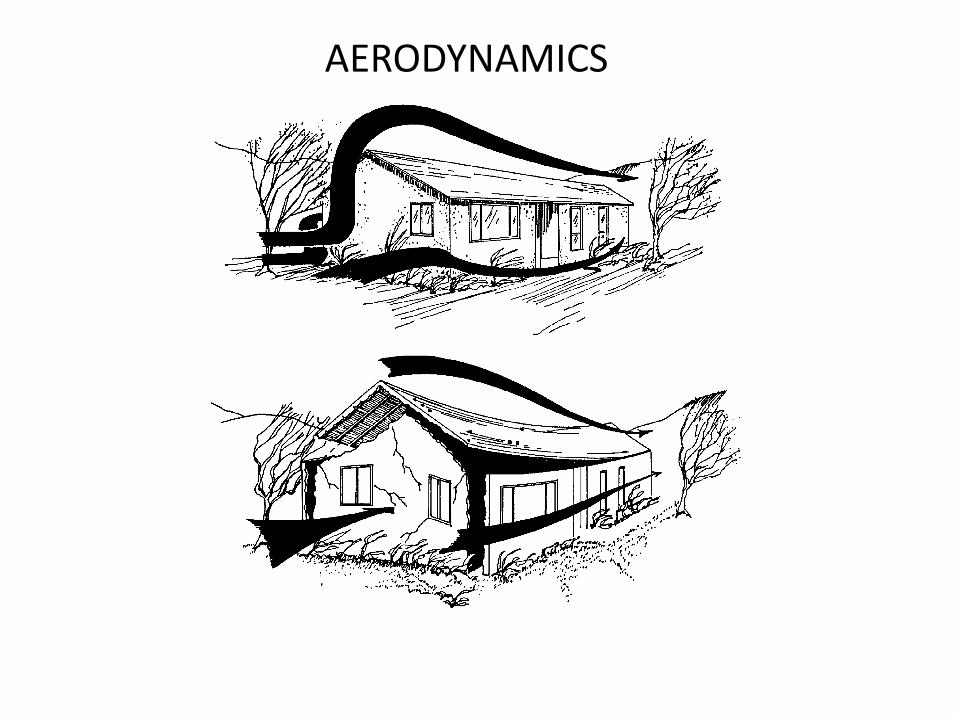
AERODYNAMICS
AERODYNAMICS
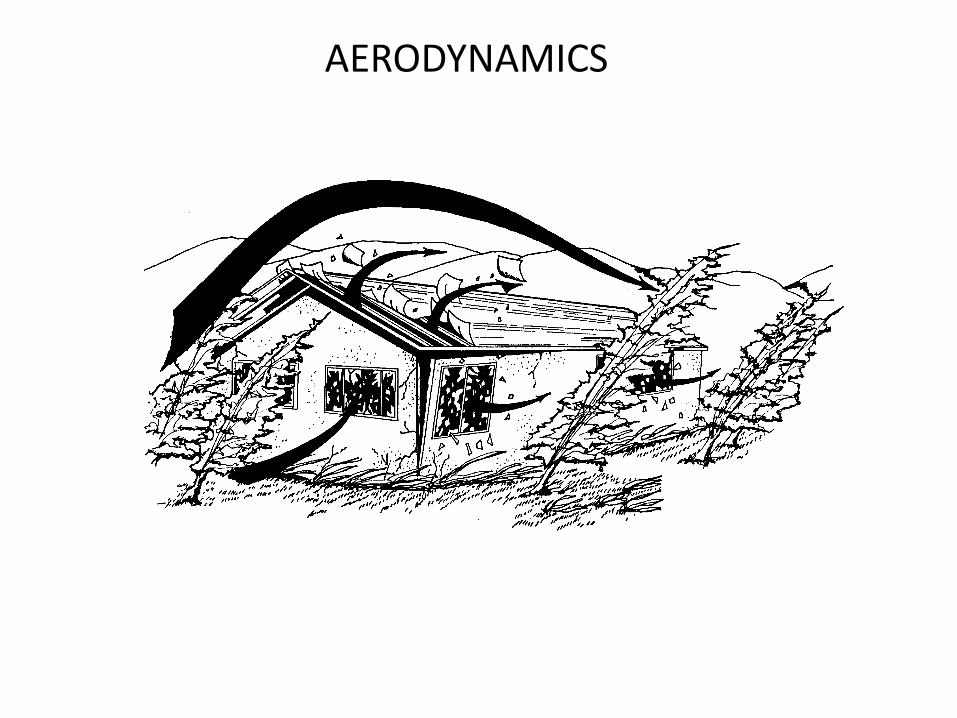
AERODYNAMICS
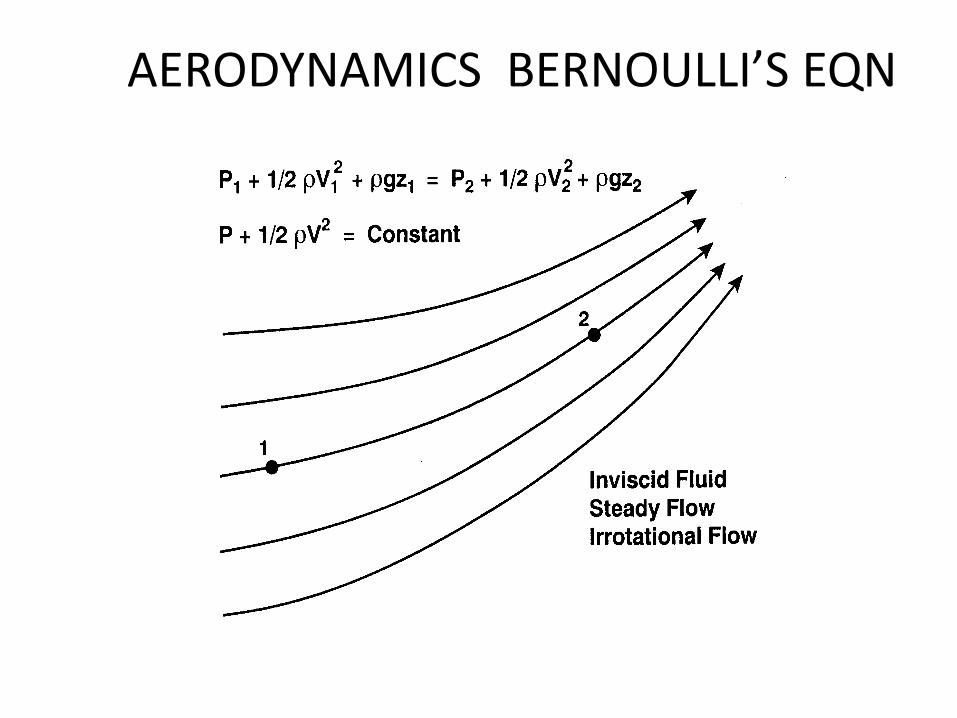
AERODYNAMICS BERNOULLI’S EQN
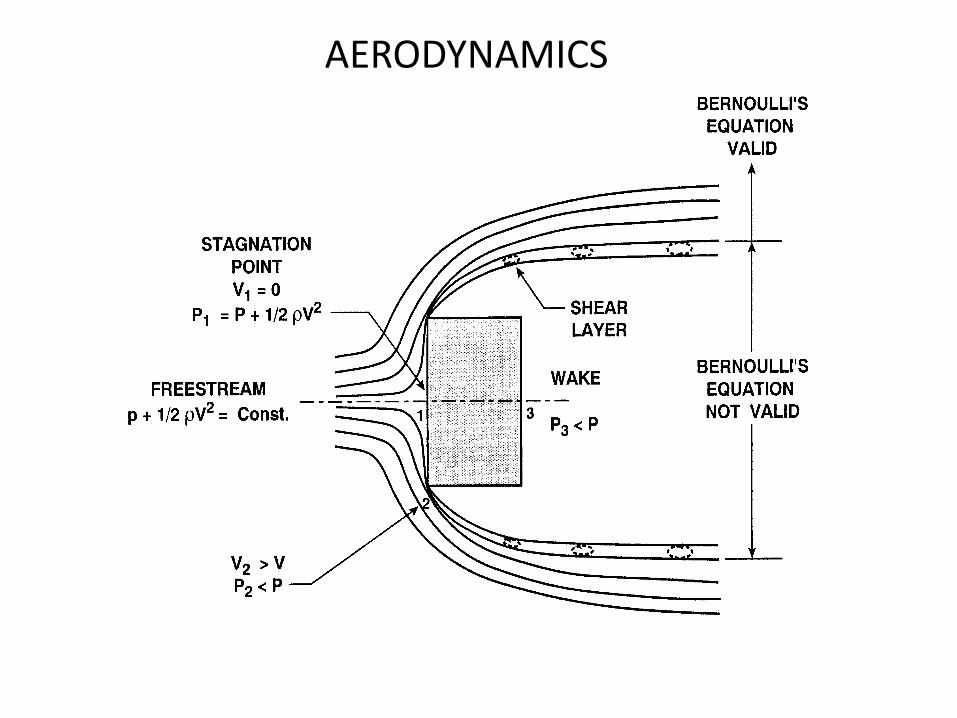
AERODYNAMICS

PRESSURE COEFFICIENT Ppeak
Vpeak
Pmean
-1
0
1
2
3
0 3 6 9 12 15
Time (Minutes)
Win
d P
res
su
re
(PS
F)
Vmean
0
10
20
30
40
0 3 6 9 12 15
Time (Minutes)
Win
d S
pe
ed
(MP
H)
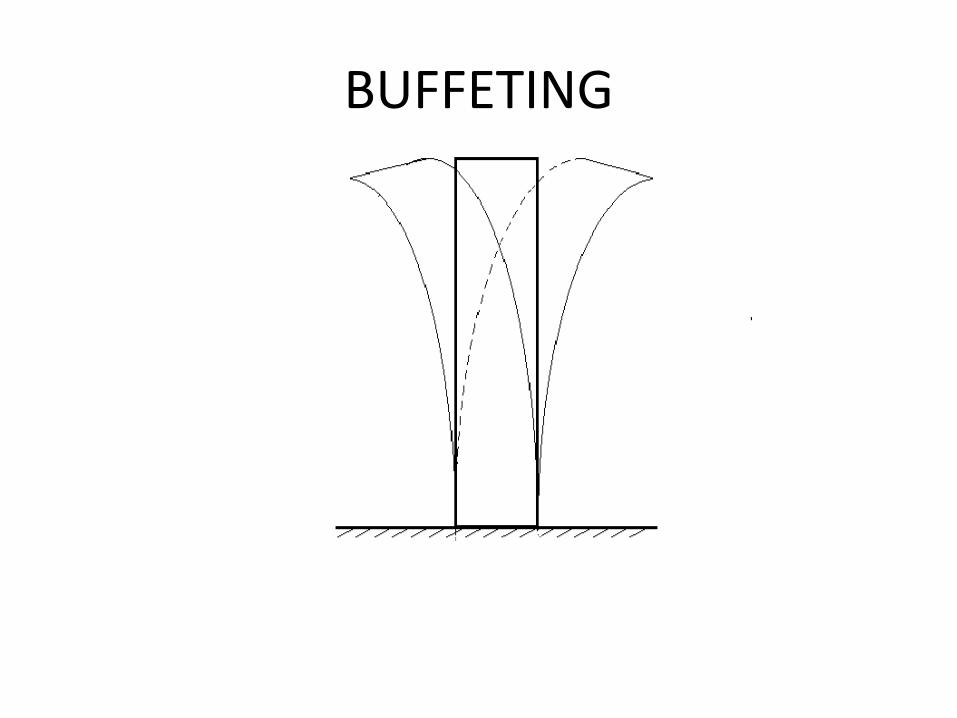
BUFFETING
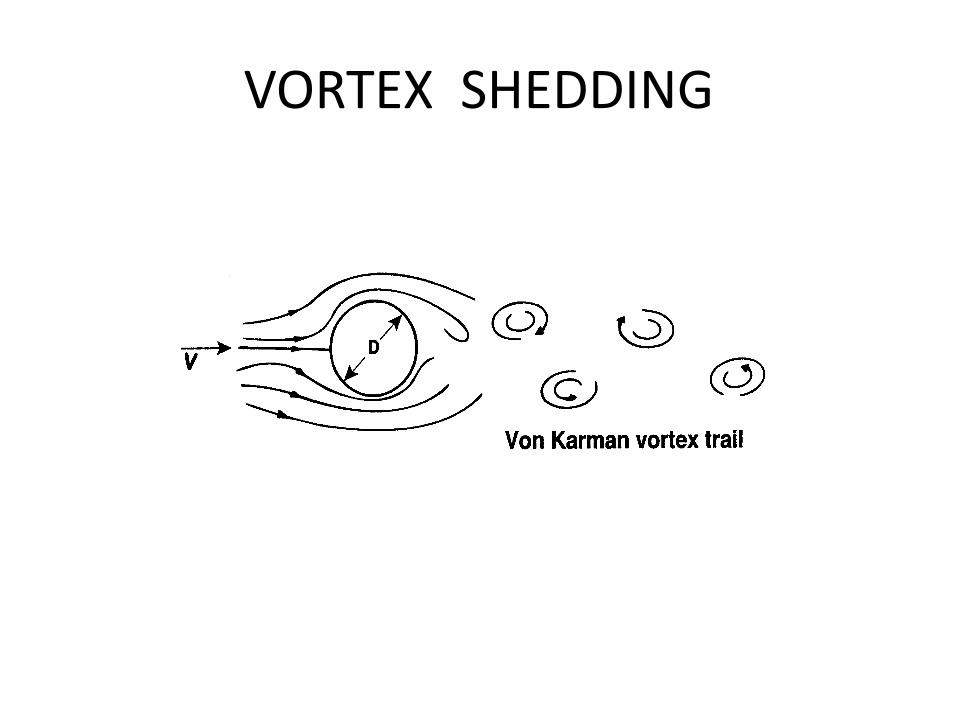
VORTEX SHEDDING
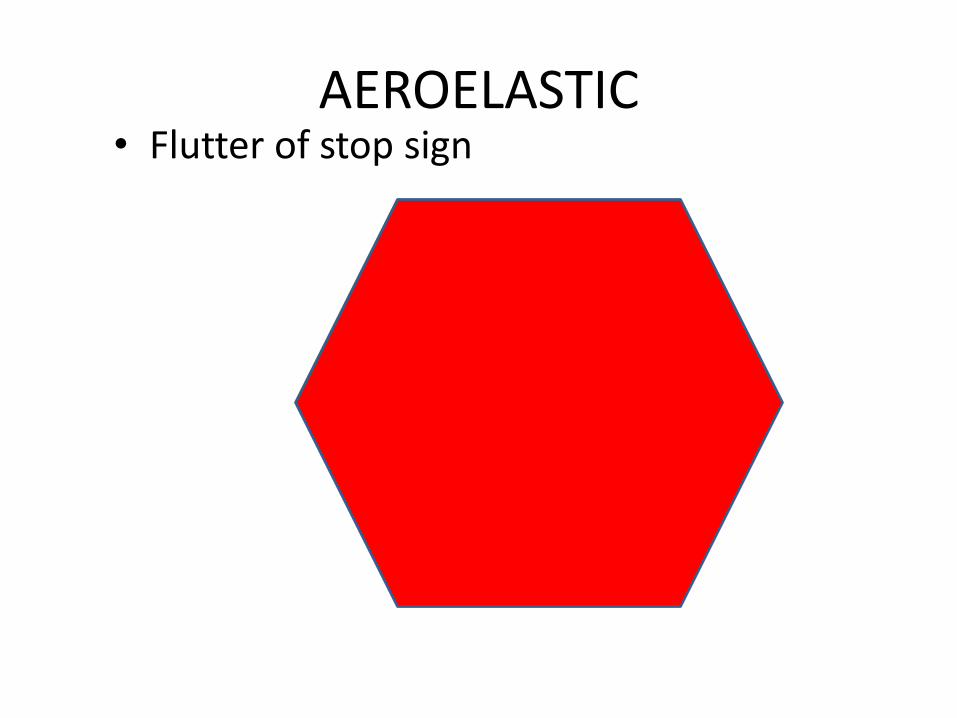
AEROELASTIC • Flutter of stop sign
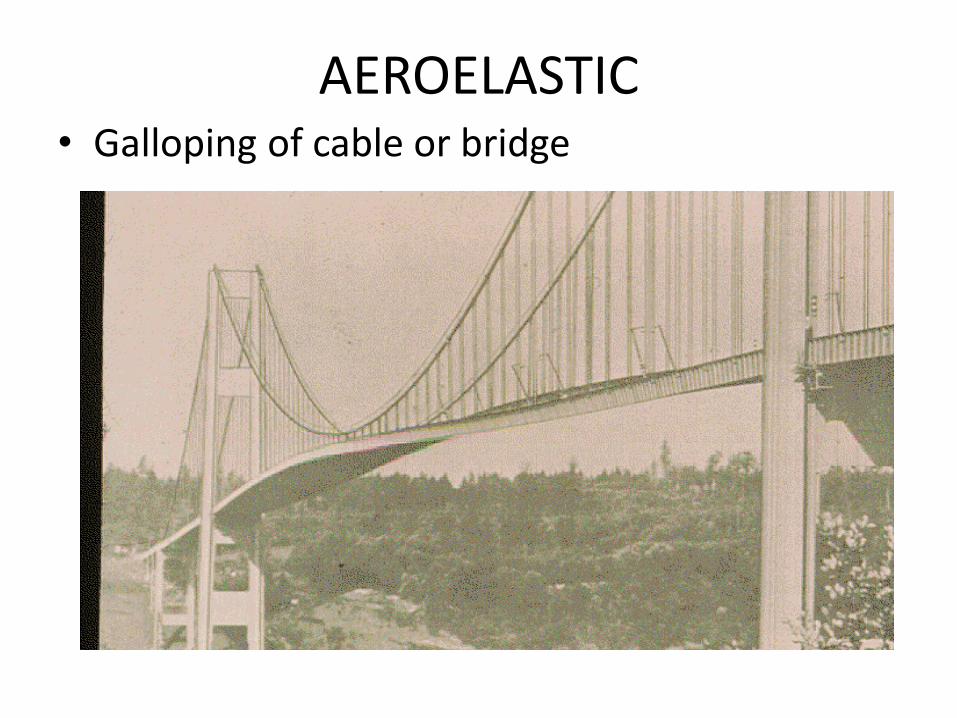
AEROELASTIC • Galloping of cable or bridge
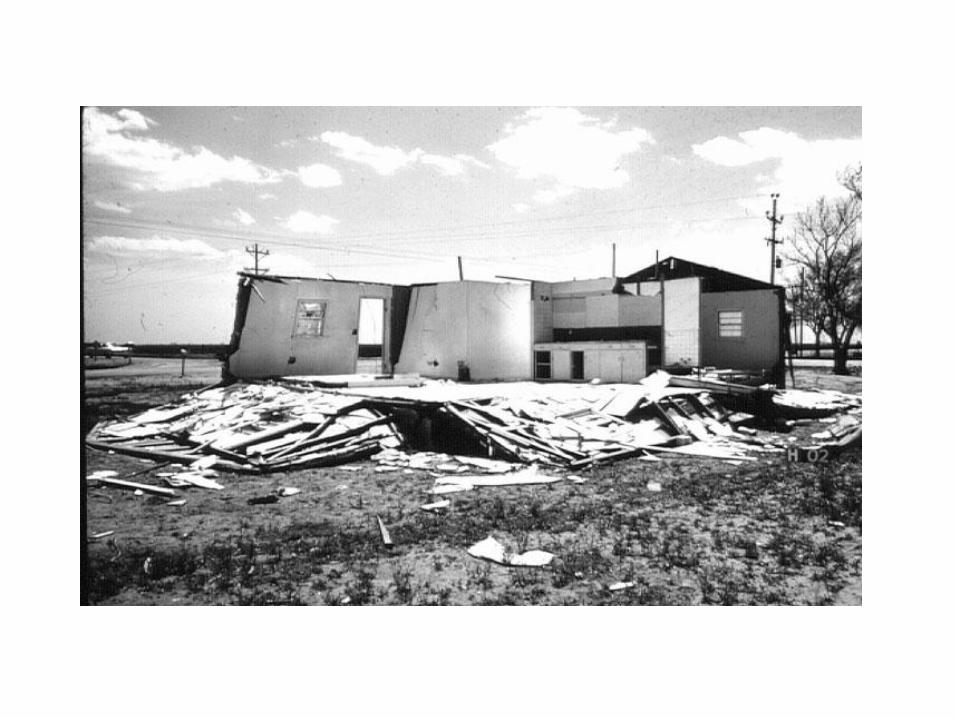
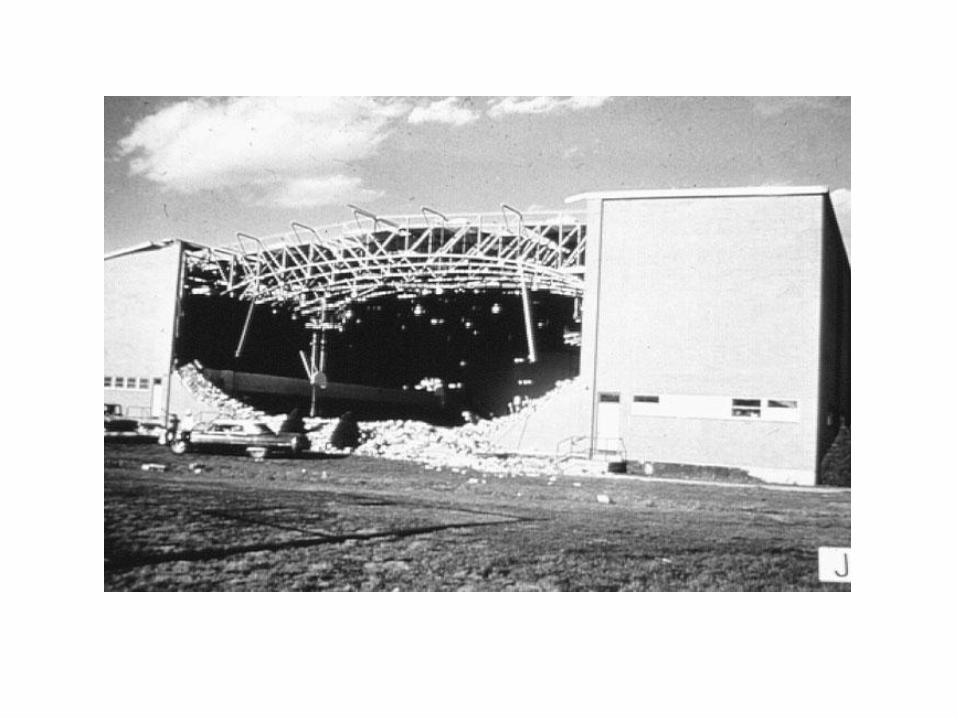
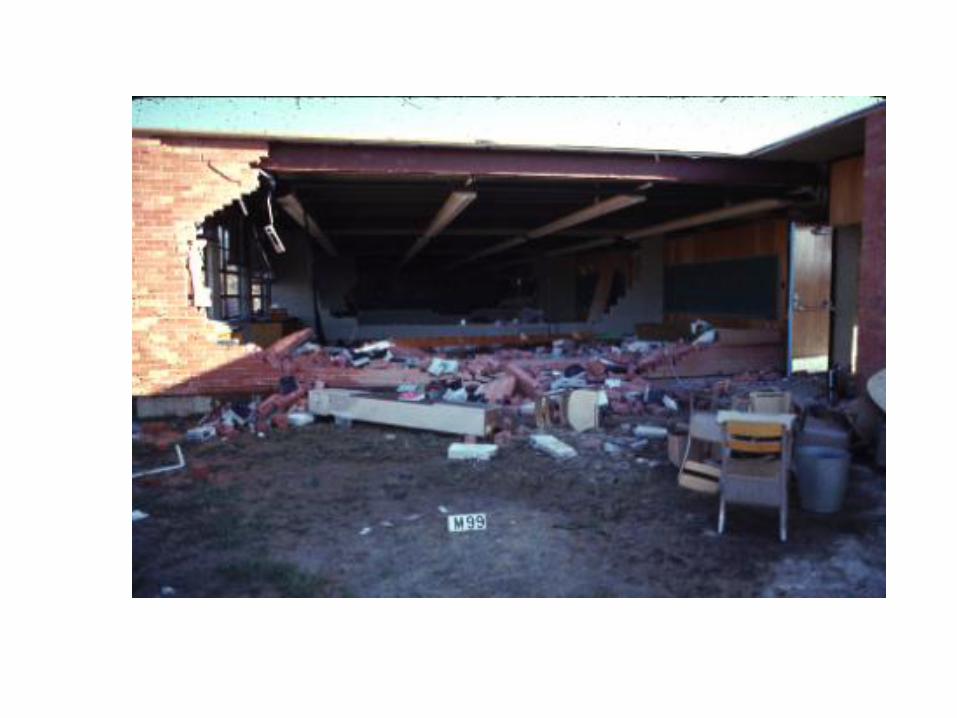
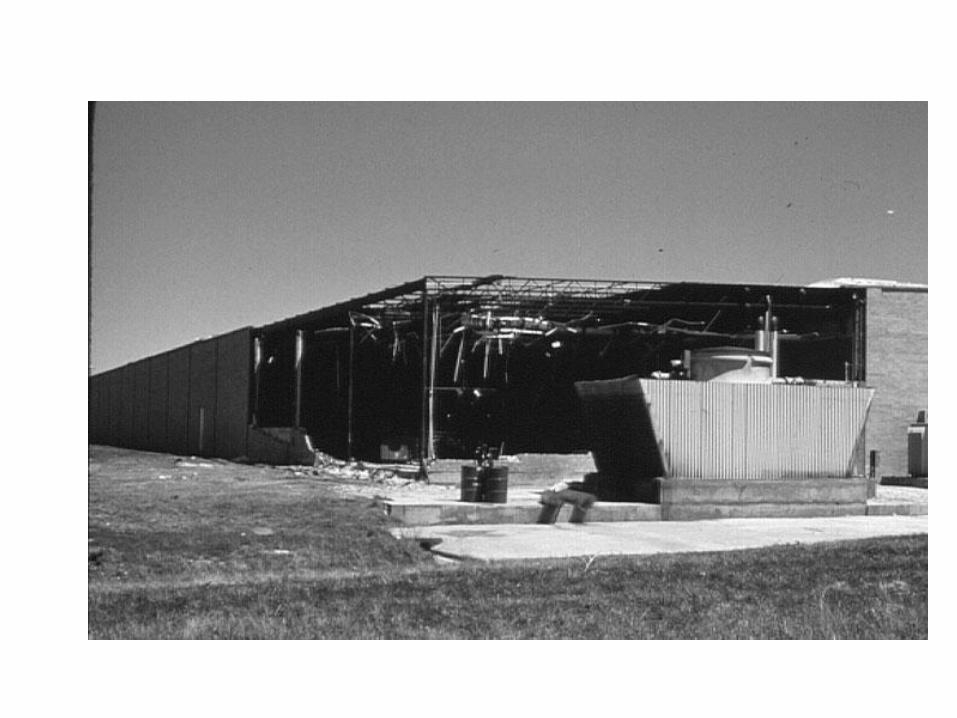
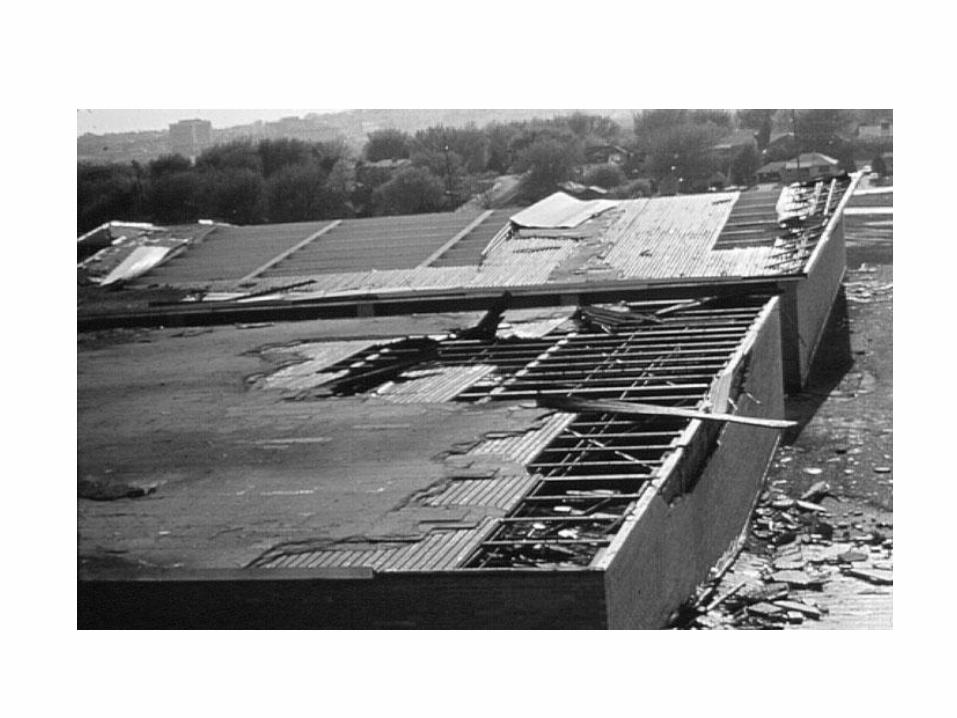
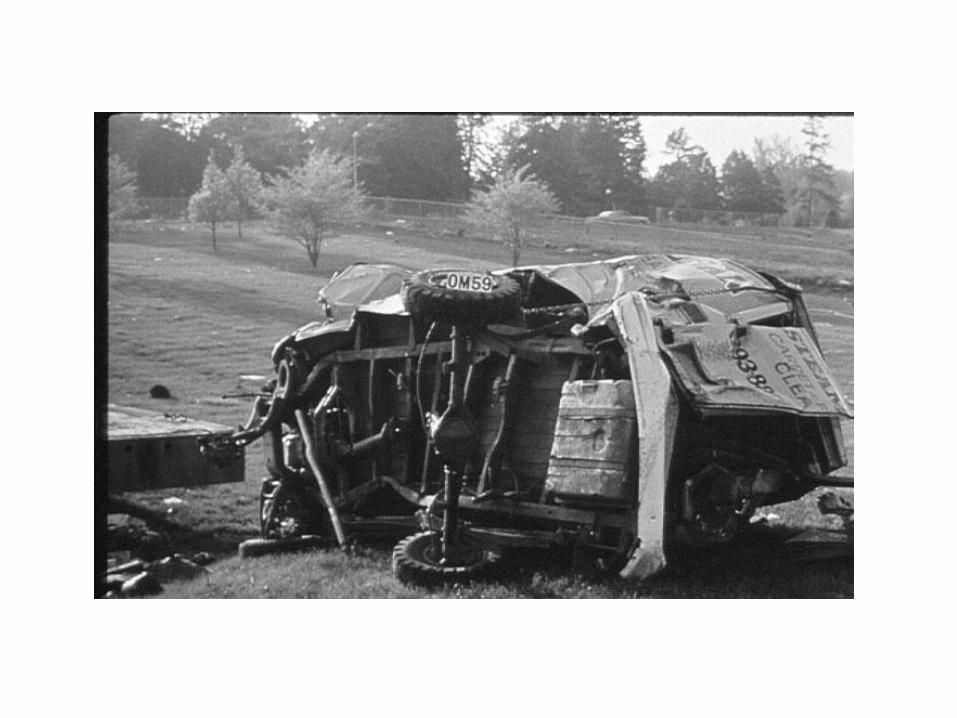
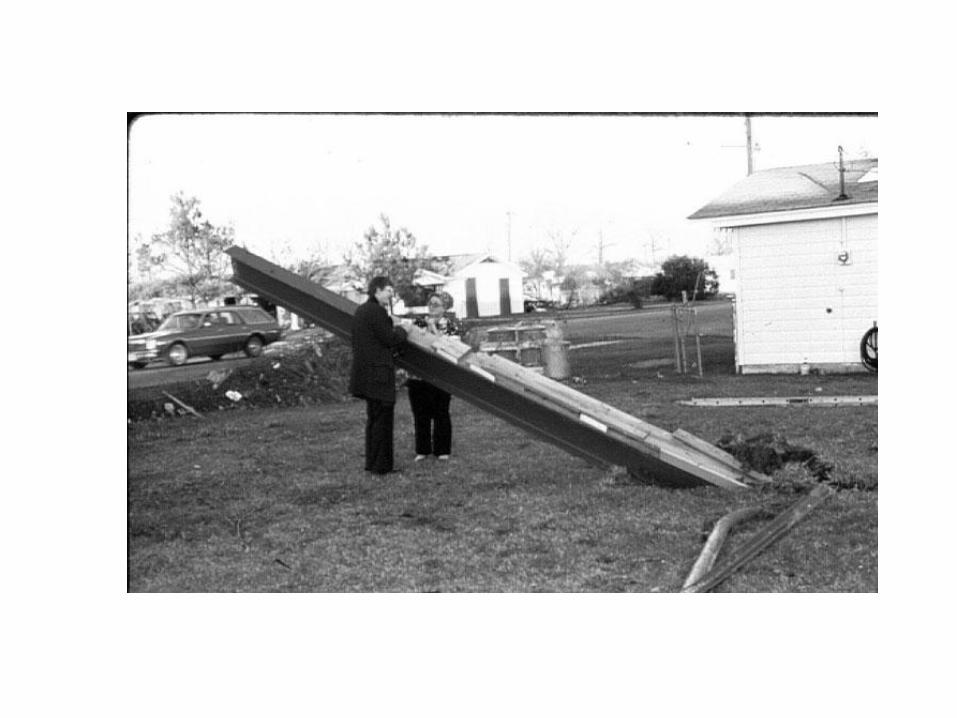
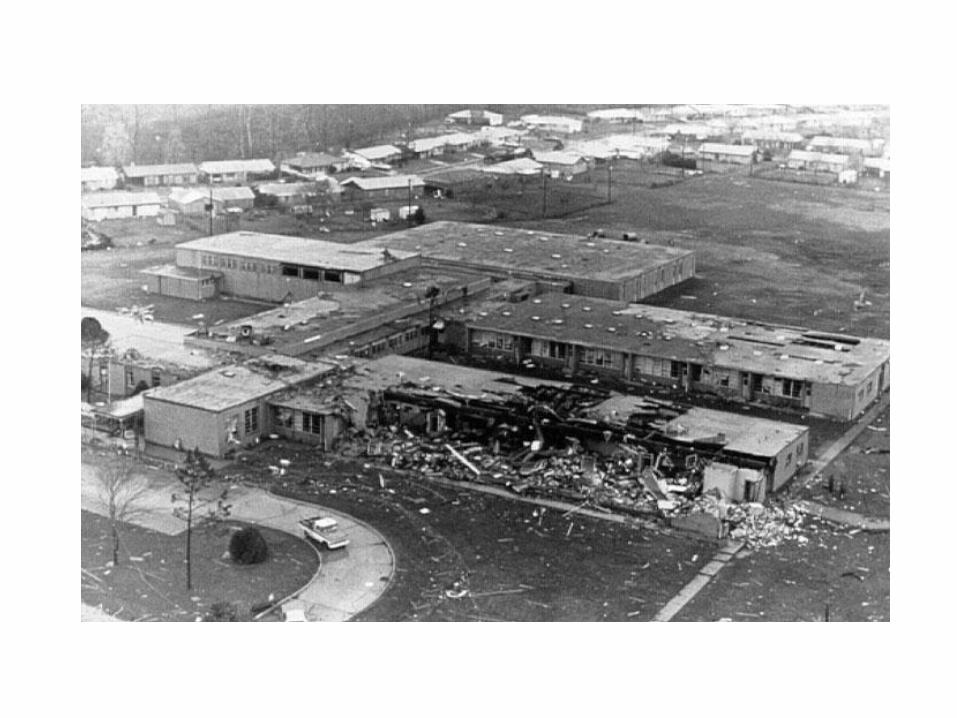
WIND DAMAGE EXPERIENCE
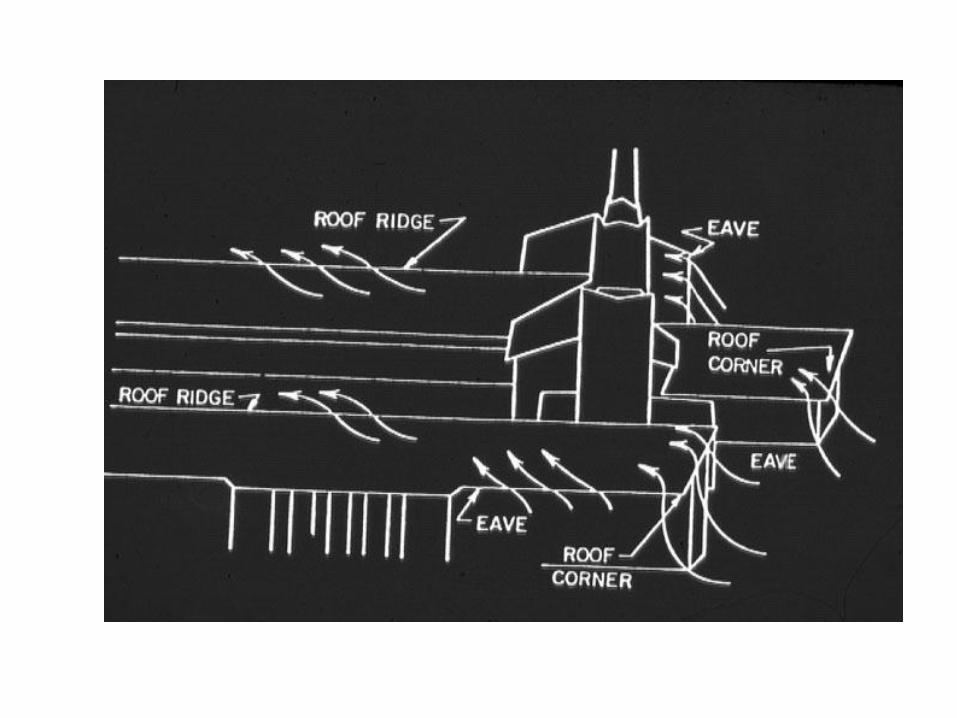
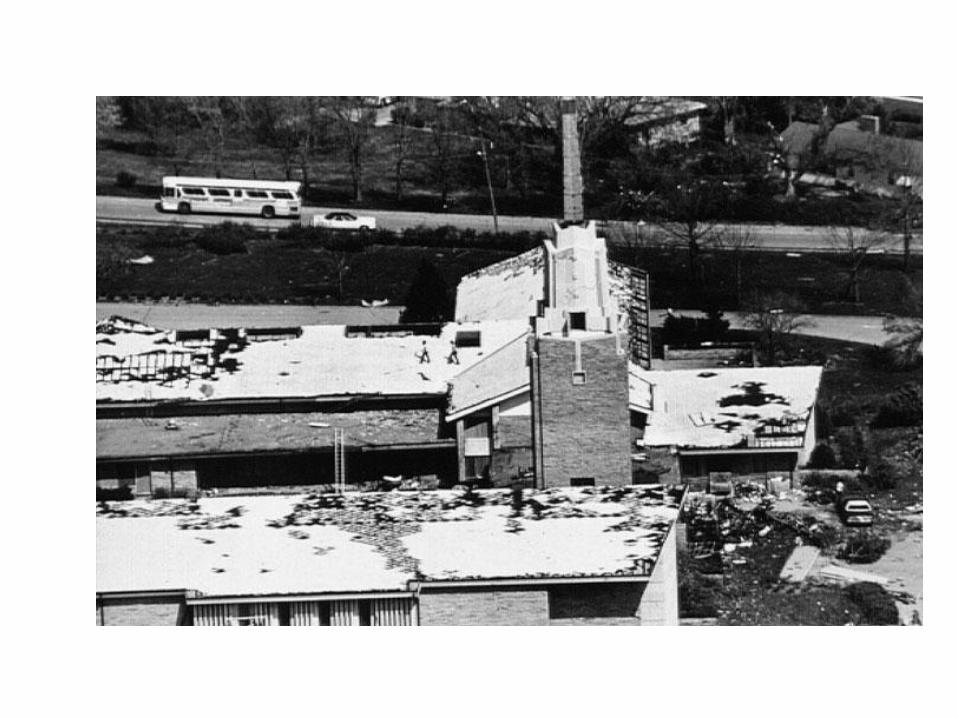
• Wind Flow Damage
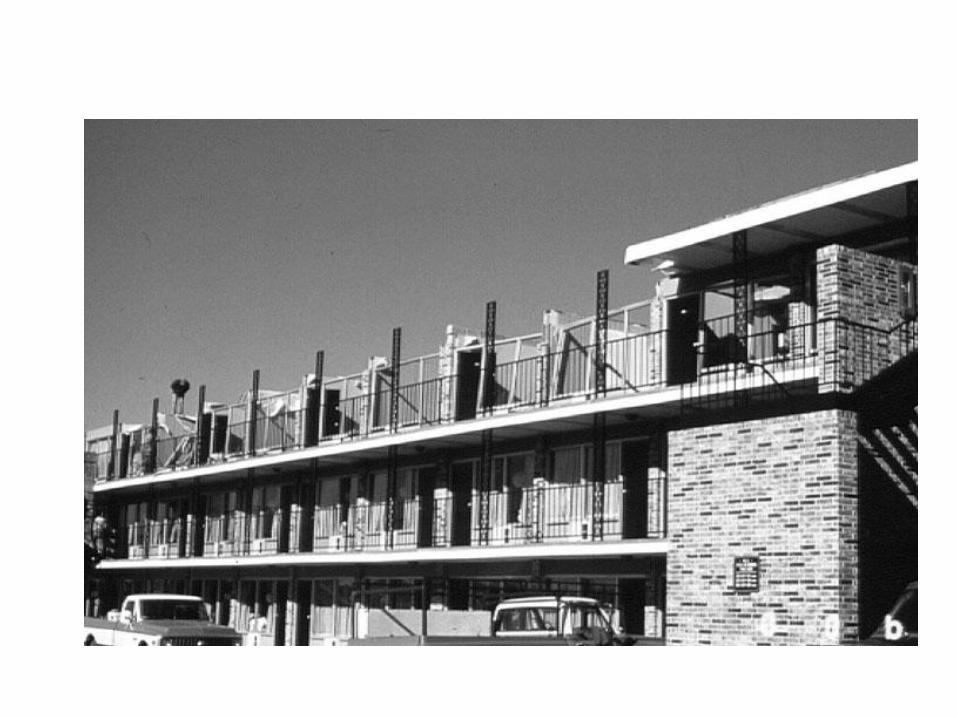
• Damage by Building Category
• Windborne Debris (Missiles)
• Some Damage Statistics
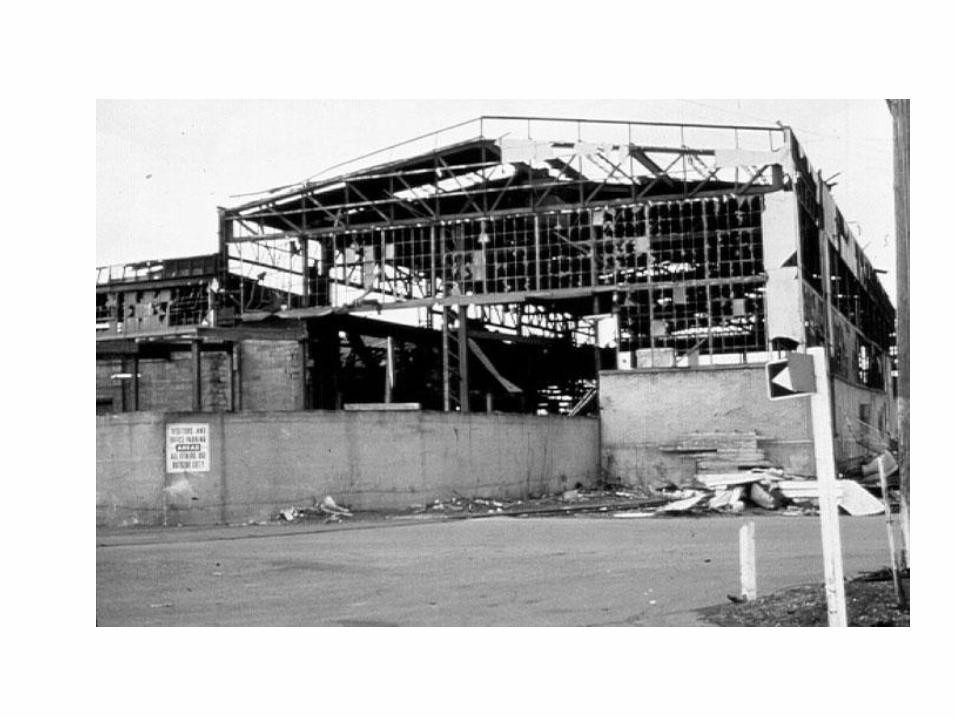
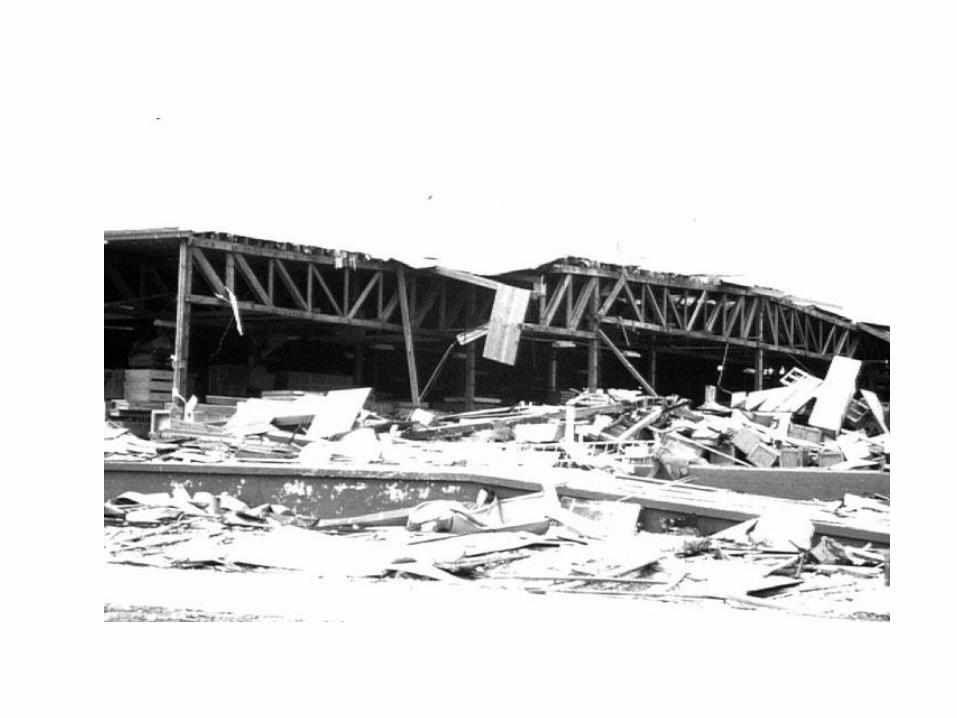
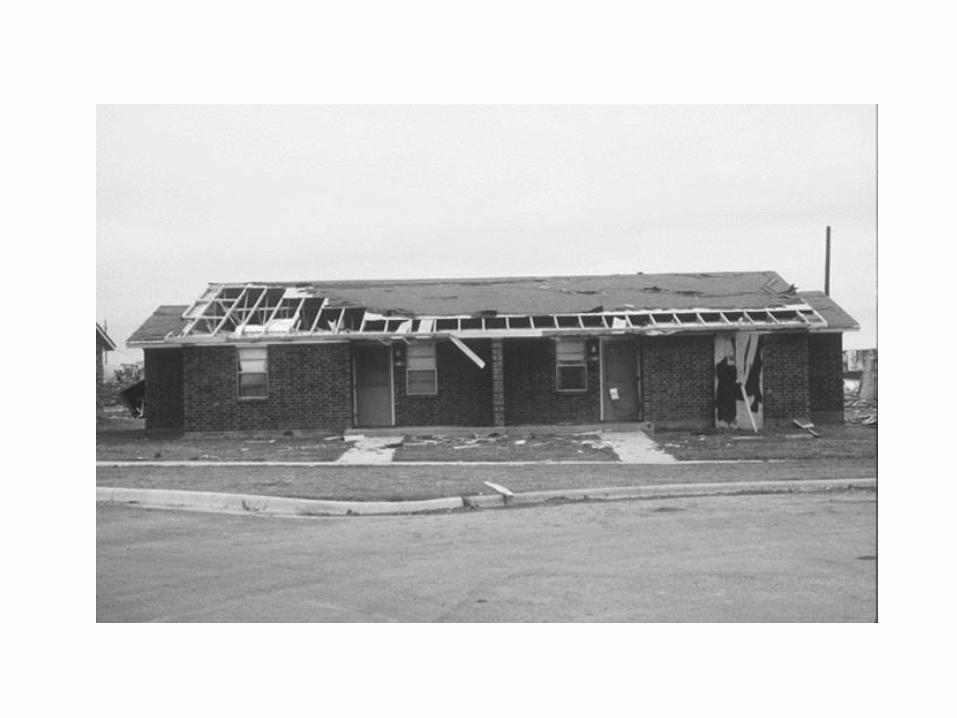
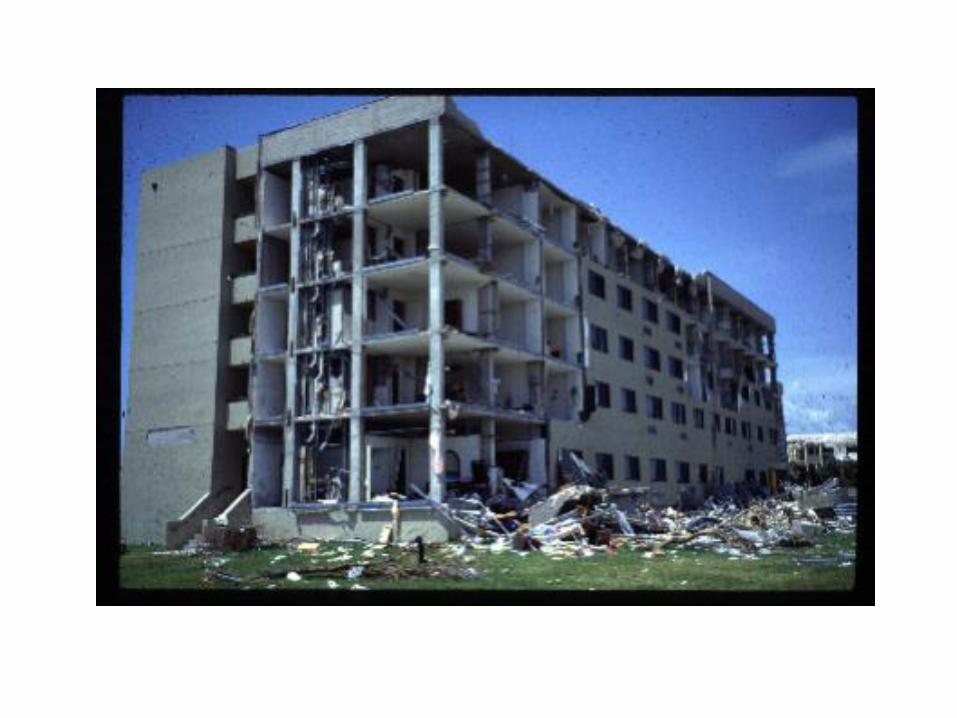
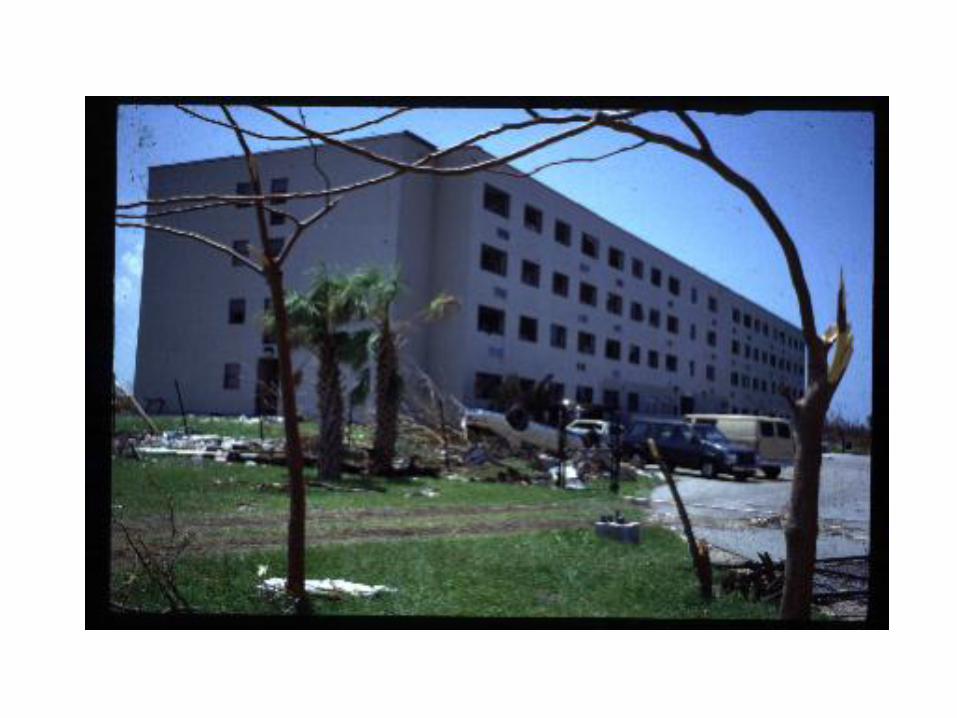
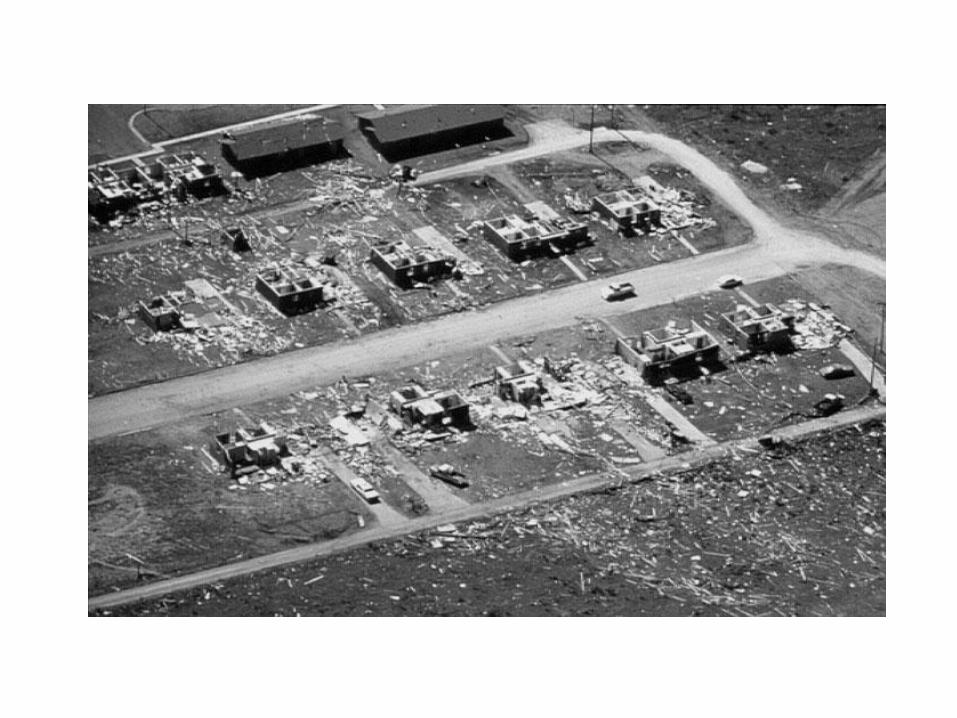
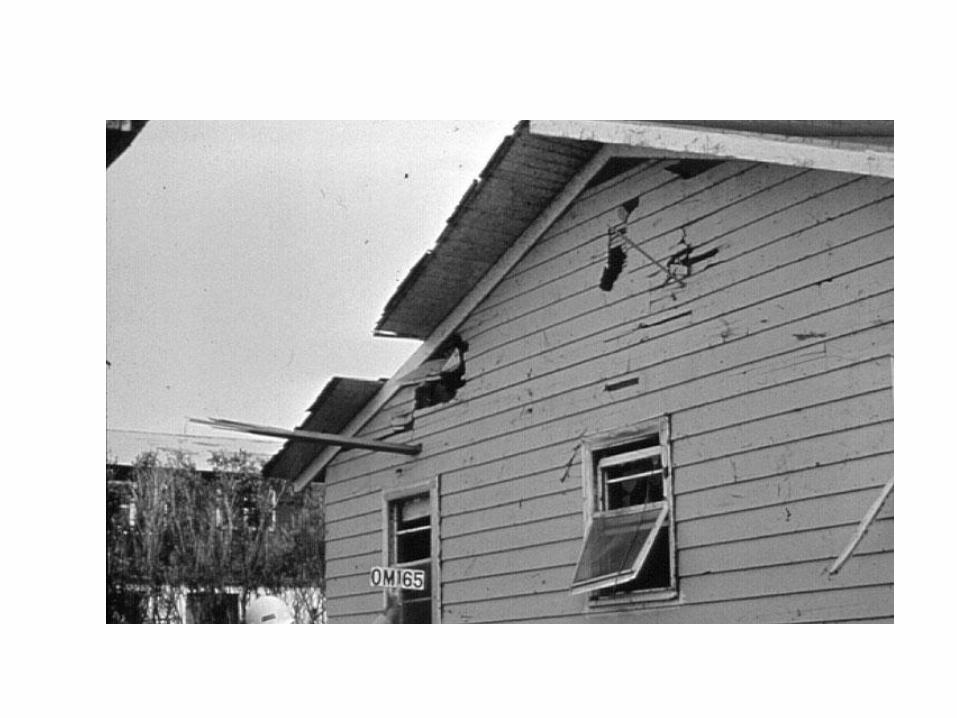
WINDBORNE DEBRIS (MISSILES)
• Windborne missiles range in size from roof gravel to large storage tanks and railroad cars
• Missiles cause damage by:
– Perforation
– Structural Collapse
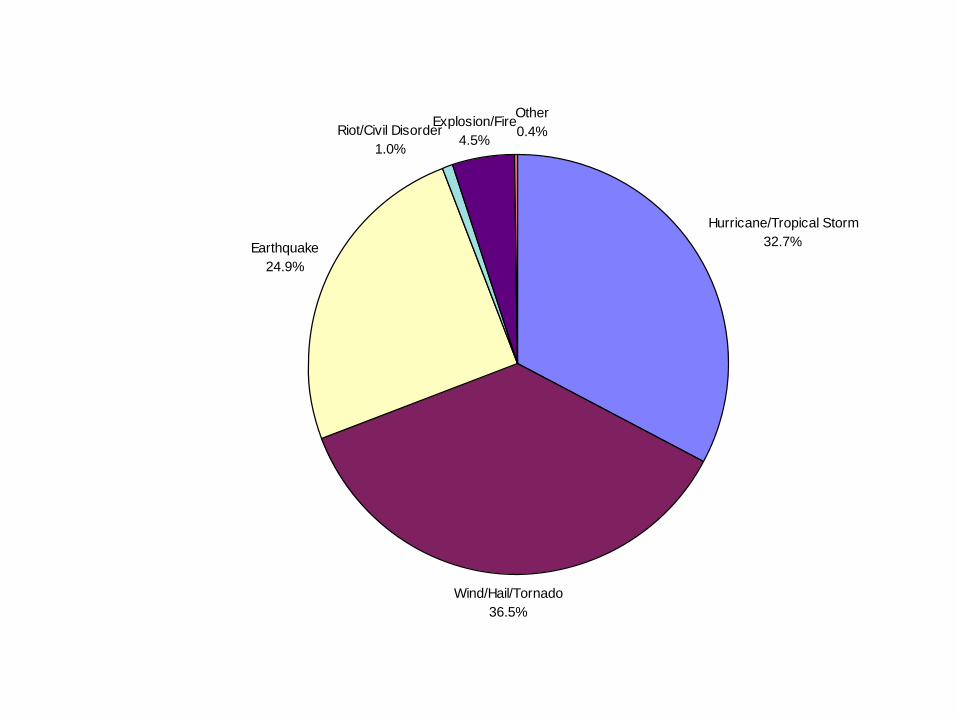
Riot/Civil Disorder
1.0%
Explosion/Fire
4.5%
Earthquake
24.9%
Wind/Hail/Tornado
36.5%
Hurricane/Tropical Storm
32.7%
Other
0.4%

Wind Loads, ASCE 7-10 The design codes recognizes the following
• Design Elements
– Main Wind-Force Resisting System (MWFRS)
– Components and Cladding (C&C)
• Basic wind speed, V, = Three – second gust speed at 33 ft above the ground in exposure C.
• Buildings – Enclosed
– Open, building having each wall at least 80% open
– Partially enclosed
Wind Loads, continued
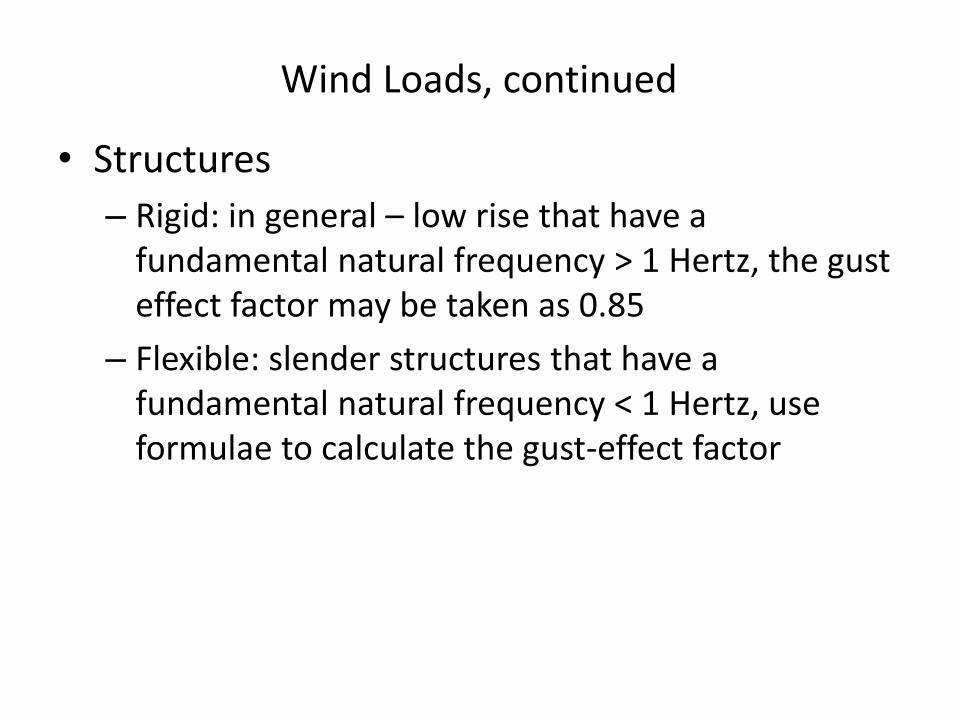
• Structures
– Rigid: in general – low rise that have a fundamental natural frequency > 1 Hertz, the gust effect factor may be taken as 0.85
– Flexible: slender structures that have a fundamental natural frequency < 1 Hertz, use formulae to calculate the gust-effect factor
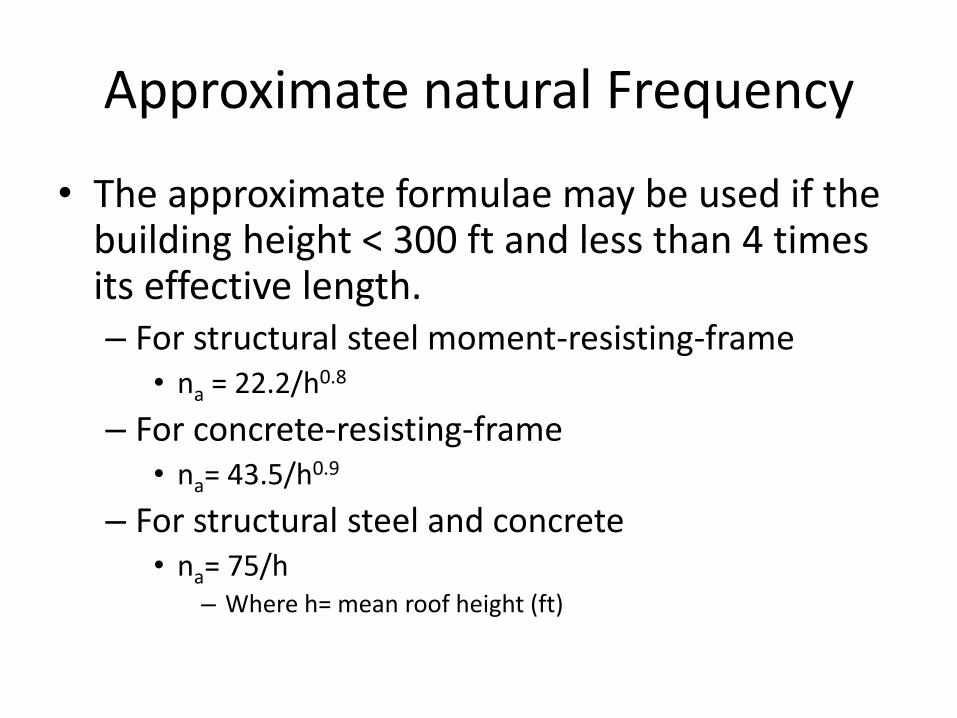
Approximate natural Frequency
• The approximate formulae may be used if the building height < 300 ft and less than 4 times its effective length. – For structural steel moment-resisting-frame
• na = 22.2/h0.8
– For concrete-resisting-frame • na= 43.5/h0.9
– For structural steel and concrete • na= 75/h
– Where h= mean roof height (ft)
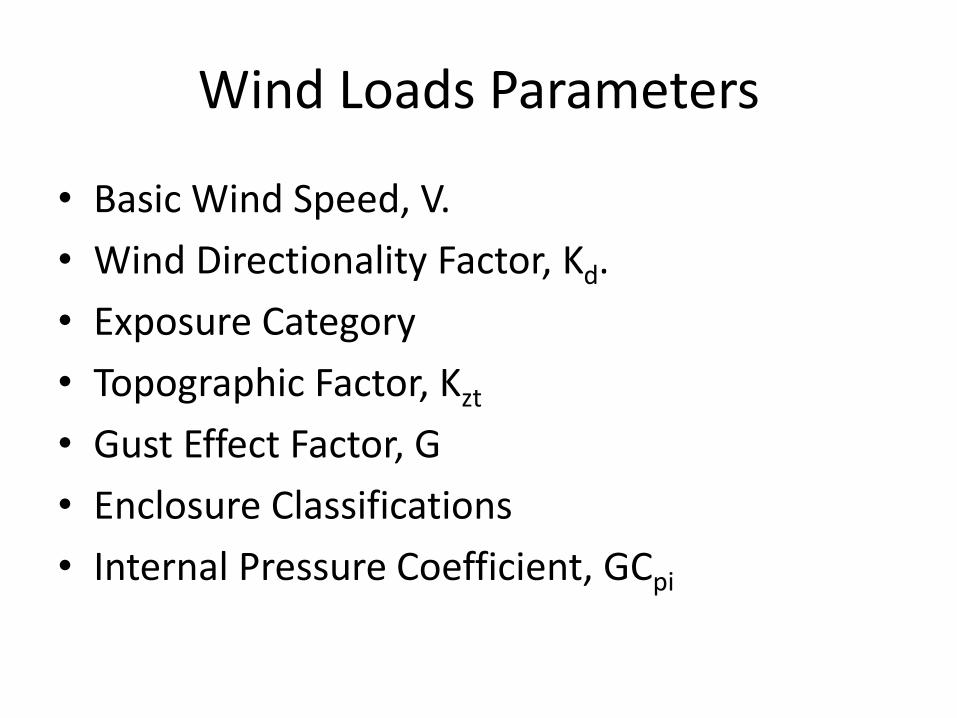
Wind Loads Parameters
• Basic Wind Speed, V.
• Wind Directionality Factor, Kd.
• Exposure Category
• Topographic Factor, Kzt
• Gust Effect Factor, G
• Enclosure Classifications
• Internal Pressure Coefficient, GCpi
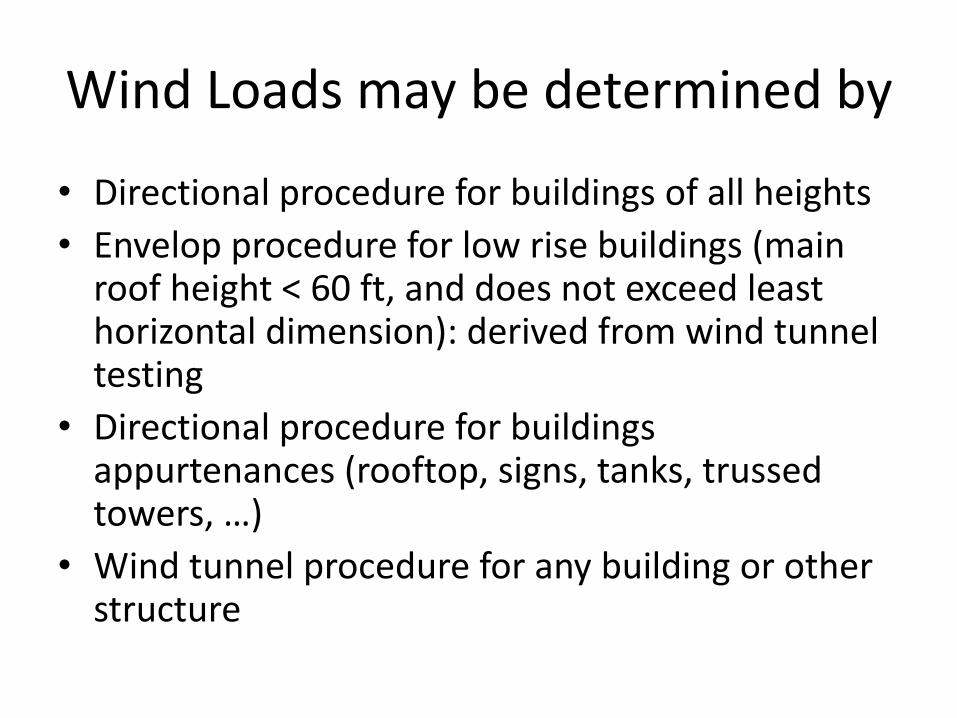
Wind Loads may be determined by
• Directional procedure for buildings of all heights
• Envelop procedure for low rise buildings (main roof height < 60 ft, and does not exceed least horizontal dimension): derived from wind tunnel testing
• Directional procedure for buildings appurtenances (rooftop, signs, tanks, trussed towers, …)
• Wind tunnel procedure for any building or other structure
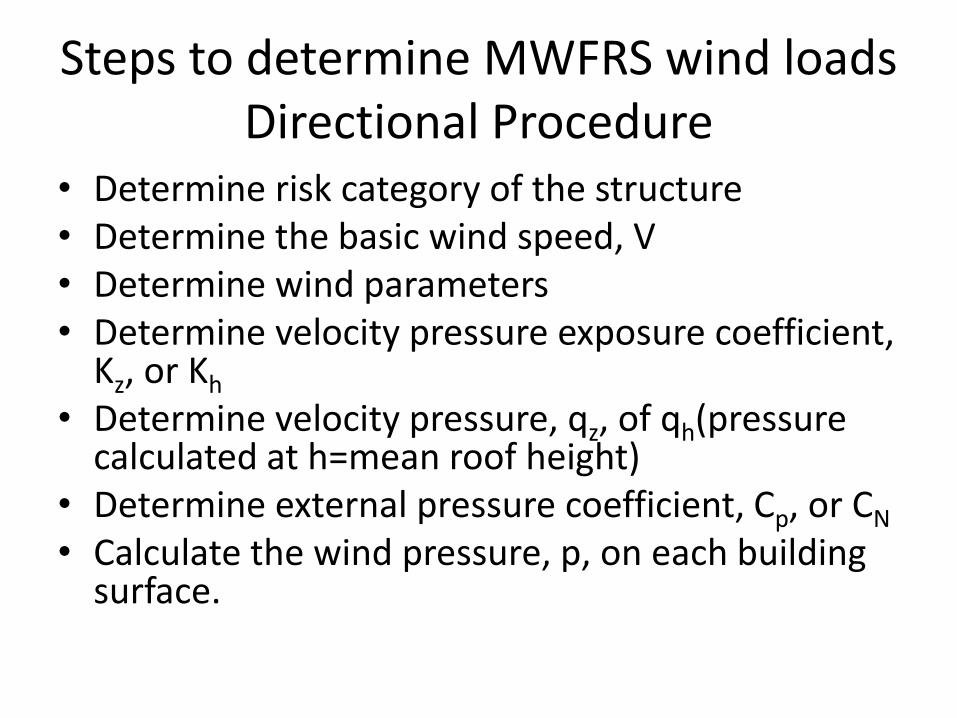
Steps to determine MWFRS wind loads Directional Procedure
• Determine risk category of the structure • Determine the basic wind speed, V • Determine wind parameters • Determine velocity pressure exposure coefficient,
Kz, or Kh
• Determine velocity pressure, qz, of qh(pressure calculated at h=mean roof height)
• Determine external pressure coefficient, Cp, or CN
• Calculate the wind pressure, p, on each building surface.
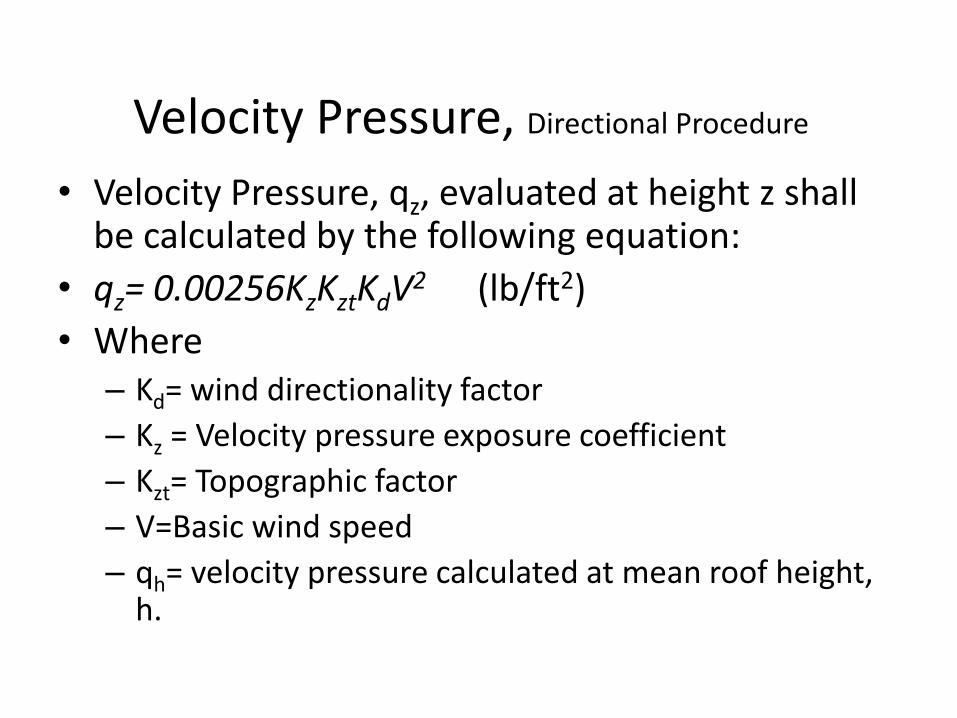
Velocity Pressure, Directional Procedure
• Velocity Pressure, qz, evaluated at height z shall be calculated by the following equation:
• qz= 0.00256KzKztKdV2 (lb/ft2)
• Where – Kd= wind directionality factor
– Kz = Velocity pressure exposure coefficient
– Kzt= Topographic factor
– V=Basic wind speed
– qh= velocity pressure calculated at mean roof height, h.
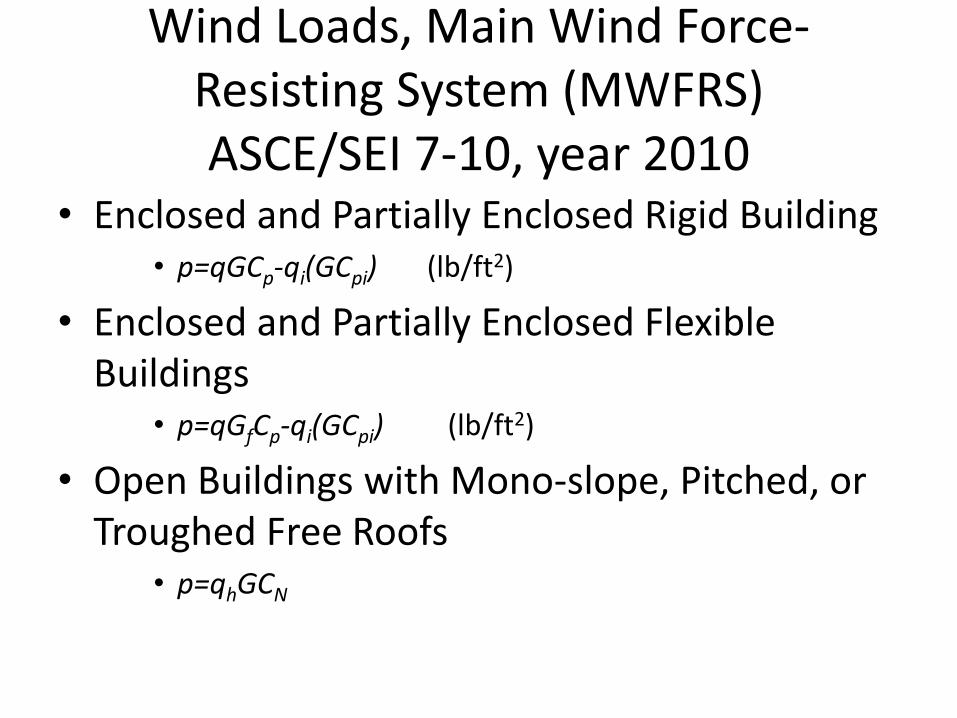
Wind Loads, Main Wind Force-Resisting System (MWFRS) ASCE/SEI 7-10, year 2010
• Enclosed and Partially Enclosed Rigid Building • p=qGCp-qi(GCpi) (lb/ft2)
• Enclosed and Partially Enclosed Flexible Buildings
• p=qGfCp-qi(GCpi) (lb/ft2)
• Open Buildings with Mono-slope, Pitched, or Troughed Free Roofs
• p=qhGCN
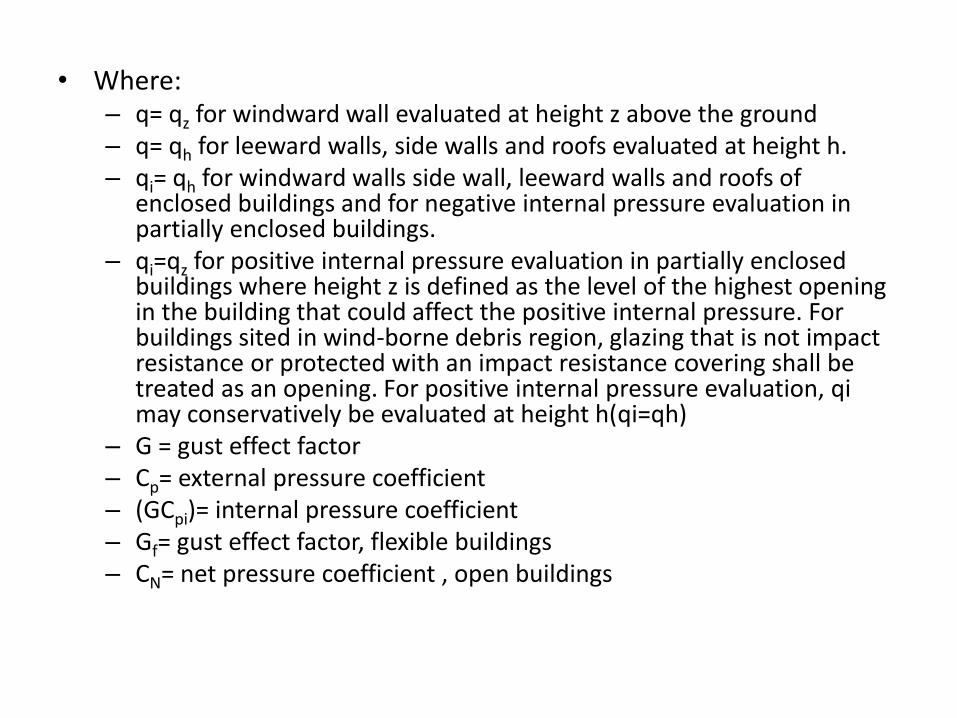
• Where: – q= qz for windward wall evaluated at height z above the ground – q= qh for leeward walls, side walls and roofs evaluated at height h. – qi= qh for windward walls side wall, leeward walls and roofs of
enclosed buildings and for negative internal pressure evaluation in partially enclosed buildings.
– qi=qz for positive internal pressure evaluation in partially enclosed buildings where height z is defined as the level of the highest opening in the building that could affect the positive internal pressure. For buildings sited in wind-borne debris region, glazing that is not impact resistance or protected with an impact resistance covering shall be treated as an opening. For positive internal pressure evaluation, qi may conservatively be evaluated at height h(qi=qh)
– G = gust effect factor – Cp= external pressure coefficient – (GCpi)= internal pressure coefficient – Gf= gust effect factor, flexible buildings – CN= net pressure coefficient , open buildings
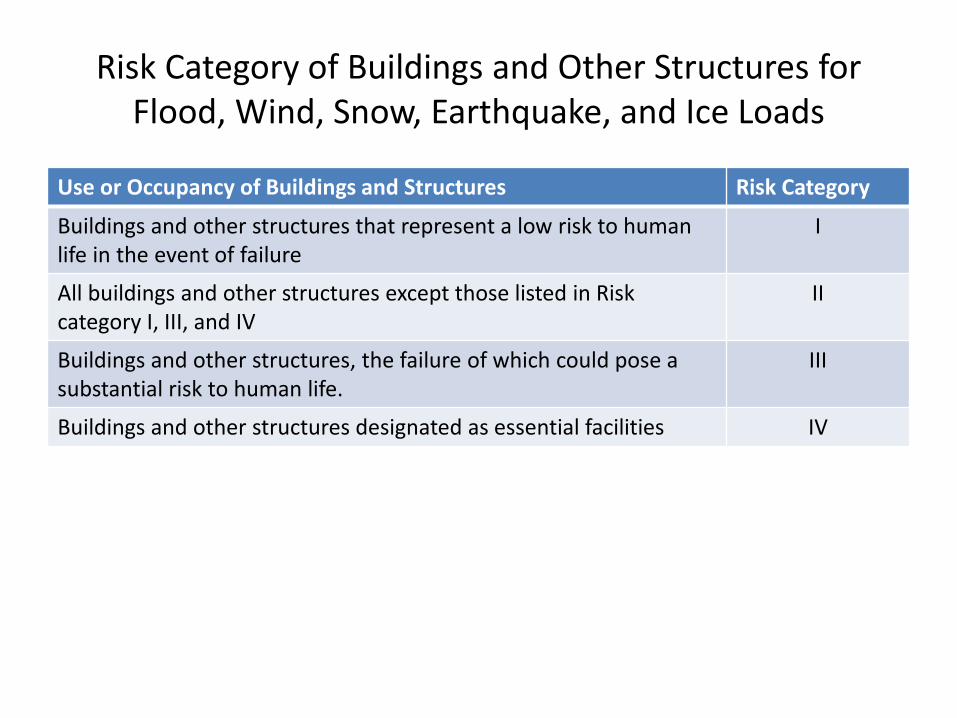
Risk Category of Buildings and Other Structures for Flood, Wind, Snow, Earthquake, and Ice Loads
Use or Occupancy of Buildings and Structures Risk Category
Buildings and other structures that represent a low risk to human life in the event of failure
I
All buildings and other structures except those listed in Risk category I, III, and IV
II
Buildings and other structures, the failure of which could pose a substantial risk to human life.
III
Buildings and other structures designated as essential facilities IV
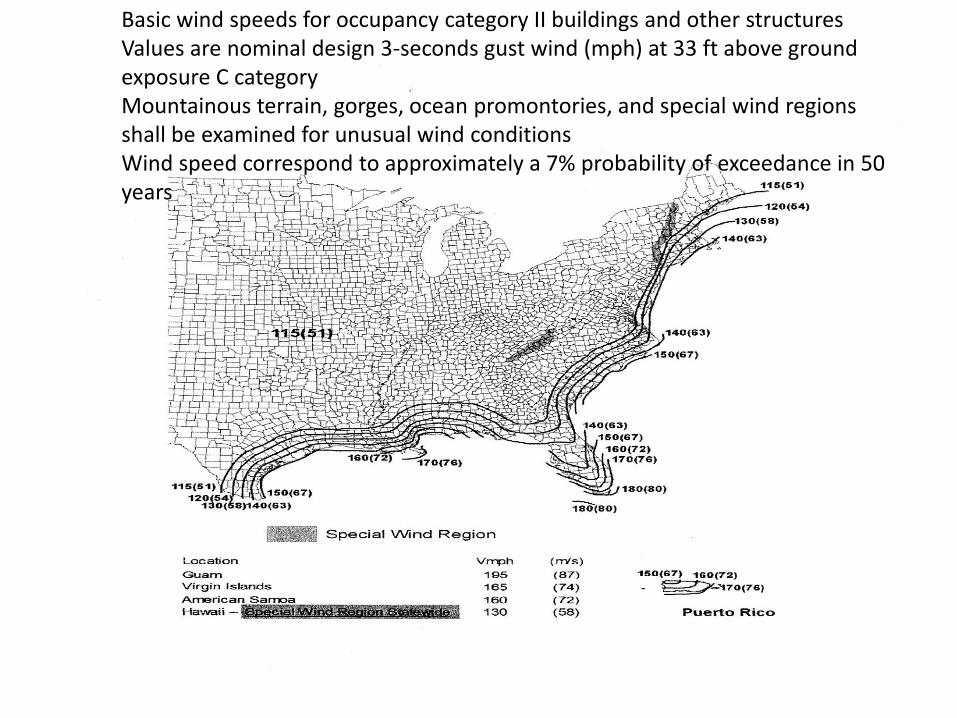
Basic wind speeds for occupancy category II buildings and other structures Values are nominal design 3-seconds gust wind (mph) at 33 ft above ground exposure C category Mountainous terrain, gorges, ocean promontories, and special wind regions shall be examined for unusual wind conditions Wind speed correspond to approximately a 7% probability of exceedance in 50 years
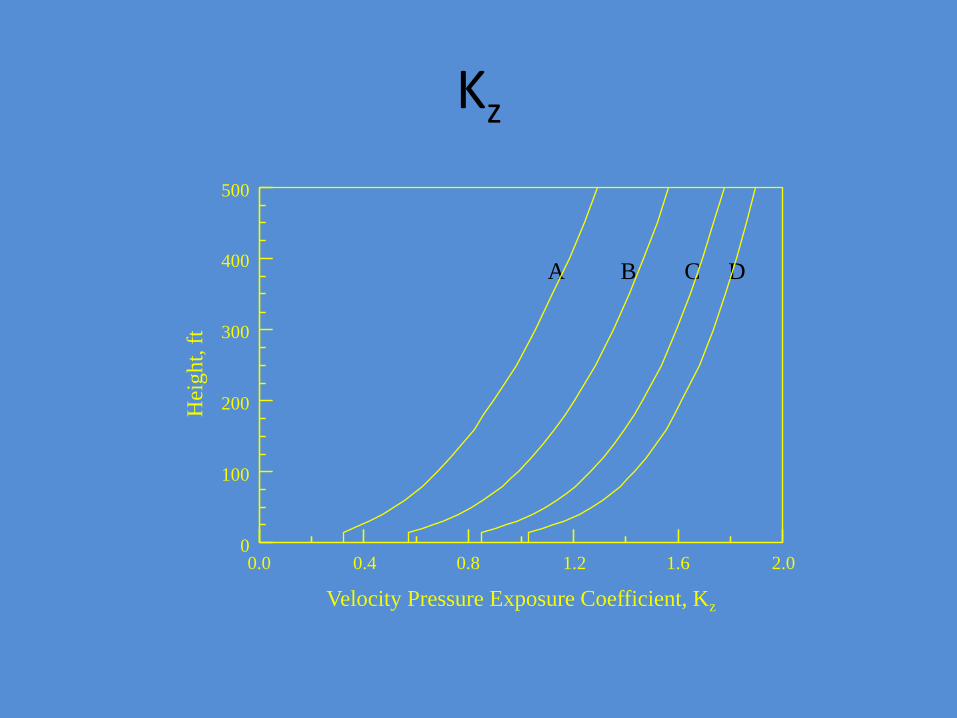
Kz
A B C D
0
100
200
300
500 H
eight,
ft
400
0.0 0.8 1.2 1.6 2.0 0.4
Velocity Pressure Exposure Coefficient, Kz
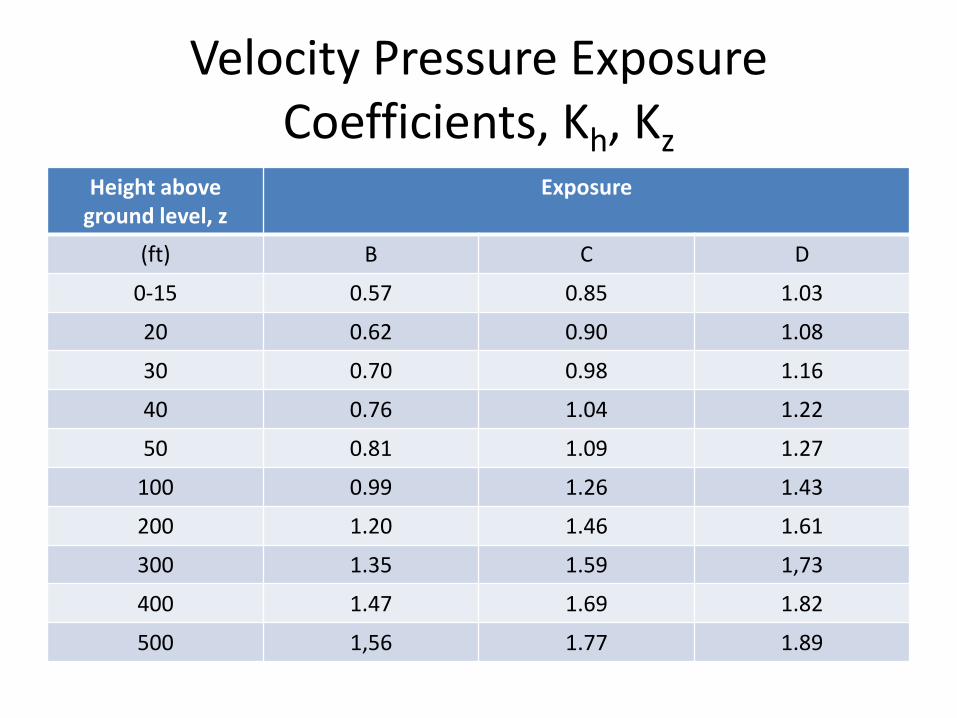
Velocity Pressure Exposure Coefficients, Kh, Kz
Height above ground level, z
Exposure
(ft) B C D
0-15 0.57 0.85 1.03
20 0.62 0.90 1.08
30 0.70 0.98 1.16
40 0.76 1.04 1.22
50 0.81 1.09 1.27
100 0.99 1.26 1.43
200 1.20 1.46 1.61
300 1.35 1.59 1,73
400 1.47 1.69 1.82
500 1,56 1.77 1.89
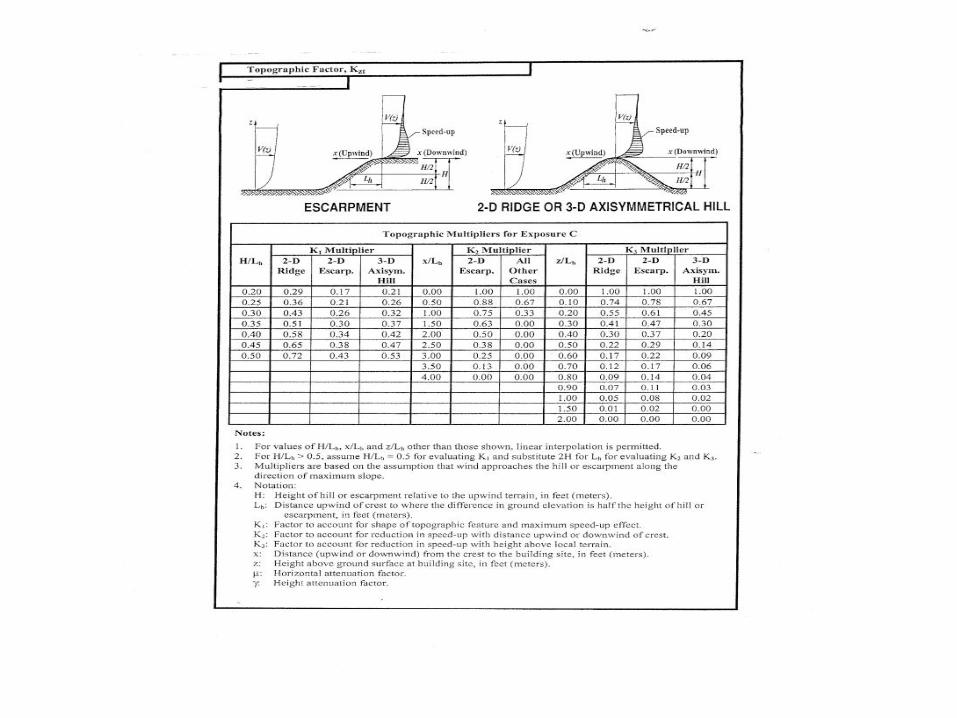
Topographic Factor, Kzt
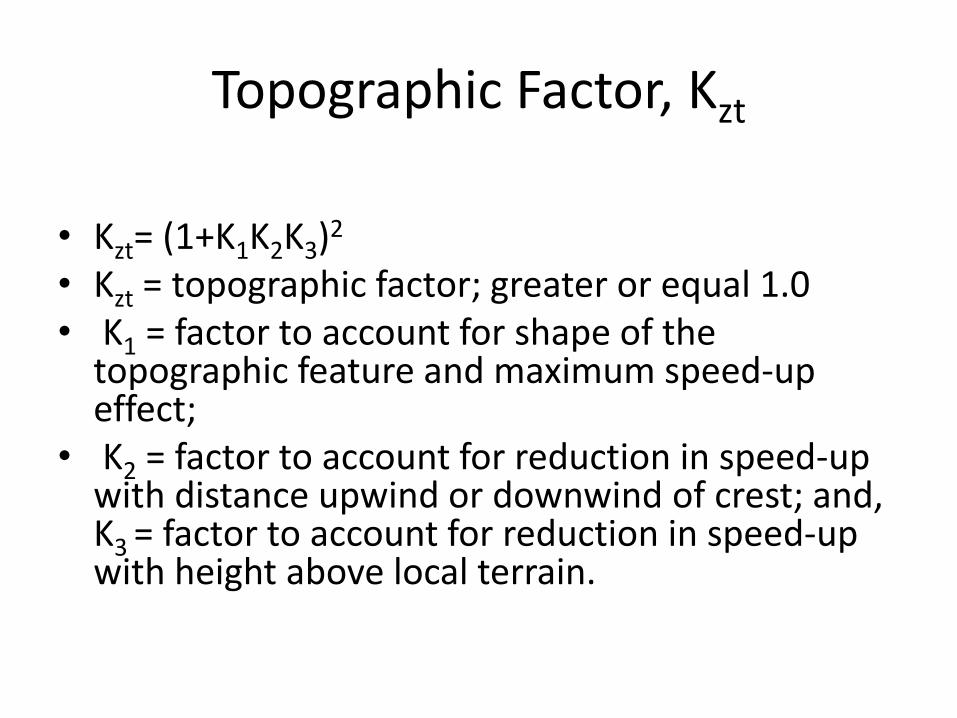
• Kzt= (1+K1K2K3)2
• Kzt = topographic factor; greater or equal 1.0 • K1 = factor to account for shape of the
topographic feature and maximum speed-up effect;
• K2 = factor to account for reduction in speed-up with distance upwind or downwind of crest; and, K3 = factor to account for reduction in speed-up with height above local terrain.
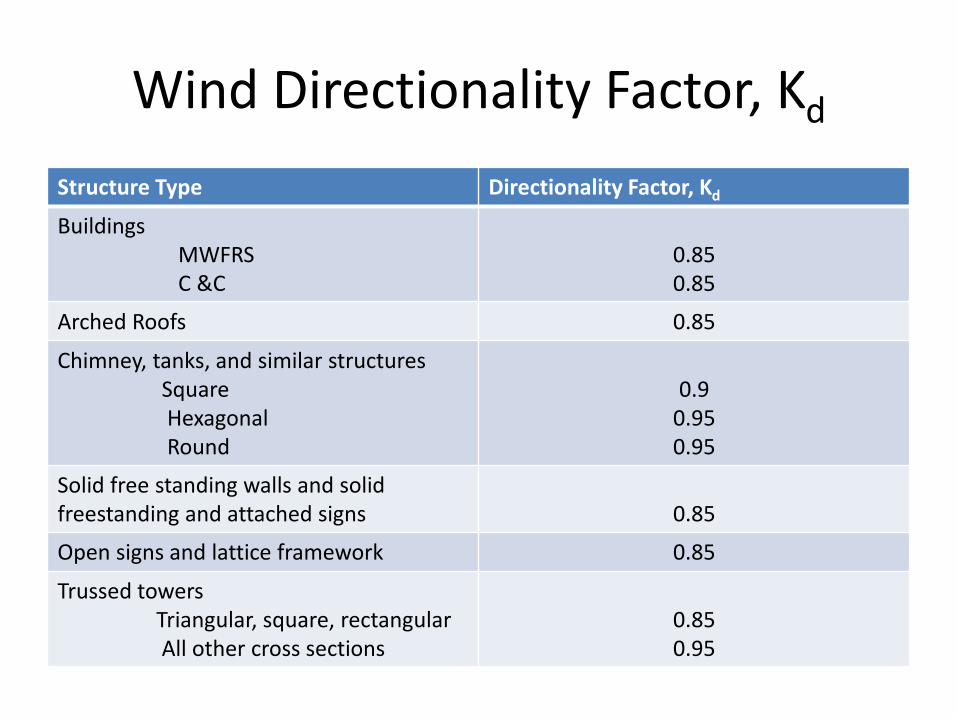
Wind Directionality Factor, Kd
Structure Type Directionality Factor, Kd
Buildings MWFRS C &C
0.85 0.85
Arched Roofs 0.85
Chimney, tanks, and similar structures Square Hexagonal Round
0.9
0.95 0.95
Solid free standing walls and solid freestanding and attached signs
0.85
Open signs and lattice framework 0.85
Trussed towers Triangular, square, rectangular All other cross sections
0.85 0.95
Gust Effect Factor
• For rigid buildings / structures, the gust effect factor, G, shall be taken as 0.85 or calculated by the gust formulae provided by the code.
• For flexible or dynamically sensitive buildings / structures, the gust effect factor, Gf, can only be obtained by using the gust factor formulae provided by the code.
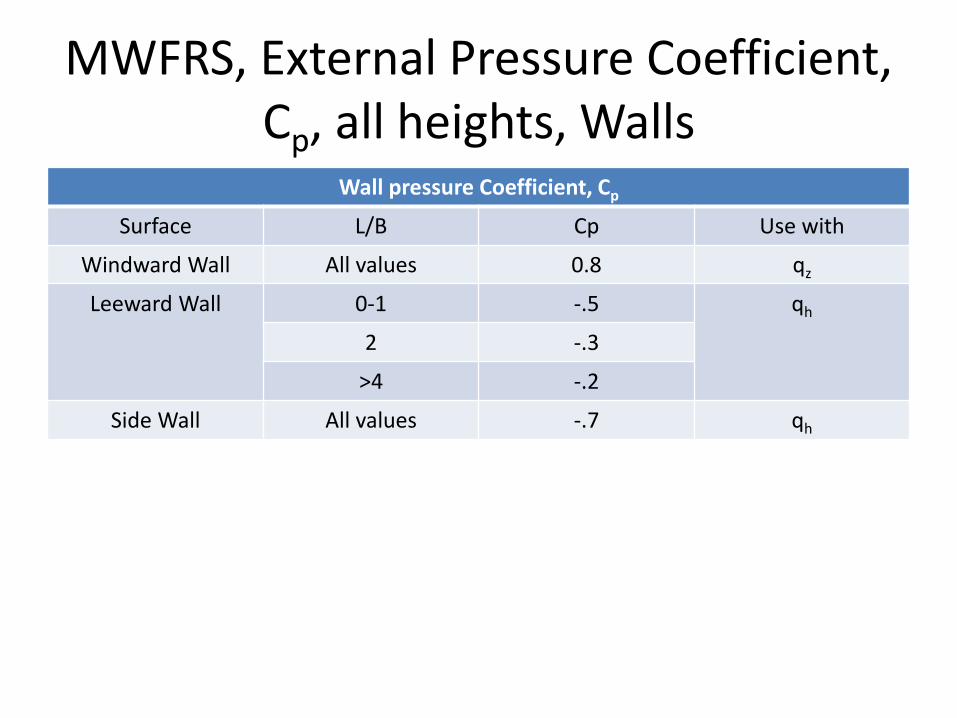
MWFRS, External Pressure Coefficient, Cp, all heights, Walls
Wall pressure Coefficient, Cp
Surface L/B Cp Use with
Windward Wall All values 0.8 qz
Leeward Wall 0-1 -.5 qh
2 -.3
>4 -.2
Side Wall All values -.7 qh
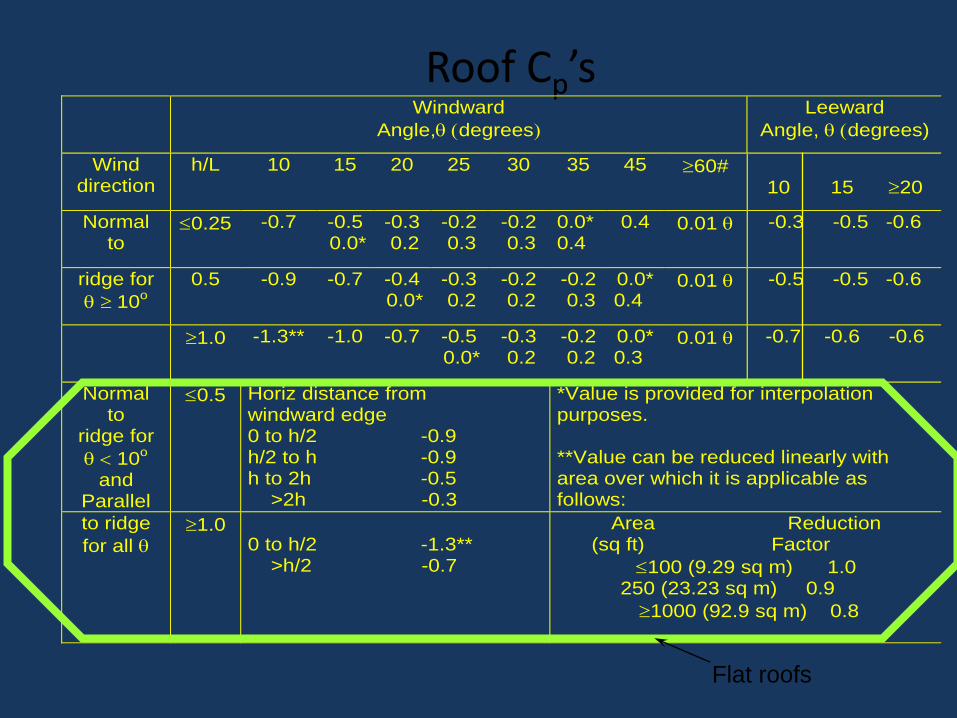
Roof Cp’s Windward
Angle, degrees
Leeward
Angle, degrees)
Wind direction
h/L 10 15 20 25 30 35 45 60#
10 15 20
Normal to
0.25 -0.7 -0.5 0.0*
-0.3 0.2
-0.2 0.3
-0.2 0.3
0.0*0.4
0.4 0.01 -0.3 -0.5 -0.6
ridge for
10o
0.5 -0.9 -0.7 -0.4 0.0*
-0.3 0.2
-0.2 0.2
-0.2 0.3
0.0* 0.4
0.01 -0.5 -0.5 -0.6
1.0 -1.3** -1.0 -0.7 -0.5 0.0*
-0.3 0.2
-0.2 0.2
0.0* 0.3
0.01 -0.7 -0.6 -0.6
Normal to
ridge for
10o
and Parallel
0.5 Horiz distance from windward edge 0 to h/2 -0.9 h/2 to h -0.9 h to 2h -0.5 >2h -0.3
*Value is provided for interpolation purposes. **Value can be reduced linearly with area over which it is applicable as follows:
to ridge
for all
1.0 0 to h/2 -1.3** >h/2 -0.7
Area Reduction (sq ft) Factor
100 (9.29 sq m) 1.0 250 (23.23 sq m) 0.9
1000 (92.9 sq m) 0.8
Flat roofs
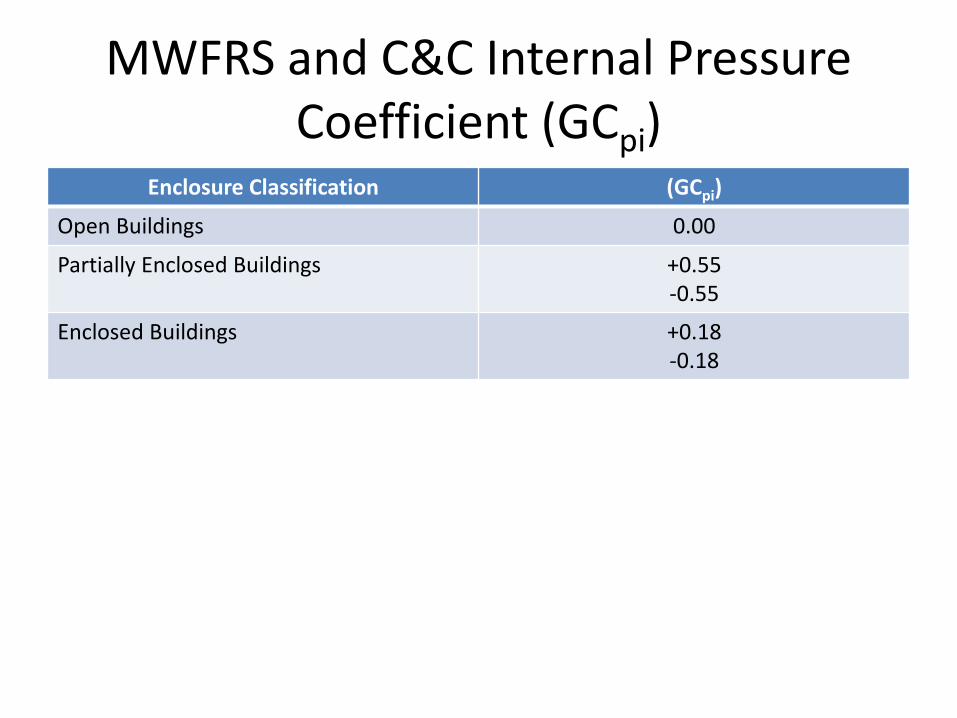
MWFRS and C&C Internal Pressure Coefficient (GCpi)
Enclosure Classification (GCpi)
Open Buildings 0.00
Partially Enclosed Buildings +0.55 -0.55
Enclosed Buildings +0.18 -0.18
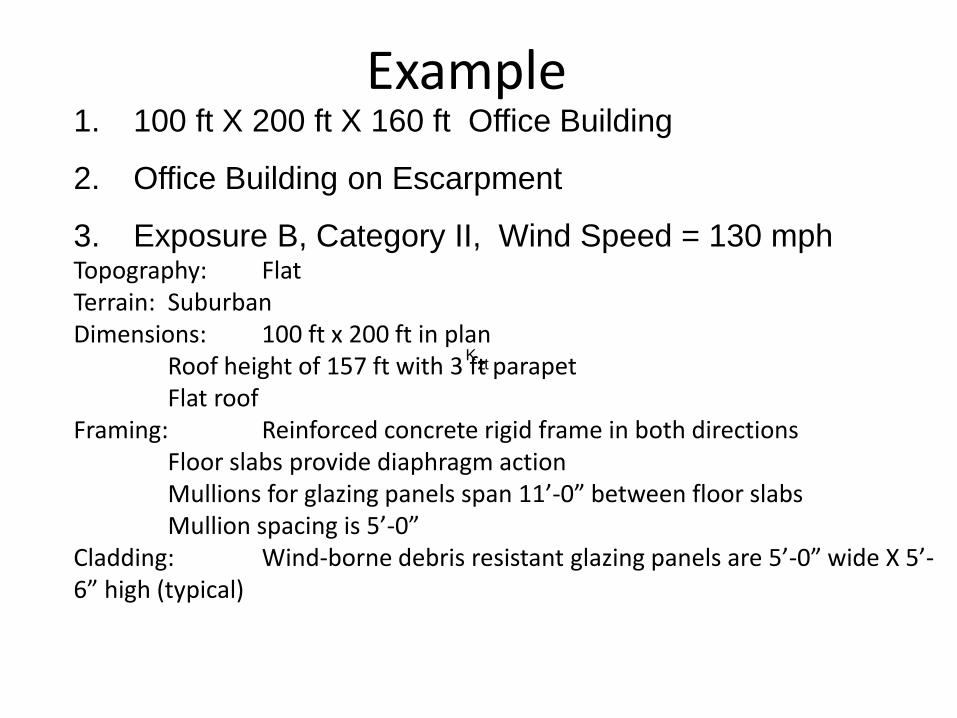
Example 1. 100 ft X 200 ft X 160 ft Office Building
2. Office Building on Escarpment
3. Exposure B, Category II, Wind Speed = 130 mph Topography: Flat Terrain: Suburban Dimensions: 100 ft x 200 ft in plan Roof height of 157 ft with 3 ft parapet Flat roof Framing: Reinforced concrete rigid frame in both directions Floor slabs provide diaphragm action Mullions for glazing panels span 11’-0” between floor slabs Mullion spacing is 5’-0” Cladding: Wind-borne debris resistant glazing panels are 5’-0” wide X 5’-6” high (typical)
ztK
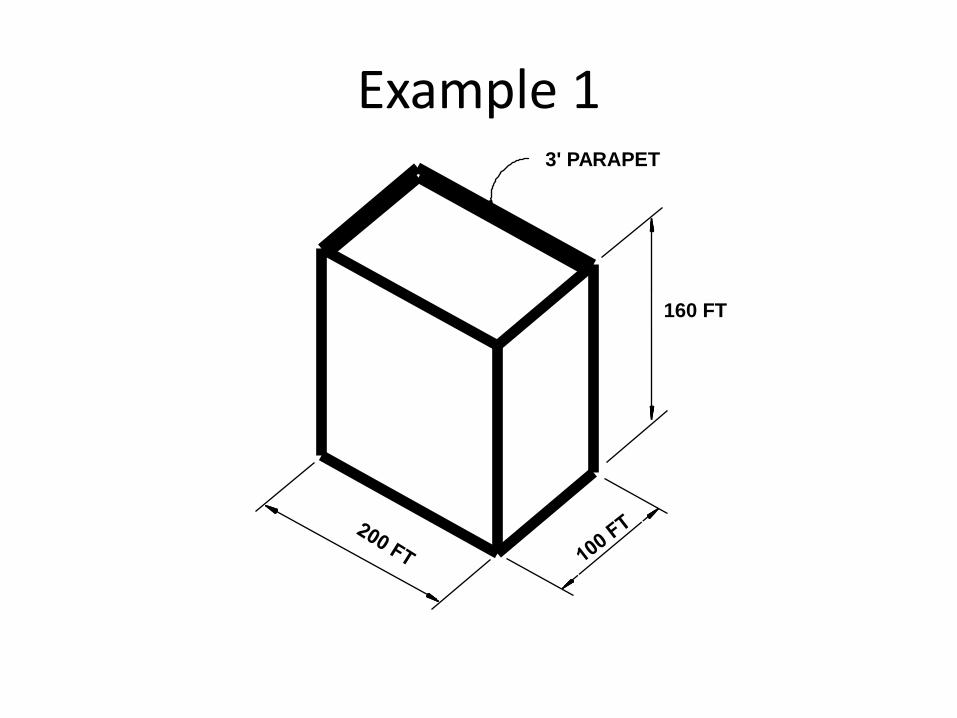
Example 1
160 FT
3' PARAPET
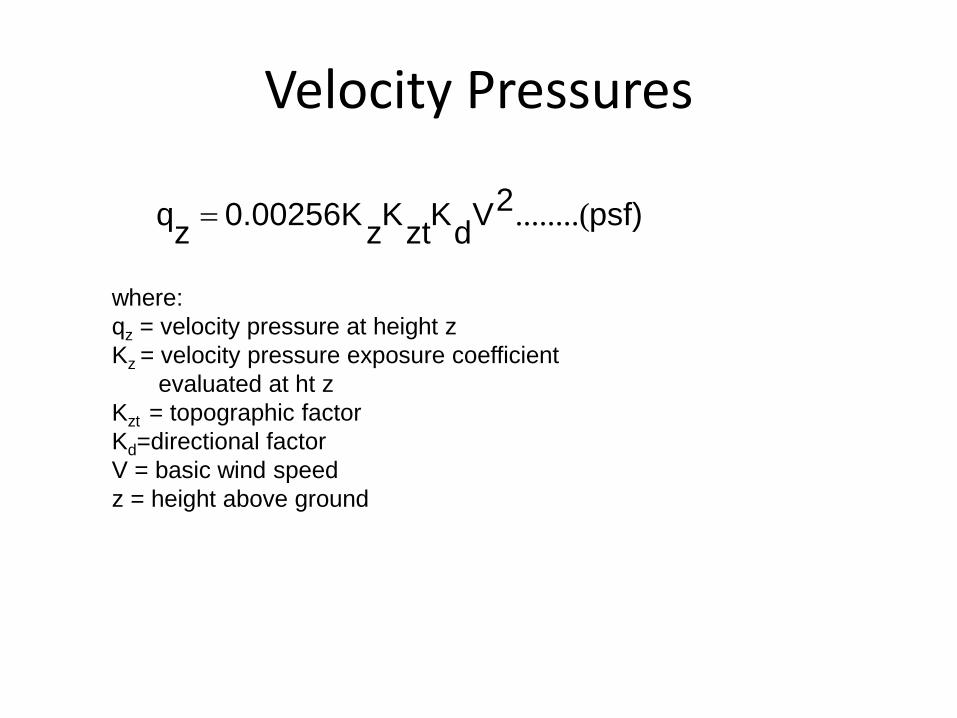
Velocity Pressures
psf)2Vd
Kzt
Kz
0.00256Kz
q ........(
where:
qz = velocity pressure at height z
Kz = velocity pressure exposure coefficient
evaluated at ht z
Kzt = topographic factor
Kd=directional factor
V = basic wind speed
z = height above ground
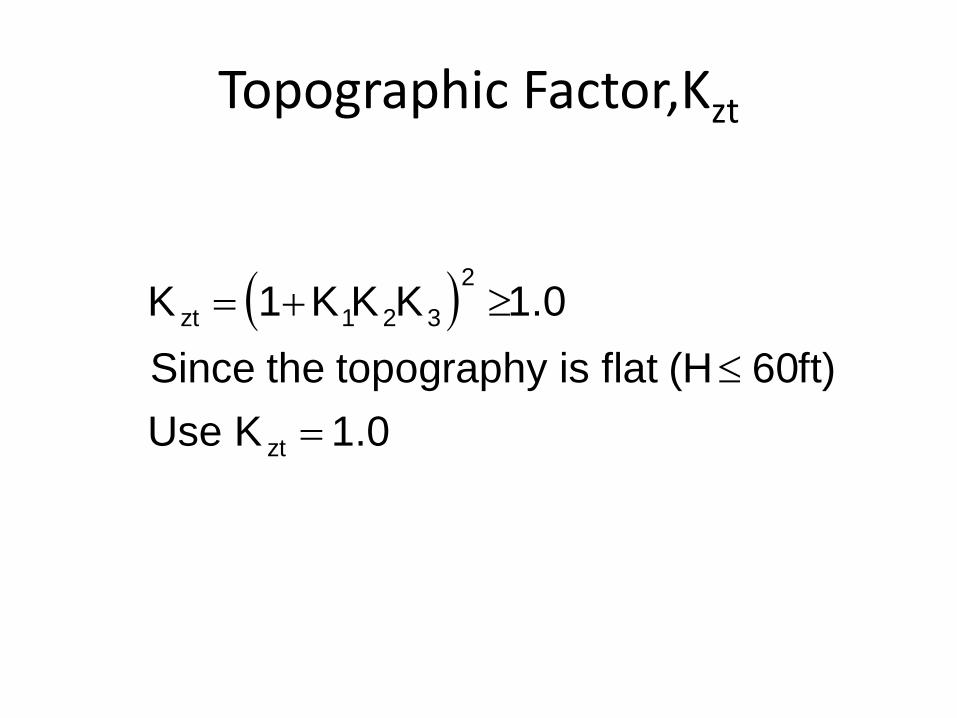
Topographic Factor,Kzt
K 1 K K K 1.0
Since the topography is flat (H 60 ft)
Use K 1.0
zt 1 2 3
2
zt
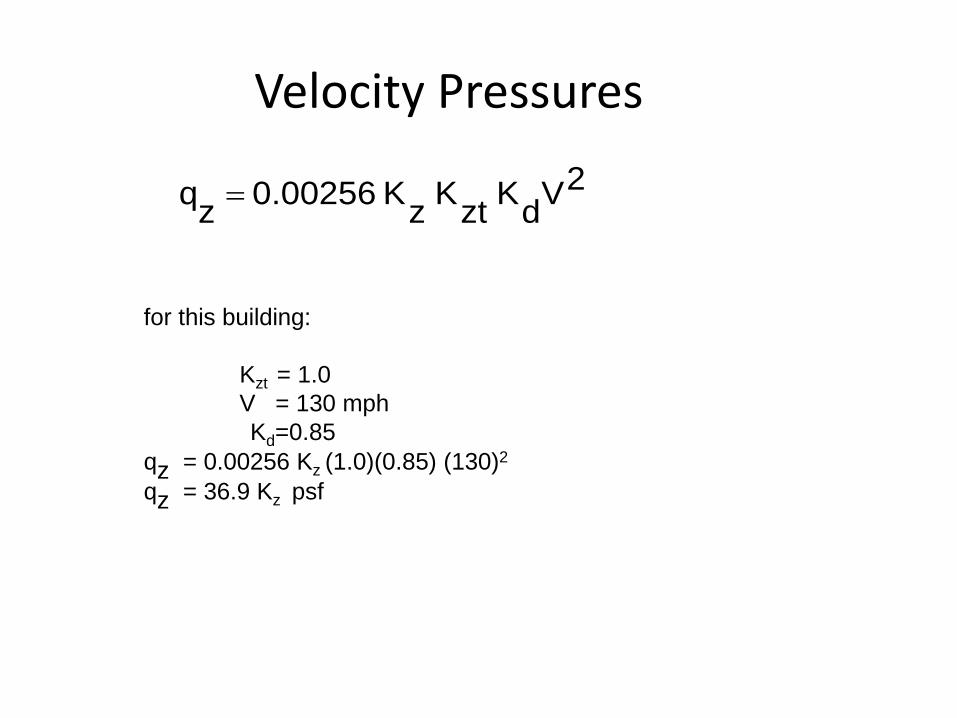
Velocity Pressures
2Vd
K zt
K z
K 0.00256z
q
for this building:
Kzt = 1.0
V = 130 mph
Kd=0.85
qz = 0.00256 Kz (1.0)(0.85) (130)2
qz = 36.9 Kz psf

Step 3: Velocity Pressures
Height, ft Kz qz , psf
0 - 15 0.57 21.0
30 0.70 25.8
50 0.81 29.9
80 0.93 34.3120 1.04 38.3
Parapet ht=160 1.13 41.7
qz = 36.9 Kz psf
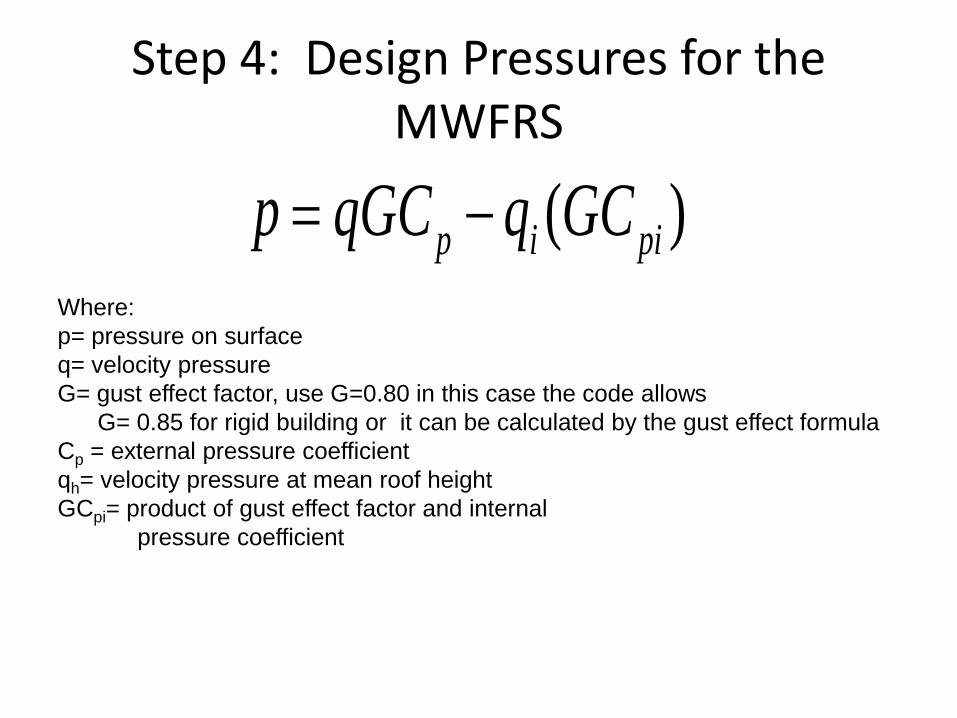
Step 4: Design Pressures for the MWFRS
)( piip GCqqGCp Where:
p= pressure on surface
q= velocity pressure
G= gust effect factor, use G=0.80 in this case the code allows
G= 0.85 for rigid building or it can be calculated by the gust effect formula
Cp = external pressure coefficient
qh= velocity pressure at mean roof height
GCpi= product of gust effect factor and internal
pressure coefficient
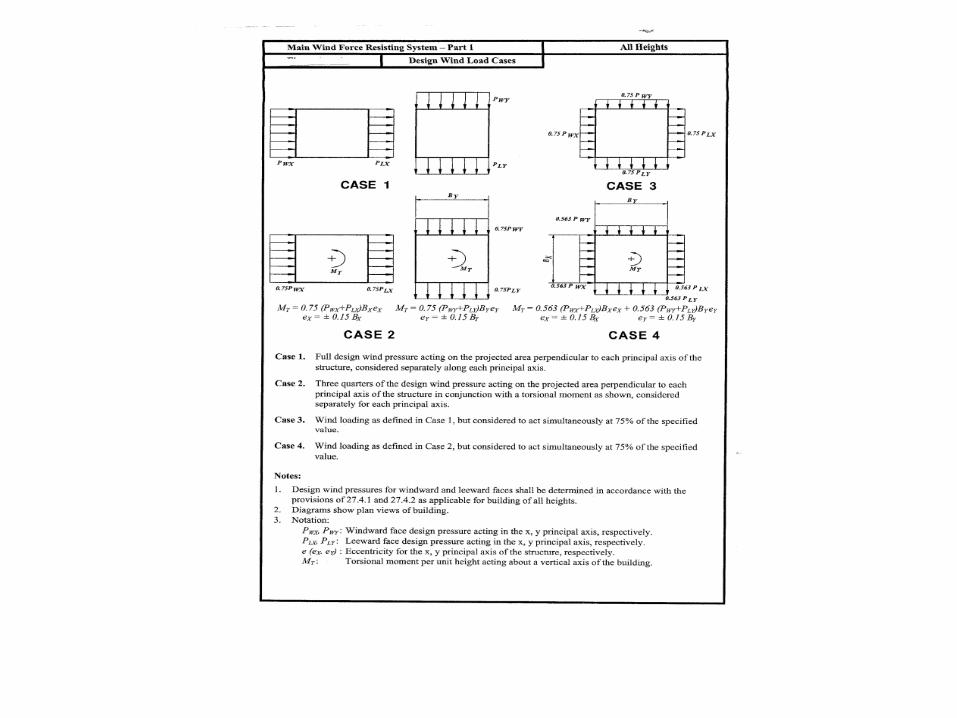
Step 4: Design Cases For MWFRS
• Wind normal to 200 ft face
– Positive and negative internal pressure
• Wind parallel to 200 ft face
– Positive and negative internal pressure
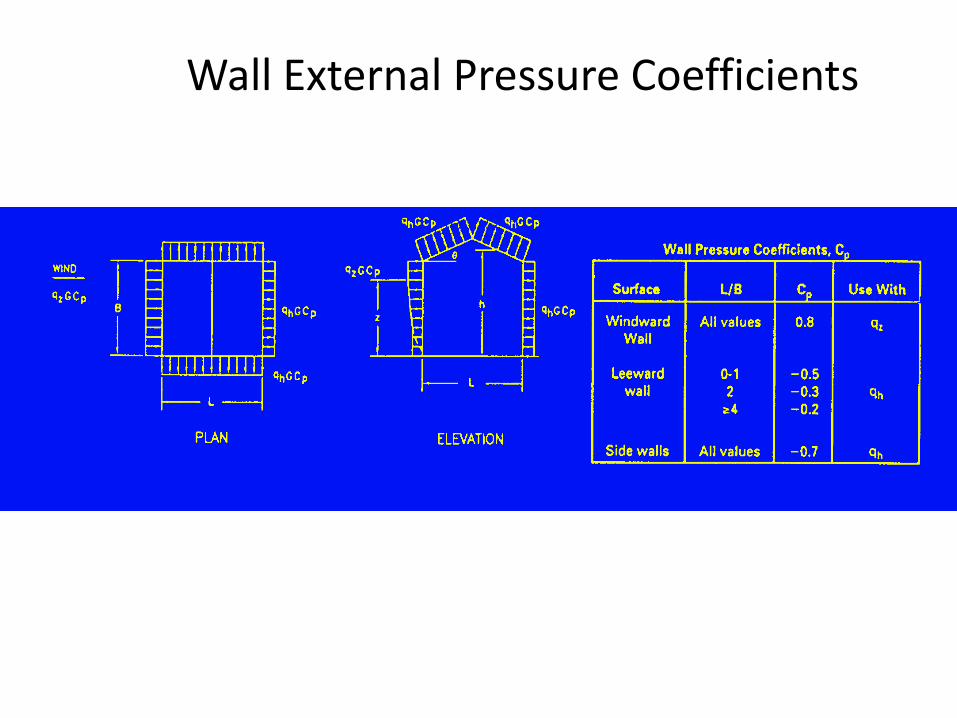
Wall External Pressure Coefficients
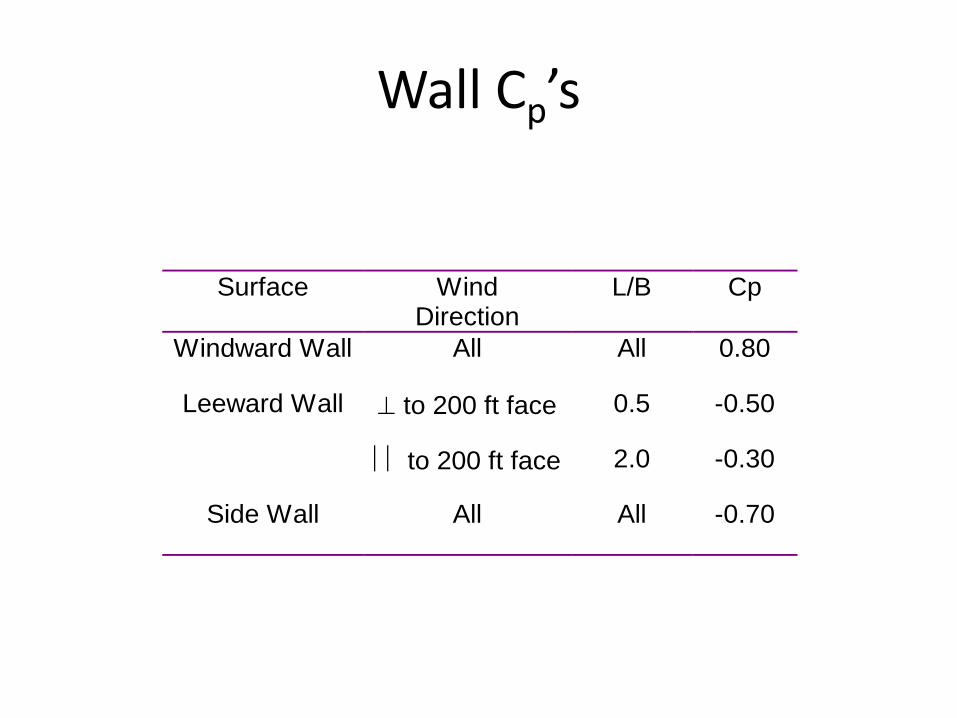
Wall Cp’s
Surface WindDirection
L/B Cp
Windward Wall All All 0.80
Leeward Wall to 200 ft face 0.5 -0.50
to 200 ft face 2.0 -0.30
Side Wall All All -0.70
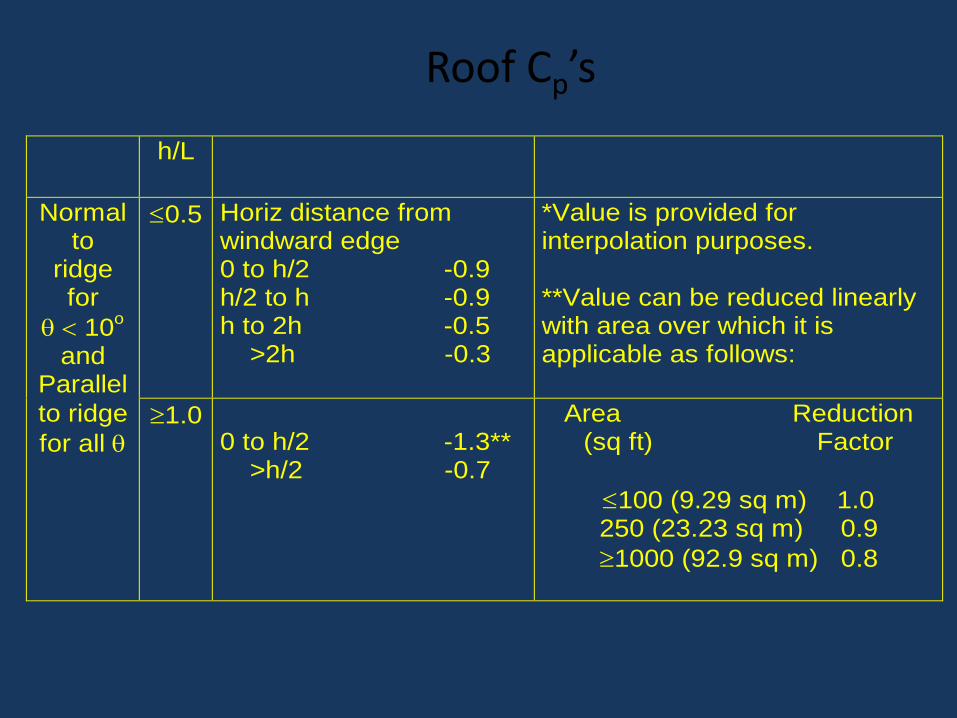
Roof Cp’s
h/L
Normalto
ridgefor
10o
andParallel
0.5 Horiz distance fromwindward edge0 to h/2 -0.9h/2 to h -0.9h to 2h -0.5 >2h -0.3
*Value is provided forinterpolation purposes.
**Value can be reduced linearlywith area over which it isapplicable as follows:
to ridge
for all 1.0
0 to h/2 -1.3** >h/2 -0.7
Area Reduction(sq ft) Factor
100 (9.29 sq m) 1.0250 (23.23 sq m) 0.9
1000 (92.9 sq m) 0.8
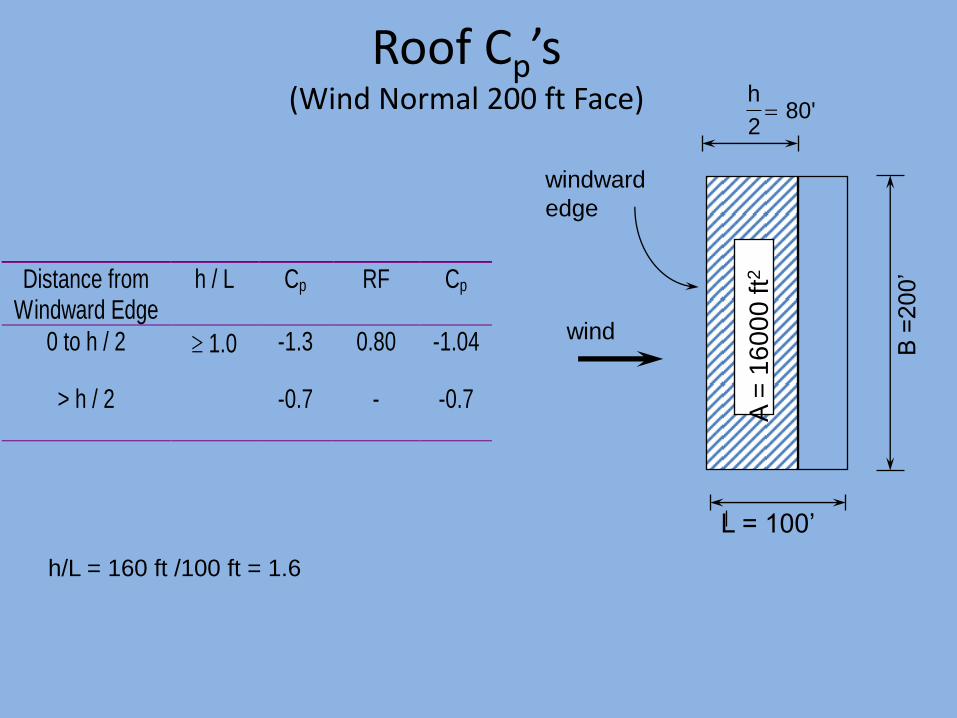
Roof Cp’s (Wind Normal 200 ft Face)
Distance fromWindward Edge
h / L Cp RF Cp
0 to h / 2 1.0 -1.3 0.80 -1.04
> h / 2 -0.7 - -0.7
h/L = 160 ft /100 ft = 1.6
windward
edge
wind
B =
200’
L = 100’
h
2 80'
A =
16
00
0 ft2
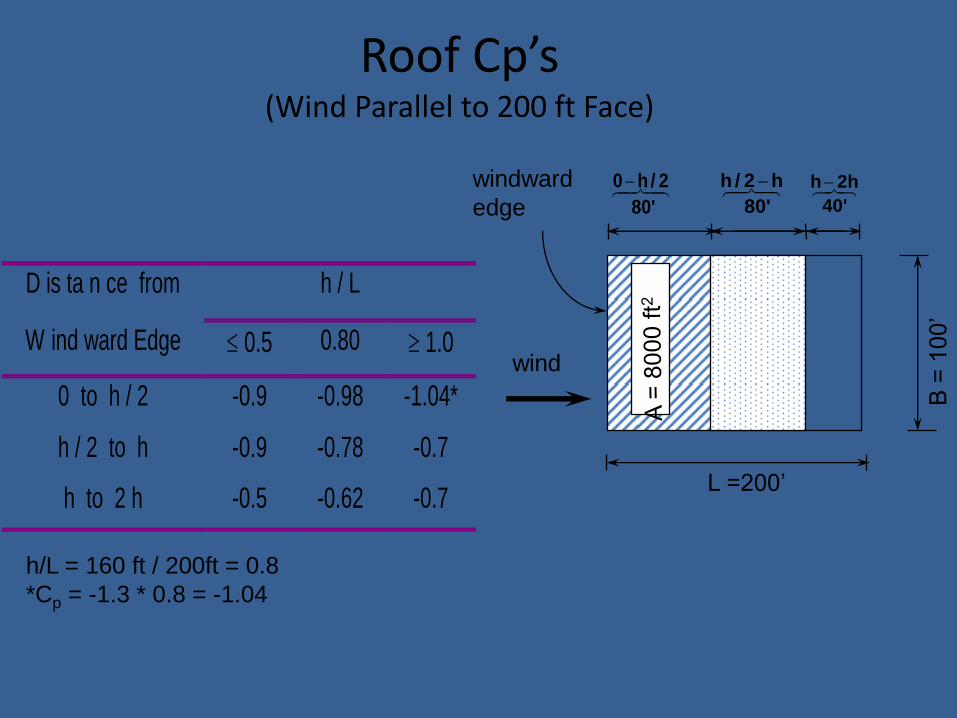
Roof Cp’s (Wind Parallel to 200 ft Face)
D is ta n ce from h / L
W ind ward Edge 0.5 0.80 1.0
0 to h / 2 -0.9 -0.98 -1.04*
h / 2 to h -0.9 -0.78 -0.7
h to 2 h -0.5 -0.62 -0.7
h/L = 160 ft / 200ft = 0.8
*Cp = -1.3 * 0.8 = -1.04
windward
edge
B =
100’
L =200’
80'
0 h / 2 80'
h / 2 h 40'
h 2h
wind
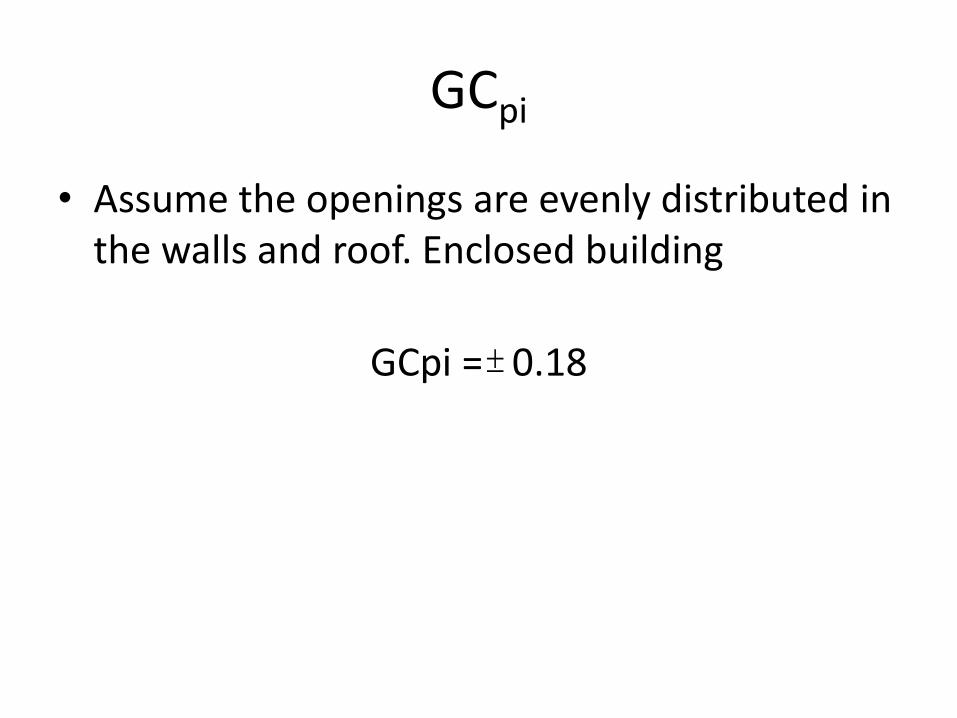
GCpi
• Assume the openings are evenly distributed in the walls and roof. Enclosed building
GCpi = 0.18
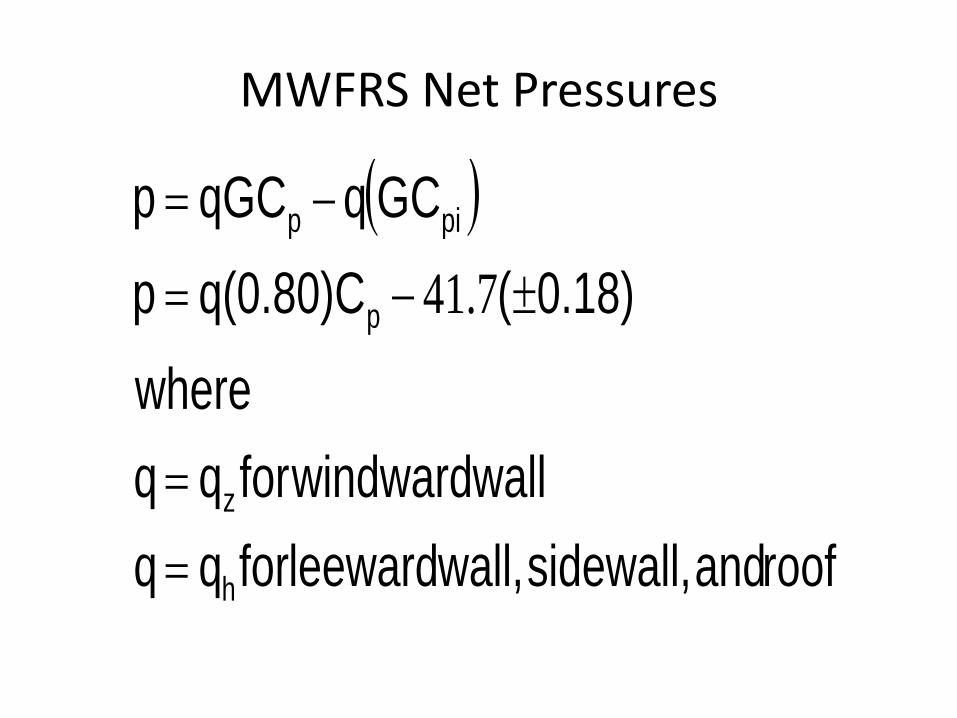
MWFRS Net Pressures
roofandsidewall,wall,leewardforqq
wallwindwardforqq
where
0.18)(q(0.80)Cp
GCqqGCp
h
z
p
pip
7.41
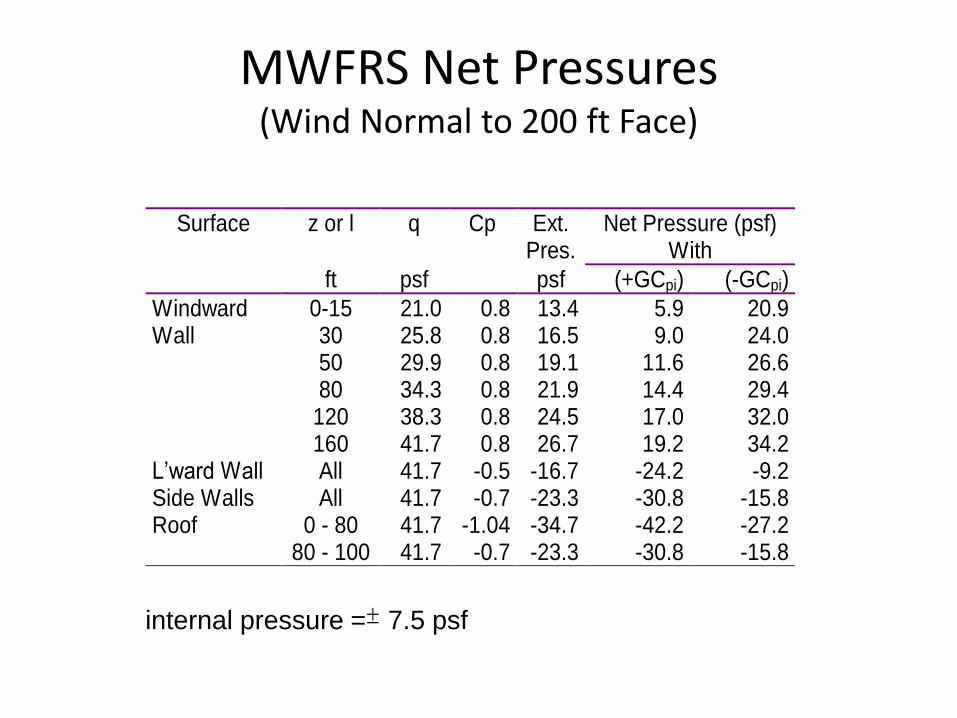
MWFRS Net Pressures (Wind Normal to 200 ft Face)
Surface z or l q Cp Ext.Pres.
Net Pressure (psf)With
ft psf psf (+GCpi) (-GCpi)
Windward 0-15 21.0 0.8 13.4 5.9 20.9Wall 30 25.8 0.8 16.5 9.0 24.0
50 29.9 0.8 19.1 11.6 26.680 34.3 0.8 21.9 14.4 29.4
120 38.3 0.8 24.5 17.0 32.0160 41.7 0.8 26.7 19.2 34.2
L’ward Wall All 41.7 -0.5 -16.7 -24.2 -9.2Side Walls All 41.7 -0.7 -23.3 -30.8 -15.8Roof 0 - 80 41.7 -1.04 -34.7 -42.2 -27.2
80 - 100 41.7 -0.7 -23.3 -30.8 -15.8
internal pressure = 7.5 psf
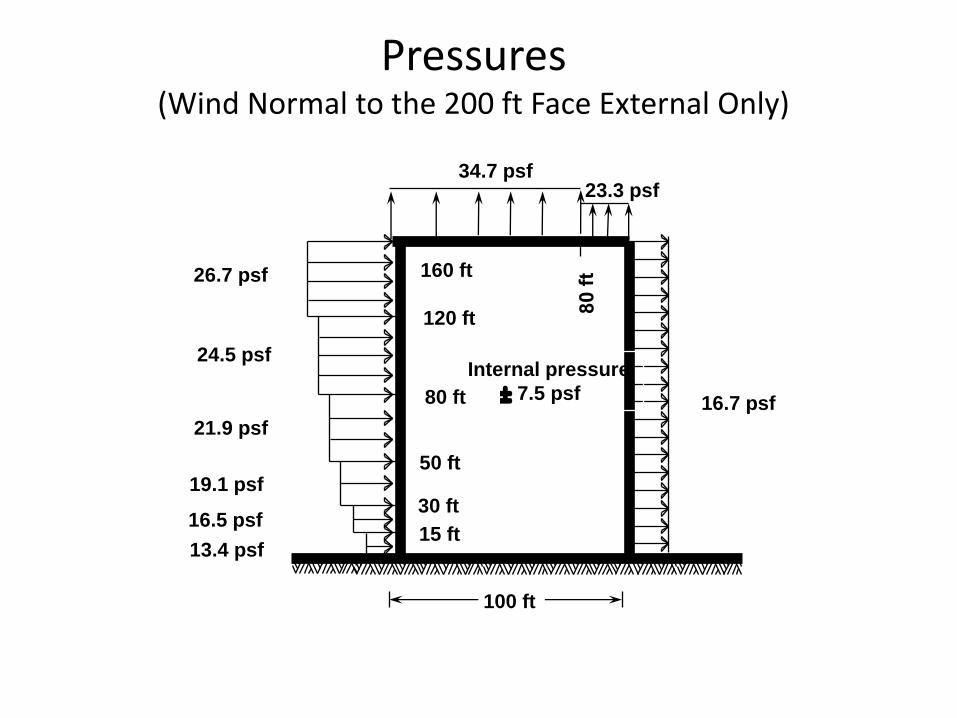
Pressures (Wind Normal to the 200 ft Face External Only)
100 ft
120 ft
50 ft
30 ft
15 ft
26.7 psf
24.5 psf
21.9 psf
19.1 psf
16.5 psf
13.4 psf
160 ft
16.7 psf 80 ft
34.7 psf 23.3 psf
Internal pressure
7.5 psf
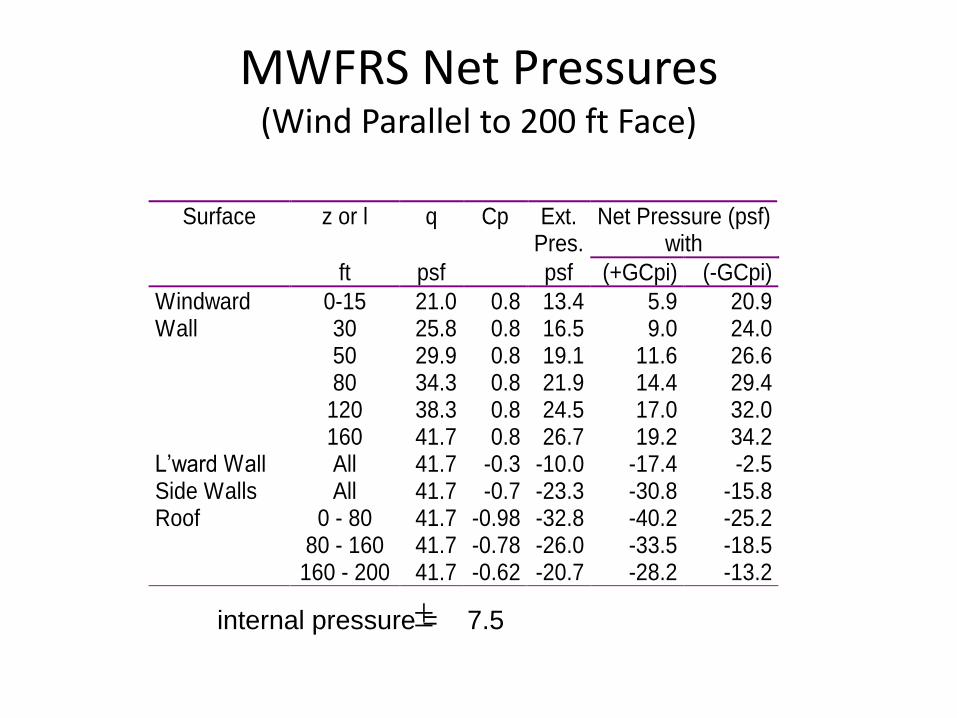
MWFRS Net Pressures (Wind Parallel to 200 ft Face)
Surface z or l q Cp Ext.Pres.
Net Pressure (psf)with
ft psf psf (+GCpi) (-GCpi)
Windward 0-15 21.0 0.8 13.4 5.9 20.9Wall 30 25.8 0.8 16.5 9.0 24.0
50 29.9 0.8 19.1 11.6 26.680 34.3 0.8 21.9 14.4 29.4
120 38.3 0.8 24.5 17.0 32.0160 41.7 0.8 26.7 19.2 34.2
L’ward Wall All 41.7 -0.3 -10.0 -17.4 -2.5Side Walls All 41.7 -0.7 -23.3 -30.8 -15.8Roof 0 - 80 41.7 -0.98 -32.8 -40.2 -25.2
80 - 160 41.7 -0.78 -26.0 -33.5 -18.5160 - 200 41.7 -0.62 -20.7 -28.2 -13.2
internal pressure = 7.5
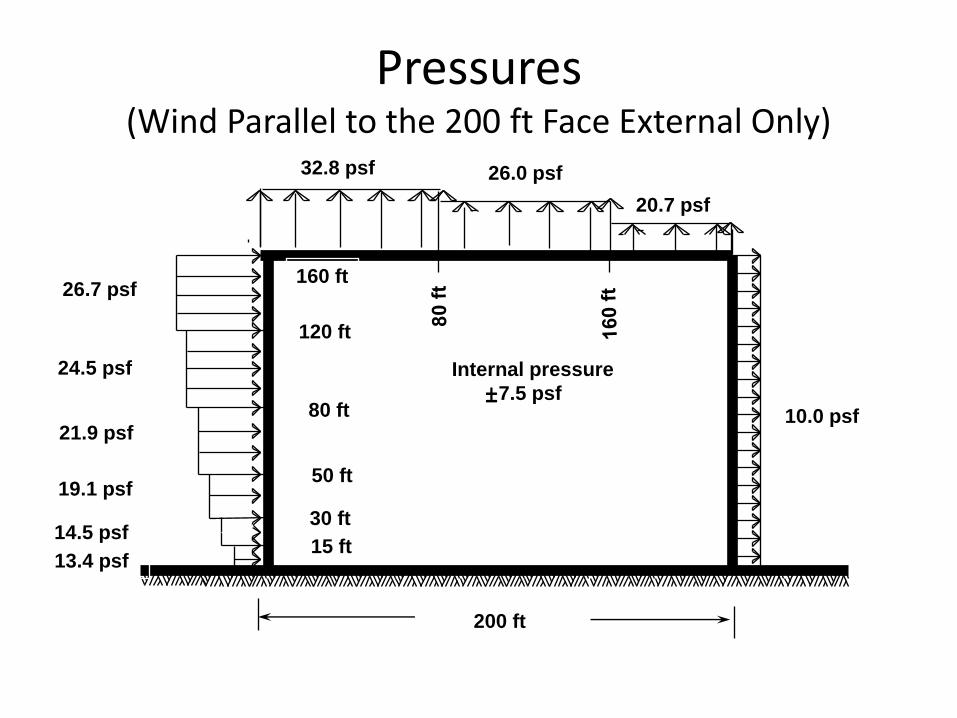
Pressures (Wind Parallel to the 200 ft Face External Only)
120 ft
50 ft
30 ft
15 ft
26.7 psf
24.5 psf
21.9 psf
19.1 psf
14.5 psf
13.4 psf
80 ft
160 ft
10.0 psf
32.8 psf 26.0 psf
20.7 psf
200 ft
Internal pressure
7.5 psf
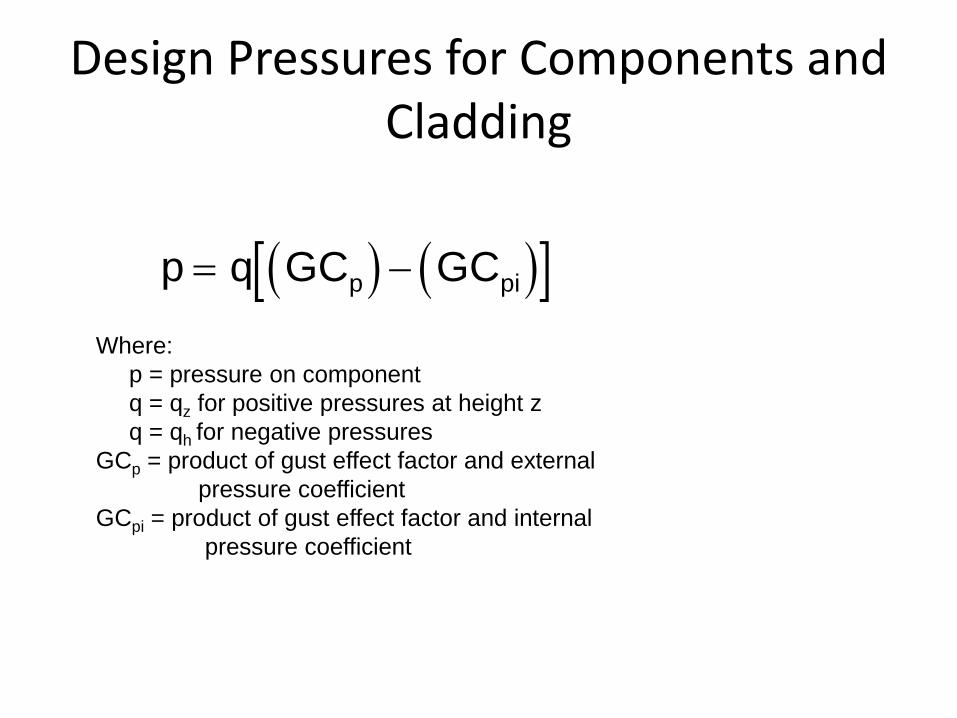
Design Pressures for Components and Cladding
p q GC GCp pi
Where:
p = pressure on component
q = qz for positive pressures at height z
q = qh for negative pressures
GCp = product of gust effect factor and external
pressure coefficient
GCpi = product of gust effect factor and internal
pressure coefficient
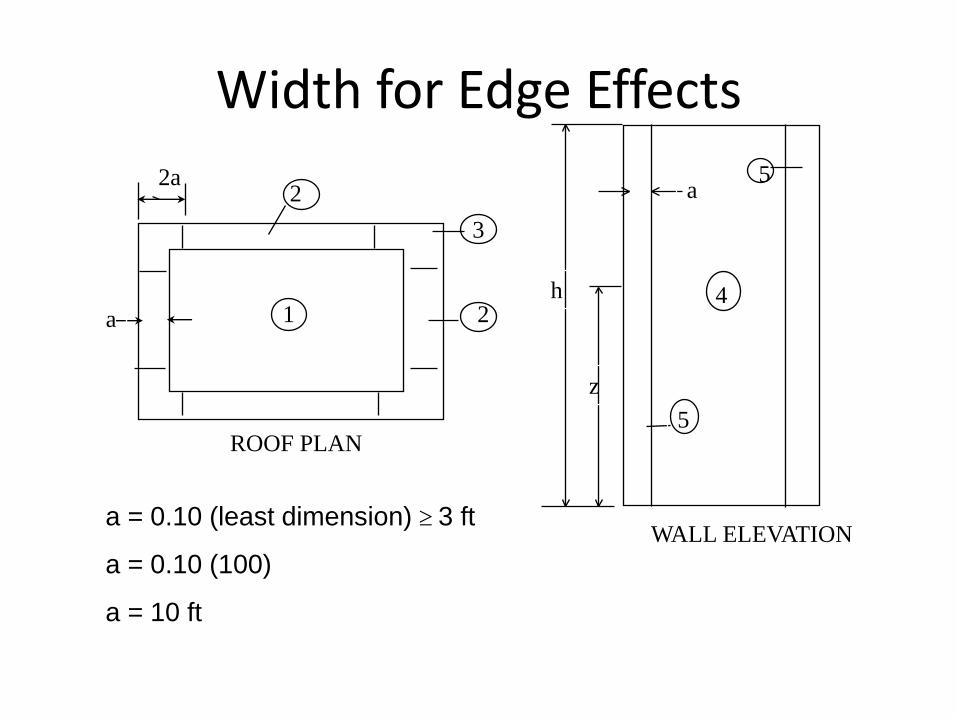
Width for Edge Effects
2 2a
a 1 2
3
h
z
a
5
5
4
ROOF PLAN
WALL ELEVATION a = 0.10 (least dimension) 3 ft
a = 0.10 (100)
a = 10 ft
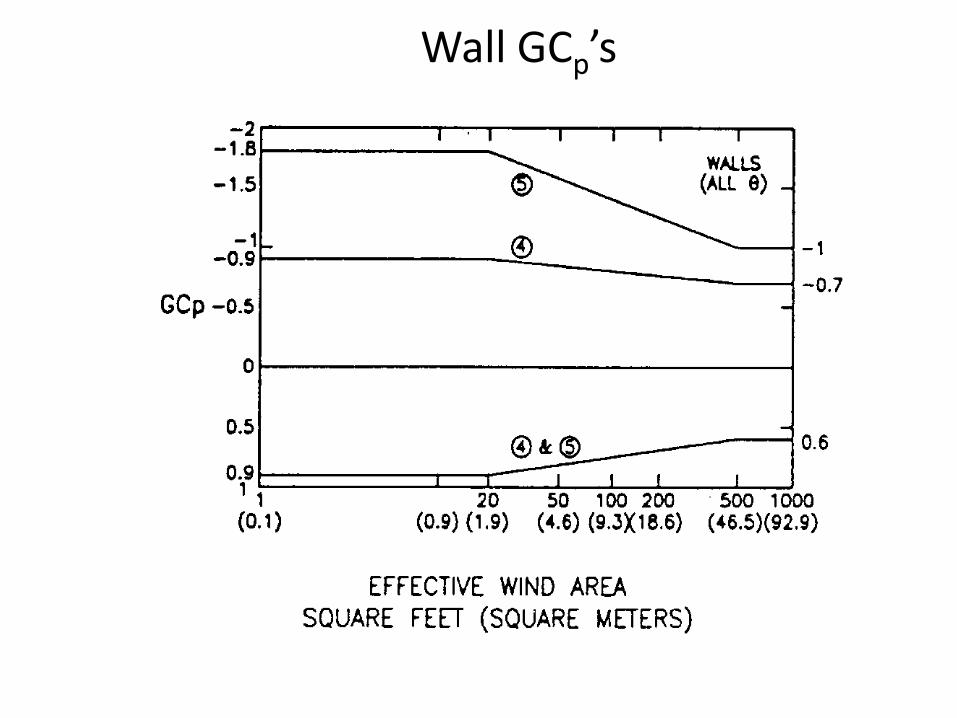
Wall GCp’s
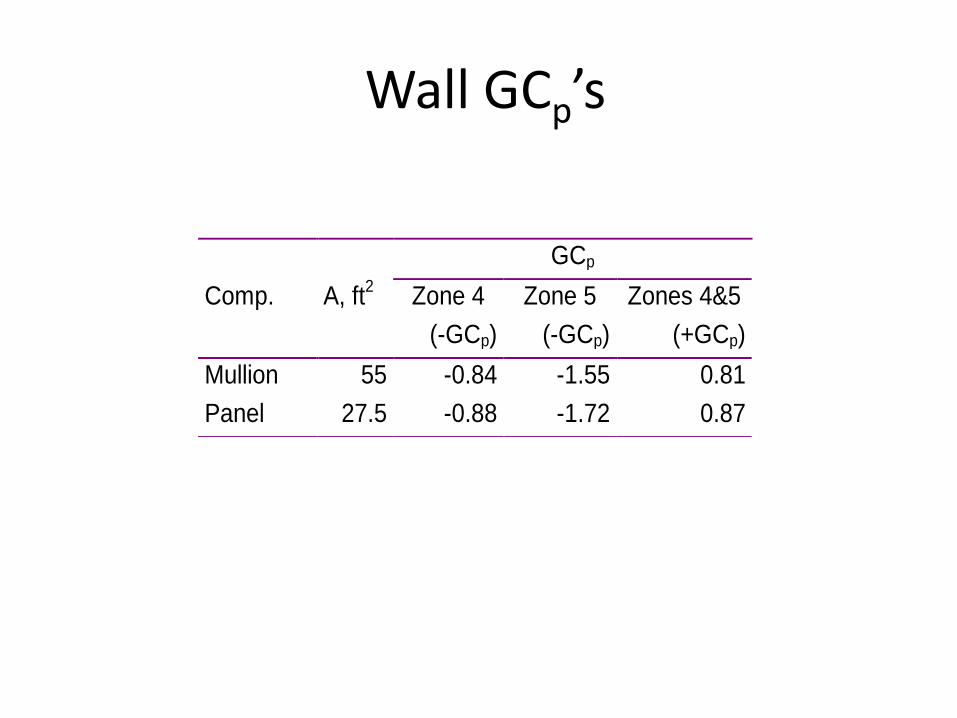
Wall GCp’s
GCp
Comp. A, ft2
Zone 4 Zone 5 Zones 4&5
(-GCp) (-GCp) (+GCp)
Mullion 55 -0.84 -1.55 0.81
Panel 27.5 -0.88 -1.72 0.87
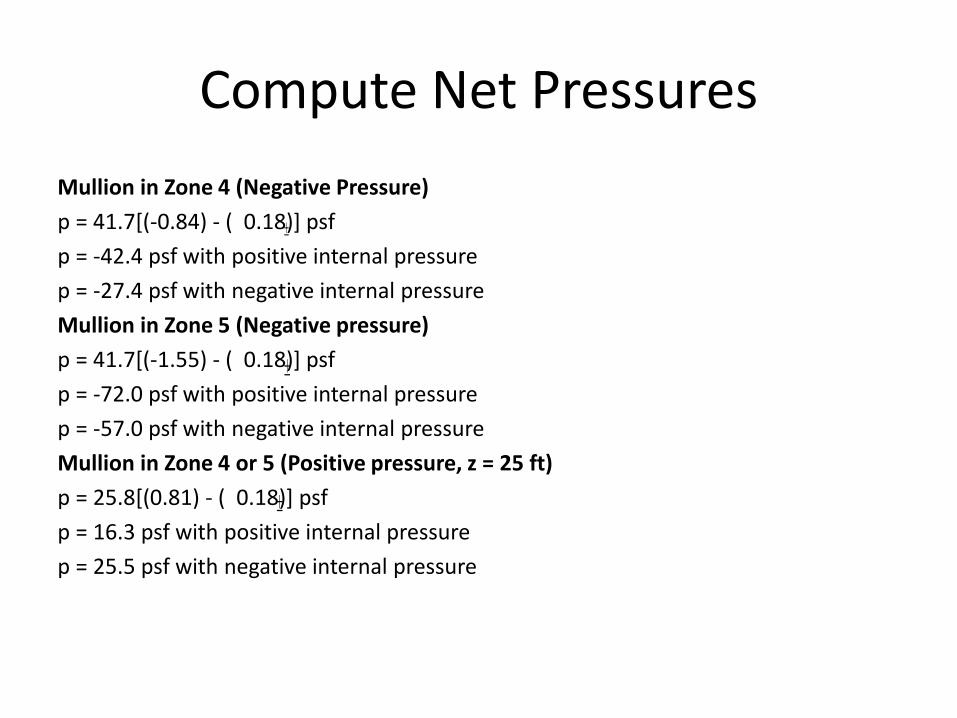
Compute Net Pressures
Mullion in Zone 4 (Negative Pressure)
p = 41.7[(-0.84) - ( 0.18)] psf
p = -42.4 psf with positive internal pressure
p = -27.4 psf with negative internal pressure
Mullion in Zone 5 (Negative pressure)
p = 41.7[(-1.55) - ( 0.18)] psf
p = -72.0 psf with positive internal pressure
p = -57.0 psf with negative internal pressure
Mullion in Zone 4 or 5 (Positive pressure, z = 25 ft)
p = 25.8[(0.81) - ( 0.18)] psf
p = 16.3 psf with positive internal pressure
p = 25.5 psf with negative internal pressure
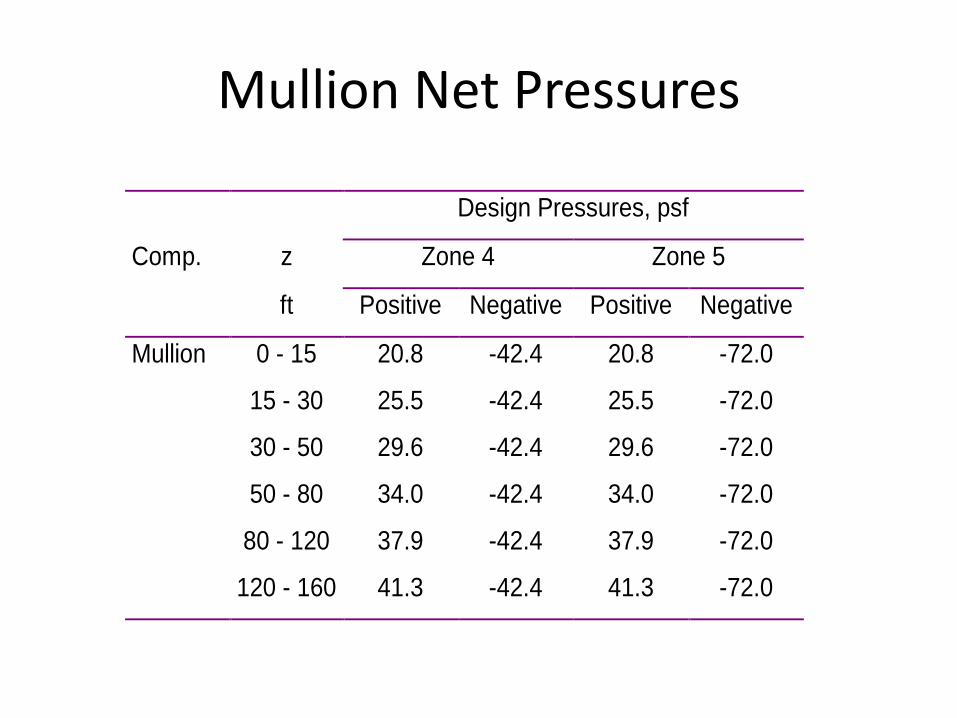
Mullion Net Pressures
Design Pressures, psf
Comp. z Zone 4 Zone 5
ft Positive Negative Positive Negative
Mullion 0 - 15 20.8 -42.4 20.8 -72.0
15 - 30 25.5 -42.4 25.5 -72.0
30 - 50 29.6 -42.4 29.6 -72.0
50 - 80 34.0 -42.4 34.0 -72.0
80 - 120 37.9 -42.4 37.9 -72.0
120 - 160 41.3 -42.4 41.3 -72.0
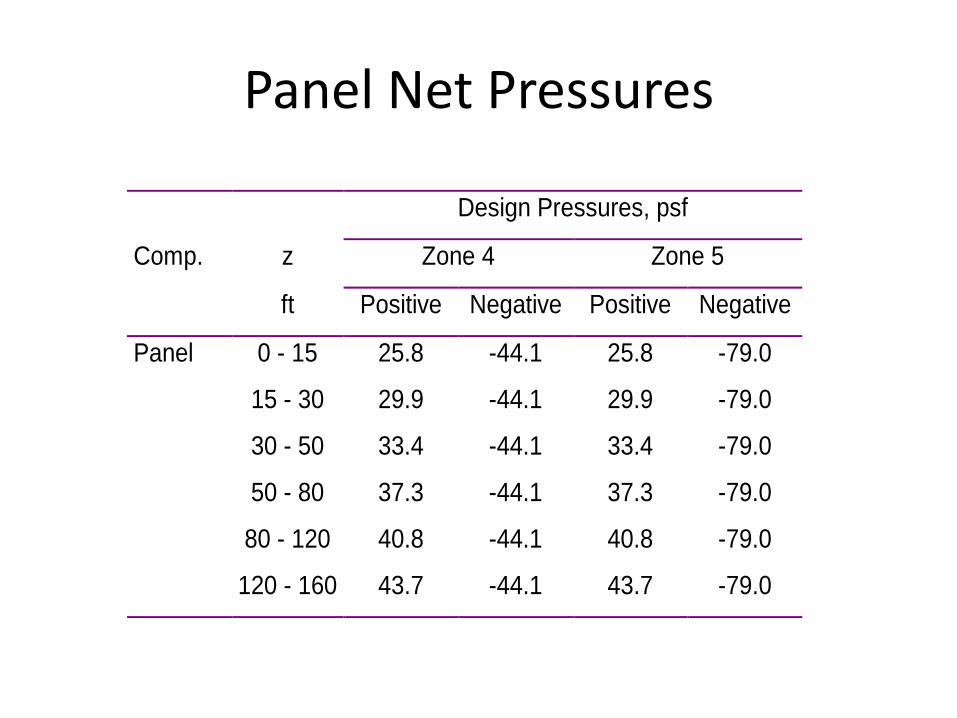
Panel Net Pressures
Design Pressures, psf
Comp. z Zone 4 Zone 5
ft Positive Negative Positive Negative
Panel 0 - 15 25.8 -44.1 25.8 -79.0
15 - 30 29.9 -44.1 29.9 -79.0
30 - 50 33.4 -44.1 33.4 -79.0
50 - 80 37.3 -44.1 37.3 -79.0
80 - 120 40.8 -44.1 40.8 -79.0
120 - 160 43.7 -44.1 43.7 -79.0

Roof GCp
Figure 6-8
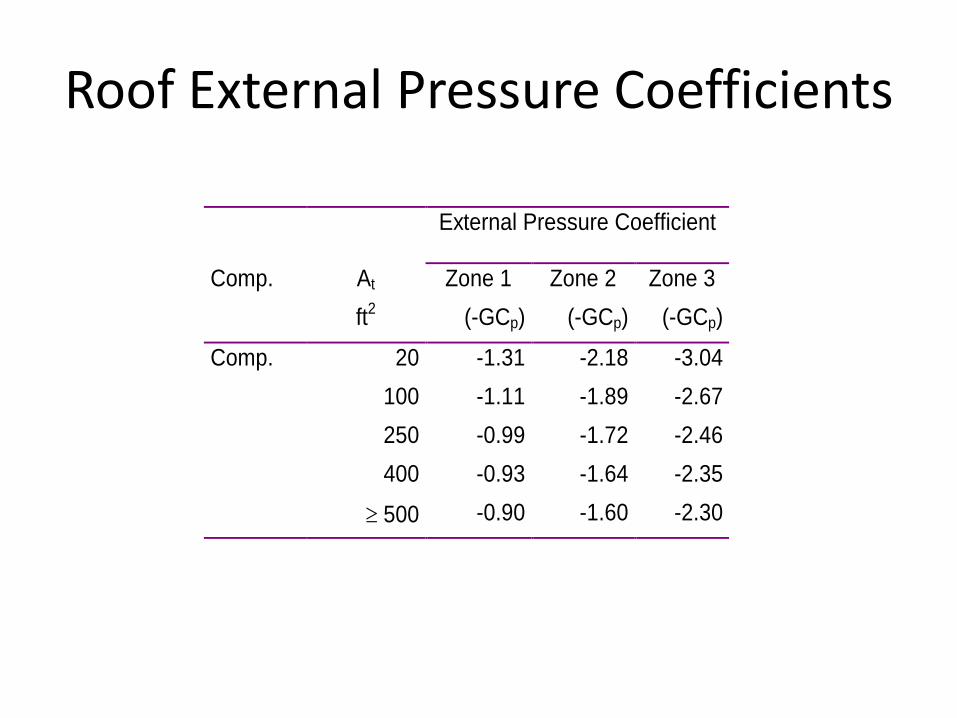
Roof External Pressure Coefficients
External Pressure Coefficient
Comp. At Zone 1 Zone 2 Zone 3
ft2 (-GCp) (-GCp) (-GCp)
Comp. 20 -1.31 -2.18 -3.04
100 -1.11 -1.89 -2.67
250 -0.99 -1.72 -2.46
400 -0.93 -1.64 -2.35
500 -0.90 -1.60 -2.30
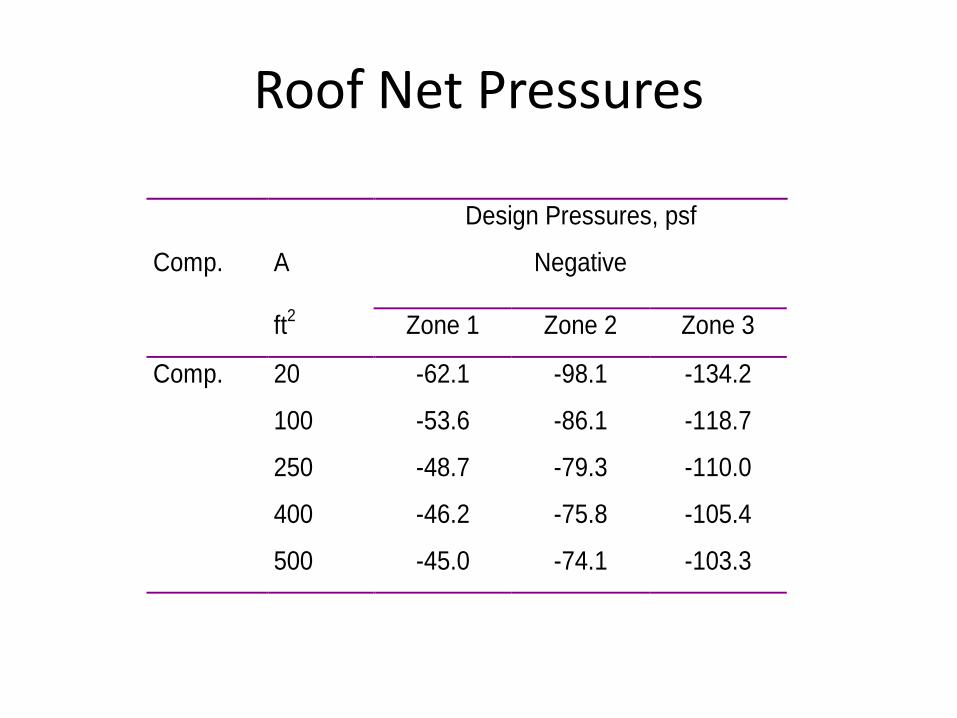
Roof Net Pressures
Design Pressures, psf
Comp. A Negative
ft2
Zone 1 Zone 2 Zone 3
Comp. 20 -62.1 -98.1 -134.2
100 -53.6 -86.1 -118.7
250 -48.7 -79.3 -110.0
400 -46.2 -75.8 -105.4
500 -45.0 -74.1 -103.3

HURRICANES
AND
TORNADOES
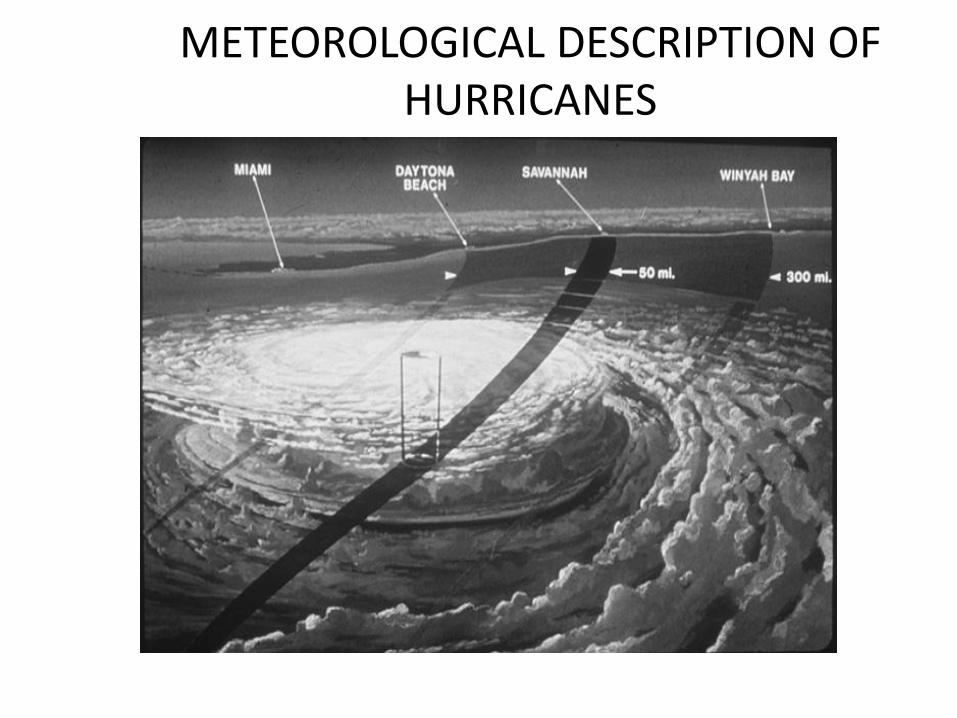
METEOROLOGICAL DESCRIPTION OF HURRICANES
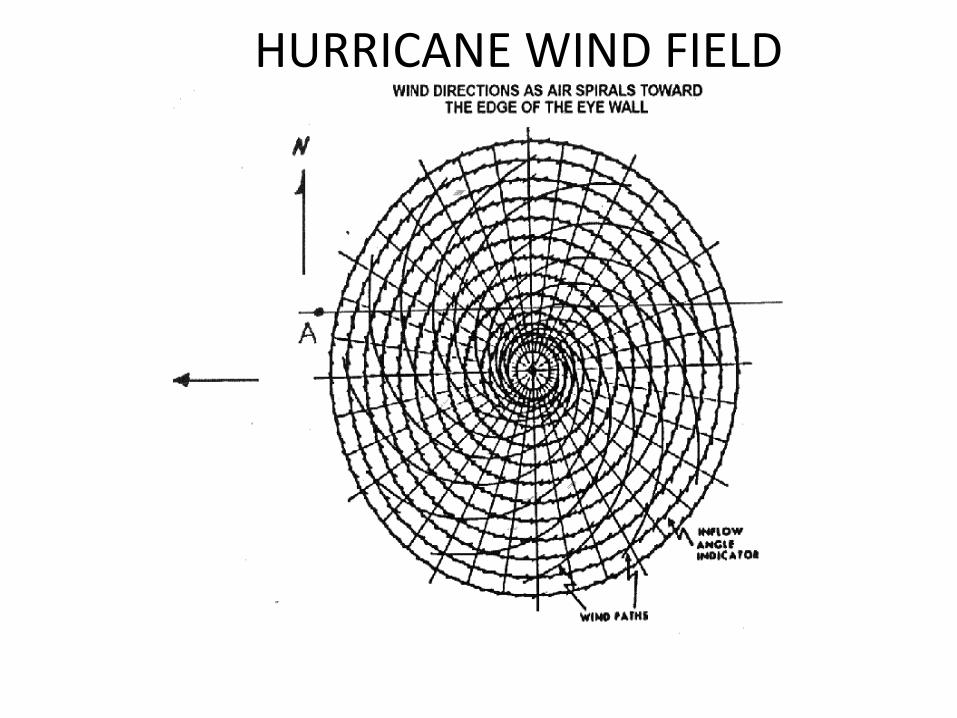
HURRICANE WIND FIELD
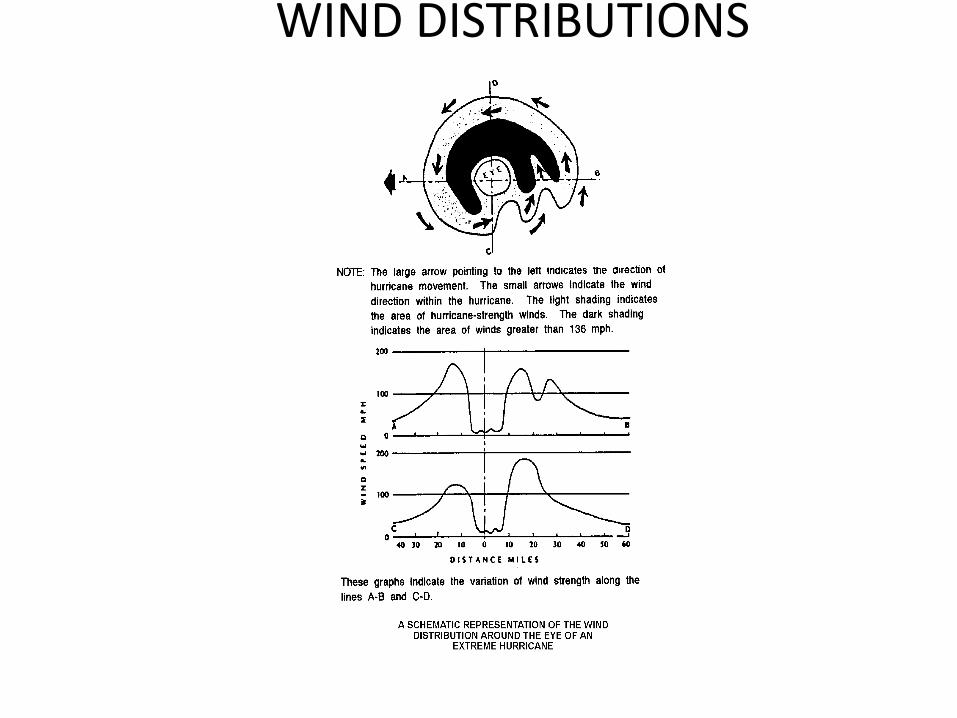
WIND DISTRIBUTIONS
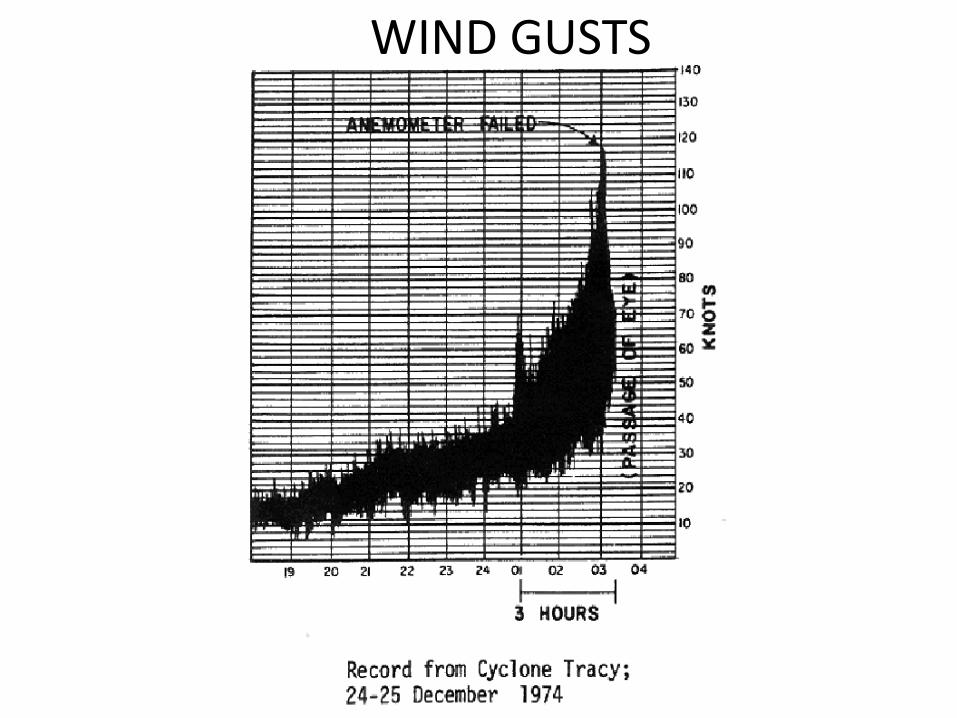
WIND GUSTS

HURRICANE RELATED PHENOMENA
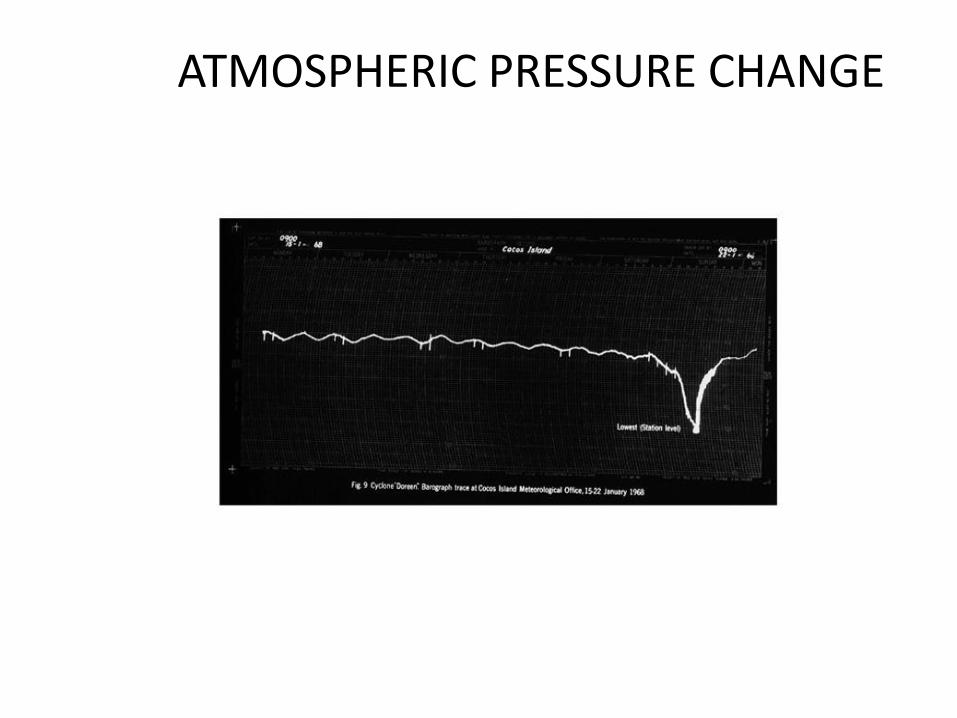
ATMOSPHERIC PRESSURE CHANGE
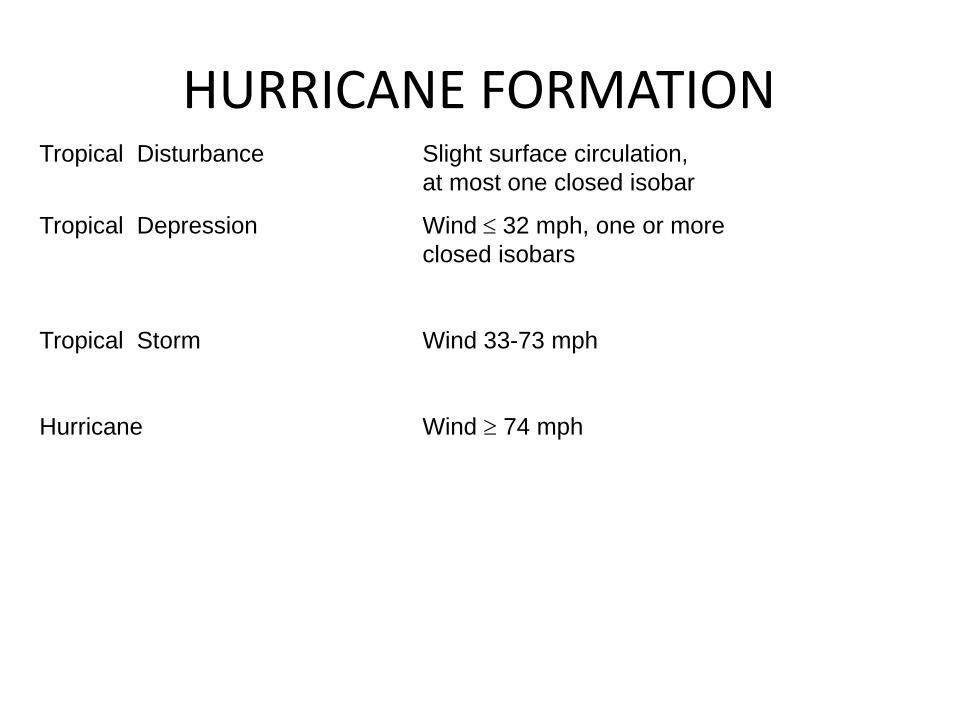
HURRICANE FORMATION Tropical Disturbance Slight surface circulation,
at most one closed isobar
Tropical Depression Wind 32 mph, one or more
closed isobars
Tropical Storm Wind 33-73 mph
Hurricane Wind 74 mph
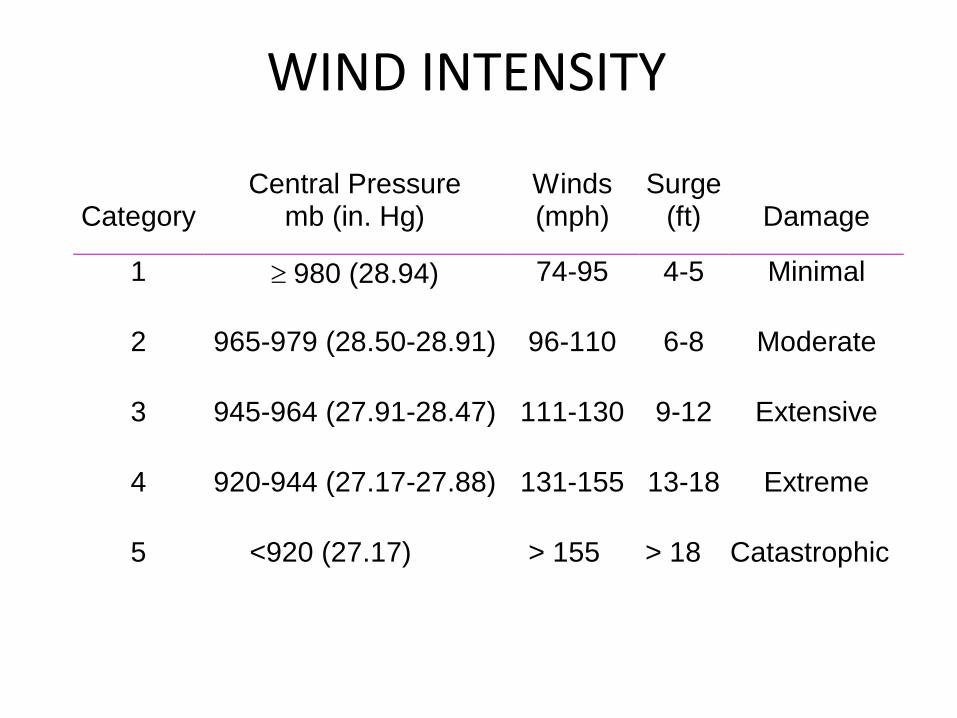
WIND INTENSITY
CategoryCentral Pressure
mb (in. Hg)Winds(mph)
Surge(ft) Damage
1 980 (28.94) 74-95 4-5 Minimal
2 965-979 (28.50-28.91) 96-110 6-8 Moderate
3 945-964 (27.91-28.47) 111-130 9-12 Extensive
4 920-944 (27.17-27.88) 131-155 13-18 Extreme
5 <920 (27.17) > 155 > 18 Catastrophic
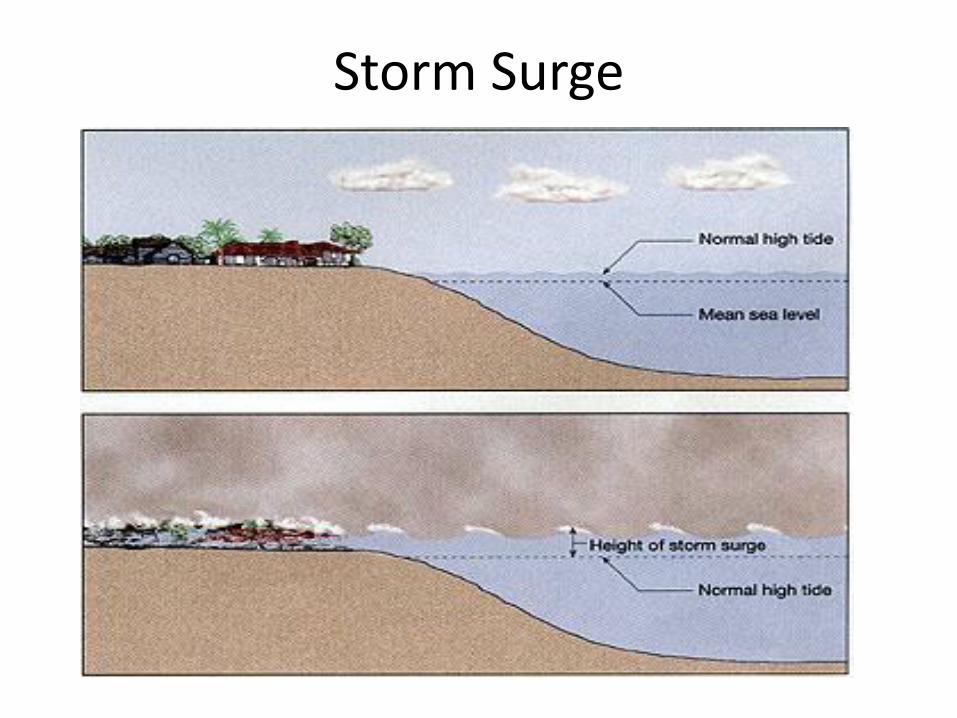
Storm Surge
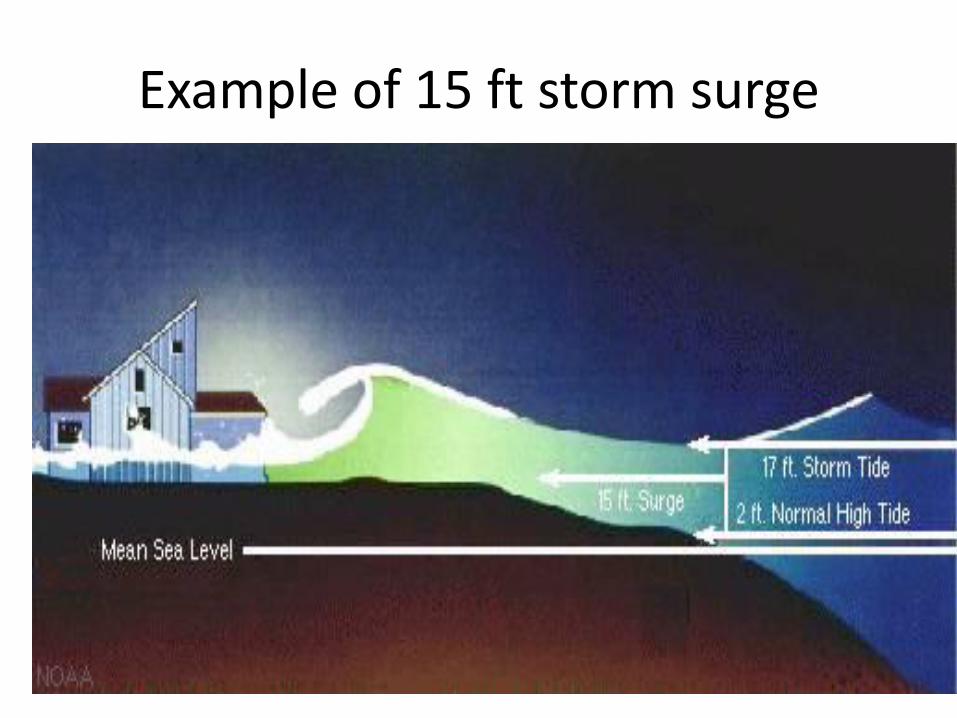
Example of 15 ft storm surge
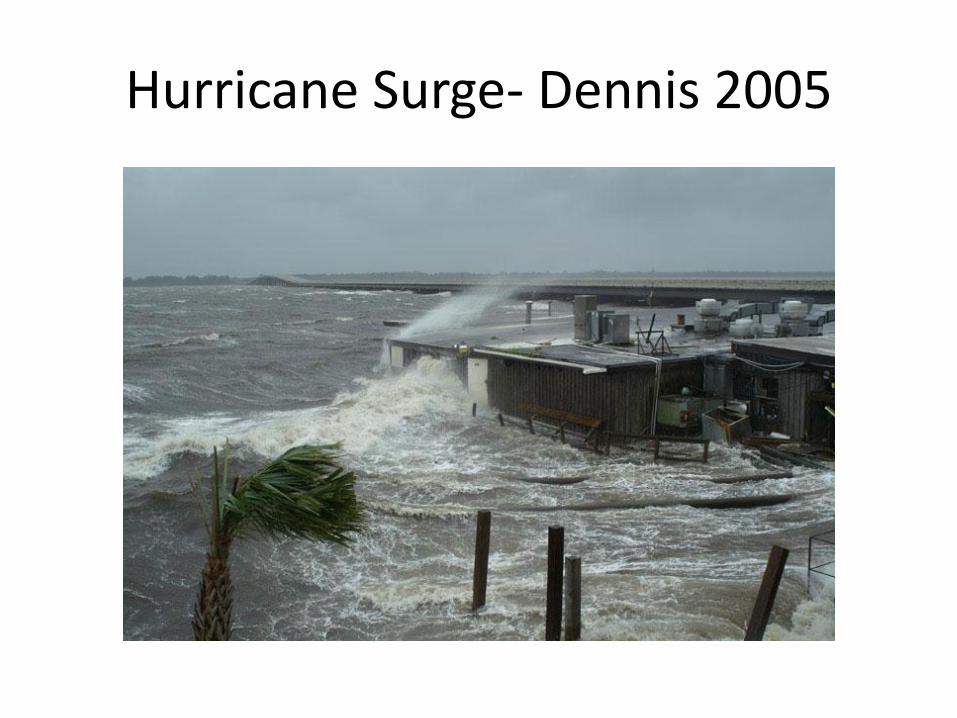
Hurricane Surge- Dennis 2005
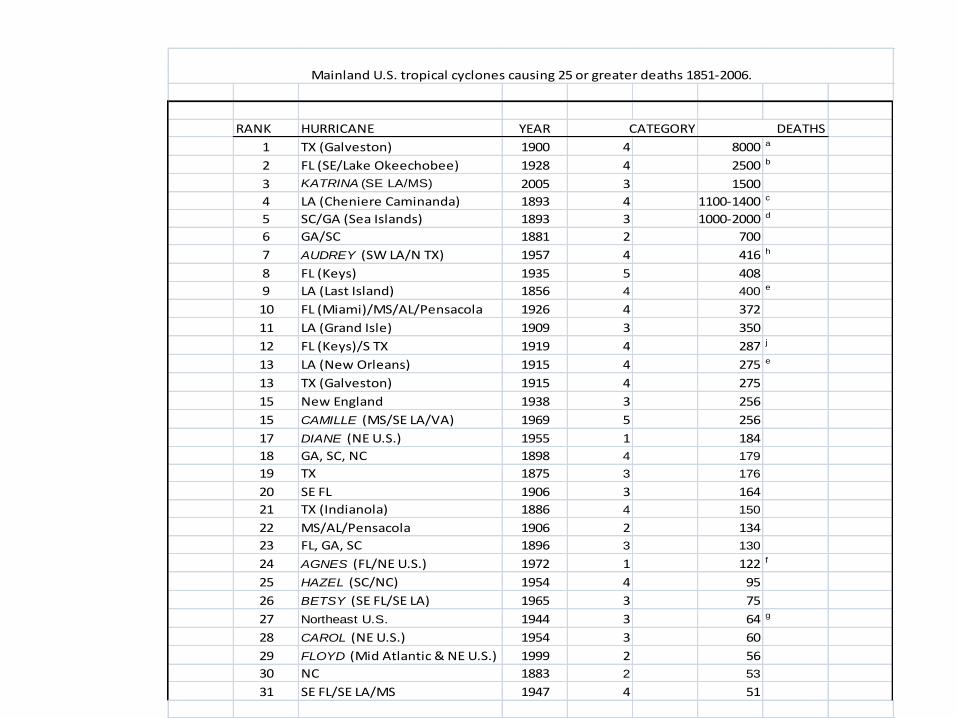
RANK HURRICANE YEAR
1 TX (Galveston) 1900 4 8000 a
2 FL (SE/Lake Okeechobee) 1928 4 2500 b
3 KATRINA (SE LA/MS) 2005 3 1500
4 LA (Cheniere Caminanda) 1893 4 1100-1400 c
5 SC/GA (Sea Islands) 1893 3 1000-2000 d
6 GA/SC 1881 2 700
7 AUDREY (SW LA/N TX) 1957 4 416 h
8 FL (Keys) 1935 5 408
9 LA (Last Island) 1856 4 400 e
10 FL (Miami)/MS/AL/Pensacola 1926 4 372
11 LA (Grand Isle) 1909 3 350
12 FL (Keys)/S TX 1919 4 287 j
13 LA (New Orleans) 1915 4 275 e
13 TX (Galveston) 1915 4 275
15 New England 1938 3 256
15 CAMILLE (MS/SE LA/VA) 1969 5 256
17 DIANE (NE U.S.) 1955 1 184
18 GA, SC, NC 1898 4 179
19 TX 1875 3 176
20 SE FL 1906 3 164
21 TX (Indianola) 1886 4 150
22 MS/AL/Pensacola 1906 2 134
23 FL, GA, SC 1896 3 130
24 AGNES (FL/NE U.S.) 1972 1 122 f
25 HAZEL (SC/NC) 1954 4 95
26 BETSY (SE FL/SE LA) 1965 3 75
27 Northeast U.S. 1944 3 64 g
28 CAROL (NE U.S.) 1954 3 60
29 FLOYD (Mid Atlantic & NE U.S.) 1999 2 56
30 NC 1883 2 53
31 SE FL/SE LA/MS 1947 4 51
Mainland U.S. tropical cyclones causing 25 or greater deaths 1851-2006.
CATEGORY DEATHS
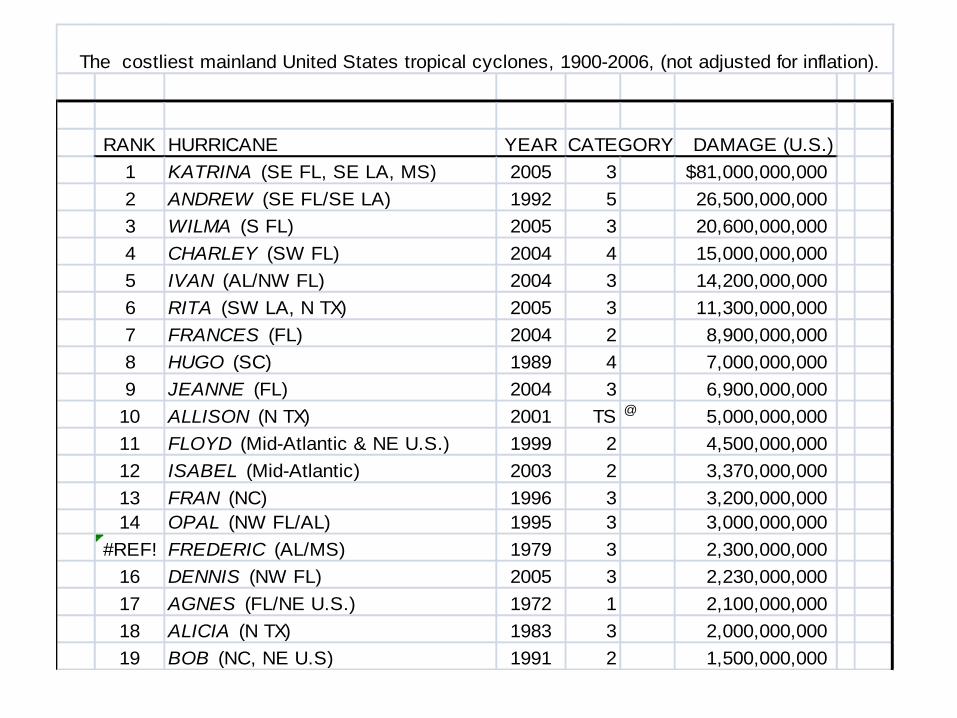
RANK HURRICANE YEAR CATEGORY DAMAGE (U.S.)
1 KATRINA (SE FL, SE LA, MS) 2005 3 $81,000,000,000
2 ANDREW (SE FL/SE LA) 1992 5 26,500,000,000
3 WILMA (S FL) 2005 3 20,600,000,000
4 CHARLEY (SW FL) 2004 4 15,000,000,000
5 IVAN (AL/NW FL) 2004 3 14,200,000,000
6 RITA (SW LA, N TX) 2005 3 11,300,000,000
7 FRANCES (FL) 2004 2 8,900,000,000
8 HUGO (SC) 1989 4 7,000,000,000
9 JEANNE (FL) 2004 3 6,900,000,000
10 ALLISON (N TX) 2001 TS @ 5,000,000,000
11 FLOYD (Mid-Atlantic & NE U.S.) 1999 2 4,500,000,000
12 ISABEL (Mid-Atlantic) 2003 2 3,370,000,000
13 FRAN (NC) 1996 3 3,200,000,000
14 OPAL (NW FL/AL) 1995 3 3,000,000,000
#REF! FREDERIC (AL/MS) 1979 3 2,300,000,000
16 DENNIS (NW FL) 2005 3 2,230,000,000
17 AGNES (FL/NE U.S.) 1972 1 2,100,000,000
18 ALICIA (N TX) 1983 3 2,000,000,000
19 BOB (NC, NE U.S) 1991 2 1,500,000,000
The costliest mainland United States tropical cyclones, 1900-2006, (not adjusted for inflation).
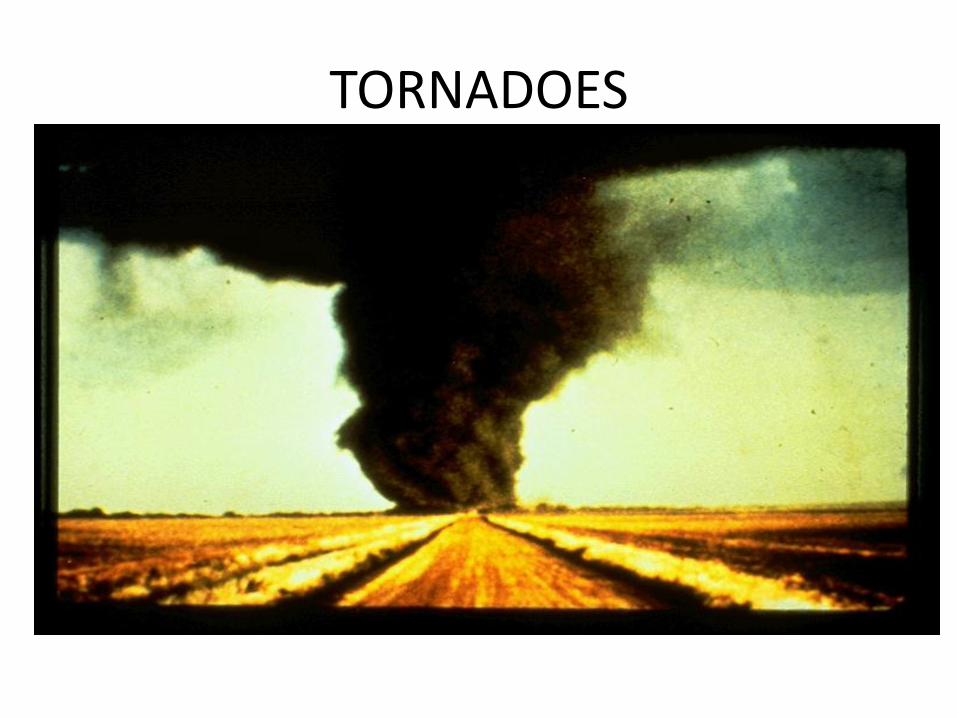
TORNADOES
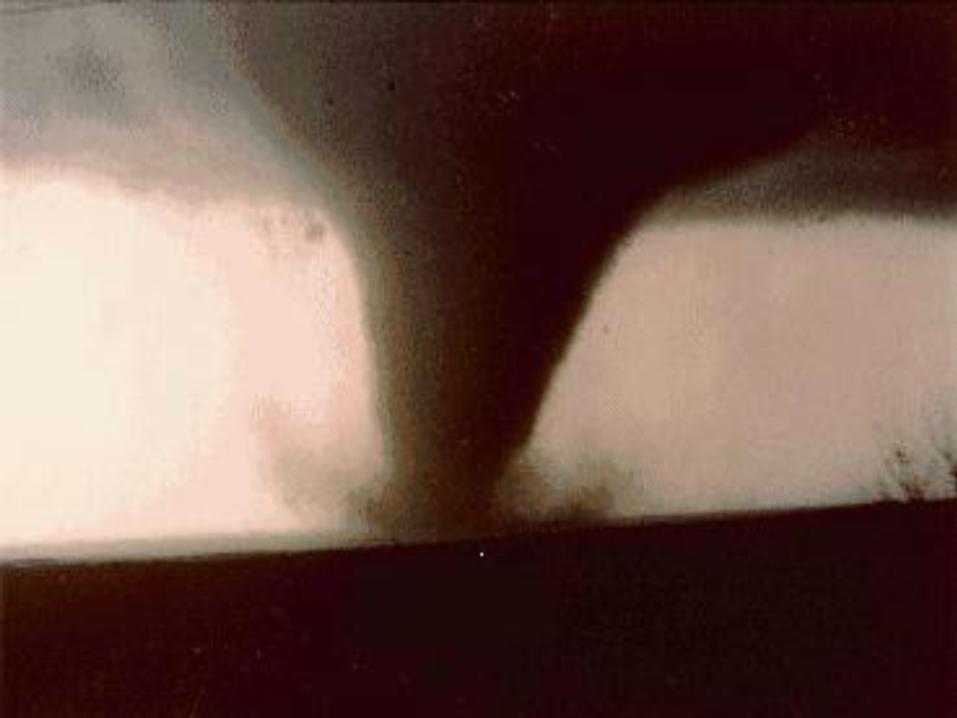
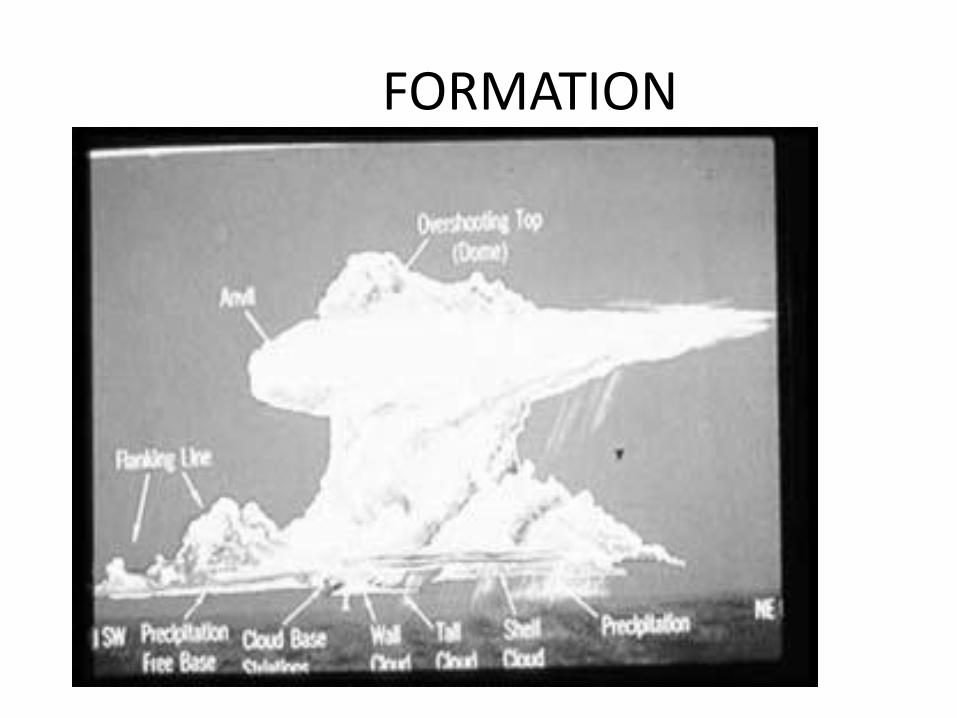
FORMATION

The Fujita Scale
F-Scale
Number
Intensity
Phrase
Wind
Speed Type of Damage Done
F0 Gale
tornado
40-72
mph
Some damage to chimneys; breaks
branches off trees; pushes over
shallow-rooted trees; damages sign
boards.
F1 Moderate
tornado
73-112
mph
The lower limit is the beginning of
hurricane wind speed; peels
surface off roofs; mobile homes
pushed off foundations or
overturned; moving autos pushed
off the roads; attached garages
may be destroyed.
F2 Significant
tornado
113-
157
mph
Considerable damage. Roofs torn
off frame houses; mobile homes
demolished; boxcars pushed over;
large trees snapped or uprooted;
light object missiles generated.
F3 Severe
tornado
158-
206
mph
Roof and some walls torn off well
constructed houses; trains
overturned; most trees in fores
uprooted
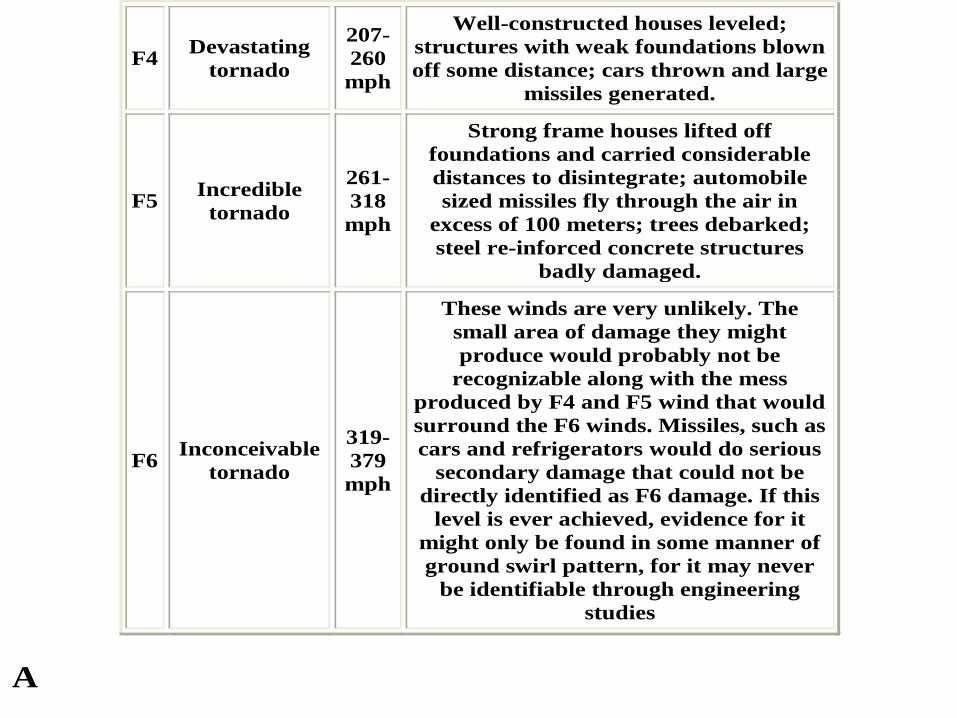
F4 Devastating
tornado
207-
260
mph
Well-constructed houses leveled;
structures with weak foundations blown
off some distance; cars thrown and large
missiles generated.
F5 Incredible
tornado
261-
318
mph
Strong frame houses lifted off
foundations and carried considerable
distances to disintegrate; automobile
sized missiles fly through the air in
excess of 100 meters; trees debarked;
steel re-inforced concrete structures
badly damaged.
F6 Inconceivable
tornado
319-
379
mph
These winds are very unlikely. The
small area of damage they might
produce would probably not be
recognizable along with the mess
produced by F4 and F5 wind that would
surround the F6 winds. Missiles, such as
cars and refrigerators would do serious
secondary damage that could not be
directly identified as F6 damage. If this
level is ever achieved, evidence for it
might only be found in some manner of
ground swirl pattern, for it may never
be identifiable through engineering
studies
A
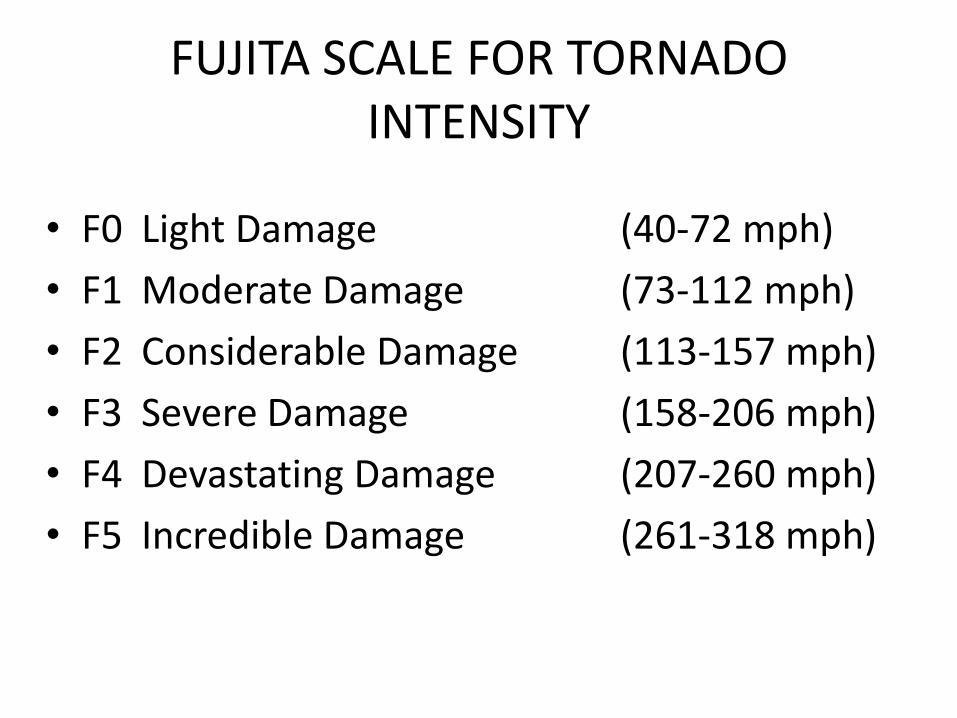
FUJITA SCALE FOR TORNADO INTENSITY
• F0 Light Damage (40-72 mph)
• F1 Moderate Damage (73-112 mph)
• F2 Considerable Damage (113-157 mph)
• F3 Severe Damage (158-206 mph)
• F4 Devastating Damage (207-260 mph)
• F5 Incredible Damage (261-318 mph)
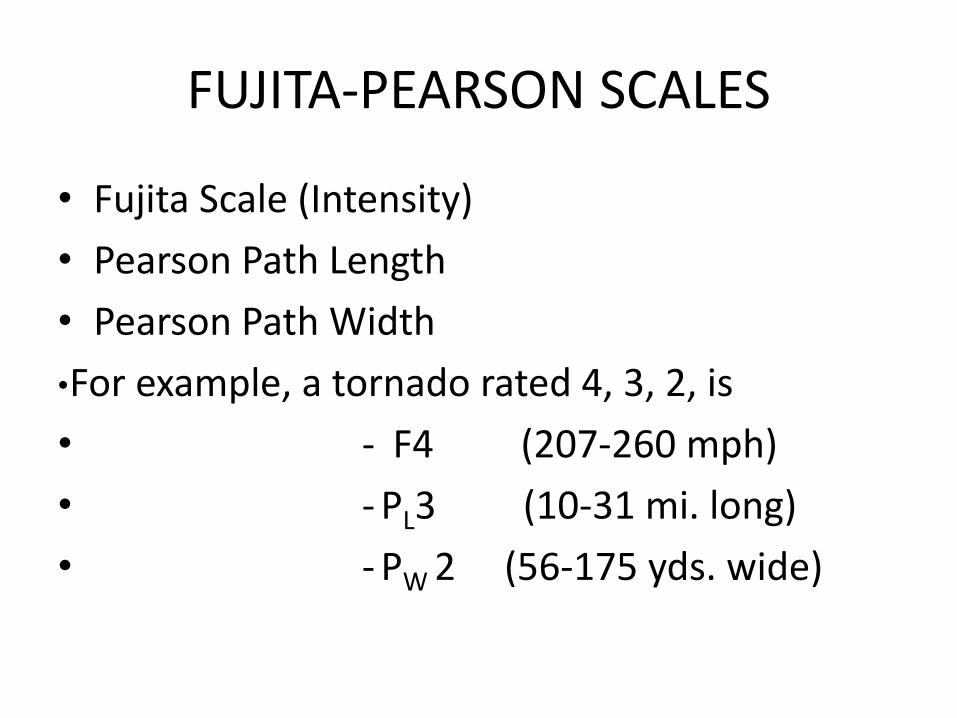
FUJITA-PEARSON SCALES
• Fujita Scale (Intensity)
• Pearson Path Length
• Pearson Path Width
•For example, a tornado rated 4, 3, 2, is
• - F4 (207-260 mph)
• - PL3 (10-31 mi. long)
• - PW 2 (56-175 yds. wide)

TORNADO DATA BASES
• Storm Prediction Center (SPC)
• University of Chicago

UNIVERSITY OF CHICAGO DATABASE
• Records from 1916 to 1989
• Path length per F-scale
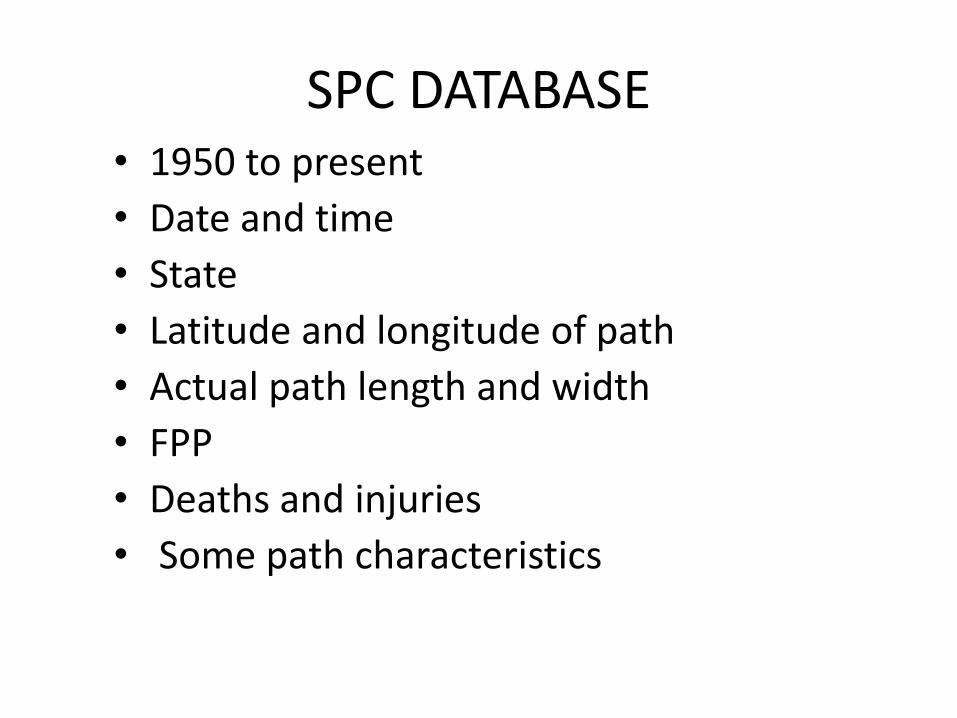
SPC DATABASE • 1950 to present
• Date and time
• State
• Latitude and longitude of path
• Actual path length and width
• FPP
• Deaths and injuries
• Some path characteristics
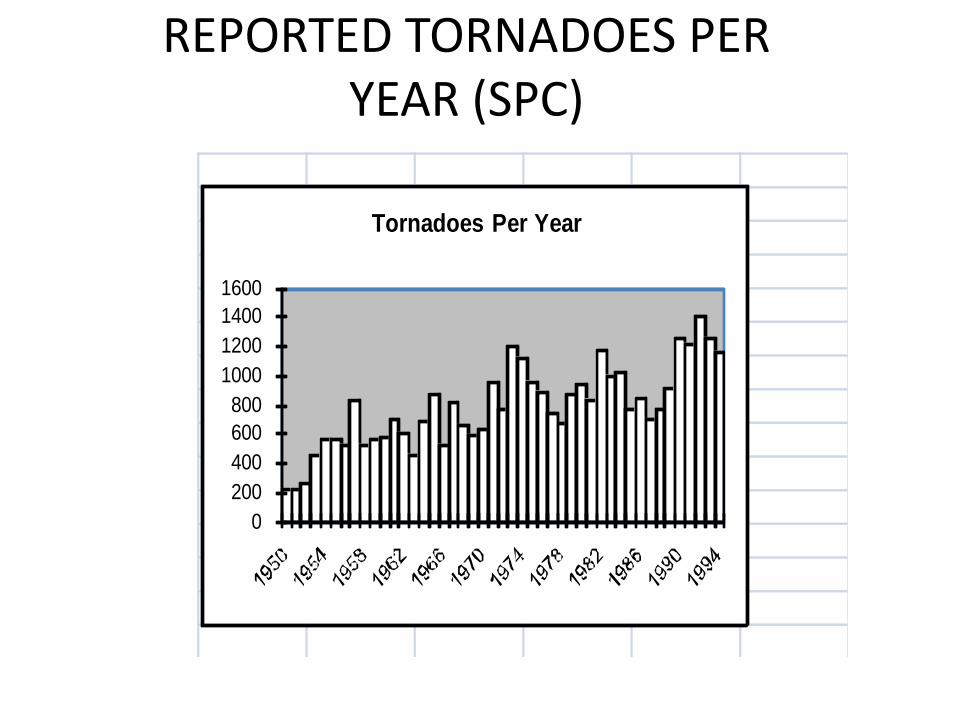
REPORTED TORNADOES PER YEAR (SPC)
0
200
400
600
800
1000
1200
1400
1600
Tornadoes Per Year
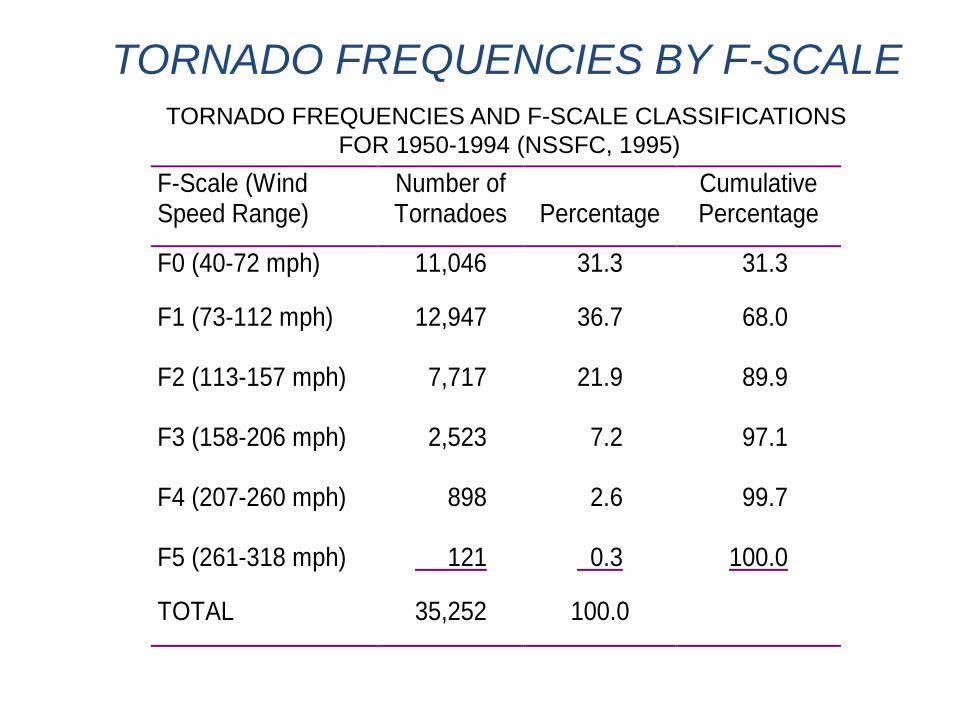
TORNADO FREQUENCIES AND F-SCALE CLASSIFICATIONS
FOR 1950-1994 (NSSFC, 1995)
F-Scale (WindSpeed Range)
Number ofTornadoes Percentage
CumulativePercentage
F0 (40-72 mph) 11,046 31.3 31.3
F1 (73-112 mph) 12,947 36.7 68.0
F2 (113-157 mph) 7,717 21.9 89.9
F3 (158-206 mph) 2,523 7.2 97.1
F4 (207-260 mph) 898 2.6 99.7
F5 (261-318 mph) 121 0.3 100.0
TOTAL 35,252 100.0
TORNADO FREQUENCIES BY F-SCALE
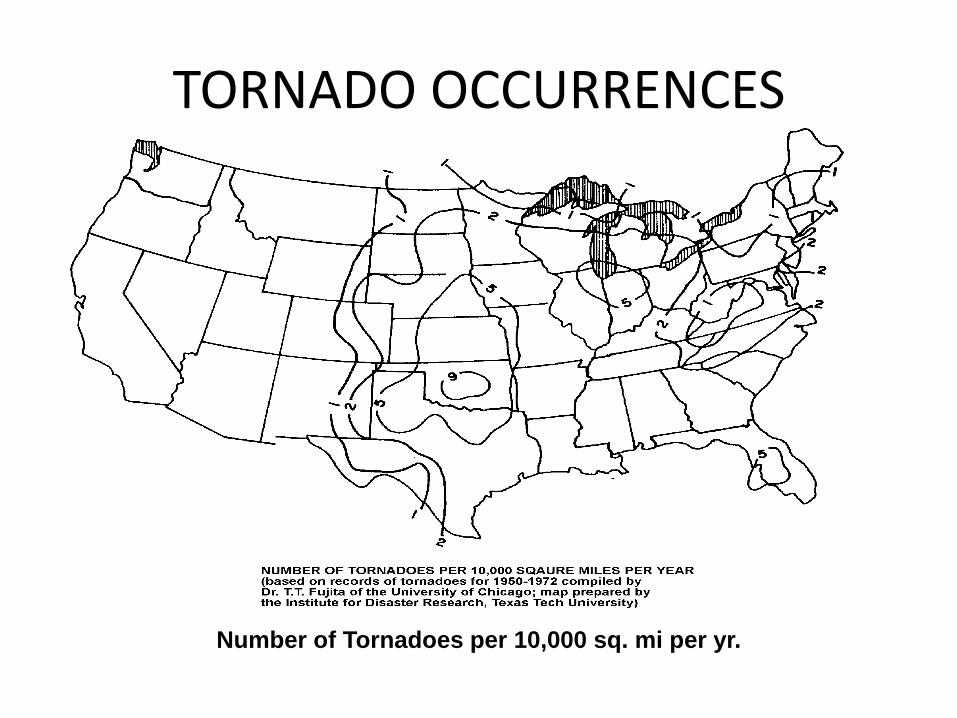
TORNADO OCCURRENCES
Number of Tornadoes per 10,000 sq. mi per yr.
MAXIMUM TORNADO WIND SPEEDS
• Cannot be measured
• Must use indirect methods
• Once thought to be 400-500 mph
• Most intense tornadoes observed have wind speed in the 250-300 mph range
ATMOSPHERIC PRESSURE CHANGE
• Rotating winds create low pressure near center of storm
• Difficult to measure
• Theoretical value can be calculated
• Maximum APC is less than 3 psi in the most intense tornado
MISSILES AND DEBRIS
• Tornado-generated missiles
• Roof gravel, tree limbs, sheet metal
• Timber planks, plastic pipes
• Steel pipes and wide-flange sections
• Storage tanks, automobiles, railroad cars
TORNADO RECORDS • Incomplete records present difficulties in
tornado hazard assessment
• Occurrence distribution must be determined
• Damage path area must be estimated
• Size of region and time period must be properly defined
• Model should compensate for classification errors, unreported and unrated tornadoes
FOUR CONCEPTS
• Definition of tornado hazard probability
• Classification errors
• Variation of intensity within the damage path
• Allocation of confidence intervals

SOURCES OF CLASSIFICATION ERRORS
• Unintentional bias of persons making judgment
• Lack of indicators in damage path
• Unknown quality of construction in path
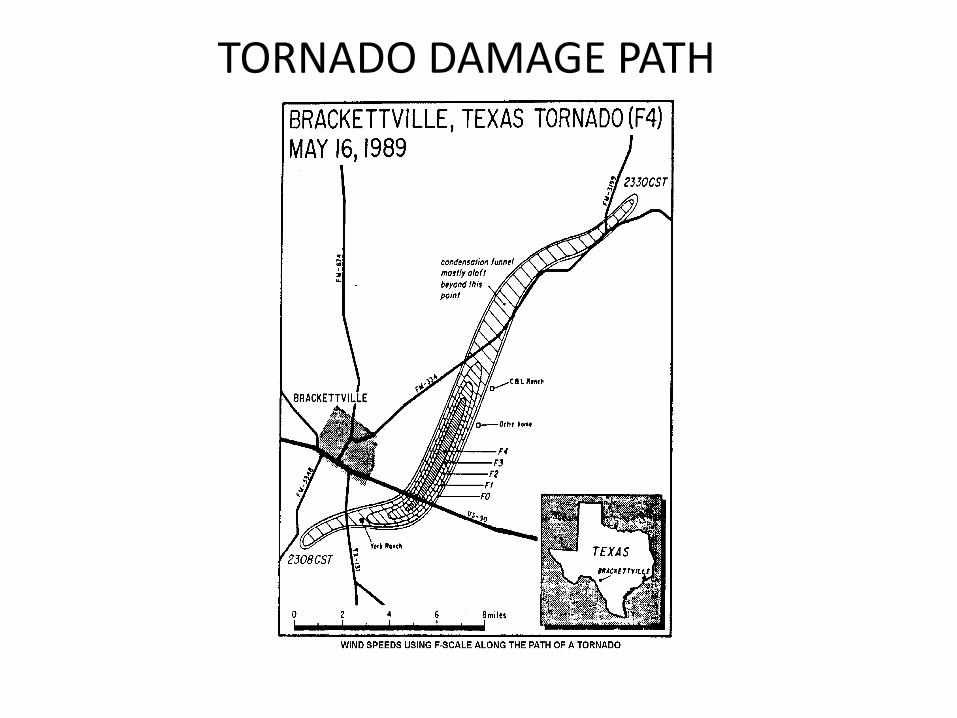
TORNADO DAMAGE PATH
ALLOCATION OF CONFIDENCE INTERVALS
• Confidence of tornado hazard probability is first selected
• Confidence intervals of each component in the model are adjusted to achieve target confidence interval for model
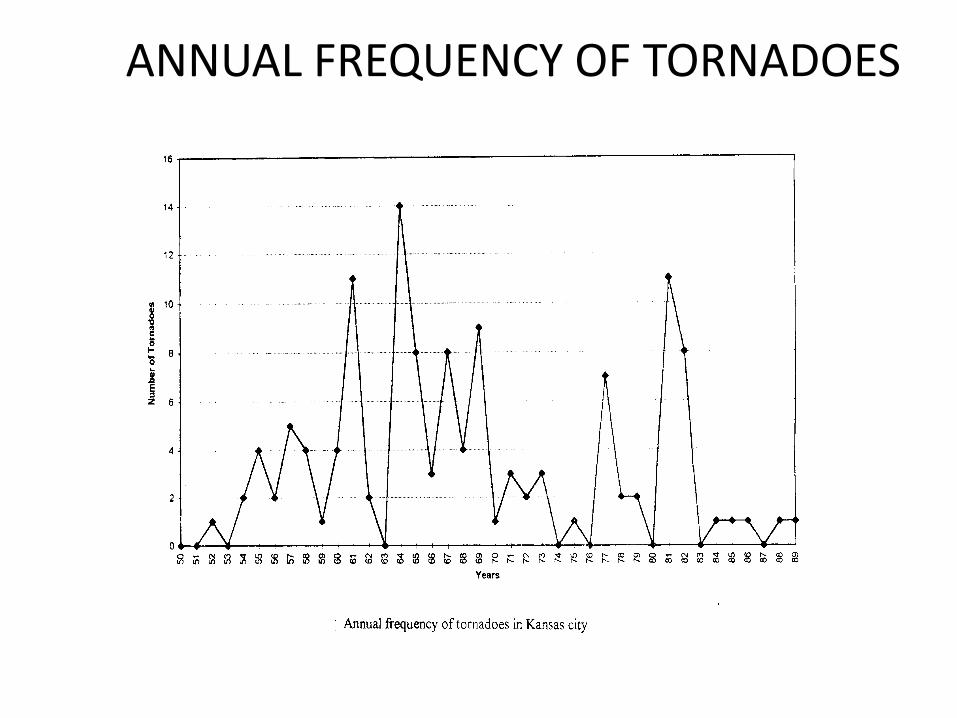
ANNUAL FREQUENCY OF TORNADOES
MULTIPROTECTON DESIGN
Disasters are great or sudden
misfortunes that result in
•economic disruption
•social chaos
•deaths and injuries
Natural disasters are rarely
predictable over long periods of
time, but are inevitable in some
locations.
MULTIPROTECTION DESIGN
Is the execution of a building
design in which every design
parameter is studied for its
effect on the mitigation of
defined disasters

MPD SHOULD BE A COMMUNITY-WIDE PROGRAM
Requires cooperation between
• Architect and Engineering Community
• Code/Standard enforcing agencies
• Insurance industry
• Research and development agencies
EFFECTIVE MPD WILL YIELD
• Increased life safety
• Reduction in property damage
• Added monetary value
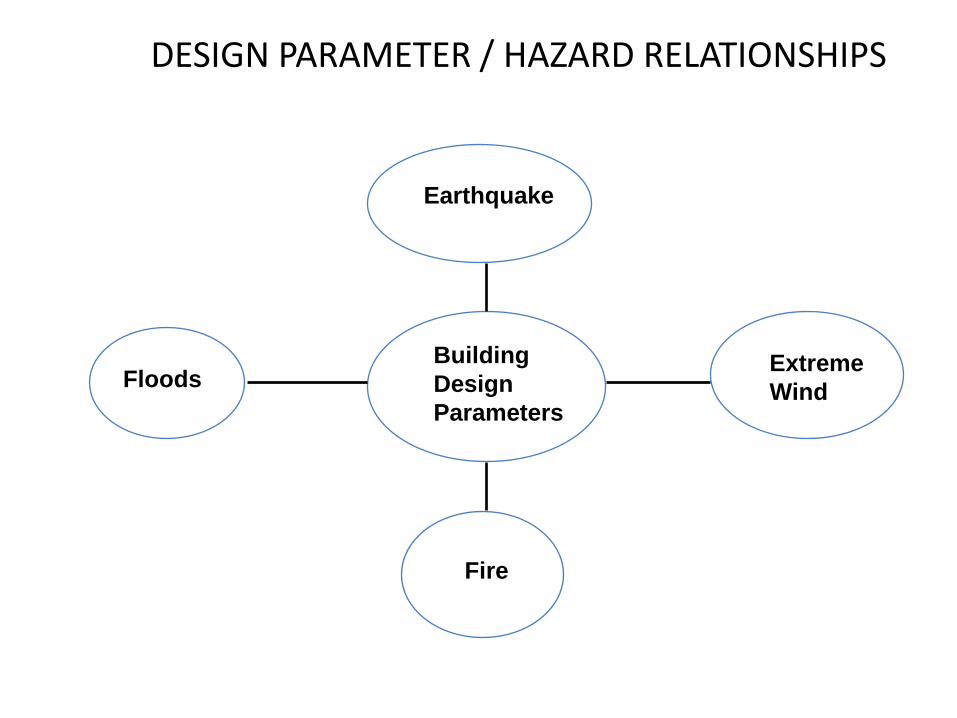
DESIGN PARAMETER / HAZARD RELATIONSHIPS
Earthquake
Extreme
Wind
Building
Design
Parameters
Floods
Fire
MPD is an integrated design,
rather than an assembled
design with various hazards
treated separately
MPD pursues a variety of approaches, including:
• measures to strengthen the built environment and
• measures that pay attention to site development schemes

MPD CONSIDERATIONS
Avoid
– Extreme height/depth ratio
– Extreme length/depth ratio
– Variation of stiffness in perimeter walls
– False symmetry
– Re-entrant corners
– Mass eccentrics
MPD CONSIDERATIONS
Pay Attention to:
– Building separations
– Shear wall design
– Diaphragm design (shape, openings)
MPD CONSIDERATIONS
Potential Vertical Layout problems:
– Weak column/strong beam
– Discontinuous shear walls
– Variation of column stiffness
– Soft story frames
UNCERTAINTIES IN BUILDING PERFORMANCE
Building Shapes
– Complex Shapes
– Cruciform Shapes
– U-shape plan
– L-shape plan
– T-shape plan
– Set backs
– Split level
– Multiple towers
UNCERTAINTIES IN BUILDING PERFORMANCE
Abrupt Discontinuities
– Changes in mass/stiffness ratios
– Changes in structural members
– Changes in vertical resisting members
– Combination shear walls and moment resisting frames
UNCERTAINTIES IN BUILDING PERFORMANCE
Unusual Structural Features
– Buildings on hillsides
– Staggered Truss System
– Shell structures
– Cable supported structures
– Earth covered structures