
WIND ENERGY RESOURCE ATLAS OF SOUTHEAST...
34
WIND ENERGY RESOURCE ATLAS OF SOUTHEAST ASIA Prepared for The World Bank Asia Alternative Energy Program Prepared by TrueWind Solutions, LLC Albany, New York September 2001
Transcript of WIND ENERGY RESOURCE ATLAS OF SOUTHEAST...
WIND ENERGY RESOURCE ATLAS
OF SOUTHEAST ASIA
Prepared for The World Bank
Asia Alternative Energy Program
Prepared by TrueWind Solutions, LLC
Albany, New York
September 2001

TrueWind Solutions, LLCRobert Putnam, General ManagerCESTM, 251 Fuller RoadAlbany, New York USA 12203Tel: +1-518-437-8659Fax: +1-518-437-8661E-Mail: [email protected]: www.truewind.com
The World BankAsia Alternative Energy Program(ASTAE)1818 H Street, NWWashington, DC USA 20433Web: www.worldbank.org/ASTAE
Key Contacts
Wind Energy Resource Atlas of Southeast Asia iii
TABLE OF CONTENTS
LIST OF MAPS .................................................................................................................... iv LIST OF TABLES................................................................................................................. v LIST OF FIGURES .............................................................................................................. vi EXCECUTIVE SUMMARY .............................................................................................. vii 1. INTRODUCTION ........................................................................................................... 1 2. OVERVIEW OF THE REGION.................................................................................... 3 2.1. Geography................................................................................................................. 3 2.2. Climate ...................................................................................................................... 3 2.3. Previous Wind Resource Studies ............................................................................ 4 3. WIND MAPPING METHOD......................................................................................... 5 3.1 Description of MesoMap.......................................................................................... 5 3.2 Products of the Mapping System ............................................................................ 6 3.3 Limitations of the Method ....................................................................................... 8 3.4 Validation of MesoMap ......................................................................................... 10 4. WIND RESOURCE MAPS OF SOUTHEAST ASIA................................................ 13 4.1 Introduction ............................................................................................................ 13 4.2 Wind Speed and Power at 65 m ............................................................................ 14 4.3 Wind Speed at 30 m ............................................................................................... 14 4.4 Seasonal Wind Maps and Wind Rose Charts ...................................................... 14 4.5 Adjustments for Local Conditions........................................................................ 15 4.6 Wind Energy Potential of Southeast Asian Countries ........................................ 17 5. REGIONAL MAPS ....................................................................................................... 19 6. RECOMMENDATIONS FOR FUTURE RESOURCE ASSESSMENTS............... 23 APPENDIX A: COMPARISONS WITH SURFACE DATA.......................................... 57 APPENDIX B: SURFACE DATA SUMMARIES............................................................ 61
Tall Towers: Qui Nohn (IMH) and Phuket (EGAT) .................................................. 63 Thailand DEDP Stations............................................................................................... 68 Thailand and Vietnam Meteorological Stations ......................................................... 95
APPENDIX C: RECOMMENDATIONS FOR DISSEMINATION ............................ 108
Wind Energy Resource Atlas of Southeast Asia iv
LIST OF MAPS
Map 2.1 Southeast Asia Atlas Region.................................................................................27
Map 2.2 Southeast Asia Elevations .....................................................................................28
Map 2.3 Southeast Asia Land Cover ..................................................................................29
Map 4.1 Wind Resource at 65 m .........................................................................................30
Map 4.2 Wind Resource at 30 m .........................................................................................31
Map 4.3 Wind Resource at 65 m: December - February ..................................................32
Map 4.4 Wind Resource at 65 m: March - May ................................................................33
Map 4.5 Wind Resource at 65 m: June - August ...............................................................34
Map 4.6 Wind Resource at 65 m: September - November ...............................................35
Map 4.7 Wind Rose Charts for Selected Points .................................................................36
Map 5.1 Guide to Map Tiles ................................................................................................37
Map Tiles ......................................................................................................................... 38-55
Map A.1 Comparison of Simulated and Observed Ocean Surface Wind Speeds ..........56
Wind Energy Resource Atlas of Southeast Asia v
LIST OF TABLES
Table 3.1 Dependence of Power on Frequency Distribution ............................................. 8
Table 3.2 Validation of the MesoMap System in Moderate Terrain .............................. 11
Table 3.3 Validation of the MesoMap System in Complex Terrain................................ 11
Table 4.1 Wind Resource Classifications........................................................................... 13
Table 4.2 Wind Speed Adjustment Factors....................................................................... 16
Table 4.3 Wind Energy Potential of Southeast Asia at 65 m ........................................... 17
Table 4.4 Proportion of Rural Population in Each Small Wind Resource Class........... 18
Table B.1 Selected Land Surface Stations ......................................................................... 61

Wind Energy Resource Atlas of Southeast Asia vi
LIST OF FIGURES
Figure 3.1 Weibull Wind Speed Frequency Distributions..................................................7
Figure 3.2 Model Bias versus Elevation Discrepancy .......................................................12
Figure A.1 Comparison of Predicted and Observed Ocean Surface Winds ...................58
Figure A.2 Comparison of Predicted and Observed Land Surface Winds.....................60
Wind Energy Resource Atlas of Southeast Asia vii
EXECUTIVE SUMMARY
The Wind Energy Resource Atlas of Southeast Asia covers four countries: Cambodia, Laos, Thailand, and Vietnam. The purpose of the atlas is to facilitate the development of wind energy both for utility-scale generation and for village power and other off-grid applications. Potential users of the atlas include government officials, international lending agencies and development institutions, and private developers.
The atlas was made possible by the development in the past three years of a sophisticated new wind mapping system called MesoMap. This system uses a dynamical mesoscale weather model to simulate historical wind and weather conditions for a representative sample of days from 1984 to 1998. The data inputs include terrain elevations, land cover, and vegetation greenness on a 1 km grid scale, as well as meteorological data such as gridded reanalysis weather data, rawinsonde data, and sea surface temperature measurements. The results of the simulations are presented as color-coded maps of mean wind speed and wind power density, both annual and seasonal, and tabulated frequency distributions and wind rose charts.
Validation of the MesoMap approach carried out in other regions indicate that the method is accurate to 4% of the true mean wind speed (one standard error) after correction for variations in terrain elevation and land cover that fall below the model’s grid scale. Errors are likely to be larger in tropical developing countries, however. A thorough validation of MesoMap in Southeast Asia was not possible in this project because of the very limited availability of high-quality land surface measurements, but comparisons with satellite sea-surface measurements and with data from tall towers in the Philippines suggest a typical error margin of about 8% after adjustment for obvious discrepancies in topography and land cover.
Wind resource maps are presented both for the region as a whole and for 18 map tiles of 400x400 km size. The maps indicate that good to excellent wind resource areas for large-scale wind generation can be found in the mountains of central and southern Vietnam, central Laos, and central and western Thailand, as well as a few other locations. Furthermore, coastal areas of southern and south-central Vietnam show exceptional promise for wind energy both because of strong winds and their proximity to population centers. On a land area basis, approximately 28,000 square kilometers of Vietnam (8.6% of the total land area) experience good to excellent winds, while the corresponding figures for Cambodia, Laos, and Thailand are 345 sq. km (0.2%), 6776 sq. km (2.9%), and 761 sq. km (0.2%), respectively.
Opportunities for village wind power are considerably more widespread because small wind turbines are able to operate satisfactorily at lower wind speeds. Areas of good to excellent wind resource for village power are predicted in east-central Thailand, western and southern Cambodia, the northern and coastal southern Malay Peninsula, south-central Laos, and a large proportion of central and southern Vietnam as well as coastal areas of northern Vietnam. We estimate that about a quarter of the rural population of the four Southeast Asian countries live in areas showing good to excellent promise for small-scale wind energy.
This wind resource atlas can be used for identifying potential wind development areas. However, given the present lack of high-quality surface data to compare with the maps, it is recommended that measurement programs meeting rigorous wind-industry standards be carried out to verify the results and confirm the wind resource at promising locations.

Wind Energy Resource Atlas of Southeast Asia 1
1. INTRODUCTION
The use of wind energy has been growing around the world at an accelerating pace. However, the development of new wind projects continues to be hampered by a lack of reliable and accurate wind resource data in many parts of the world. Such data are needed to enable governments, multilateral development banks, private developers, and others to determine the priority that should be given to wind energy and to identify windy areas that might be suitable for development. The lack of useful data is especially critical in Southeast Asia, which has not yet experienced widespread wind development.
In response to the need for a new wind resource assessment of Southeast Asia using the best available data and models, the World Bank contracted with TrueWind Solutions, LLC, to produce the Wind Energy Resource Atlas of Southeast Asia. The main purpose of the atlas is to facilitate the development of wind energy both for utility-scale generation and for village power and other off-grid applications (which typically involve smaller wind turbines sensitive to a different range of wind speeds). The atlas may be used by a wide variety of stakeholders, including government officials, World Bank and other development bank officers, private developers, and university researchers. Potential applications of the atlas include:
• Assignment of priority to be given the development of wind energy within national or regional energy plans
• Creation of specific goals or targets for wind resource development at a regional, national, or provincial scale (e.g., megawatts of wind capacity or number of villages equipped with wind systems)
• Design of further wind resource assessment programs or studies, including on-site measurements to confirm the wind resource maps
• Identification of potentially attractive sites for wind project development.
The Wind Energy Resource Atlas of Southeast Asia is produced in both printed form and in an interactive format on CD-ROM. In addition to color-coded wind resource maps, the atlas contains information such as frequency distributions and wind roses for selected points and tabulated wind energy potential for each country. Users of the CD-ROM can view maps at different scales, print them or copy them into other programs, and examine or store wind resource data for selected points.
The maps and other data contained in the atlas were created with MesoMap, TrueWind Solutions’ advanced wind mapping system. The MesoMap system consists of an integrated set of atmospheric models, databases, and computers. It produces wind resource estimates by simulating wind conditions for a large number of historical days using a numerical weather model, historical weather data, and a variety of other inputs. Unlike most other models now in use, it does not rely on surface wind measurements, which are scarce or unreliable in most of Southeast Asia (and indeed the rest of the world). Also unlike other models, MesoMap is able to simulate coastal sea breezes, downslope mountain winds, mountain waves, offshore winds, and other important phenomena. The report is divided into six sections. Section 2 provides an overview of the climate and geography of Southeast Asia and briefly summarizes the findings of previous wind resource

Wind Energy Resource Atlas of Southeast Asia 2
assessments of the region. The next section describes the wind mapping method, including the MesoMap system, data sources used, the wind mapping process, and validation of the method’s accuracy. Section 4 presents the wind resource maps, provides guidelines for making adjustments for local conditions, and tabulates the wind energy potential by country, wind resource class, and turbine type. Section 5 presents 18 regional maps that provide greater detail. Section 6 presents recommendations for further wind resource assessments. Finally, the Appendix contains summaries of surface wind data collected from various sources and compares the available measurements with the maps.
Wind Energy Resource Atlas of Southeast Asia 3
2. OVERVIEW OF THE REGION
2.1. Geography The Wind Energy Resource Atlas encompasses four countries on the Indochina peninsula: Thailand, Cambodia, Laos, and Vietnam (Map 2.1). The region covers 1.26 million square kilometers and has over 4000 km of coastline. Only land-locked Laos has no direct access to the sea.
The topography of the region varies widely (Map 2.2). Most of Cambodia, the central and southern portions of Thailand, and the southern and northern coastal regions of Vietnam are characterized by fertile plains near sea level. The plains are interrupted in some areas by hills and mountains of moderate elevation (typically 1000-1500 meters). The terrain is more complex in northern Thailand, Laos, and inland Vietnam, where many mountains reach 2000-3000 meters elevation and are separated by deep valleys, plateaus, and passes.
The pattern of land use and land cover closely follows the topography (Map 2.3). The plains are heavily cultivated, with rice being the main crop. Although labeled “cropland” in the map, many cultivated regions are also densely populated, and the landscape is broken up by numerous small villages as well as trees and shrubs. While crops are also grown in upland areas both in valleys and on mountain slopes, the mountains are mainly covered in tropical and subtropical forest.
In 1999, the four countries had a combined population of 150.5 million, with the great majority living in Vietnam (75 million) and Thailand (60.2 million). Economic development patterns vary widely across the region, resulting in very different energy use patterns. Thailand has undergone rapid economic growth in the past several decades, and its electricity and energy consumption is correspondingly the highest in the region. The proportion of Thai villages that have been electrified stood at 99% at the end of the 1990s. Vietnam, Laos, and Cambodia, in contrast, remain predominantly agrarian nations.
Within each country there are also significant regional differences in the degree of rural electrification and intensity of power demand. Such differences have important implications for the use of wind energy, as regions with strong power demand and an extensive transmission grid are more likely to develop large wind “farms” to supply towns and cities as opposed to installing smaller wind turbines for local village and farming needs.
2.2. Climate The climate of Southeast Asia is classified as tropical humid and is subdivided into tropical wet and tropical wet and dry classes. These climatic regimes are primarily found within a 20º to 40º wide belt centered on the equator. The tropical wet classification is applied to the coasts of Thailand, Cambodia, and the northeast coast of Vietnam. The tropical wet and dry designation covers most interior regions of Southeast Asia as well as the southeast coast of Vietnam.
The tropical wet climate is characterized by uniformly high temperatures and heavy precipitation throughout the year. Annual mean temperatures are usually between 25ºC and 27ºC and monthly temperature variations are normally less than 2.5ºC. Annual precipitation totals are commonly between 27 cm and 39 cm. The tropical wet and dry climate has similar temperature characteristics. Its distinguishing qualities are less total precipitation and the seasonality of the rainfall. There is a distinct wet season as well as a dry season that lasts more than two months.
Wind Energy Resource Atlas of Southeast Asia 4
Easily the most important circulation pattern influencing Southeast Asia’s wind regime is the monsoon. The Northeast Monsoon begins in October and moves southward, becoming established throughout the region by mid-December. This monsoon is characterized by stable weather conditions and cooler northeasterly winds. The circulation brings abundant precipitation to the coastal mountains of Vietnam and those on the Malay Peninsula. The Northeast Monsoon ends around April to May, when the Southwest Monsoon takes over, gradually working its way northward. The rains associated with the Southwest Monsoon are often topographically driven and are also affected by the diurnal heating and cooling cycle. Rainfall is concentrated on southwest-facing slopes at elevations below 2000 m.
2.3. Previous Wind Resource Studies Southeast Asia has not been the subject of extensive wind resource studies in the past. However we are aware of two previous sets of studies, one conducted for Thailand and the other primarily for coastal areas of Thailand, Cambodia, and Vietnam.
The Thai studies were carried out in the early 1980s by researchers at the Asian Institute of Technology and at the Meteorological Department of the Thai Ministry of Communications.1 The studies involved an analysis of surface and upper-air wind records spanning several decades. The overall conclusion was that mean wind speeds in most parts of Thailand were rather modest, ranging (at 10 m height above ground level) from around 2 m/s in the northern part of the country to up to 4 m/s at some locations on the coast.
The second set of studies reached a more optimistic conclusion.2 Also relying principally on surface wind measurements, the authors of one report found that some coastal areas of Vietnam experience mean annual wind speeds of up to 8-10 m/s. Another indicated strong winds on the east coast of the Malay Peninsula during the monsoon season.
Both sets of studies were hampered by a reliance on surface wind observations, which can be unreliable or inconsistent over long periods, and which are not necessarily representative of areas that have not been monitored. The mountains, in particular, have been almost entirely neglected as most meteorological stations are located in valleys or plains or along coasts. The placement of many meteorological stations in towns and cities can also introduce a low bias in measurements because of interference by buildings. Finally, most surface wind measurements have been taken at a height of 10 m or less above ground level. The extrapolation of mean wind speeds to heights of interest for wind energy (25 to 70 m) introduces substantial uncertainties.
1 R. H. B. Exell, S. Thavapalachandran and P. Mukhia. AIT Research Report No. 134, (1981), R. H. B. Exell. Solar Energy, Vol. 35, pp. 3-13, (1985), and Chumnong Sorapipatana. Thesis No. ET-84-4, Asian Institute of Technology, (1984). 2 Yukimaru Shimizu et al., “Investigation Studies on Renewable Energy Resources In Asia: Wind and Solar Energies in Vietnam, Malaysia” [in Japanese], J. of Wind Energy, Vol. 20, No.1, pp.44-48, 1996. Yukimaru Shimizu et al., “Investigation Studies on Renewable Energy Resources in Asia: Wind Energy Resources Around Asia Continental,” Nature and Societies, Vol. 3, pp. 261-269, 1996.
Wind Energy Resource Atlas of Southeast Asia 5
3. WIND MAPPING METHOD
3.1. Description of the MesoMap System MesoMap is an integrated set of atmospheric simulation models, global weather and geographical data bases, and computer and storage systems. It has been developed in the past three years with support from the New York State Energy Research and Development Authority (NYSERDA) and the US Department of Energy. Outside of this project, MesoMap has been or is being used to assess wind resources and select sites for wind projects in North and South America, Europe, and Asia.3 It has also been verified against high-quality measurements in a variety of wind regimes, as described in section 3.4.
MesoMap offers several advantages over conventional wind resource assessment methods and simplified wind flow models such as WASP and WindMap. First, it operates without the need for surface wind data − an important attribute for regions such as Southeast Asia where reliable and consistent measurements are scarce. Second, MesoMap models important meteorological phenomena not represented in simplified wind flow models. The phenomena include mountain waves, winds driven by convection, sea and lake breezes, and downslope (thermal) mountain winds. Finally, MesoMap directly simulates long-term wind conditions, thus eliminating the need for uncertain climatological adjustments using correlations between short- and long-term surface measurements.
3.1.1. Models At the core of the MesoMap system is MASS (Mesoscale Atmospheric Simulation System), a state-of-the-art numerical weather prediction model developed since the early 1980s by TrueWind partner MESO, Inc. MASS is similar to other weather models such as Eta and MM5. It embodies the fundamental physics of atmospheric motion including conservation of mass, momentum, and energy, as well as the moisture phases, and it contains a turbulent kinetic energy submodule which accounts for the effects of viscosity and thermal stability on wind shear. As a dynamical model, MASS simulates the evolution of atmospheric conditions in time steps as short as a few seconds. This creates great computational demands necessitating the use of powerful workstations and multiple parallel processors. However, MASS can be coupled to two faster models: ForeWind, a dynamical viscous boundary layer model developed by TrueWind Solutions, and WindMap, a high resolution mass-consistent wind flow model developed by TrueWind partner Brower and Company. Depending on the circumstances, either of the latter two models may be used to increase the spatial resolution of the MASS simulations.
3.1.2. Input Data The MesoMap system uses a variety of geographical and meteorological inputs. The main geographical inputs are elevation, land cover, and vegetation greenness (normalized differential vegetation index, or NDVI). The elevation data used by MesoMap were produced by the US Geological Survey in a gridded digital elevation model, or DEM, format from a variety of data
3 MesoMap clients include BC Hydro (Canada), Tennessee Valley Authority (USA), SaskPower (Canada), Eletrobras (Brazil), National Renewable Energy Laboratory (USA), International Energie (Italy), and others.

Wind Energy Resource Atlas of Southeast Asia 6
sources.4 The land cover data were produced in a cooperative project by the US Geological Survey, the University of Nebraska, and the European Commission’s Joint Research Centre (JRC). They are based on the interpretation of Advanced Very High Resolution Radiometer (AVHRR) data – the same data used to calculate the NDVI. Both land cover and NDVI data are translated by the model into biophysical parameters such as surface roughness, albedo, emissivity, and others. The nominal spatial resolution of all of these data sets is 1 km. Thus, the standard output of the MesoMap system is a 1 km gridded wind map, though higher resolution maps can be produced if the necessary geographical data are available.
The main meteorological inputs are reanalysis data, rawinsonde data, and land and sea surface temperature measurements. The most important is the reanalysis data base, a global set of gridded historical weather data produced by the US National Center for Atmospheric Research (NCAR). The data provide a snapshot of atmospheric conditions around the word at all levels of the atmosphere in intervals of six hours. Along with the rawinsonde and surface temperature data, the reanalysis data establish the initial conditions as well as updated lateral boundary conditions for the MesoMap simulations. However, the model itself determines the evolution of atmospheric conditions within the region based on the interactions among different elements in the atmosphere and between the atmosphere and the surface. Because the reanalysis data are on a relatively coarse, 200 km grid, the MesoMap system is run in several nested grids of successfully finer mesh size, each taking as input the output of the previous nest, until the desired grid scale is reached. The outermost grid typically extends several thousand kilometers.
3.1.3. The Wind Mapping Process A wind map is created by running MesoMap for several hundred simulated days drawn from a 15- or 20-year period. The days are chosen through a stratified random sampling scheme so that each month and season is represented with equal weight. Each simulation generates wind and weather variables (temperature, pressure, moisture, turbulent kinetic energy, heat flux, and others) throughout the model domain, and the variables are stored in data files at hourly intervals. When the runs are finished, the several thousand output files are processed and summarized in a variety of formats, including color-coded maps of mean wind speed and power density at various heights above ground, wind rose charts, and data files containing wind frequency distribution parameters.
3.2. Products of the Mapping System The main products of the MesoMap system are the color-coded maps. The maps indicate, for a particular height above ground, either the mean wind speed, power density, or turbine output (for a specified turbine type) at any point in the region.
The mean wind speed is the simplest and most familiar indicator of the quality of the wind resource. It is the average of the wind speeds generated by the model at every hour of every simulated day:
4 The principal source of data for Eurasia was the US Defense Department’s high-resolution Digital Terrain Elevation Data set. Gaps in the DTED data set were filled mainly by an analysis of 1:1,000,000 scale elevation contours in the Digital Chart of the World (now called VMAP).
Wind Energy Resource Atlas of Southeast Asia 7
(3.1) ∑=
=⟩⟨N
iiv
Nv
1
1
where N is the total number of simulation hours. Another, in some ways superior, measure of wind resource quality is the mean wind power density. This represents the wind’s energy potential – in effect, its ability to move the blades of a wind turbine. It depends both on air density and most importantly on the cube of the wind speed:
(3.2) ∑=
=⟩⟨N
iiivN
P1
31 ρ
The units are Watts/m2. The air density, ρ, is determined by the air temperature and pressure, both outputs of the MesoMap system.
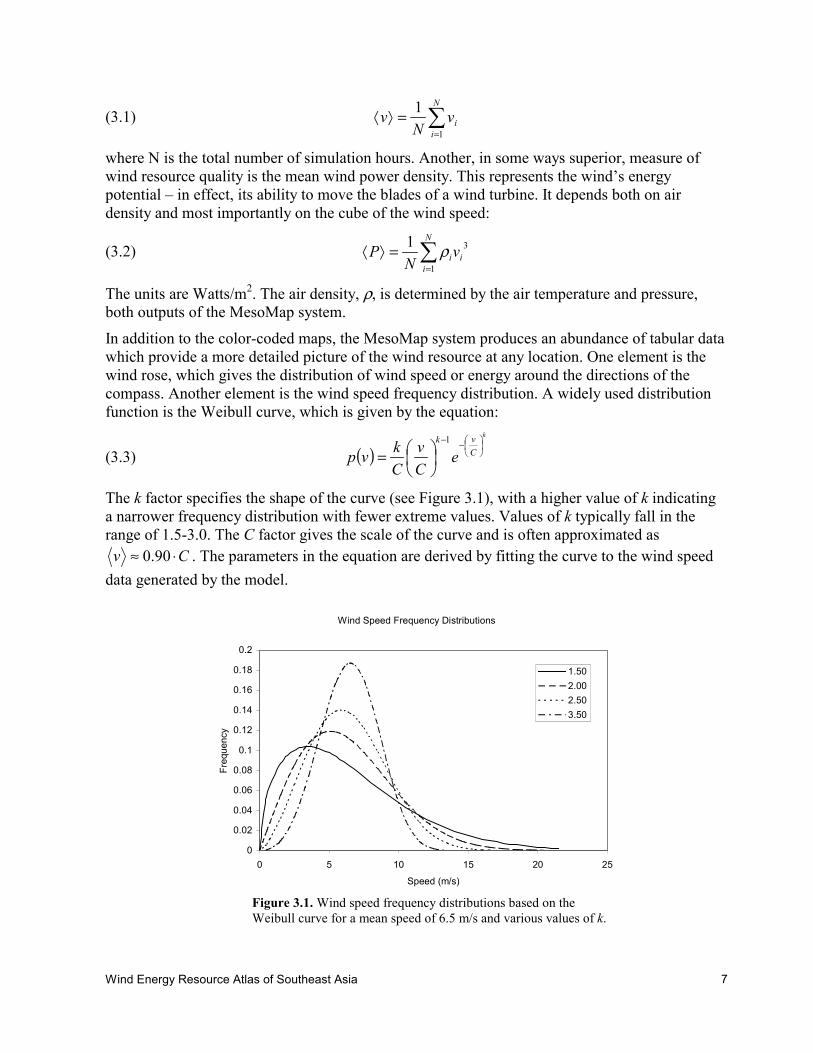
In addition to the color-coded maps, the MesoMap system produces an abundance of tabular data which provide a more detailed picture of the wind resource at any location. One element is the wind rose, which gives the distribution of wind speed or energy around the directions of the compass. Another element is the wind speed frequency distribution. A widely used distribution function is the Weibull curve, which is given by the equation:
(3.3) ( )k
Cvk
eCv
Ckvp
−−
=
1
The k factor specifies the shape of the curve (see Figure 3.1), with a higher value of k indicating a narrower frequency distribution with fewer extreme values. Values of k typically fall in the range of 1.5-3.0. The C factor gives the scale of the curve and is often approximated as
Cv ⋅≈ 90.0 . The parameters in the equation are derived by fitting the curve to the wind speed data generated by the model.
Figure 3.1. Wind speed frequency distributions based on the Weibull curve for a mean speed of 6.5 m/s and various values of k.
Wind Speed Frequency Distributions
0
0.02
0.04
0.06
0.08
0.1
0.12
0.14
0.16
0.18
0.2
0 5 10 15 20 25
Speed (m/s)
Freq
uenc
y
1.502.002.503.50
Wind Energy Resource Atlas of Southeast Asia 8
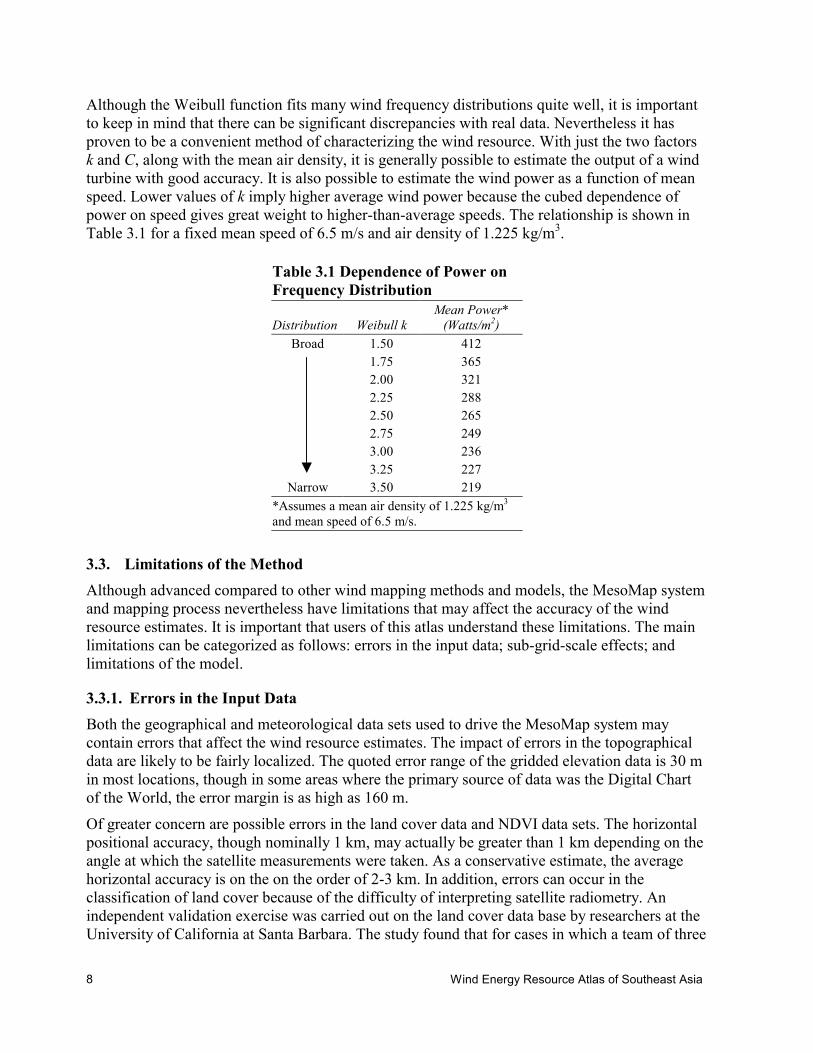
Although the Weibull function fits many wind frequency distributions quite well, it is important to keep in mind that there can be significant discrepancies with real data. Nevertheless it has proven to be a convenient method of characterizing the wind resource. With just the two factors k and C, along with the mean air density, it is generally possible to estimate the output of a wind turbine with good accuracy. It is also possible to estimate the wind power as a function of mean speed. Lower values of k imply higher average wind power because the cubed dependence of power on speed gives great weight to higher-than-average speeds. The relationship is shown in Table 3.1 for a fixed mean speed of 6.5 m/s and air density of 1.225 kg/m3.
Table 3.1 Dependence of Power on Frequency Distribution
Distribution Weibull k Mean Power*
(Watts/m2) Broad 1.50 412
1.75 365 2.00 321 2.25 288 2.50 265 2.75 249 3.00 236 3.25 227
Narrow 3.50 219 *Assumes a mean air density of 1.225 kg/m3 and mean speed of 6.5 m/s.
3.3. Limitations of the Method Although advanced compared to other wind mapping methods and models, the MesoMap system and mapping process nevertheless have limitations that may affect the accuracy of the wind resource estimates. It is important that users of this atlas understand these limitations. The main limitations can be categorized as follows: errors in the input data; sub-grid-scale effects; and limitations of the model.
3.3.1. Errors in the Input Data Both the geographical and meteorological data sets used to drive the MesoMap system may contain errors that affect the wind resource estimates. The impact of errors in the topographical data are likely to be fairly localized. The quoted error range of the gridded elevation data is 30 m in most locations, though in some areas where the primary source of data was the Digital Chart of the World, the error margin is as high as 160 m.
Of greater concern are possible errors in the land cover data and NDVI data sets. The horizontal positional accuracy, though nominally 1 km, may actually be greater than 1 km depending on the angle at which the satellite measurements were taken. As a conservative estimate, the average horizontal accuracy is on the on the order of 2-3 km. In addition, errors can occur in the classification of land cover because of the difficulty of interpreting satellite radiometry. An independent validation exercise was carried out on the land cover data base by researchers at the University of California at Santa Barbara. The study found that for cases in which a team of three
Wind Energy Resource Atlas of Southeast Asia 9
interpreters were in unanimous agreement about the true land cover, the land cover database was correct about 79% of the time. However, errors of classification that occur among similar vegetation types may have little impact on surface properties of importance to the model. When the land cover classes were grouped by surface roughness class, for example, the observed accuracy increased to 88%.5 Nevertheless the estimated frequency of incorrect roughness class assignment (12%) is substantial.
Errors may also occur in the meteorological data. The MesoMap system is fairly insensitive to many such errors for two reasons. First, the equations in the model force a reconciliation of the physical variables in a way that tends to suppress isolated measurement errors or biases. For example, if a rawinsonde station regularly records the wrong wind speed and direction profile, but the temperature profile at that and most other stations is accurately reported, the erroneous wind data will be quickly suppressed because it is inconsistent with the large-scale temperature and pressure gradients. Second, to the extent the errors are random, their effect will average to zero over a large number of simulations. Nevertheless, persistent, one-sided errors in the weather data may cause a persistent bias in the model output. Such a bias will be difficult to detect or eliminate without high-quality surface wind measurements to verify the model predictions.
3.3.2. Sub-Grid Scale Effects Like any physical model that uses finite element techniques, the MesoMap system is vulnerable to errors caused by terrain or other features that cannot be resolved at the model grid scale. An example is a small hill that does not appear in the 1 km elevation data base. The wind at the top of the hill will be different from the wind at the bottom of the hill, and both may deviate from the wind speed estimated by the model for the 1x1 km area as a whole. Similarly, there may be variations in the land cover (and especially the roughness) within a grid cell which cause variations in the observed wind speed. A large clearing or lake within an otherwise forested area, for example, could raise observed winds at the height of a wind turbine by 10-15 percent.
Although sub-grid-scale winds cannot be calculated directly without going to a higher resolution, the range of wind speeds likely to occur within a grid cell due to such topographical and land cover variations can be very roughly estimated. The terrain relief (the difference between the maximum and minimum elevation within a given area) is not strongly dependent on grid scale, and thus the range of sub-grid-scale elevations can be estimated from the 1 km data. The terrain relief can then be converted to an approximate wind speed range. The potential effect of surface roughness variations can also be calculated from the known relations of boundary layer physics. Adjustments based on these considerations are described in section 4.5.
Some atmospheric processes, such as convection and turbulence, also cannot be fully resolved at the model grid scale. Such processes are instead parameterized, that is, their effects are estimated using equations that make use of parameters available at the model grid scale. Since no parameterization scheme is perfect, errors in the wind speed can result, especially where the sub-grid-scale processes are very significant. An important example is moist convection in the tropics.
5 US Geological Survey EROS Data Center, “Global Land Cover Characteristics Data Base,” Section 6.0 (http://edcdaac.usgs.gov/glcc/globdoc2_0.html).
Wind Energy Resource Atlas of Southeast Asia 10
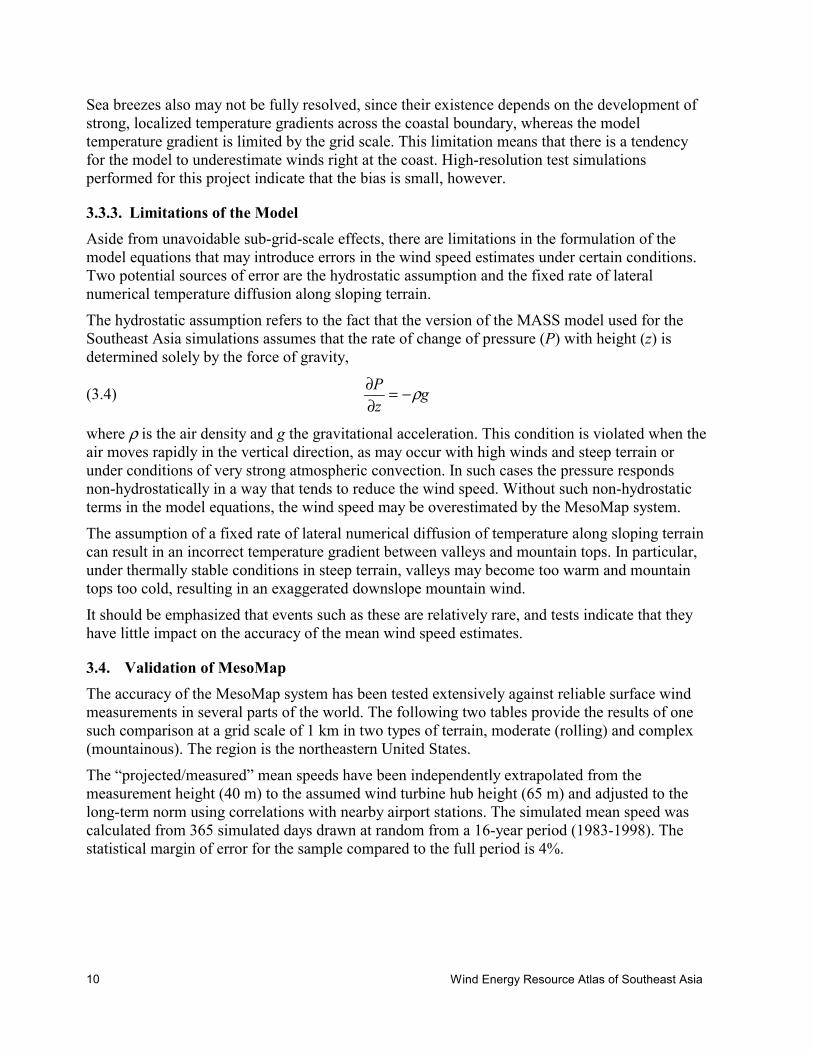
Sea breezes also may not be fully resolved, since their existence depends on the development of strong, localized temperature gradients across the coastal boundary, whereas the model temperature gradient is limited by the grid scale. This limitation means that there is a tendency for the model to underestimate winds right at the coast. High-resolution test simulations performed for this project indicate that the bias is small, however.
3.3.3. Limitations of the Model Aside from unavoidable sub-grid-scale effects, there are limitations in the formulation of the model equations that may introduce errors in the wind speed estimates under certain conditions. Two potential sources of error are the hydrostatic assumption and the fixed rate of lateral numerical temperature diffusion along sloping terrain.
The hydrostatic assumption refers to the fact that the version of the MASS model used for the Southeast Asia simulations assumes that the rate of change of pressure (P) with height (z) is determined solely by the force of gravity,
(3.4) gzP ρ−=
∂∂
where ρ is the air density and g the gravitational acceleration. This condition is violated when the air moves rapidly in the vertical direction, as may occur with high winds and steep terrain or under conditions of very strong atmospheric convection. In such cases the pressure responds non-hydrostatically in a way that tends to reduce the wind speed. Without such non-hydrostatic terms in the model equations, the wind speed may be overestimated by the MesoMap system.
The assumption of a fixed rate of lateral numerical diffusion of temperature along sloping terrain can result in an incorrect temperature gradient between valleys and mountain tops. In particular, under thermally stable conditions in steep terrain, valleys may become too warm and mountain tops too cold, resulting in an exaggerated downslope mountain wind.
It should be emphasized that events such as these are relatively rare, and tests indicate that they have little impact on the accuracy of the mean wind speed estimates.
3.4. Validation of MesoMap The accuracy of the MesoMap system has been tested extensively against reliable surface wind measurements in several parts of the world. The following two tables provide the results of one such comparison at a grid scale of 1 km in two types of terrain, moderate (rolling) and complex (mountainous). The region is the northeastern United States.
The “projected/measured” mean speeds have been independently extrapolated from the measurement height (40 m) to the assumed wind turbine hub height (65 m) and adjusted to the long-term norm using correlations with nearby airport stations. The simulated mean speed was calculated from 365 simulated days drawn at random from a 16-year period (1983-1998). The statistical margin of error for the sample compared to the full period is 4%.
Wind Energy Resource Atlas of Southeast Asia 11
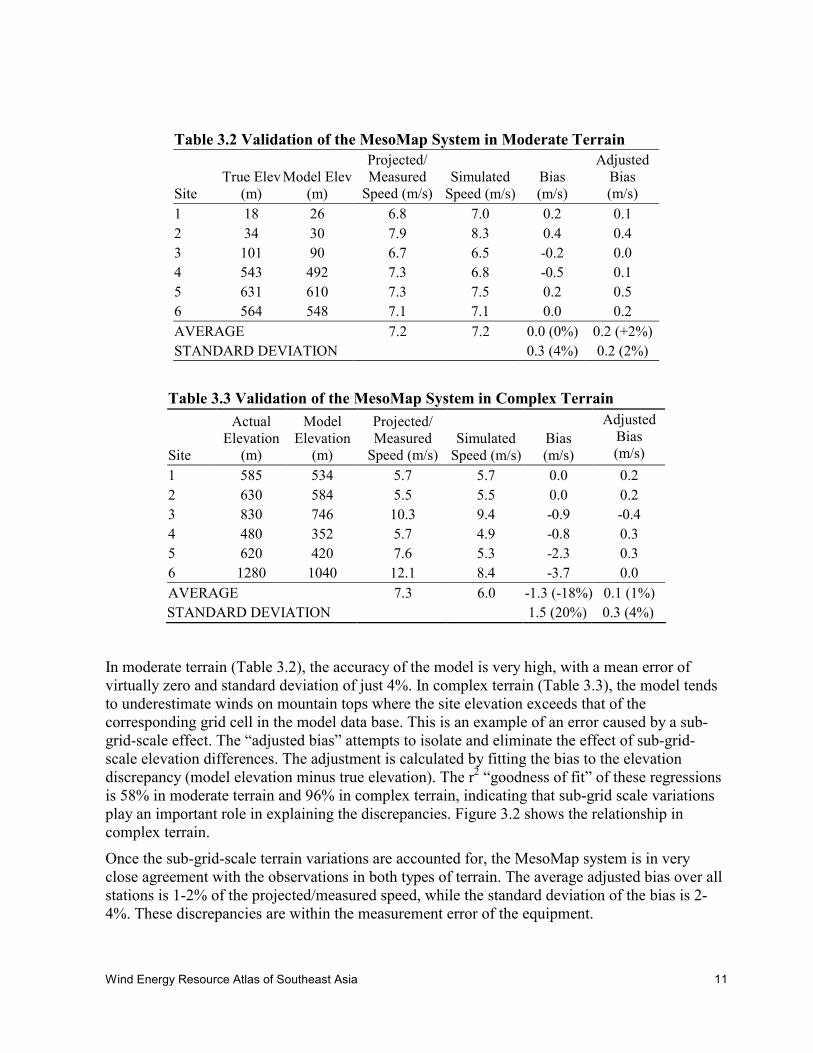
Table 3.2 Validation of the MesoMap System in Moderate Terrain
Site True Elev
(m) Model Elev
(m)
Projected/ Measured
Speed (m/s) Simulated
Speed (m/s)Bias (m/s)
Adjusted Bias (m/s)
1 18 26 6.8 7.0 0.2 0.1 2 34 30 7.9 8.3 0.4 0.4 3 101 90 6.7 6.5 -0.2 0.0 4 543 492 7.3 6.8 -0.5 0.1 5 631 610 7.3 7.5 0.2 0.5 6 564 548 7.1 7.1 0.0 0.2 AVERAGE 7.2 7.2 0.0 (0%) 0.2 (+2%) STANDARD DEVIATION 0.3 (4%) 0.2 (2%)
Table 3.3 Validation of the MesoMap System in Complex Terrain
Site
Actual Elevation
(m)
Model Elevation
(m)
Projected/ Measured
Speed (m/s) Simulated
Speed (m/s) Bias (m/s)
Adjusted Bias (m/s)
1 585 534 5.7 5.7 0.0 0.2 2 630 584 5.5 5.5 0.0 0.2 3 830 746 10.3 9.4 -0.9 -0.4 4 480 352 5.7 4.9 -0.8 0.3 5 620 420 7.6 5.3 -2.3 0.3 6 1280 1040 12.1 8.4 -3.7 0.0 AVERAGE 7.3 6.0 -1.3 (-18%) 0.1 (1%) STANDARD DEVIATION 1.5 (20%) 0.3 (4%)
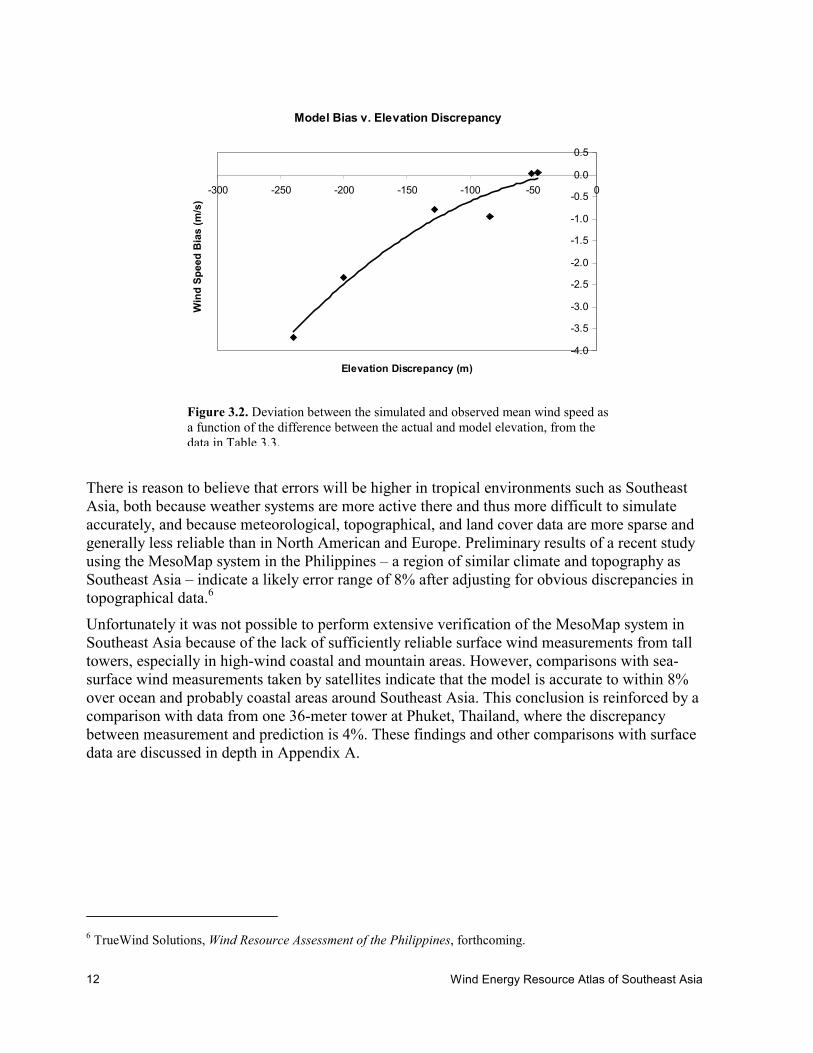
In moderate terrain (Table 3.2), the accuracy of the model is very high, with a mean error of virtually zero and standard deviation of just 4%. In complex terrain (Table 3.3), the model tends to underestimate winds on mountain tops where the site elevation exceeds that of the corresponding grid cell in the model data base. This is an example of an error caused by a sub-grid-scale effect. The “adjusted bias” attempts to isolate and eliminate the effect of sub-grid-scale elevation differences. The adjustment is calculated by fitting the bias to the elevation discrepancy (model elevation minus true elevation). The r2 “goodness of fit” of these regressions is 58% in moderate terrain and 96% in complex terrain, indicating that sub-grid scale variations play an important role in explaining the discrepancies. Figure 3.2 shows the relationship in complex terrain.
Once the sub-grid-scale terrain variations are accounted for, the MesoMap system is in very close agreement with the observations in both types of terrain. The average adjusted bias over all stations is 1-2% of the projected/measured speed, while the standard deviation of the bias is 2-4%. These discrepancies are within the measurement error of the equipment.
Wind Energy Resource Atlas of Southeast Asia 12
There is reason to believe that errors will be higher in tropical environments such as Southeast Asia, both because weather systems are more active there and thus more difficult to simulate accurately, and because meteorological, topographical, and land cover data are more sparse and generally less reliable than in North American and Europe. Preliminary results of a recent study using the MesoMap system in the Philippines – a region of similar climate and topography as Southeast Asia – indicate a likely error range of 8% after adjusting for obvious discrepancies in topographical data.6
Unfortunately it was not possible to perform extensive verification of the MesoMap system in Southeast Asia because of the lack of sufficiently reliable surface wind measurements from tall towers, especially in high-wind coastal and mountain areas. However, comparisons with sea-surface wind measurements taken by satellites indicate that the model is accurate to within 8% over ocean and probably coastal areas around Southeast Asia. This conclusion is reinforced by a comparison with data from one 36-meter tower at Phuket, Thailand, where the discrepancy between measurement and prediction is 4%. These findings and other comparisons with surface data are discussed in depth in Appendix A.
6 TrueWind Solutions, Wind Resource Assessment of the Philippines, forthcoming.
Model Bias v. Elevation Discrepancy
-4.0
-3.5
-3.0
-2.5
-2.0
-1.5
-1.0
-0.5
0.0
0.5
-300 -250 -200 -150 -100 -50 0
Elevation Discrepancy (m)
Win
d Sp
eed
Bia
s (m
/s)
Figure 3.2. Deviation between the simulated and observed mean wind speed as a function of the difference between the actual and model elevation, from the data in Table 3.3.
Wind Energy Resource Atlas of Southeast Asia 13
4. WIND RESOURCE MAPS OF SOUTHEAST ASIA
4.1. Introduction This section presents the wind resource maps of Southeast Asia. The maps depict the mean wind speed and wind power density at 65 m, the mean speed at 30 m (a height suitable for small wind turbines), and the seasonal wind resource.
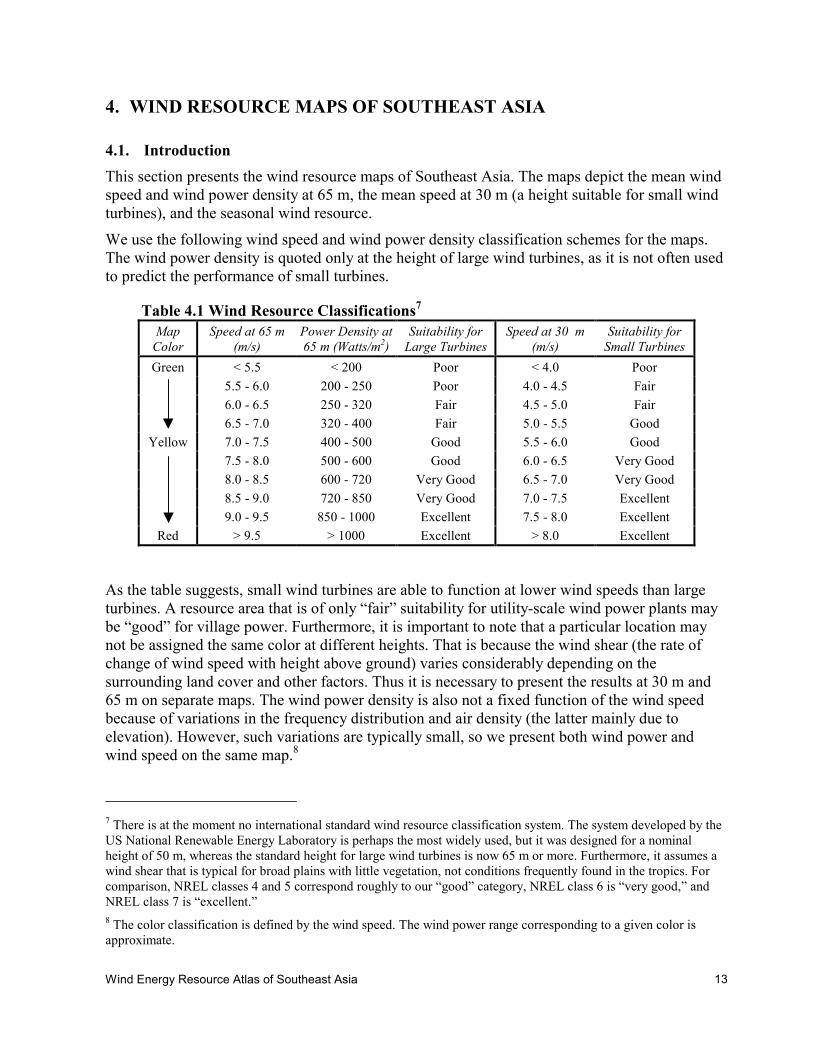
We use the following wind speed and wind power density classification schemes for the maps. The wind power density is quoted only at the height of large wind turbines, as it is not often used to predict the performance of small turbines.
Table 4.1 Wind Resource Classifications7 Map Color
Speed at 65 m (m/s)
Power Density at 65 m (Watts/m2)
Suitability for Large Turbines
Speed at 30 m (m/s)
Suitability for Small Turbines
Green < 5.5 < 200 Poor < 4.0 Poor 5.5 - 6.0 200 - 250 Poor 4.0 - 4.5 Fair 6.0 - 6.5 250 - 320 Fair 4.5 - 5.0 Fair 6.5 - 7.0 320 - 400 Fair 5.0 - 5.5 Good
Yellow 7.0 - 7.5 400 - 500 Good 5.5 - 6.0 Good 7.5 - 8.0 500 - 600 Good 6.0 - 6.5 Very Good 8.0 - 8.5 600 - 720 Very Good 6.5 - 7.0 Very Good 8.5 - 9.0 720 - 850 Very Good 7.0 - 7.5 Excellent 9.0 - 9.5 850 - 1000 Excellent 7.5 - 8.0 Excellent
Red > 9.5 > 1000 Excellent > 8.0 Excellent
As the table suggests, small wind turbines are able to function at lower wind speeds than large turbines. A resource area that is of only “fair” suitability for utility-scale wind power plants may be “good” for village power. Furthermore, it is important to note that a particular location may not be assigned the same color at different heights. That is because the wind shear (the rate of change of wind speed with height above ground) varies considerably depending on the surrounding land cover and other factors. Thus it is necessary to present the results at 30 m and 65 m on separate maps. The wind power density is also not a fixed function of the wind speed because of variations in the frequency distribution and air density (the latter mainly due to elevation). However, such variations are typically small, so we present both wind power and wind speed on the same map.8
7 There is at the moment no international standard wind resource classification system. The system developed by the US National Renewable Energy Laboratory is perhaps the most widely used, but it was designed for a nominal height of 50 m, whereas the standard height for large wind turbines is now 65 m or more. Furthermore, it assumes a wind shear that is typical for broad plains with little vegetation, not conditions frequently found in the tropics. For comparison, NREL classes 4 and 5 correspond roughly to our “good” category, NREL class 6 is “very good,” and NREL class 7 is “excellent.” 8 The color classification is defined by the wind speed. The wind power range corresponding to a given color is approximate.
Wind Energy Resource Atlas of Southeast Asia 14
4.2. Wind Speed and Power at 65 m Map 4.1 shows the predicted mean wind speed and power density at 65 m for the Southeast Asia atlas region. Good to excellent wind resource areas are concentrated in two areas: (a) mountains and mountain passes of moderate to high elevation in the southern half of the region (south of latitude 19°N); and (b) coastal areas of southern Vietnam.
In both cases, the driving force is the monsoon cycle. The mountains of central and southern Vietnam lie in an especially favorable position since they form a nearly continuous barrier that is perpendicular to the monsoon winds, which come from the northeast from around October to May and from the southwest from June to September. The mountain chains of western Thailand and the Malay Peninsula experience strong winds from time to time, but the mean speeds are significantly lower than in Vietnam and Laos. Aside from the acceleration due to the compression of the wind flow over the mountains, the wind may be enhanced in certain areas by mountain waves – the “bouncing” of a thermally stable air mass after it is displaced upward by a mountain range – and by temperature-driven downslope flows.
The northeast monsoon winds are not only driven over the mountains but also around the end of the Southeast Asia peninsula, where they converge with the offshore wind and accelerate. This accounts for the good to excellent wind resource found along the southern and southeastern coast of Vietnam. Small peninsulas sticking out from the coast are likely to experience especially strong winds.
In contrast, the coastal and inland plains of Thailand and Cambodia, as well as the northern mountainous region of Southeast Asia, appear to present few or no opportunities for large-scale wind power. The winds aloft are generally weak, and thus there is little momentum to be brought near the surface. Unstable moist convection causes strong winds in localized areas for short periods of time, but at most other times the wind speeds are relatively low.
4.3. Wind Speed at 30 m The wind resource map at 30 m height above ground (Map 4.2) gives an indication of potential opportunities for village power using small wind turbines. Small turbines are sensitive to a lower range of wind speeds, and sites not suitable for utility-scale wind power generation may nonetheless be attractive for village power applications.
Areas classed as “fair” or better for small wind turbines include large sections of southern and central Vietnam, both coastal and mountainous, as well as central Laos and central and southern Thailand, and coastal areas around the Bay of Bangkok and possibly, right at the shore, on the Malay Peninsula. However most of the northern half of Southeast Asia (except along the Vietnam coast and near the China border) appears unsuitable, as does much of central and northern Cambodia away from the coast.
4.4. Seasonal Wind Maps and Wind Rose Charts Maps 4.3-4.6 depict the wind resource at 65 m in four seasonal periods.9 Since the color scale is the same in each case, it is easy to see differences from one period to the next. The greatest
9 The seasons are defined as follows: winter (December-February), spring (March-May), summer (June-August), fall (September-November).

Wind Energy Resource Atlas of Southeast Asia 15
contrast is between December-February and June-August, which correspond roughly to the peak of the northeast (winter) and southwest (summer) monsoons, respectively. The other two seasons are transitional periods.
High winds occur in both December-February and June-August but in very different areas. It is striking that in December-February, when the prevailing wind is mainly from the northeast, strong winds occur in the plains to the west of the Giai Truong Son (Central mountains, or Chaine Annamitique) in central Vietnam and Laos. This reflects the fact that the warm and moist air coming off the ocean is cooled as it rises over the mountains and loses its moisture, which causes it to become heavier and to flow rapidly down the western slopes into the lowlands below.
The northeast monsoon also brings strong winds to southern Vietnam. This may occur near the coast because the northeasterly wind creates a low-pressure zone to the south and west of the terminus of the Truong Song mountains. The low pressure reinforces the sea breeze and also pulls in offshore winds coming around the peninsula. On the other hand, the area of strong wind at around 14 degrees latitude in central Vietnam represents a channeling of the northeasterly winds through a broad gap in the mountains.
In June-August, southwest winds on the mountains of western Thailand are quite strong, whereas in Vietnam windy areas are found to the east of the mountains, an echo of the downslope winds seen in December-February on the opposite side of the range. It is also possible that along the coast of Vietnam the low-pressure area created in the lee of the mountains reinforces the land-sea breeze that occurs because of the especially strong summer heating of the land surface.
These general patterns can be seen in the wind rose charts for nine selected points shown in Map 4.7.10 The nine points are numbered starting from the southwest and going clockwise around the region. At points 1 and 2, the winds are mainly westerly because the summer monsoon produces the strongest winds in this part of the region. There is an indication of a moderate sea breeze from the south at site 2. Moving northeastward, the easterly and northeasterly winds of the winter monsoon become more important. Point 4 in the eastern plains of Thailand is especially interesting, as the wind here is entirely from the northeast, thanks to the winter flow down the western slope of the mountains. The reverse occurs in summer at point 7, resulting in a significant westerly component to the wind there. At point 8 on the southeastern coast of Vietnam, the wind is almost entirely from the northeast and parallel to the coast.
4.5. Adjustments for Local Conditions It must always be kept in mind that the mean wind speed or power at a particular location may differ substantially from the predicted values because of variations in elevation, exposure, surface roughness, and other factors. The following guidelines should be followed when interpreting the maps.
4.5.1. Obstacles This atlas assumes that all locations to be considered for wind energy are free of obstacles that could disrupt or impede the wind flow at the height of the wind turbine. “Obstacle” does not
10 A wind rose depicts the frequency and relative power of winds coming from 16 directions of the compass.

Wind Energy Resource Atlas of Southeast Asia 16
apply to trees if they are common to the landscape, since their effects are already accounted for in the predicted speed (however note the discussion of displacement height below). However a large outcropping of rock would pose an obstacle for a wind turbine, as would a nearby shelter belt of trees or a building in an otherwise open landscape. As a rule of thumb, the effect of such obstacles extends to a height of about twice the obstacle height and to a distance downwind of 10-20 times the obstacle height.
4.5.2. Variations in Elevation Generally speaking, points that lie above the average elevation within a 1x1 km square will be somewhat windier than points that lie below it. A rule of thumb appropriate for Southeast Asia is that every 100 m increase in elevation above the average will result in an increase in the mean wind speed of 0.25 m/s, or
(4.1) zv ∆×≈∆ 0025.0
This formula is most applicable to small, isolated hills or ridges in otherwise flat terrain. It should be used with caution, if at all, in mountains where it is difficult to determine what the “average” elevation is, and where wind flows in any event can be very complex.
4.5.3. Variations in Roughness The roughness of the land surface – which is determined mainly by the height and type of vegetation and buildings – has an important impact on the mean wind speed at heights of interest for wind turbines. The MesoMap system assumes a certain roughness for each type of land cover in the land cover data base. As noted in section 3, the land cover assignments may be wrong in some places, and even if correct, the land cover and roughness may vary within a grid cell.
The following table provides approximate factors that can be used – with caution – to adjust the wind speed estimate at a particular location for different values of surface roughness.
Table 4.2 Wind Speed Adjustment Factors Roughness Height Above Ground Land Cover (cm) 65 m 30 m Lake or Ocean 0.2 1.05 0.95 Low grass or crops 2 1.02 0.89 High grass or crops 5 1.00 0.86 Low, sparse trees 12 0.98 0.82 Woods/Sparse Forest 40 0.94 0.76 Towns 75 0.91 0.71 High, dense forest 120 0.89 0.68 High, dense forest (15 m displacement height)
120 0.83 0.56
These factors may be used when the local surface roughness differs substantially from that indicated in the land cover map. (The CD-ROM that accompanies this atlas provides the elevation and surface roughness assumed by the model at each point in the map.) The corrected speed is the map speed multiplied by the factor from the table for the correct land cover, divided by the factor for the land cover assumed by the model. For instance, suppose the predicted wind
Wind Energy Resource Atlas of Southeast Asia 17
speed is 6.5 m/s for a tropical forest land cover, whereas the actual land cover is low, sparse trees. The corrected wind speed estimate would then be 1.789.0/98.05.6 =× m/s.
The factors in Table 4.2 were calculated on the assumption that the wind is in equilibrium with the surface roughness. When the wind encounters an abrupt change in surface roughness – for example, when it exits a forest to enter an open field – the wind profile will not fully reflect the smoother surface of the field for a distance of up to several hundred meters downwind of the change. For this reason the correction method described here should not be used for a clearing that is smaller than about 1000 m across. When in doubt, a meteorologist should be consulted.
4.5.4. Displacement Height An additional factor to consider is that the heights of the wind maps and in Table 4.2 may not always be the height above ground. Where the vegetation is very dense, the “effective ground level” is not the ground but the middle of the vegetation canopy because the wind flow is displaced upward. The level of zero wind, called the displacement height, is typically about 2/3 the height of the top of the vegetation.
In dense tropical forests the height above ground at which the predicted wind speed actually occurs may be as much as 15-20 m higher than indicated on the maps. Or, using the factors from the last row of Table 4.2, the speed at 65 m may be about 7% (1-0.83/0.89) lower than indicated on the map, while the speed at 30 m it may be 18% (1.0-0.56/0.68) lower.
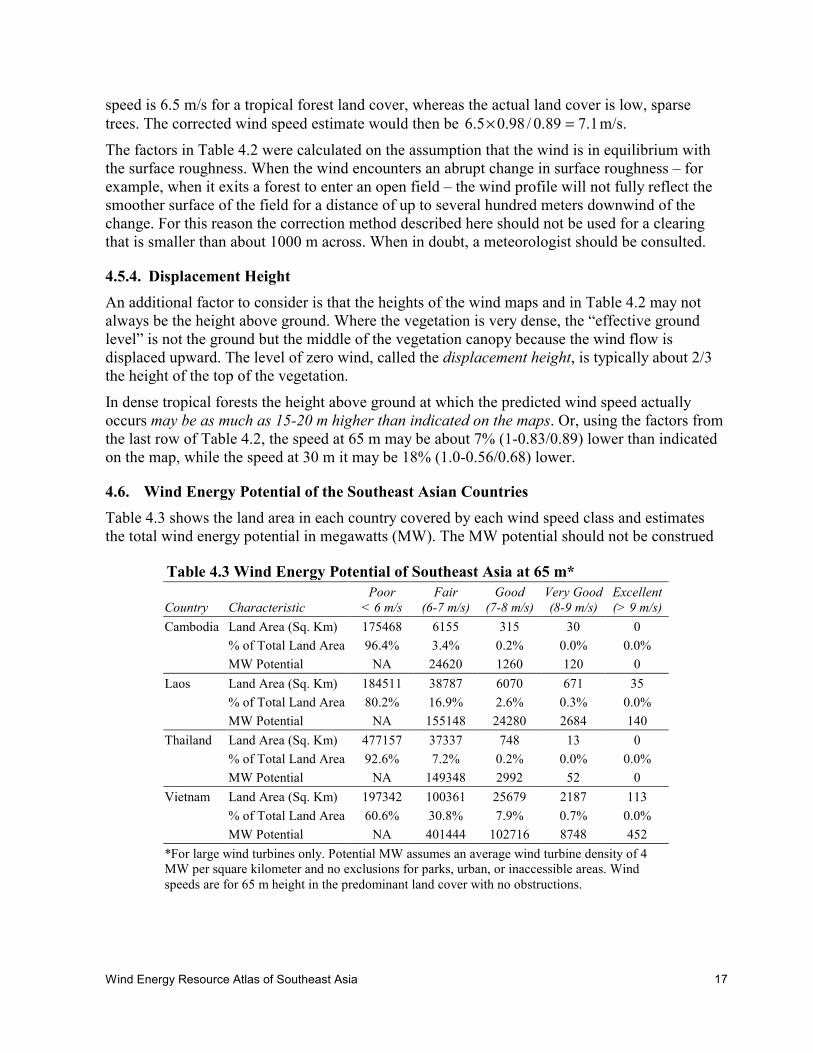
4.6. Wind Energy Potential of the Southeast Asian Countries Table 4.3 shows the land area in each country covered by each wind speed class and estimates the total wind energy potential in megawatts (MW). The MW potential should not be construed
Table 4.3 Wind Energy Potential of Southeast Asia at 65 m*
Country Characteristic Poor
< 6 m/s Fair
(6-7 m/s) Good
(7-8 m/s) Very Good(8-9 m/s)
Excellent (> 9 m/s)
Cambodia Land Area (Sq. Km) 175468 6155 315 30 0 % of Total Land Area 96.4% 3.4% 0.2% 0.0% 0.0% MW Potential NA 24620 1260 120 0 Laos Land Area (Sq. Km) 184511 38787 6070 671 35 % of Total Land Area 80.2% 16.9% 2.6% 0.3% 0.0% MW Potential NA 155148 24280 2684 140 Thailand Land Area (Sq. Km) 477157 37337 748 13 0 % of Total Land Area 92.6% 7.2% 0.2% 0.0% 0.0% MW Potential NA 149348 2992 52 0 Vietnam Land Area (Sq. Km) 197342 100361 25679 2187 113 % of Total Land Area 60.6% 30.8% 7.9% 0.7% 0.0% MW Potential NA 401444 102716 8748 452 *For large wind turbines only. Potential MW assumes an average wind turbine density of 4 MW per square kilometer and no exclusions for parks, urban, or inaccessible areas. Wind speeds are for 65 m height in the predominant land cover with no obstructions.

Wind Energy Resource Atlas of Southeast Asia 18
Table 4.4 Proportion of Rural Population in Each Small Wind Turbine Resource Class*
Country Poor
< 4 m/s Fair
(4-5 m/s) Good
(5-6 m/s) Very Good(6-7 m/s)
Excellent (> 7 m/s)
Cambodia 15% 79% 5% 1% 0% Laos 55% 32% 13% 0% 0% Thailand 26% 64% 9% 0% 0% Vietnam 29% 31% 34% 6% 1% *Proportion of rural population is estimated from the number of villages and towns in each wind resource class from the US National Imagery and Mapping Agency Vector Map (VMAP) database. Wind speeds are for 30 m height in cleared or open land with no obstructions.
as a realistic estimate of how much wind energy could be developed in the future, but rather as an extreme upper bound on the wind energy resource in each country. The much smaller developable potential depends on many factors, such as electricity demand, availability of transmission lines, road access, the economic and industrial infrastructure of the country, and a variety of topographical and siting constraints. Even so, it is clear that there may be significant opportunities for large-scale wind energy development, especially in Vietnam (because of its large resource potential), and possibly in Thailand (because of its well-developed energy infrastructure and moderate resource potential).
For small wind turbine applications, a different measure of wind resource potential is appropriate. Instead of megawatts, what is more important is the proportion of the rural population of each country that could be served by small turbines (Table 4.4). We estimate this from the number of towns and villages located within each resource class.
Villages located in very good or excellent wind areas are very rare in every country except Vietnam. About a third of the rural population of Vietnam and a sixth of that of Laos live in areas with a good wind resource for small wind turbines, whereas only 5% and 9% of the rural populations of Cambodia and Thailand do. These estimates do not consider the possibility that windier areas may be found outside of towns but still within a distance that could make them suitable for village power generation.
Wind Energy Resource Atlas of Southeast Asia 19
5. REGIONAL MAPS
The Southeast Asia atlas region is divided into 18 map tiles shown in Map 5.1. The coordinates are in meters in the universal transverse mercator projection (zone 48). Each regional map is described briefly below. The mean speed shown is at 65 m in all cases.
5.1.1. Tile A-1: Southern Malay Peninsula (West) There are areas of fair wind speed, reaching perhaps 6.5 m/s, at the highest elevations in this southernmost portion of Thailand. The mountains that run the length of the Malay Peninsula are at their lowest point here, with peak elevations of about 800 m. Off the mountains, wind speeds average about 4.5 m/s, which is too low for large-scale wind generation. Near the coast and offshore the mean speed increases to about 5-5.5 m/s. The better areas present fair to good opportunities for small wind turbines.
5.1.2. Tile A-2: Southern Malay Peninsula (East) The wind map for this section of the southernmost portion of Thailand shows no promising areas for large-scale wind energy. While there may be some localized sea breezes that are not fully resolved at the model grid scale, they are unlikely to increase mean wind speeds above 5.5 m/s at 65 m.
5.1.3. Tile B-1: Central Malay Peninsula The winds are stronger in this central portion of the Thai Malay Peninsula than to the south. The wind resource is rated as good (7.0-7.5 m/s) along the ridge tops, where the elevations range from 1100 to 1800 m. Access to these sites may pose a challenge, however, because of steep terrain and limited roads. Coastal winds become slightly stronger as one moves northward, reaching about 5.5 m/s around Chumphum. Near the shore the wind shear is moderated, so mean wind speeds at 30 m are probably fair (about 5 m/s). Wind speeds drop off quickly inland, however.
5.1.4. Tile B-2: Gulf of Thailand This region spans the Gulf of Thailand and touches land near Kampong Saom, Cambodia. Wind speeds are predicted to be good to very good on the high elevations at the southern end of the Domrei Mountains (maximum elevation about 1000 m), just inland of Kampong Saom. Those sites, if accessible, are also likely to be very attractive for small wind turbines in village power applications, with mean wind speeds at 30 m of 6.5-7 m/s. In the low-lying areas, the small-scale wind class is good with typical mean speeds at 30 m of 5 m/s.
5.1.5. Tile B-3: Southern Vietnam This region covers southern Vietnam including the Mekong delta to Ho Chi Minh City. Winds are good (typically 7.0-7.5 m/s) on exposed stretches of coast from the Mekong Delta northward and up to several kilometers inland (depending on the flatness and roughness of the terrain). Some of these coastal areas could present attractive opportunities for wind energy because of their accessibility and the presence of nearby demand centers including Ho Chi Minh City itself. The island of Con Son has very good winds (8-9 m/s in exposed locations). Clearly the Mekong
Wind Energy Resource Atlas of Southeast Asia 20
Delta area also presents opportunities for small wind generation, with mean speeds of 5.5-6.0 m/s in many coastal locations.
5.1.6. Tile C-1: Northern Malay Peninsula This part of the Malay Peninsula has good winds for large-scale wind generation along some mountain ridges. The mountain top due west of Phet Buri is around 1000 m in elevation and experiences average winds of about 7.5 m/s. Close to the shore, the mean speed may reach 5.5 m/s at 30 m, thus offering good prospects for small turbines, though it drops rapidly inland.
5.1.7. Tile C-2: Coastal Thailand and Cambodia Good winds of 7.0-8.0 m/s are found along the main ridgeline of the Krovanh Range (1000-1200 m) in southwestern Cambodia. The wind speed may exceed 8 m/s on the three highest mountain tops, Phnum Tumbot, Phnum Samkos, and Phnum Aoral, which range in elevation from 1600 m to 1800 m. Other than the high elevations – which may be inaccessible – the wind resource at 65 m is poor.
5.1.8. Tile C-3: Central Cambodia/South-Central Vietnam The very good winds on the mountains in south-central Vietnam are just visible at the eastern edge of this region. Good winds, however, are found on the relatively broad plateau to the southwest of the mountains near Boa Loc, at a moderate elevation of 800-1000 m. Winds speeds on this broad feature range from 7.0-7.5 m/s. A similar area is found in southeastern Cambodia due east of Kracheh, on the Vietnam border. Outside of these areas the winds are much weaker, although in the western foothills of south-central Vietnam they are potentially very suitable for small wind turbines. There is an interesting mountain pass about halfway between Pleiku and Buon Me Thuot, where the elevation is only about 500 m, but the mean wind speed at 65 m reaches 7.0 m/s. It is very likely that the wind is being channeled through this pass to some degree.
5.1.9. Tile C-4: South-Central Coastal Vietnam Very good to excellent winds of 8.0-9.5 m/s are found on the mountain and ridge tops in this part of Vietnam where the elevation typically ranges from 1600-2000 m. The accessibility of these sites may pose a severe challenge however. The mountains to the west of Qui Nhon and Tuy Hoa are less daunting. There the elevation is in the 1000-1200 m range and wind speeds are predicted to be 8.0-8.5 m/s.
The wind speed is ranked as good to very good in a number of areas near the coast. The peninsulas on either side of Phan Rang are of particular interest. These peninsulas are thrust out into the prevailing northeasterly offshore winds in a manner that maximizes the wind speed over moderately elevated terrain. The predicted speed range is 8.0-9.5 m/s. Low-lying areas near the shores of the peninsulas are also likely to be very windy. Looking north, the peninsulas around Tuy Hoa and Qui Nhon are progressively less well exposed, though near Tuy Hoa the mean speed is still rated as good category at about 7.5-7.8 m/s. Clearly, many areas offer exceptional promise for small-scale wind generation as well.
Wind Energy Resource Atlas of Southeast Asia 21
5.1.10. Tile D-1: West-Central Thailand Good winds are found on the mountain tops and ridges of the Tanem Range, where elevations reach a maximum of about 2000 m. The ridges of 1400-1600 m elevation to the southwest of Tak have a favorable orientation with respect to the prevailing westerly wind direction, resulting in good winds as well. Access to these sites is probably very difficult however as the mountain slopes are steep and there are few roads and transmission lines. On the other hand there is a mountain pass at 700-900 m elevation to the west of Tak which is traversed by a road and where the mean speed may reach about 6.5 m/s. Winds are poor throughout the broad valley to the east of Tak.
5.1.11. Tile D-2: East-Central Thailand The mountains of the Phang Hoe Range around Lomsak are typically 900-1100 m in elevation, though a few peaks reach 1600 m. The winds on exposed features are generally good (7.0-8.0 m/s), with ridges oriented northwest-southeast having the best wind resource relative to elevation. A prime example of such a ridge is the one lying half-way between Lomsak and Chaiyaphum. A fair to good wind resource for small wind turbines exists in the broad plains around Chaiyaphum and Selaphum.
5.1.12. Tile D-3: Southern Laos/North-Central Vietnam In this region the Giai Truong Son (Chaine Annamitique) runs along the border of north-central Vietnam and southern Laos. Several of the peaks rise above 1800 m. Since the chain is nearly perpendicular to the prevailing wind flow, the higher ridge tops experience very good (8.5-9.0 m/s) to excellent (9.0-9.5 m/s) winds. Once again, access to these sites may be very difficult. However, more accessible or developable areas with attractive resources may exist. There is in particular a broad mountain pass due west of Hue at the Vietnam-Laos border where the elevation ranges from 400 m to 800 m and the mean wind speed is good (7.0-8.0 m/s). Similar conditions are likely to be found on the tops of smaller ridges of 800-1200 m elevation to the east of the main Truong Son chain. For small wind turbines, the coastal plains to the north of Hue offer good opportunities, with mean speeds at 30 m of 5.5-6.0 m/s and possibly exceeding 6.0 m/s very near the coast.
5.1.13. Tile D-4: North-Central Coastal Vietnam This region includes a small portion of the north-central Vietnam coast around Quang Ngai and eastern foothills of the Truong Song. The coastal wind resource is mostly poor. Good winds are found on the mountain tops, which have a peak elevation of about 1100 m. However the mountains do not form as favorable a ridge as they do farther to the northwest.
5.1.14. Tile E-1: Northern Thailand The wind resource in this part of northern Thailand around Chiang Mai and Chiang Rai is mostly poor. The area cannot be considered, from a wind perspective, to be on the Southeast Asia peninsula but is rather within the influence of the main Asian land mass. Although there are numerous tall mountains in this area (especially to the west of Chiang Mai), the wind resource is at best fair to good on even the tallest mountain, the 2600 m Doi Inthanon.

Wind Energy Resource Atlas of Southeast Asia 22
5.1.15. Tile E-2: Northern Laos Much the same may be said of this section of northern Laos. The exception is the southeast corner of the region, which is the upper end of the Giai Truong Son (Chaine Annamitique). Winds here are generally fair to good at elevations of 800-1200 m.
5.1.16. Tile E-3: Northern Vietnam The coastal winds in the vicinity of Haiphong are generally fair, with mean speeds of 6.5-7.0 m/s. They may reach or exceed 7.0 m/s on some offshore islands and exposed hill tops, but drop rapidly inland. There are very good to excellent winds of 8-9 m/s on mountain tops of 1300-1800 m elevation at the Laos-Vietnam border to the southwest of Vinh; and likewise very good winds are found on the mountains at the extreme eastern border with China. Of special interest are the relatively low (700-1000 m) ridges and hills to the north and northeast of Haiphong, where the predicted wind speed reaches 7-8 m/s.
5.1.17. Tile F-2: Extreme Northern Laos and Vietnam As noted in the discussions of Regions E-1 and E-2, wind speeds are poor throughout this region and reach the fair or good categories only on the very highest peaks of 2500-3000 m elevation.
5.1.18. Tile F-3: Extreme Northern Vietnam This region is similar to Region F-1, with the exception of a relatively small mountain range in the lower right corner at the Vietnam-China border. There the mean speed is very good (> 8.0 m/s) on the ridge top at around 1200 m elevation.
Wind Energy Resource Atlas of Southeast Asia 23
6. RECOMMENDATIONS FOR FUTURE RESOURCE ASSESSMENTS
The Wind Energy Resource Atlas of Southeast Asia has revealed significant potential opportunities for both large-scale wind energy installations and small-scale village power. Many of these opportunities were previously unsuspected. Armed with the maps in the atlas, governments, investors and lenders, and developers alike can begin planning wind energy development and focus on areas of immediate promise.
The wind atlas should not be the last word on wind resources in Southeast Asia, however. Additional resource assessment efforts are needed to build on the foundation presented here. These activities should have two separate but related goals: to validate the results of the present study through a systematic measurement and analysis program, and to confirm the resource estimates in areas or at sites showing promise for wind development. The validation of the study as a whole will increase confidence in the findings among the region’s governments, the World Bank and other international lending agencies, and of course the wind industry itself. This can only enhance its usefulness. Furthermore, confirming the resource at promising locations will be an essential step to moving projects – especially those requiring a large investment of capital – from the conceptual to the development stage.11
In the following sections we provide some general recommendations and guidelines for future wind resource assessment efforts.
STEP 1: IDENTIFYING THE FOCUS REGIONS One of the first and most important tasks will be to select areas within each country in which to focus resource assessment efforts. Since the criteria to be applied may be quite varied (as discussed below), this phase may involve several agencies of each country’s government as well as representatives from the international institutions that may support future projects and non-profit organizations with relevant expertise and experience. In all cases, it will be essential to obtain advice from qualified and experienced wind energy experts.
Village Power. The criteria to be considered in selecting areas of interest for village power will depend on each country’s particular development needs and priorities. The wind resource itself may be of secondary importance in this calculation so long as it meets a reasonable minimum threshold. Instead, the emphasis may be placed (for example) on areas already targeted for village electrification or other agricultural and economic development programs, regions experiencing an acute shortage of power or exceptionally high electricity prices, or regions of deep poverty where critical needs such as refrigeration for vaccines and food preservation are not being met.
Large Wind Power. The criteria for large, grid-connected wind projects are both more specific and more demanding than for village power. Among the criteria are the following:
• Resource quality. Sites under consideration should have at least a “good” wind resource as defined in this study. From a cost-benefit perspective, the windier the better.
11 On-site measurements are an essential component of feasibility studies which must be performed to secure financing for utility-scale wind projects. For village power systems, on-site measurement will not be required for each installation, but would be useful as a precursor for a program involving many villages.

Wind Energy Resource Atlas of Southeast Asia 24
• Price of competing electric power. Privately financed wind projects will require an adequate sale price to cover their costs. Publicly financed projects should consider the cost or value of generating resources displaced by proposed wind plants.
• Site Accessibility. Many good sites on mountain tops and ridges may be inaccessible because of severe terrain and limited roads.
• Transmission Access and Grid Stability. Most wind projects require the construction of a new transmission line to connect to the existing grid. If the length of the line exceeds 10 or 20 km, the cost and risk of development increase substantially. An additional but equally important consideration is the stability of the power grid. Wind power adds a highly variable component to the power being fed into the grid and may not be appropriate on weak or overloaded grids without additional investments in grid support.
• Sensitivity to environmental and cultural values. Sites located in or very near protected parks and preserves or other ecologically sensitive areas, along with areas of special cultural or religious sensitivity, may be off-limits.
Many of these factors can be evaluated efficiently through the framework of a geographical information system (GIS).
STEP 2: SETTING STANDARDS One of the main lessons learned in the wind energy boom of the 1980s was that resource assessment programs that do not adhere to high standards often produce misleading results. Conforming to international standards of measurement and analysis will be critical to the success of future wind resource assessment efforts in Southeast Asia.
The exact standards to be met should be a subject for study, but some guidelines are offered here:
• Tower height. Standard wind resource assessment practice demands tall towers to minimize the effects of nearby obstacles and trees and to come as close as possible to the height of a wind turbine. A tower height of 30 m is recommended; 50 m is becoming the standard for large turbines.
• Redundant instruments. The use of redundant instruments at one height (usually the uppermost) is an important tool for screening out bad data and correcting for tower shadow. It also increases data recovery rates.
• Multiple heights. Where large wind turbines are being considered, the use of instruments at multiple heights is necessary for the accurate extrapolation of lower-level wind measurements to the turbine hub height (typically 50-80 m).
• Use of industry-standard equipment. A wide variety of instruments have been developed for measuring and recording wind speed and direction, but only a few are widely known and accepted in the wind industry. While other equipment types may be quite accurate, the use of industry-standard equipment will boost industry and investor confidence in the results of the measurement program. This does not mean that all the equipment used in a resource assessment program must be purchased abroad, however. Towers, in particular, can be manufactured locally to standard specifications.

Wind Energy Resource Atlas of Southeast Asia 25
• Operations and maintenance. To ensure success throughout its duration, the measurement program should follow a documented operations and maintenance plan that diligently applies quality-control procedures. The plan should encompass technician training, a complete manual, a spare parts inventory, and periodic performance reviews and corrections.
• Data recovery and validation. A frequent data collection schedule (such as weekly or twice monthly) is important to achieving high data recovery rates and avoiding long periods of missing data due to equipment malfunction. A target of at least 90% recovery should be established. Once the data are collected, they should be subjected to industry-standard tests for validity.
• Duration of monitoring. Sites should be monitored for at least one full year. Two or three years may be required for large-scale wind projects considering that there is a lack of reliable and consistent long-term surface wind measurements that could be used to adjust short-term measurements to the climate norm.
STEP 3: DEFINING SCOPE AND BUDGET OF THE MEASUREMENT PROGRAM Although it is certainly possible to spend large sums of money on a wind measurement program, it should not be necessary to do so to meet the twin objectives of the proposed resource assessment program. Indeed, a measurement program that envisioned monitoring a very large number of sites would raise the concern that quality was being sacrificed for scale. It is better to monitor 10 sites according to rigorous standards than 100 sites using unreliable equipment and techniques.
The accuracy of the wind atlas can be efficiently verified through “spot checks” of the wind resource in a variety of locations – some coastal, some in the mountains, some in the north, some in the south, and so on. By and large, the towers should be placed in areas that show at least some promise for wind development. However this rule may occasionally be broken where there is a suspicion that the wind resource may be underestimated in the maps, for example, in some coastal areas where the sea breeze may not have been fully resolved at the model grid scale.
Additional considerations may come into play. Sites chosen for wind monitoring should be reasonably accessible so the towers can be brought in and the sites can be easily visited for maintenance and data collection. This criterion may narrow the choice of mountain sites that can be effectively monitored. However, those that are not accessible for monitoring may not make very good sites for wind power projects anyway.
The overall cost of the program will depend directly on the number of sites being monitored. In Western countries, the cost to purchase a fully equipped monitoring station, including 50 m tower with three levels of sensors and redundant sensors on the top level, is about US $10,000. When the cost of installation and data collection and reporting for one year are included, the total comes to roughly $25,000. The labor cost in Southeast Asia will be much lower if in-country personnel carry out most or all of the work. On the other hand, the final equipment cost may be higher because of import duties. Thus, a cost of $20,000 per site is probably a reasonable estimate for budgeting purposes. If the measurement program is directed only at village power, the cost per station can be somewhat lower. The cost of training local personnel, conducting final data analysis and reporting, and program management should be added to this estimate.
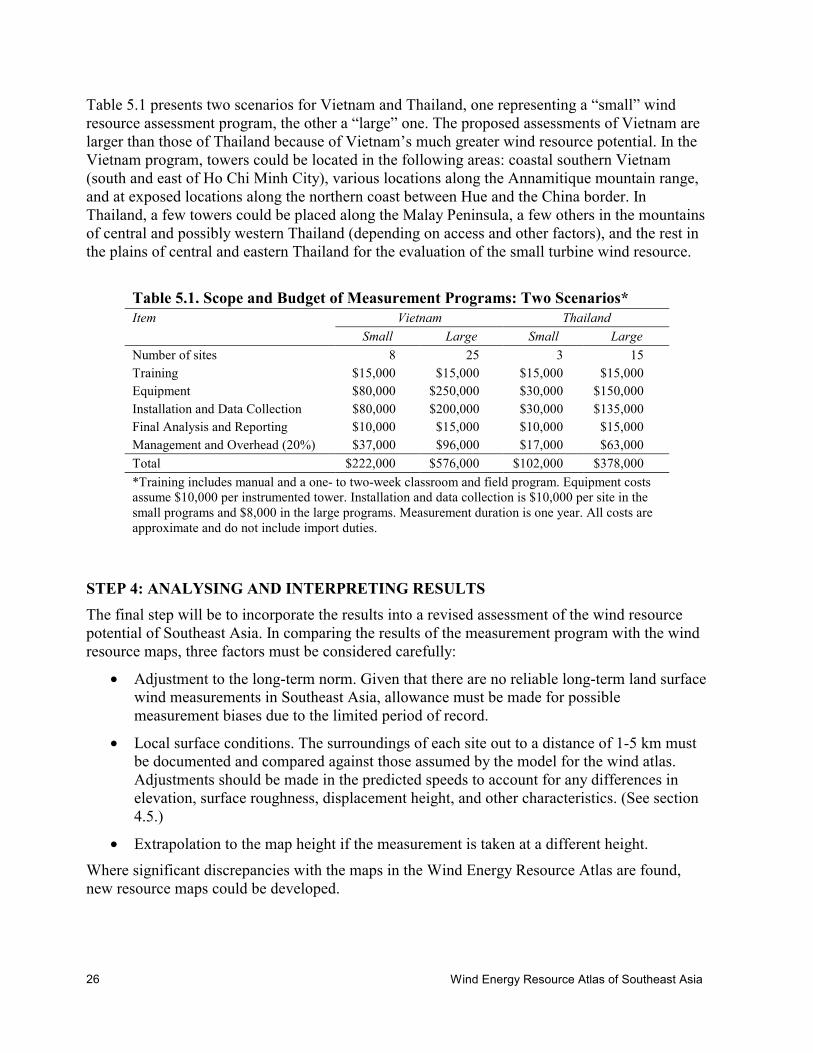
Wind Energy Resource Atlas of Southeast Asia 26
Table 5.1 presents two scenarios for Vietnam and Thailand, one representing a “small” wind resource assessment program, the other a “large” one. The proposed assessments of Vietnam are larger than those of Thailand because of Vietnam’s much greater wind resource potential. In the Vietnam program, towers could be located in the following areas: coastal southern Vietnam (south and east of Ho Chi Minh City), various locations along the Annamitique mountain range, and at exposed locations along the northern coast between Hue and the China border. In Thailand, a few towers could be placed along the Malay Peninsula, a few others in the mountains of central and possibly western Thailand (depending on access and other factors), and the rest in the plains of central and eastern Thailand for the evaluation of the small turbine wind resource.
Table 5.1. Scope and Budget of Measurement Programs: Two Scenarios* Item Vietnam Thailand Small Large Small Large Number of sites 8 25 3 15 Training $15,000 $15,000 $15,000 $15,000 Equipment $80,000 $250,000 $30,000 $150,000 Installation and Data Collection $80,000 $200,000 $30,000 $135,000 Final Analysis and Reporting $10,000 $15,000 $10,000 $15,000 Management and Overhead (20%) $37,000 $96,000 $17,000 $63,000 Total $222,000 $576,000 $102,000 $378,000 *Training includes manual and a one- to two-week classroom and field program. Equipment costs assume $10,000 per instrumented tower. Installation and data collection is $10,000 per site in the small programs and $8,000 in the large programs. Measurement duration is one year. All costs are approximate and do not include import duties.
STEP 4: ANALYSING AND INTERPRETING RESULTS The final step will be to incorporate the results into a revised assessment of the wind resource potential of Southeast Asia. In comparing the results of the measurement program with the wind resource maps, three factors must be considered carefully:
• Adjustment to the long-term norm. Given that there are no reliable long-term land surface wind measurements in Southeast Asia, allowance must be made for possible measurement biases due to the limited period of record.
• Local surface conditions. The surroundings of each site out to a distance of 1-5 km must be documented and compared against those assumed by the model for the wind atlas. Adjustments should be made in the predicted speeds to account for any differences in elevation, surface roughness, displacement height, and other characteristics. (See section 4.5.)
• Extrapolation to the map height if the measurement is taken at a different height.
Where significant discrepancies with the maps in the Wind Energy Resource Atlas are found, new resource maps could be developed.


![Physical Geography of Southeast Asia...Asia. [Students may refer to a student atlas or textbook] Place an X on population clusters in Southeast Asia. ©2012, TESCCC Resources on the](https://static.fdocuments.in/doc/165x107/5f33d12f1a35ef23ec175d4c/physical-geography-of-southeast-asia-asia-students-may-refer-to-a-student.jpg)