Wind Energy Resource, Advantages, and Constraints Dr. Richard Nelson Engineering Extension.
33
Wind Energy Resource, Advantages, and Constraints Dr. Richard Nelson Engineering Extension
-
Upload
blake-wood -
Category
Documents
-
view
221 -
download
0
Transcript of Wind Energy Resource, Advantages, and Constraints Dr. Richard Nelson Engineering Extension.
Wind EnergyResource, Advantages, and
Constraints
Dr. Richard Nelson
Engineering Extension

Renewable Resourcesand Technologically Viable End-
uses
Wind - electricity and hydrogen production
No Greenhouse Gas Emissions
Insurance Against Conventional Fossil-based Price Risk No Sulfur Dioxide (SO2),
Nitrous Oxide (NOx), or Mercury Emissions
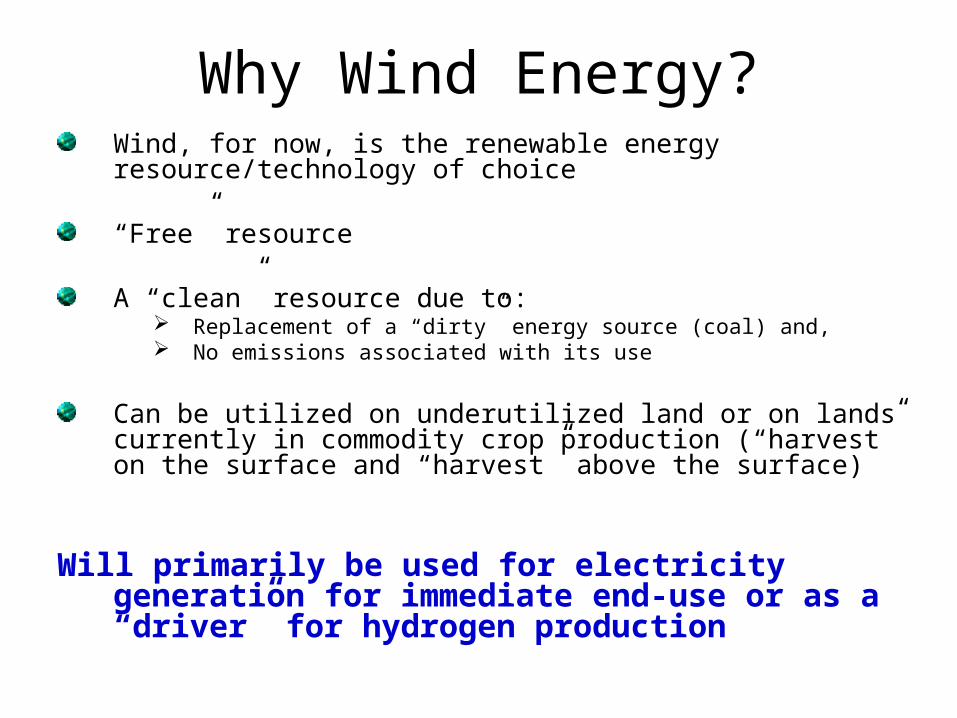
Why Wind Energy?Wind, for now, is the renewable energy resource/technology of choice
“Free” resource
A “clean” resource due to: Replacement of a “dirty” energy source (coal) and, No emissions associated with its use
Can be utilized on underutilized land or on lands currently in commodity crop production (“harvest” on the surface and “harvest” above the surface)
Will primarily be used for electricity generation for immediate end-use or as a “driver” for hydrogen production
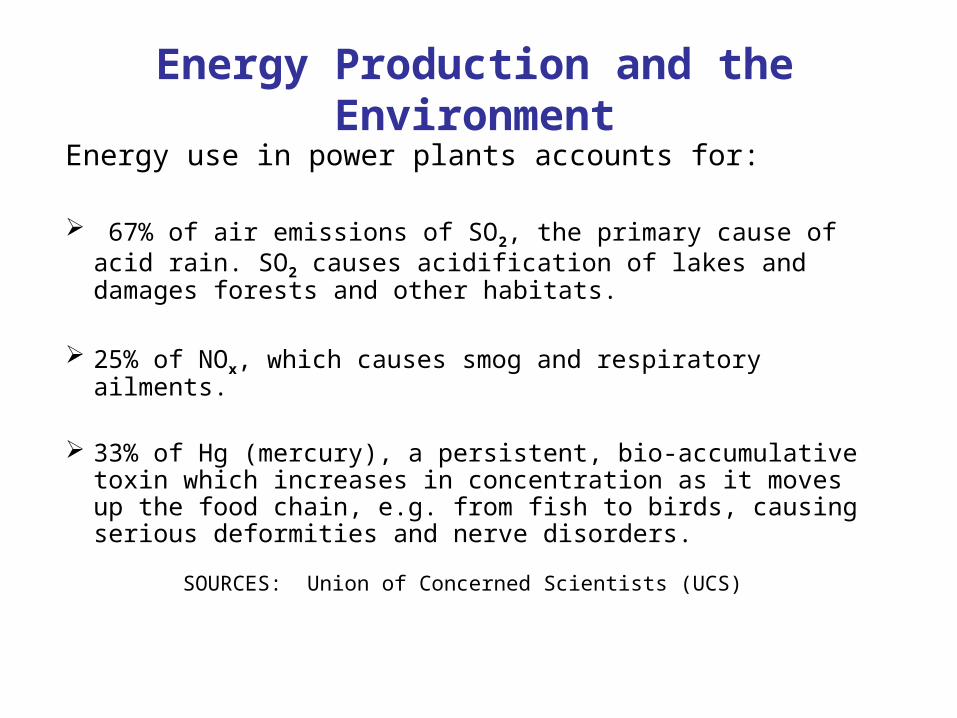
Energy Production and the Environment
Energy use in power plants accounts for:
67% of air emissions of SO2, the primary cause of acid rain. SO2 causes acidification of lakes and damages forests and other habitats.
25% of NOx, which causes smog and respiratory ailments.
33% of Hg (mercury), a persistent, bio-accumulative toxin which increases in concentration as it moves up the food chain, e.g. from fish to birds, causing serious deformities and nerve disorders.
SOURCES: Union of Concerned Scientists (UCS)

Wind Energy Benefits
No air emissions
No fuel to mine, transport, or store
No cooling water
No water pollution
No wastes

Wind Resources in the United States
Wind resources are characterized by wind-power density classes, ranging from class 1 (the lowest) to class 7 (the highest).
Good wind resources (class 3 and above) which have an average annual wind speed of at least 13 miles per hour, are found along the east coast, the Appalachian Mountain chain, the Great Plains, the Pacific Northwest, and some other locations.
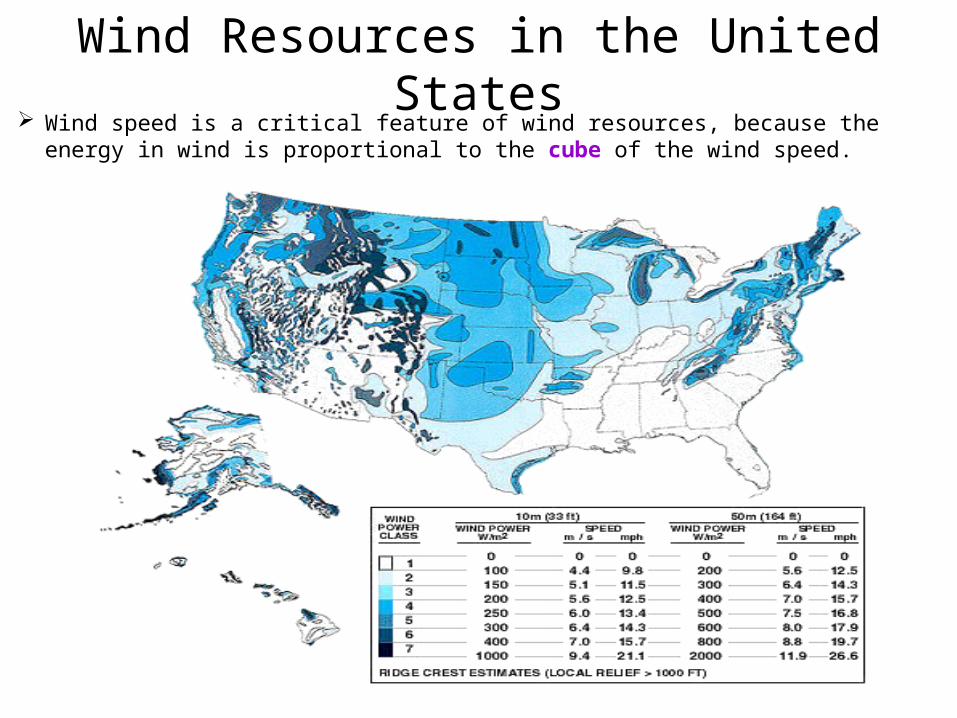
Wind Resources in the United States Wind speed is a critical feature of wind resources, because the
energy in wind is proportional to the cube of the wind speed.

Kansas Wind Potential
Kansas is one of the three best wind states in the country
Total “windy” land equals more than 108,000 square kilometers (about 1/2 of state)
Total Energy Potential = 1.07 trillion kWh or 121,900 MWa
Most of that potential probably won’t be developed . . .

Wind Energy Basics
Physical & Engineering Aspects

Wind Power EquationP = ½ * air density * Area Swept by Rotor * Wind Speed3
P = ½ * ρ * A * V3
1) Power in the wind is correlated 1:1 with area and is extremely sensitive to wind speed (the cubic amplifies the power significantly)
2) If the wind speed is twice as high, it contains 23 = 2 x 2 x 2 = 8 times as much energy
3) A site with 16 mph average wind speed will generate nearly 50% more electricity and be more cost effective than one with 14 mph average wind speed (16*16*16) / (14*14*14) = 1.4927
4) Therefore, it “pay$” to hunt for good wind sites with better wind speeds

Energy from the Wind Turbine output drives wind economics and output is a strong function of wind
speed
Wind speed increases with height above the ground Power = 1/2 × (air density) × (area) × (wind speed)³
Energy in the wind increases as height increases (theoretically)
V2/V1 = (H2/H1)1/7
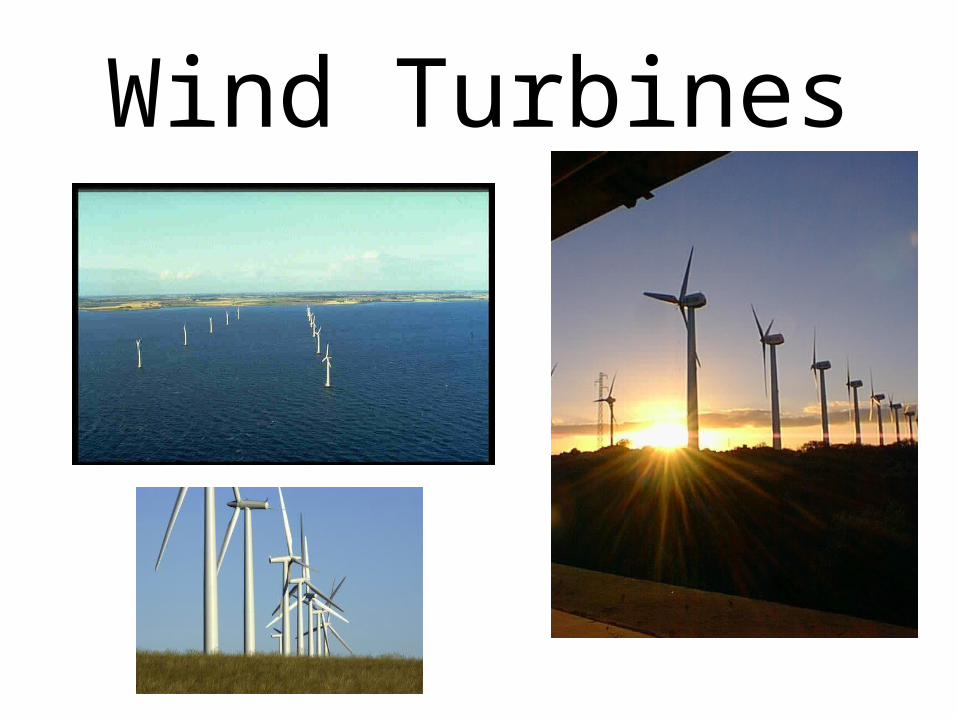
Wind Turbines
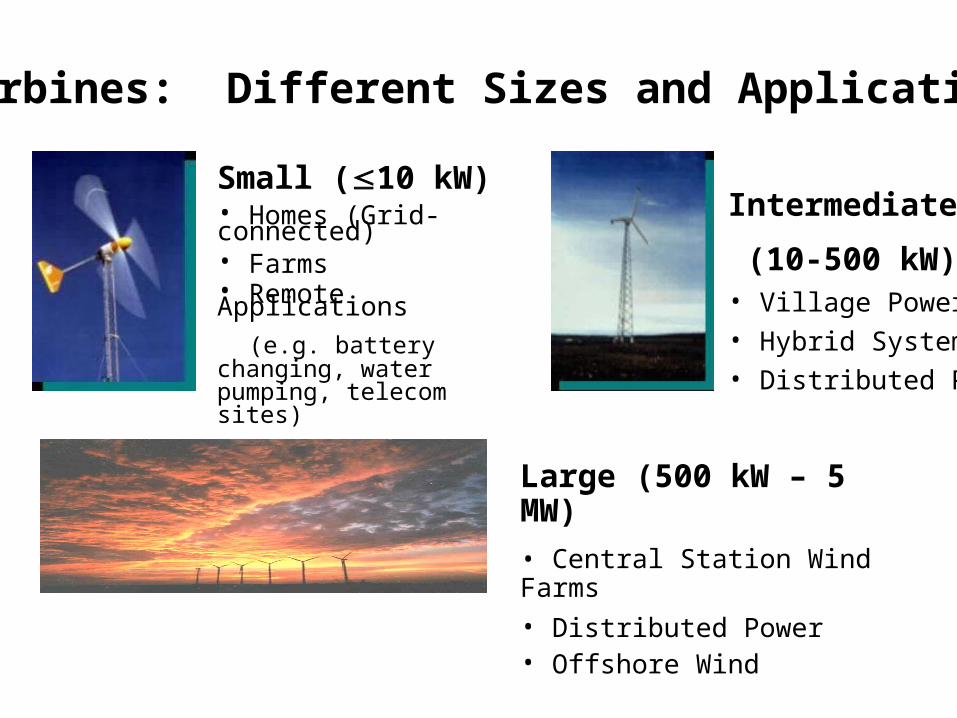
Turbines: Different Sizes and Applications
Small (10 kW)• Homes (Grid-connected)• Farms• Remote Applications
(e.g. battery changing, water pumping, telecom sites)
Intermediate
(10-500 kW)• Village Power• Hybrid Systems• Distributed Power
Large (500 kW – 5 MW)
• Central Station Wind Farms
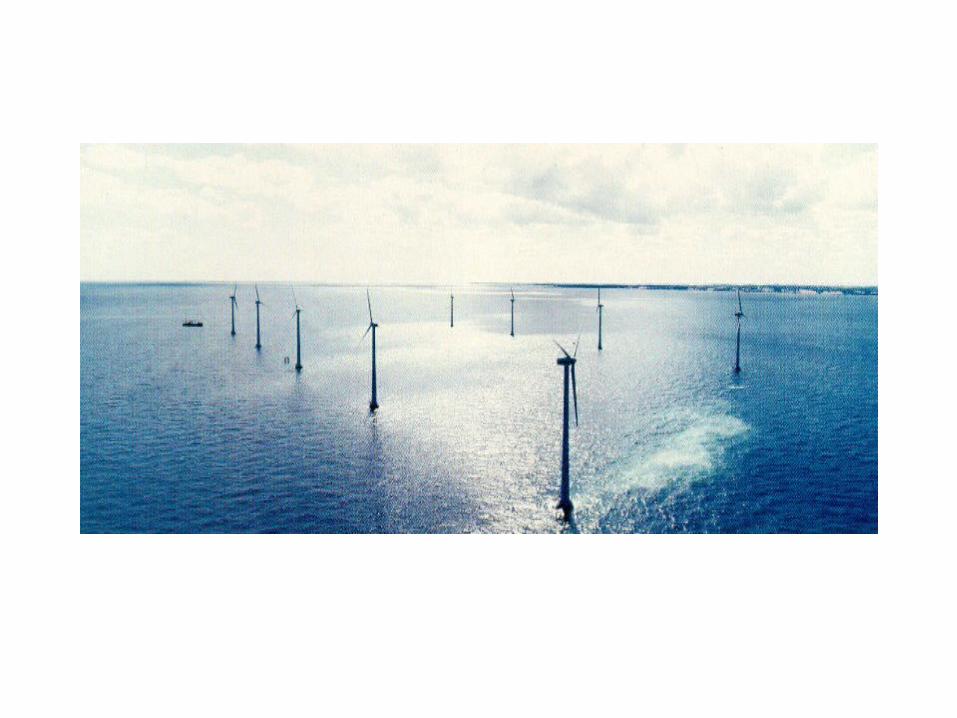
• Distributed Power• Offshore Wind

Large Wind Systems
Range in size from 100 kW to 5 MW
Provide wholesale bulk power
Require 13-mph average wind sites
Technology OverviewLarge Wind Projects
Over 98-99% availability
Can deliver power for less than 5 cents/kWh (with Production Tax Credit) in many locations
~6,000 MW to be installed nationwide at end of 2003
In 2004, will generate about 3x Vermont’s total use
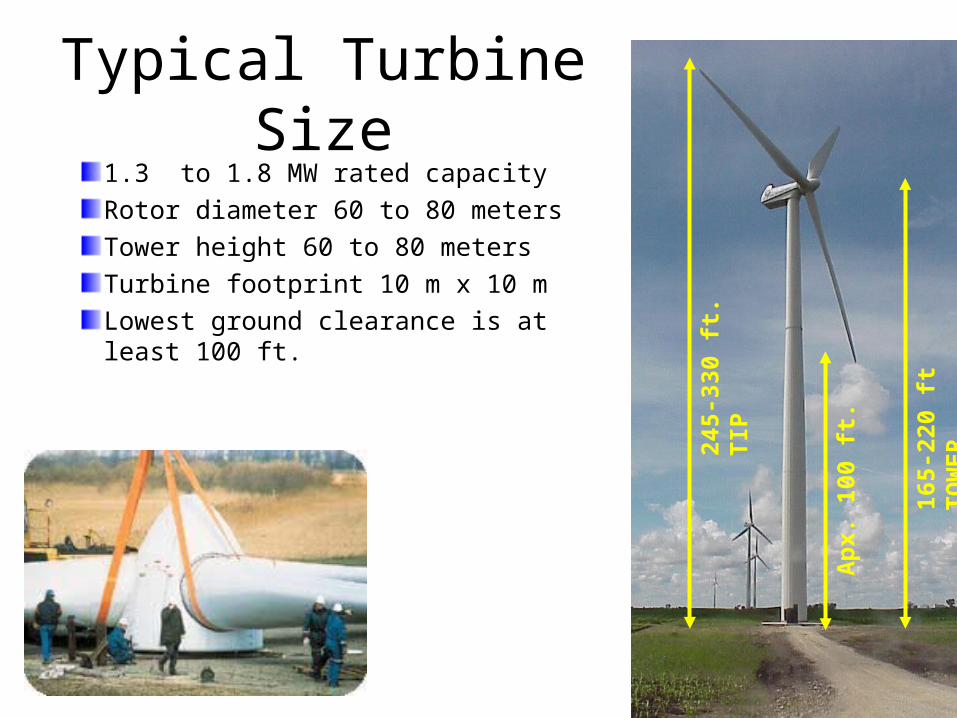
Typical Turbine Size1.3 to 1.8 MW rated capacity
Rotor diameter 60 to 80 meters
Tower height 60 to 80 meters
Turbine footprint 10 m x 10 m
Lowest ground clearance is at least 100 ft.
165-
220
ft T
OW
ER
245-
330
ft. T
IP
Ap
x. 1
00 f
t.

Next Generation Wind Turbines
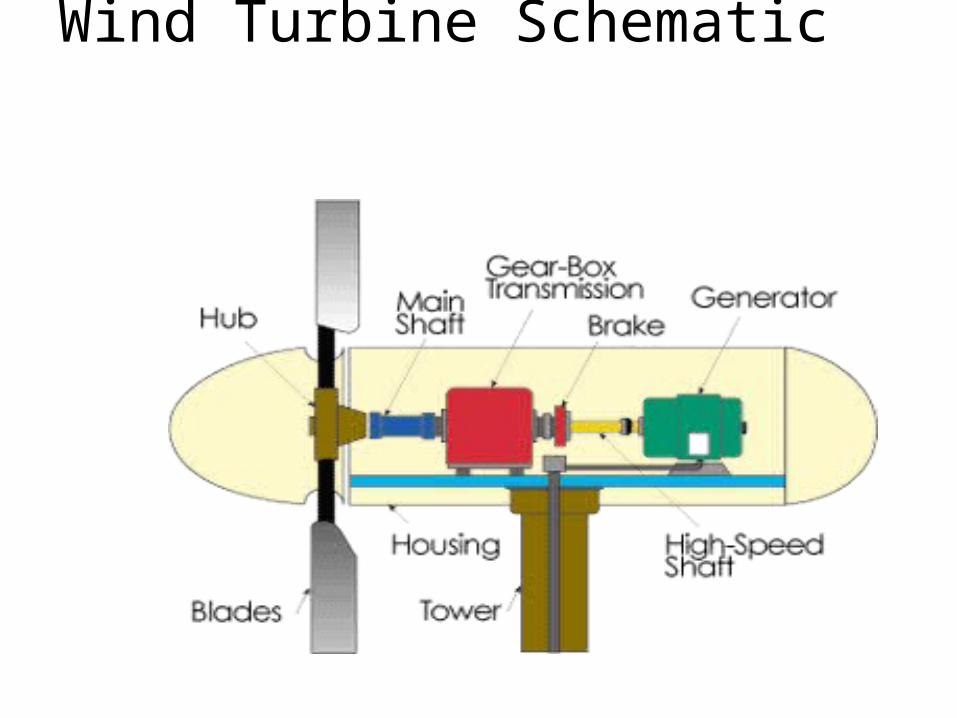
Wind Turbine Schematic
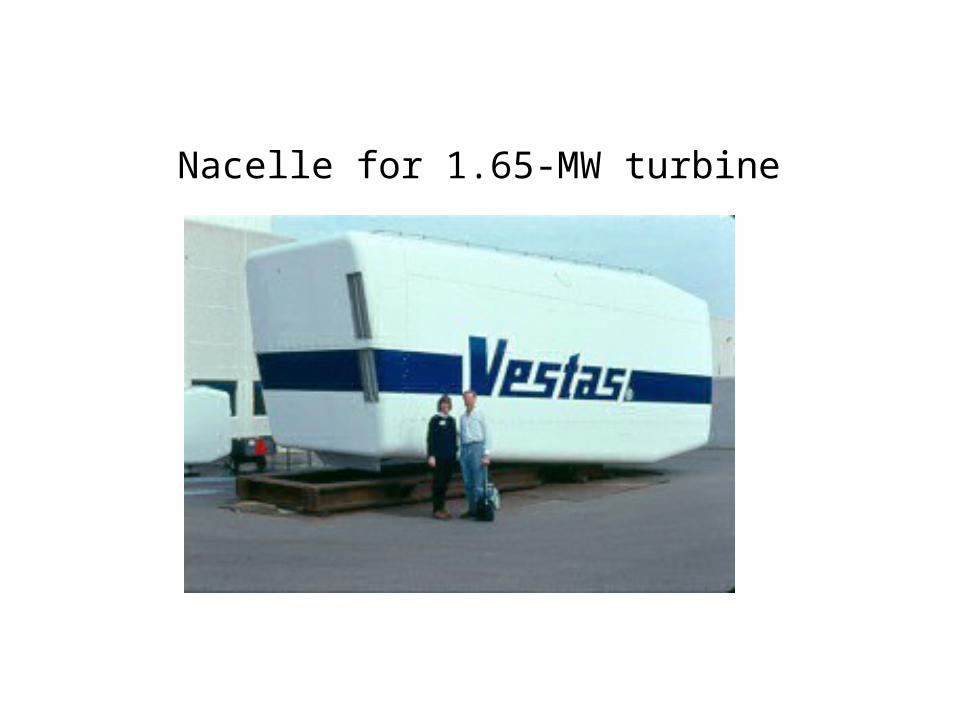
Nacelle for 1.65-MW turbine

Cross section of blade for 1.65-MW turbine
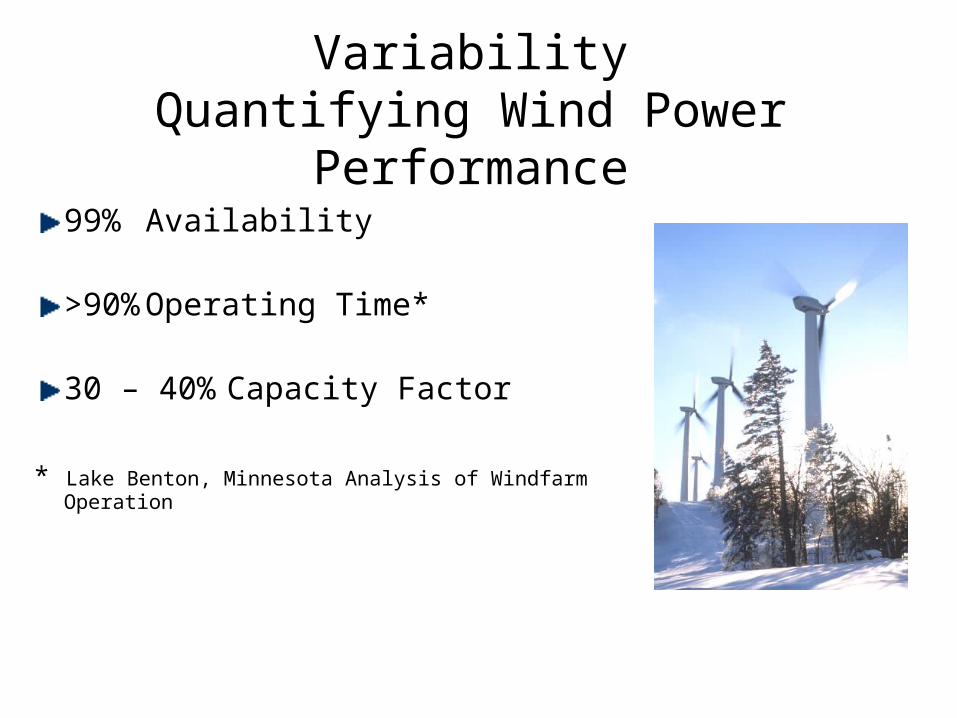
VariabilityQuantifying Wind Power Performance
99% Availability
>90% Operating Time*
30 – 40% Capacity Factor
* Lake Benton, Minnesota Analysis of Windfarm Operation
Expected Output/Capacity Factor
The capacity factor is simply the wind turbine's actual energy output for the year divided by the energy output if the machine operated at its rated power output for the entire year
A reasonable capacity factor would be 0.25 to 0.30. A very good capacity factor would be 0.40
Capacity factor is very sensitive to the
average wind speed

Power Curves
The turbine would produce about 20% of its rated power at an average wind speed of 15 miles per hour (or 20 kilowatts if the turbine was rated at 100 kilowatts).
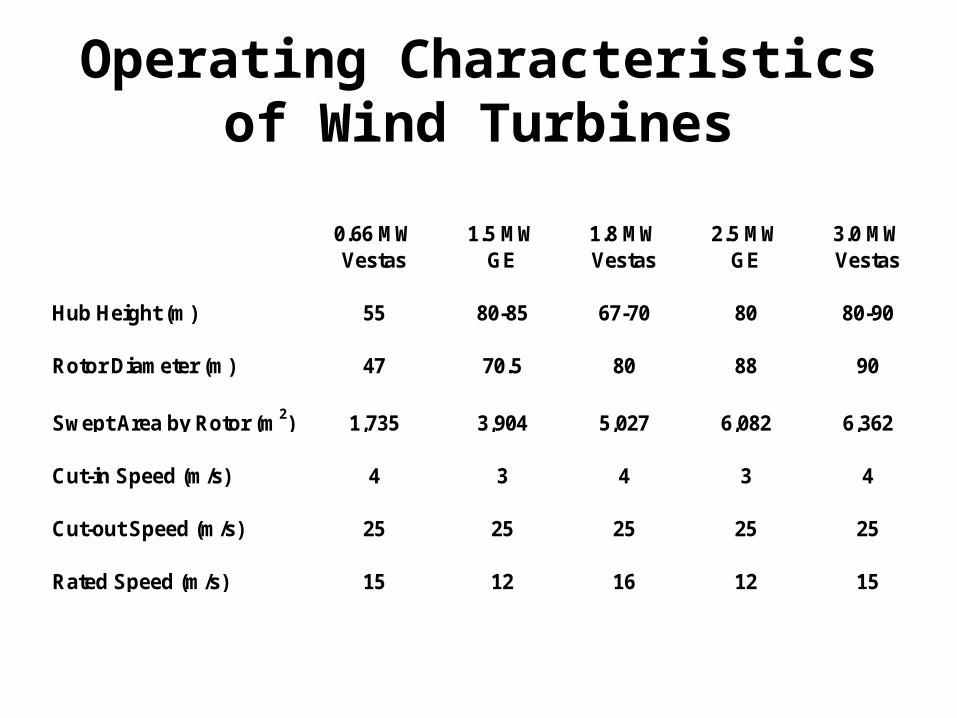
Operating Characteristics of Wind Turbines
0.66 MW 1.5 MW 1.8 MW 2.5 MW 3.0 MWVestas GE Vestas GE Vestas
Hub Height (m) 55 80-85 67-70 80 80-90
Rotor Diameter (m) 47 70.5 80 88 90
Swept Area by Rotor (m2) 1,735 3,904 5,027 6,082 6,362
Cut-in Speed (m/s) 4 3 4 3 4
Cut-out Speed (m/s) 25 25 25 25 25
Rated Speed (m/s) 15 12 16 12 15
“Value” of Wind Energy
The value of a wind turbine or wind farm depends upon many factors
locationterrainwind speed = f(location, terrain)cost of competing energy sourcerate structure of competing energy source

Wind Insures Against Fuel Price Risk
Platts “conservatively estimates that generating electricity from renewable sources can ultimately save consumers more than $5/MWh (1/2¢ per kW-h) by eliminating fuel price risk”*
*4/8/03 announcement re “Power Price Stability: What’s it Worth?”
Value of domestic fuel source (wind) would have a direct benefit on the Kansas/community
Wind energy “Fuel” is inflation-proof; therefore impervious to fuel price hikes
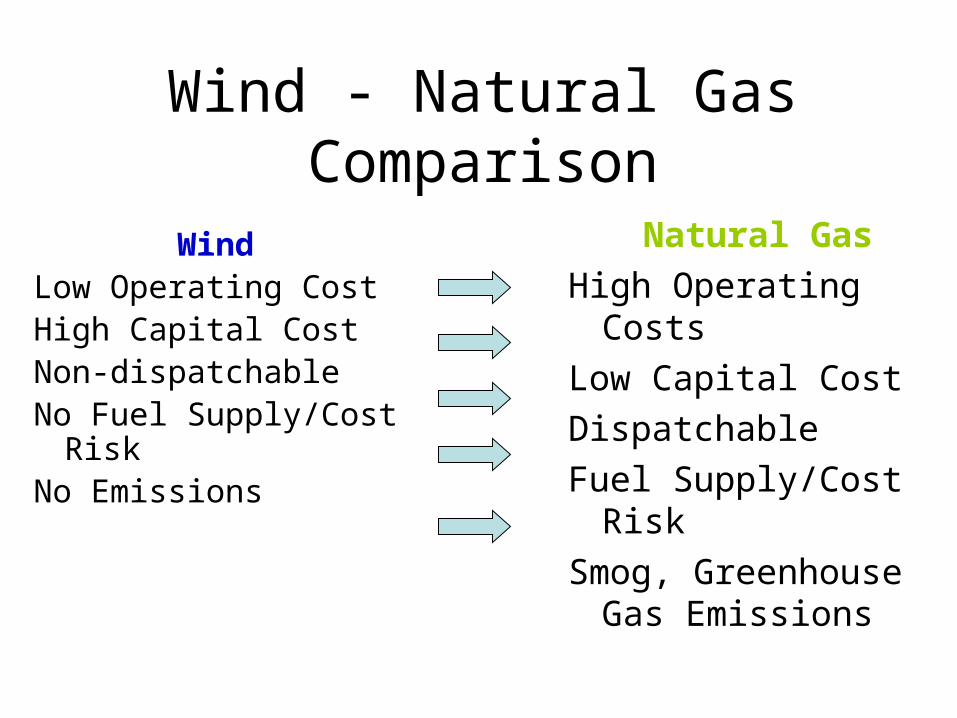
Wind - Natural Gas Comparison
WindLow Operating CostHigh Capital CostNon-dispatchableNo Fuel Supply/Cost
RiskNo Emissions
Natural Gas
High Operating Costs
Low Capital Cost
Dispatchable
Fuel Supply/Cost Risk
Smog, Greenhouse Gas Emissions
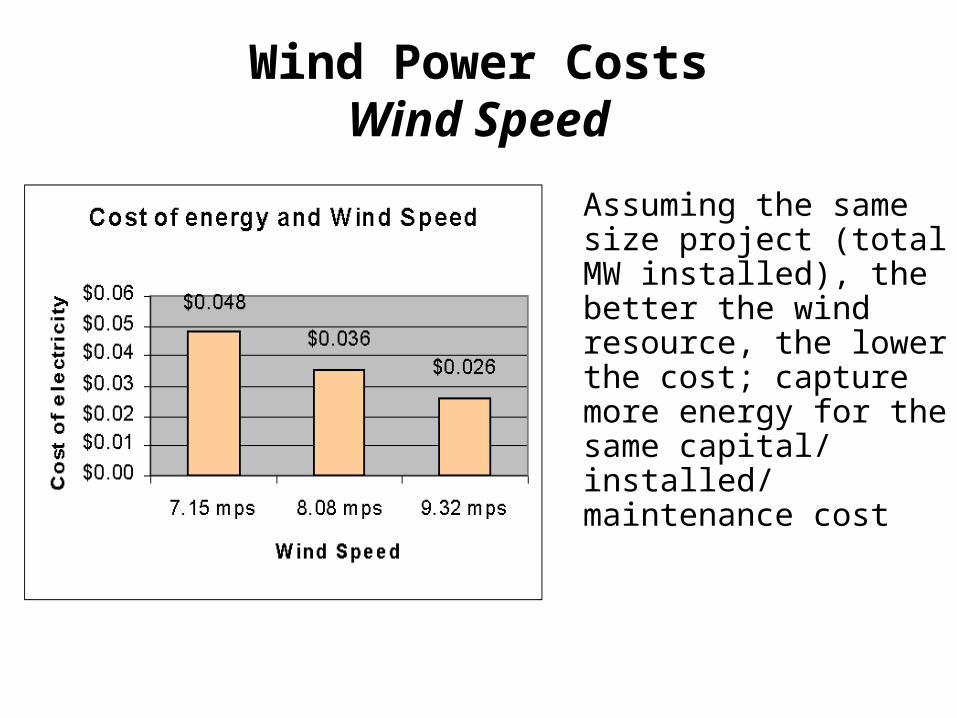
Wind Power CostsWind Speed
Assuming the same size project (total MW installed), the better the wind resource, the lower the cost; capture more energy for the same capital/ installed/ maintenance cost

Wind Power CostsProject Size
Assuming the same wind speed, a larger wind farm is more economical; economy-of-scale associated with wind farm installation

Wind Power Isn’t Perfect
Wind Power output varies over time; it isn’t dispatchable
Wind Power is location-dependent (rural vs. urban where it is needed most)
Wind Power is transmission-dependent for tie-in to the grid
Wind Power has environmental impacts (pro / con)
Wind Power can only meet part of the electrical load
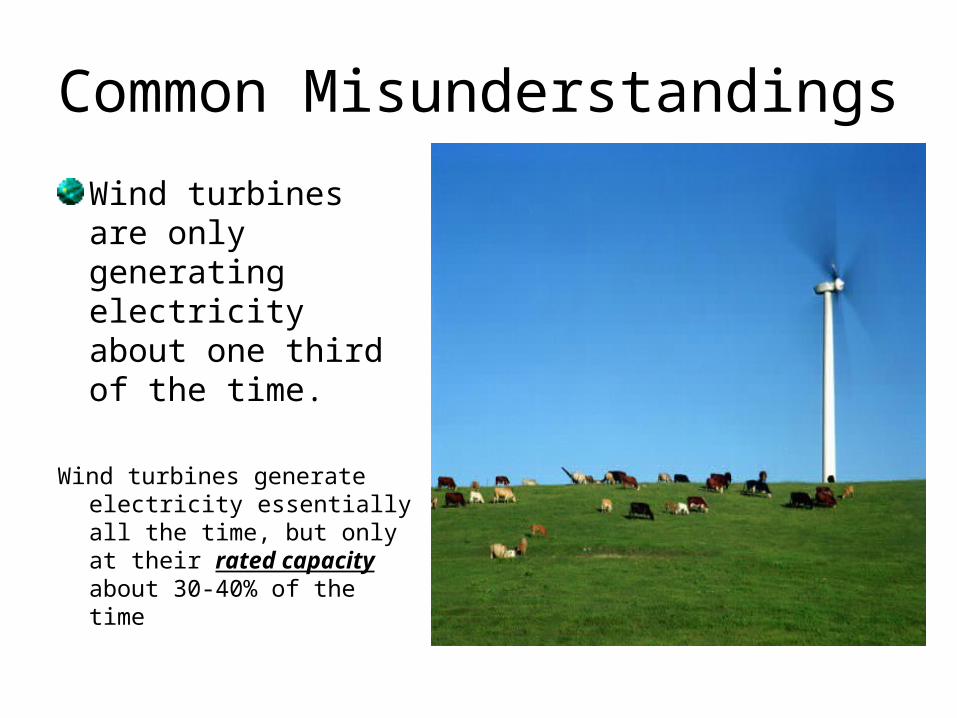
Common Misunderstandings
Wind turbines are only generating electricity about one third of the time.
Wind turbines generate electricity essentially all the time, but only at their rated capacity about 30-40% of the time

Wind Web Sites
• www.awea.org
• www.wwea.org
• www.windpower.org