WinBUGS Demo Saghir A. Bashir Amgen Ltd, Cambridge, U.K. Email: [email protected] 4 th...
50
WinBUGS Demo WinBUGS Demo Saghir A. Bashir Saghir A. Bashir Amgen Ltd, Cambridge, U.K. Amgen Ltd, Cambridge, U.K. Email: [email protected] Email: [email protected] 4 4 th th January 2001 January 2001
-
Upload
arnold-tucker -
Category
Documents
-
view
216 -
download
1
Transcript of WinBUGS Demo Saghir A. Bashir Amgen Ltd, Cambridge, U.K. Email: [email protected] 4 th...

WinBUGS DemoWinBUGS Demo
Saghir A. BashirSaghir A. Bashir Amgen Ltd, Cambridge, U.K.Amgen Ltd, Cambridge, U.K.
Email: [email protected]: [email protected]
44thth January 2001 January 2001

OutlineOutline
IntroductionIntroduction BUGS and WinBUGSBUGS and WinBUGS Graphical ModelsGraphical Models DoodleBUGSDoodleBUGS Example - SimulationExample - Simulation Power calculationPower calculation SummarySummary

IntroductionIntroduction
Bayesian Inference Using Gibbs SamplingBayesian Inference Using Gibbs Sampling• BUGSBUGS
Analysis of Complex ModelsAnalysis of Complex Models
Bayesian MethodsBayesian Methods
Markov Chain Monte Carlo IntegrationMarkov Chain Monte Carlo Integration• Useful when no closed form existsUseful when no closed form exists
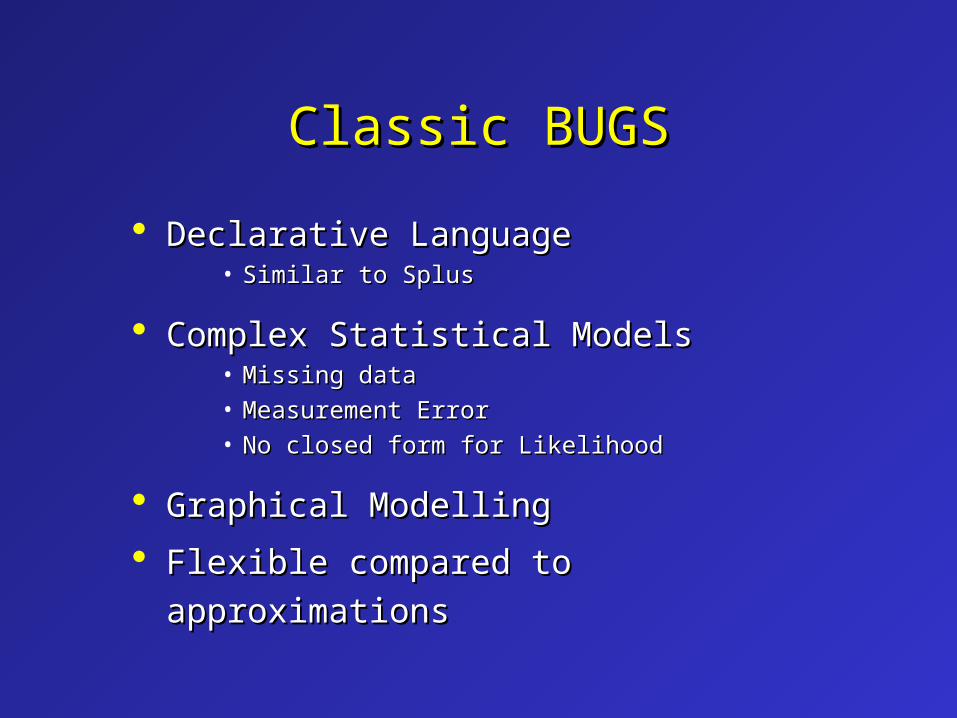
Classic BUGSClassic BUGS
Declarative Language Declarative Language • Similar to Splus Similar to Splus
Complex Statistical ModelsComplex Statistical Models• Missing dataMissing data• Measurement ErrorMeasurement Error• No closed form for LikelihoodNo closed form for Likelihood
Graphical ModellingGraphical Modelling
Flexible compared to Flexible compared to
approximationsapproximations

WinBUGSWinBUGS
Similar to Classic BUGSSimilar to Classic BUGS• Plus new methodological developmentsPlus new methodological developments
Graphical representation of modelGraphical representation of model• DoodleBUGSDoodleBUGS
Menu Control of sessionMenu Control of session
Cut and paste to other packagesCut and paste to other packages

BUGS and WinBUGSBUGS and WinBUGS
No data management facilityNo data management facility• Why reinvent the wheel?Why reinvent the wheel?
““Easy” interface with other Easy” interface with other packagespackages• R and SplusR and Splus• Stata Stata (S. Bashir)(S. Bashir)
Simple analysis of outputSimple analysis of output
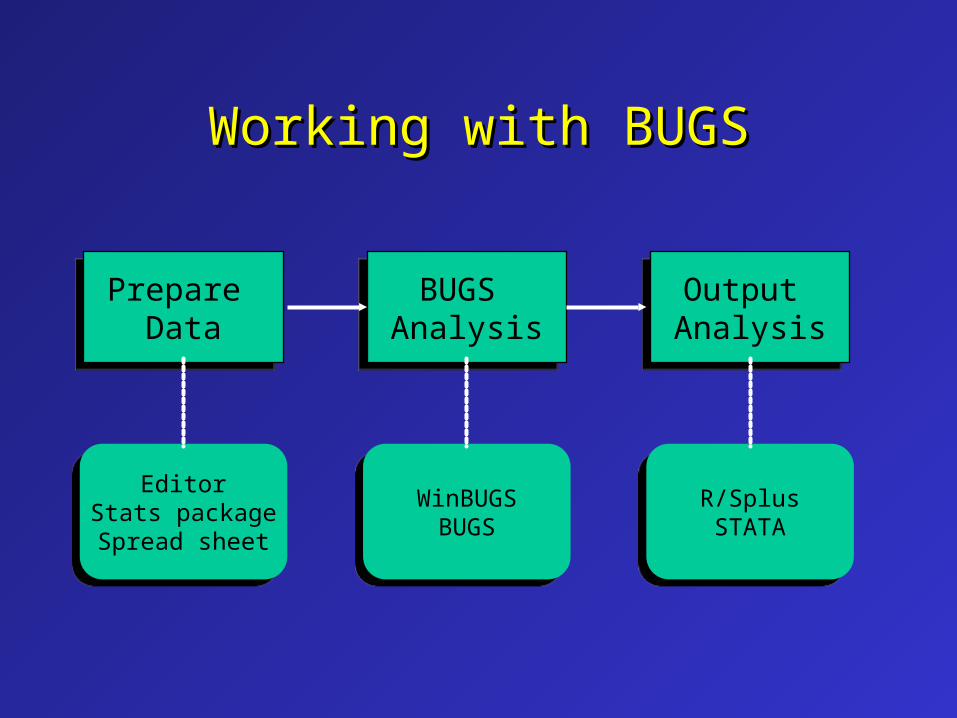
Working with BUGSWorking with BUGS
Output AnalysisOutput Analysis
R/SplusSTATA
Prepare Data
Prepare Data
EditorStats packageSpread sheet
BUGS Analysis
BUGS Analysis
WinBUGSBUGS

Graphical ModelsGraphical Models
Complex multivariate probability Complex multivariate probability modelsmodels• RepresentationRepresentation• VisualisationVisualisation
Graphs...Graphs...• simplify complex modelssimplify complex models• communicate structure of the problemcommunicate structure of the problem• provide basis for computationprovide basis for computation

WinBUGSWinBUGS
BUGS languageBUGS language
DoodleBUGSDoodleBUGS• Used for the purposed of this Demo.Used for the purposed of this Demo.
WinBUGS is currently free from:WinBUGS is currently free from:• http://www.mrc-bsu.cam.ac.uk/bugs/http://www.mrc-bsu.cam.ac.uk/bugs/• Register to get full version accessRegister to get full version access
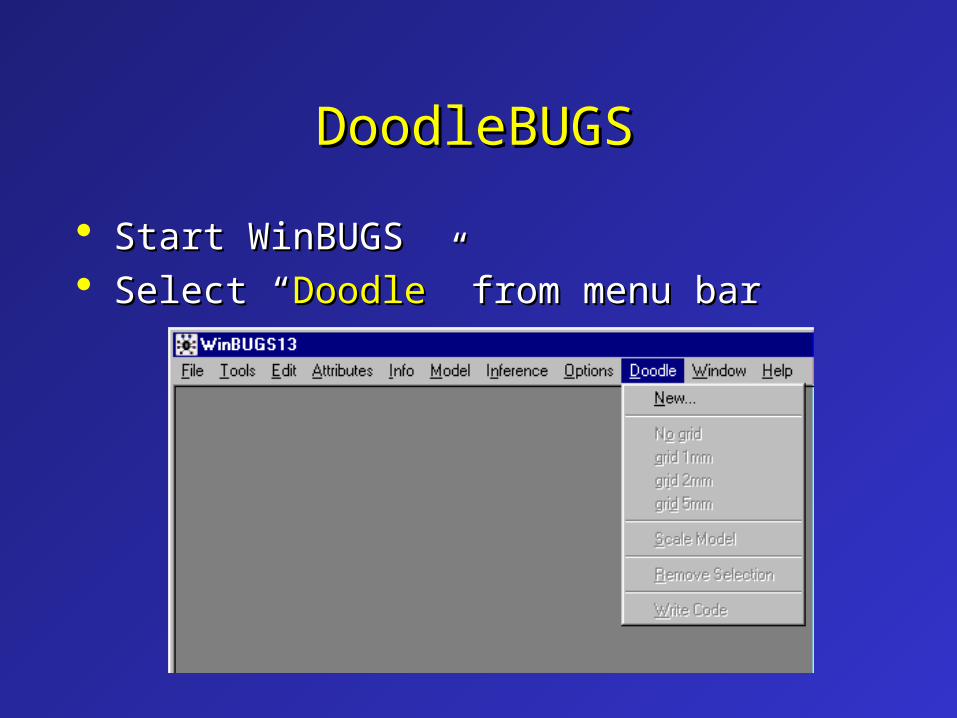
DoodleBUGSDoodleBUGS
Start WinBUGSStart WinBUGS Select “Select “DoodleDoodle” from menu bar” from menu bar
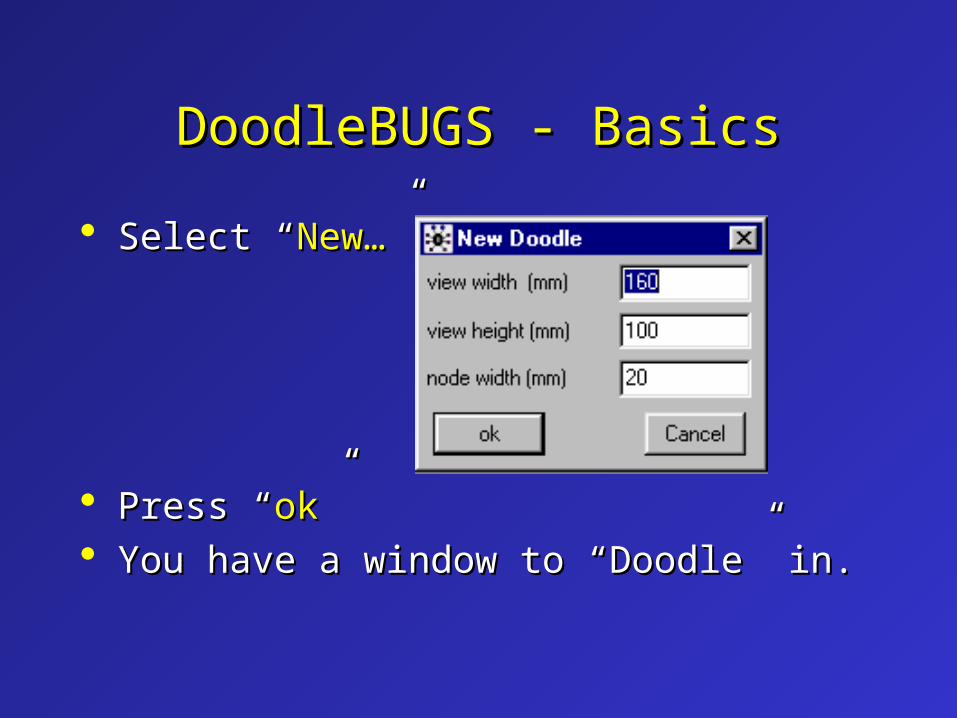
DoodleBUGS - BasicsDoodleBUGS - Basics
Select “Select “New…New…” ”
Press “Press “okok”” You have a window to “Doodle” in.You have a window to “Doodle” in.
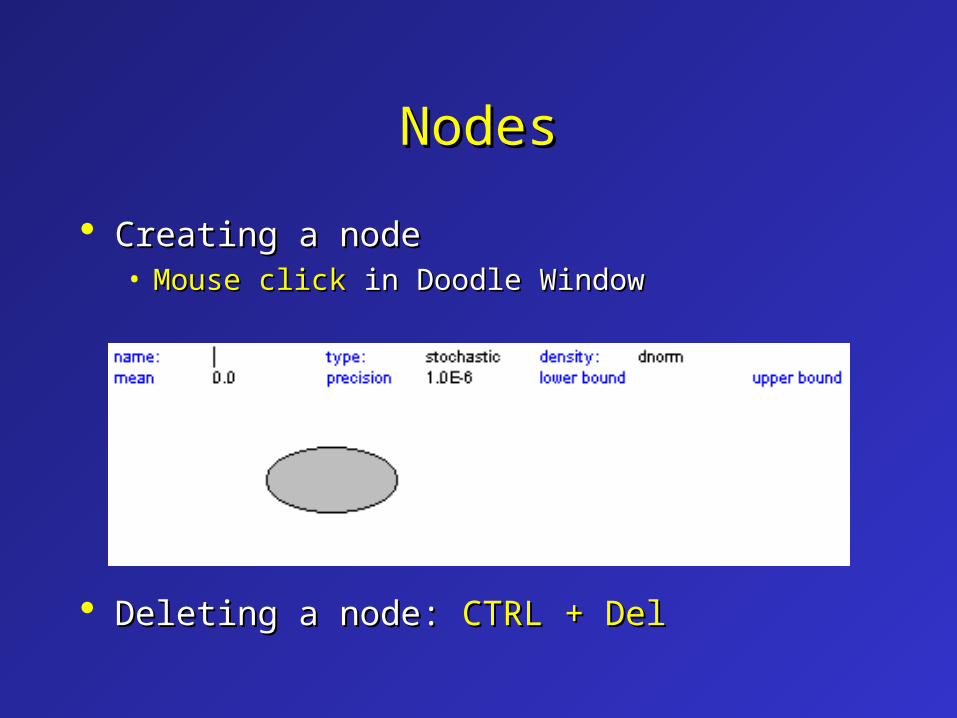
NodesNodes
Creating a node Creating a node • Mouse clickMouse click in Doodle Window in Doodle Window
Deleting a node: Deleting a node: CTRL + DelCTRL + Del
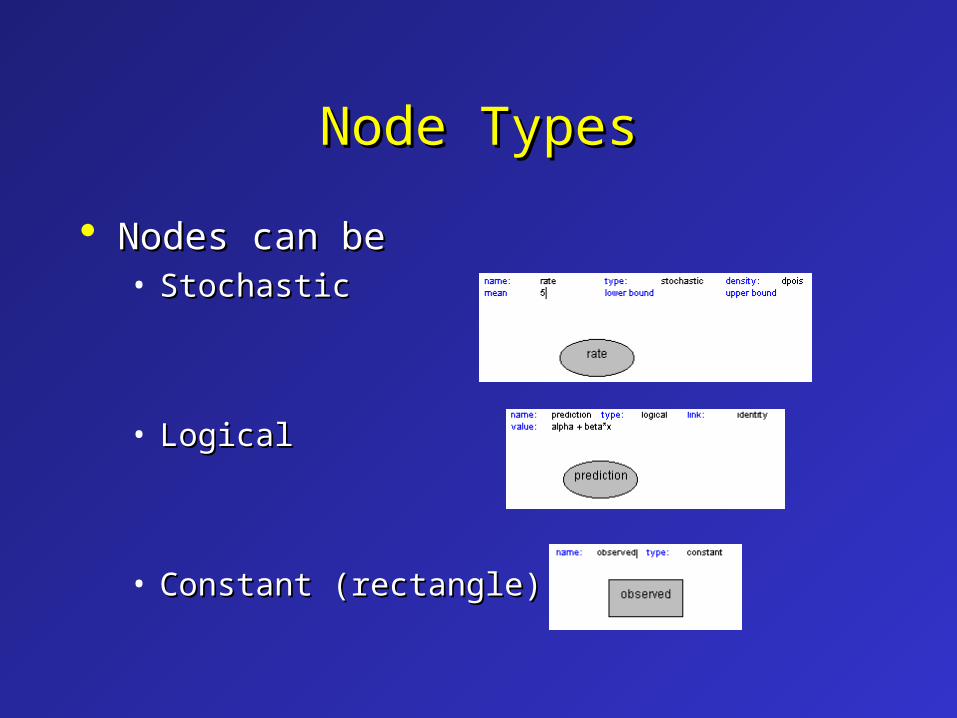
Nodes can beNodes can be• Stochastic Stochastic
• LogicalLogical
• Constant (rectangle)Constant (rectangle)
Node TypesNode Types

Example - SimulationExample - Simulation
LetLet• r1 ~ Bin (0.25, 250)r1 ~ Bin (0.25, 250)• r2 ~ Bin (0.35, 150)r2 ~ Bin (0.35, 150)
Calculate p: common proportion for r1 & r2Calculate p: common proportion for r1 & r2
p = (r1+r2)/400p = (r1+r2)/400
Classical p = 0.2875 Classical p = 0.2875
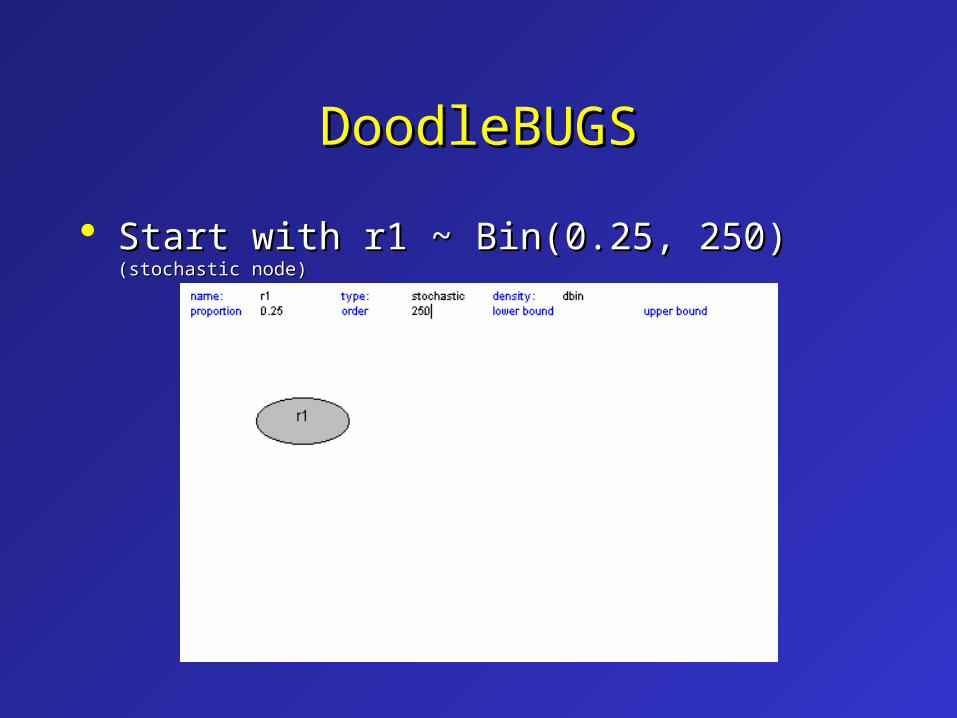
DoodleBUGSDoodleBUGS
Start with r1 ~ Bin(0.25, 250) Start with r1 ~ Bin(0.25, 250) (stochastic node)(stochastic node)

DoodleBUGSDoodleBUGS
Add r2 ~ Bin(0.35, 150)Add r2 ~ Bin(0.35, 150) (stochastic node)(stochastic node)
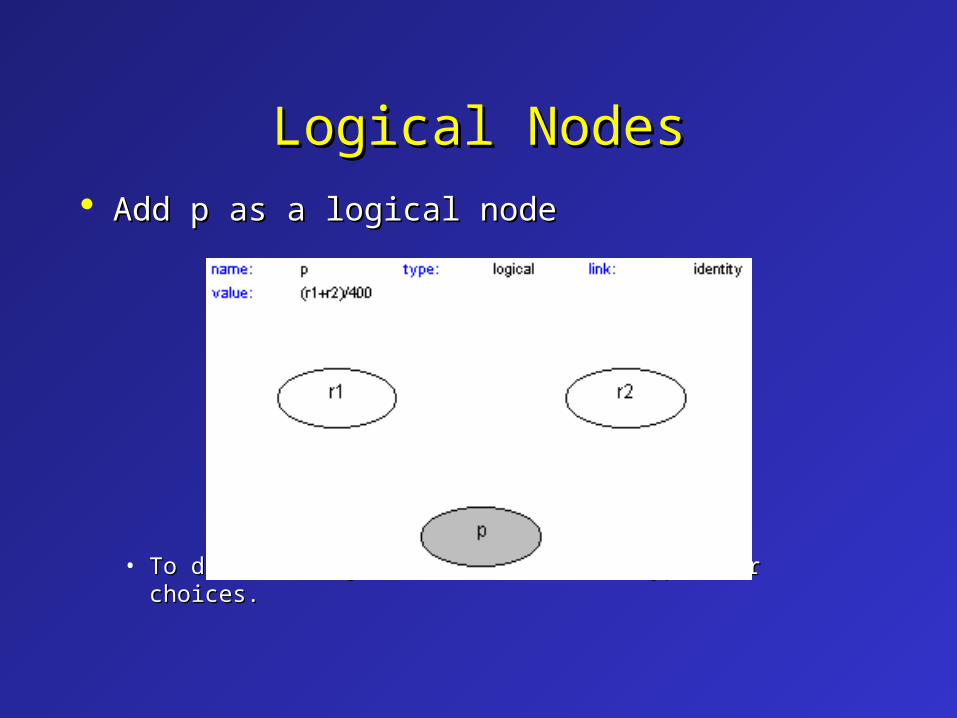
Logical NodesLogical Nodes Add p as a logical nodeAdd p as a logical node
• To define a logical node click on “To define a logical node click on “typetype” for choices.” for choices.

Logical FunctionsLogical Functions
Add “edges” for the logical relationshipAdd “edges” for the logical relationship
• Whilst node p is highlighted, Whilst node p is highlighted, CTRL + clickCTRL + click in “parent in “parent nodes” r1 and r2 (hollow arrows nodes” r1 and r2 (hollow arrows logical function) logical function)
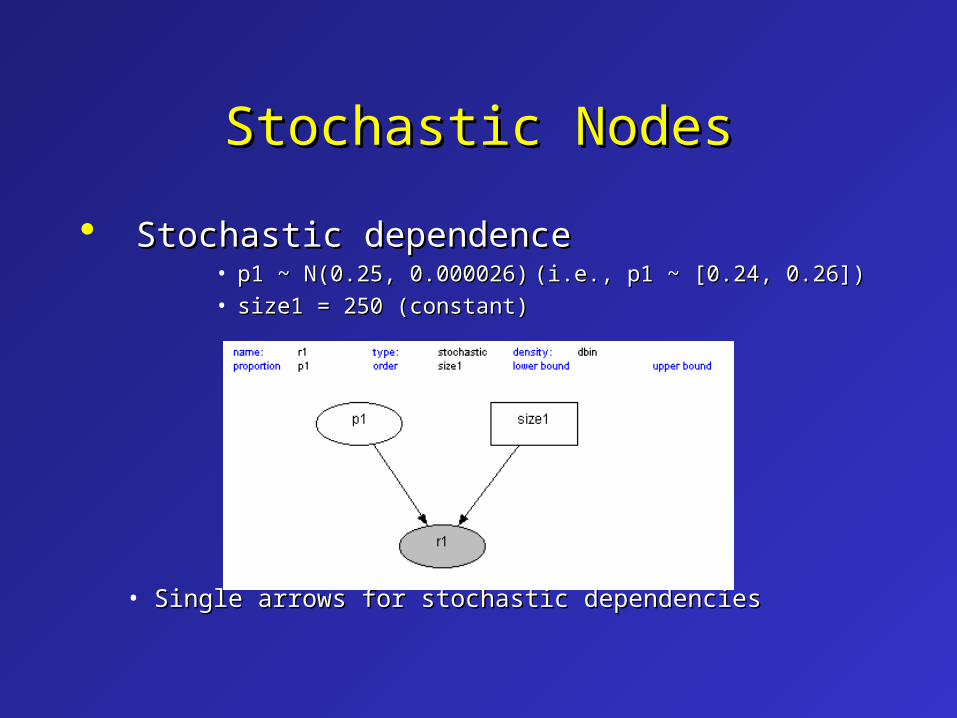
Stochastic NodesStochastic Nodes
Stochastic dependenceStochastic dependence• p1 ~ N(0.25, 0.000026)p1 ~ N(0.25, 0.000026) (i.e., p1 ~ [0.24, 0.26])(i.e., p1 ~ [0.24, 0.26])• size1 = 250 (constant)size1 = 250 (constant)
• Single arrows for stochastic dependenciesSingle arrows for stochastic dependencies

Normal DistributionNormal Distribution
NoteNote the Normal distribution in BUGS is defined as the Normal distribution in BUGS is defined as N (mean, precision) where N (mean, precision) where precision = 1/varianceprecision = 1/variance
• NoteNote that we can define upper and lower bounds so that that we can define upper and lower bounds so that the proportion is between 0 and 1.the proportion is between 0 and 1.

DoodleBUGS ModelDoodleBUGS Model
Let us add these stochastic Let us add these stochastic dependencies to our “logical” modeldependencies to our “logical” model

DoodleBUGS ModelDoodleBUGS Model
What is our model?What is our model?
• r1 ~ Bin (p1, size1)r1 ~ Bin (p1, size1)
• p1 ~ N (0.25, 0.000026)p1 ~ N (0.25, 0.000026)
• size1 = 250size1 = 250
• r2 ~ Bin (p2, size2)r2 ~ Bin (p2, size2)
• p2 ~ N (0.35, 0.000026)p2 ~ N (0.35, 0.000026)
• size2 = 150size2 = 150
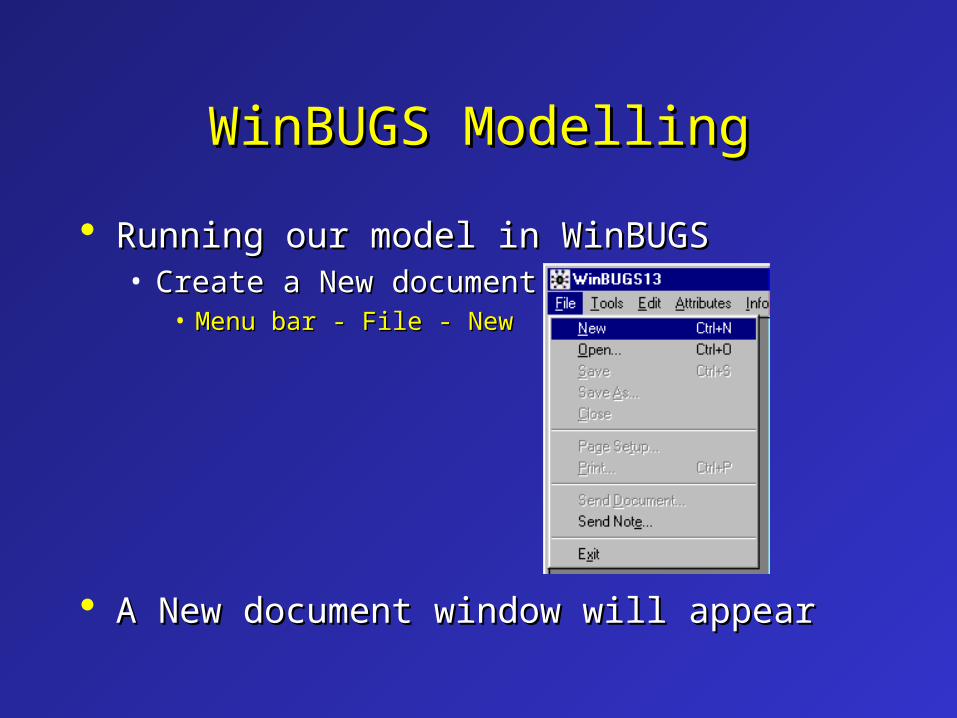
WinBUGS ModellingWinBUGS Modelling
Running our model in WinBUGSRunning our model in WinBUGS• Create a New document Create a New document
• Menu bar - File - NewMenu bar - File - New
A New document window will appearA New document window will appear

WinBUGS DocumentWinBUGS Document
Select your Doodle from your Doodle Select your Doodle from your Doodle WindowWindow• Menu bar - Edit - Select DocumentMenu bar - Edit - Select Document
Copy your DoodleCopy your Doodle• Menu bar - Edit - CopyMenu bar - Edit - Copy
Paste it into your New DocumentPaste it into your New Document• Menu bar - Edit - PasteMenu bar - Edit - Paste

Model DataModel Data
Before running we need to give BUGS Before running we need to give BUGS some datasome data
• Type Type list(size1=250, size2=150)list(size1=250, size2=150) at the top (or at the top (or the bottom) of your new document.the bottom) of your new document.

Running BUGSRunning BUGS
Use Use “Specification...”“Specification...” from the “ from the “ModelModel” ” option on option on Menu BarMenu Bar to run BUGS to run BUGS
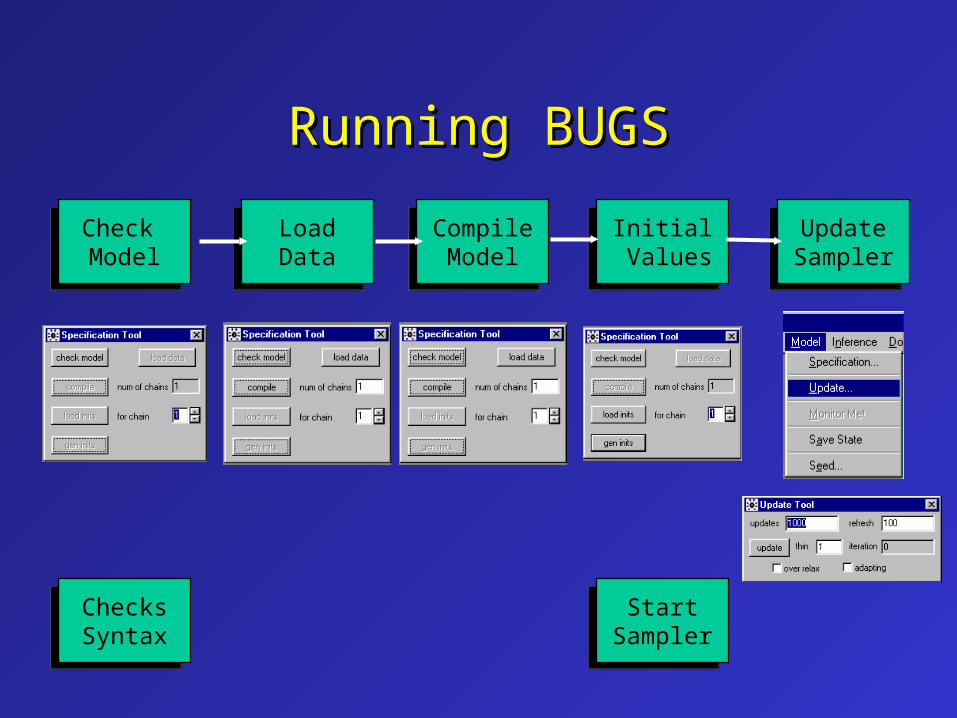
Running BUGSRunning BUGS
ChecksSyntax
ChecksSyntax
StartSampler
StartSampler
Check Model
Check Model
LoadData
LoadData
CompileModel
CompileModel
Initial Values
Initial Values
UpdateSampler
UpdateSampler
Check ModelCheck Model
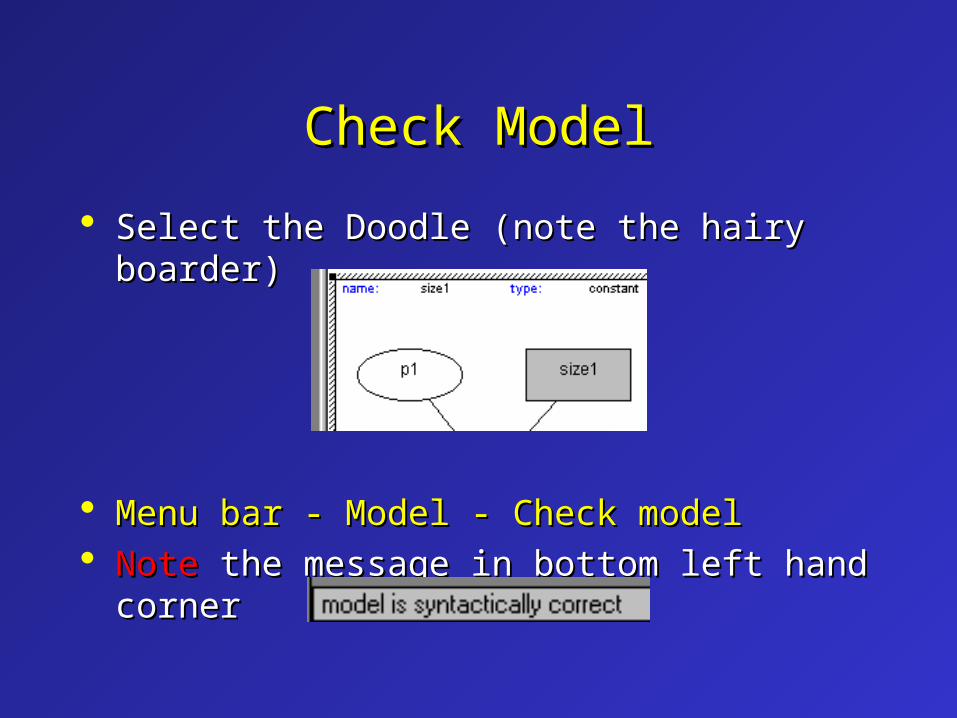
Select the Doodle (note the hairy Select the Doodle (note the hairy boarder)boarder)
Menu bar - Model - Check modelMenu bar - Model - Check model NoteNote the message in bottom left hand the message in bottom left hand
cornercorner

Load DataLoad Data
Highlight the word “Highlight the word “listlist””
Menu bar - Model - DataMenu bar - Model - Data Bottom left hand cornerBottom left hand corner
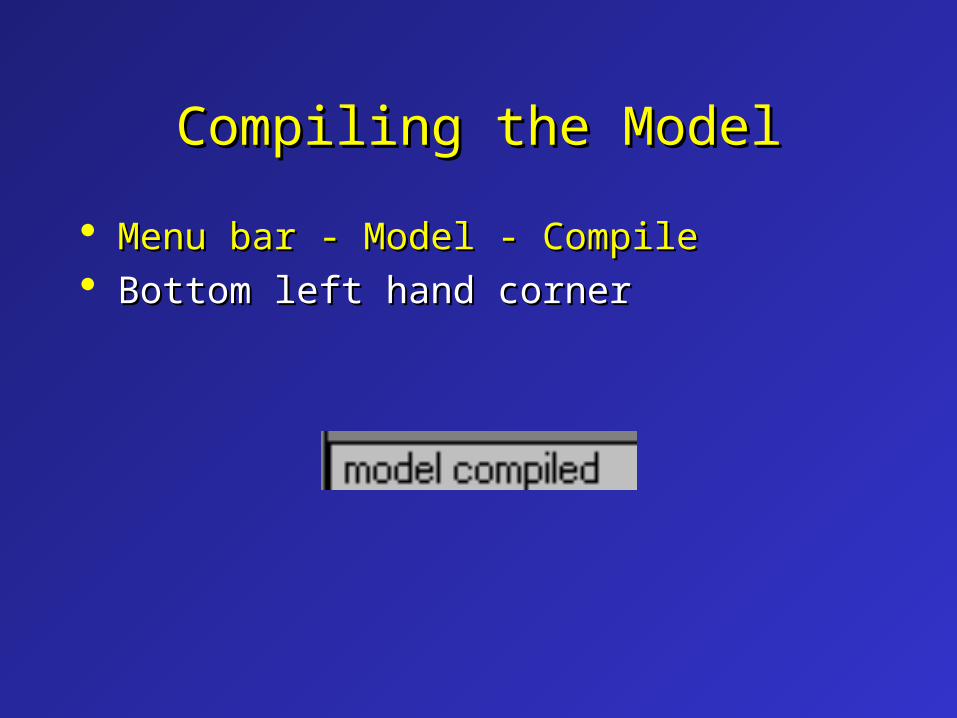
Compiling the ModelCompiling the Model
Menu bar - Model - CompileMenu bar - Model - Compile Bottom left hand cornerBottom left hand corner

Load Initial ValuesLoad Initial Values
Menu bar - Model - Gen initsMenu bar - Model - Gen inits Bottom left hand sideBottom left hand side

Update the ModelUpdate the Model
Menu bar - Model - UpdateMenu bar - Model - Update
1000 MCMC updates to be carried out.1000 MCMC updates to be carried out.
Burn InBurn In
Model has been updatedModel has been updated
MCMC run did not store any data.MCMC run did not store any data.• Used for the “burn in”Used for the “burn in”
Store values by “monitoring” them Store values by “monitoring” them toto• Draw inferences Draw inferences • Monitor MCMC runMonitor MCMC run
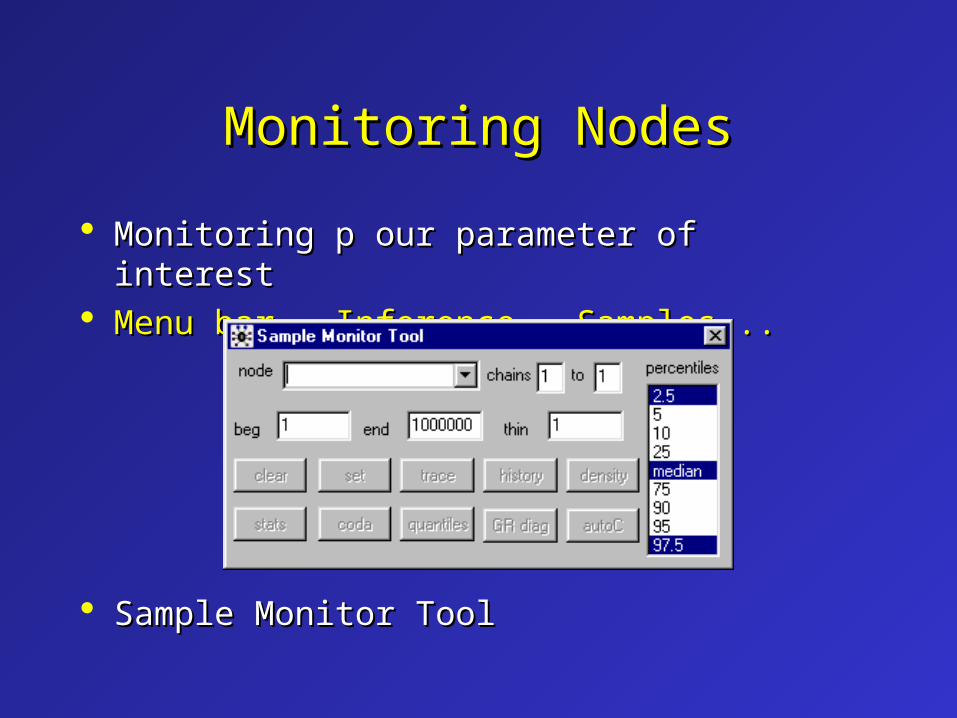
Monitoring NodesMonitoring Nodes
Monitoring p our parameter of interestMonitoring p our parameter of interest Menu bar - Inference - Samples...Menu bar - Inference - Samples...
Sample Monitor ToolSample Monitor Tool
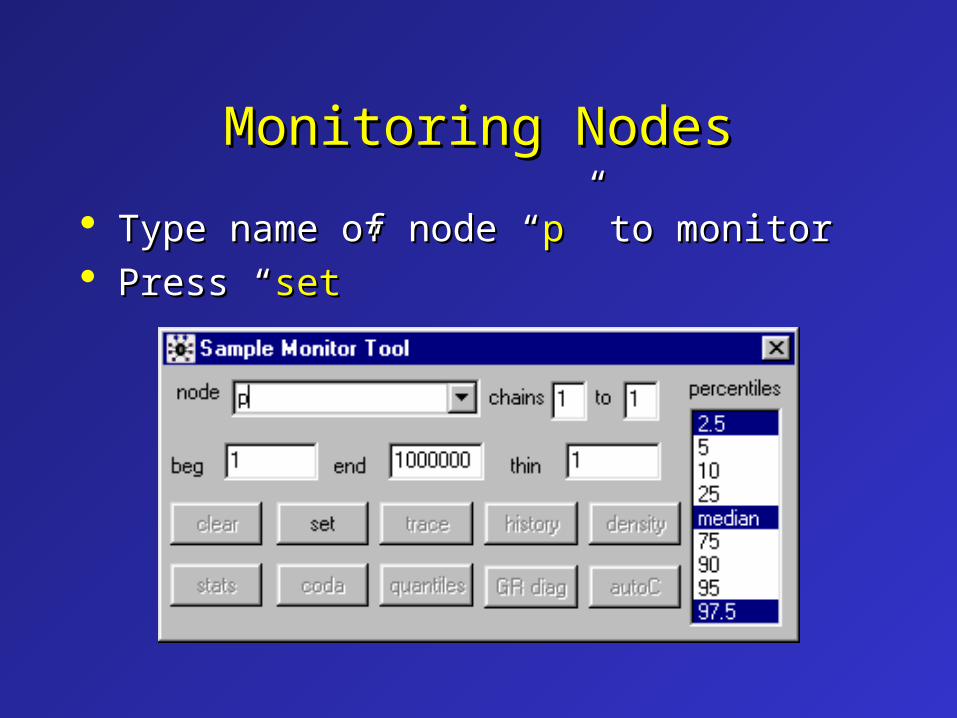
Monitoring NodesMonitoring Nodes
Type name of node “Type name of node “pp” to monitor” to monitor Press “Press “setset””
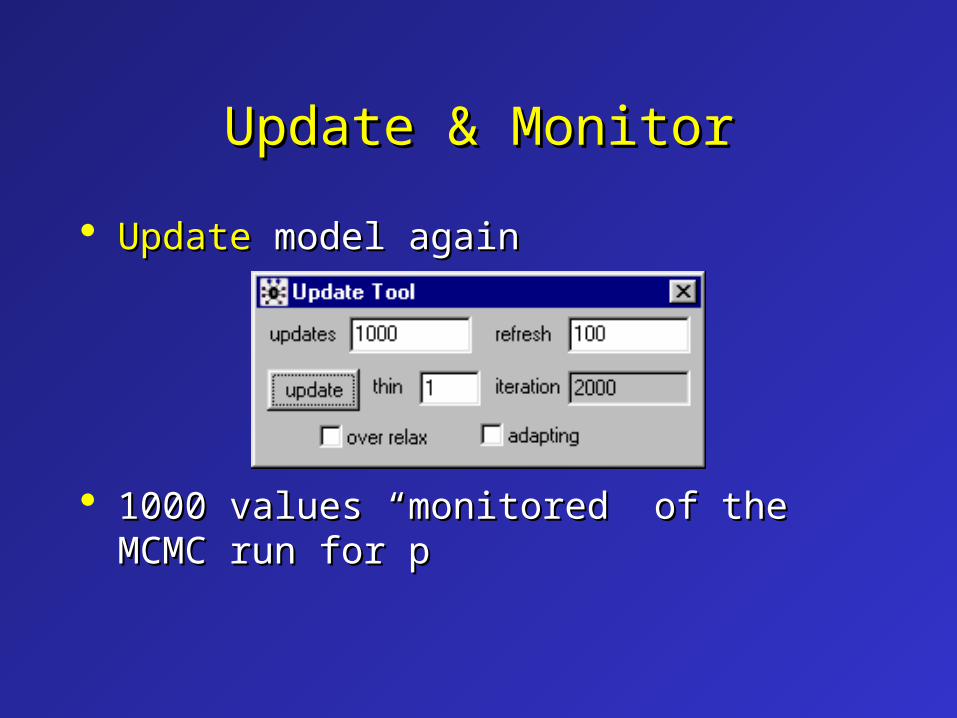
Update & MonitorUpdate & Monitor
UpdateUpdate model again model again
1000 values “monitored” of the MCMC 1000 values “monitored” of the MCMC run for prun for p
Summary StatisticsSummary Statistics
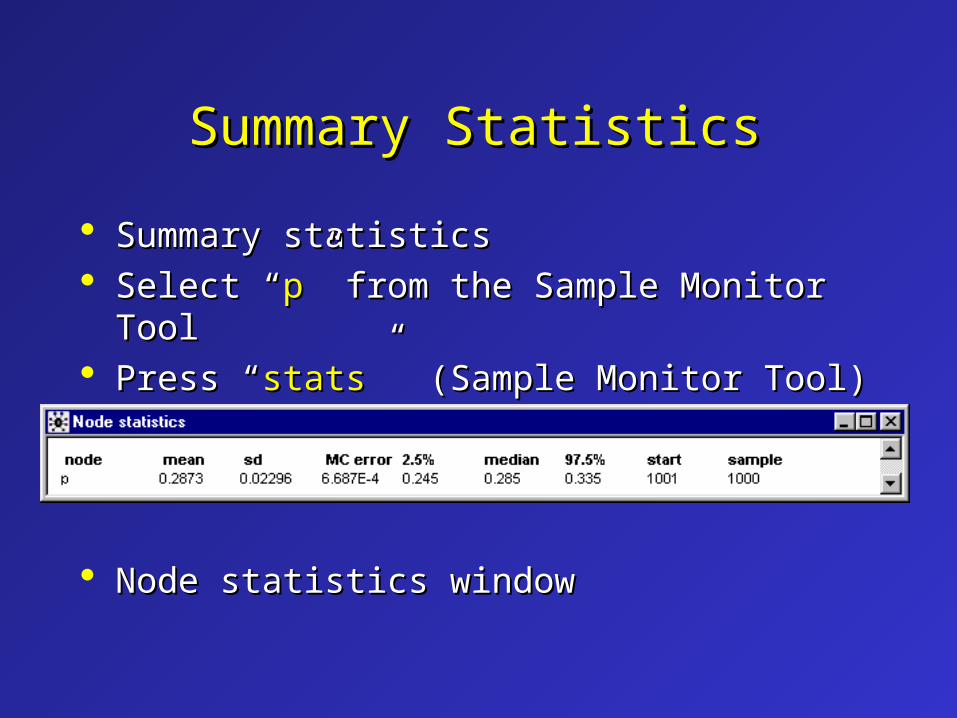
Summary statisticsSummary statistics Select “Select “pp” from the Sample Monitor Tool” from the Sample Monitor Tool Press “Press “statsstats” (Sample Monitor Tool)” (Sample Monitor Tool)
Node statistics windowNode statistics window
Summary StatisticsSummary Statistics
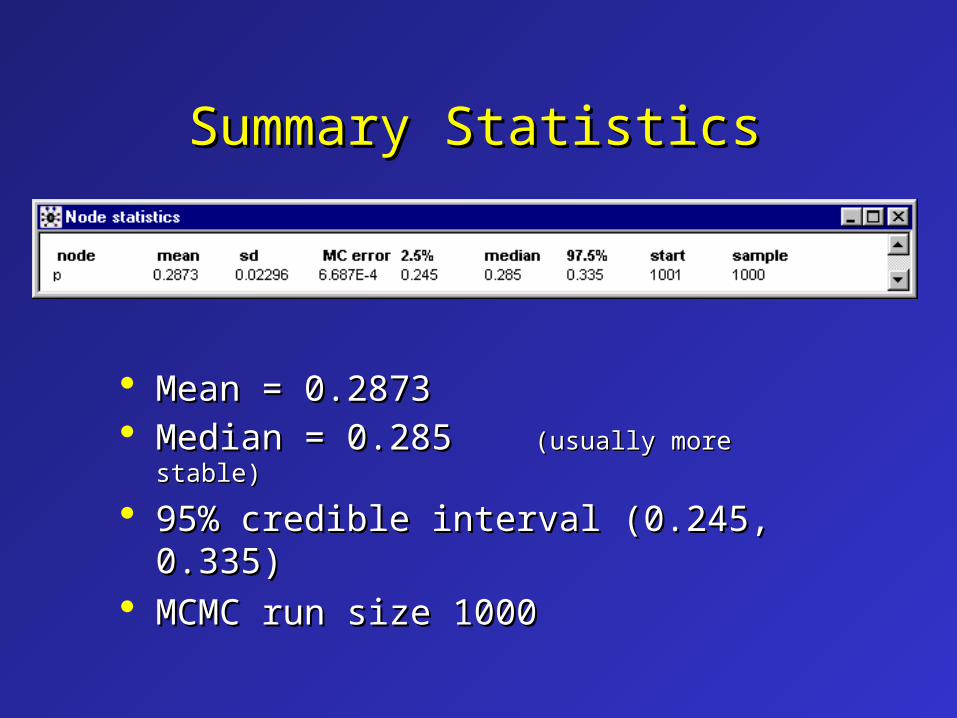
Mean = 0.2873Mean = 0.2873 Median = 0.285 Median = 0.285 (usually more (usually more
stable)stable)
95% credible interval (0.245, 0.335)95% credible interval (0.245, 0.335) MCMC run size 1000MCMC run size 1000

MCMC Time SeriesMCMC Time Series
Press “Press “HistoryHistory” in Sample Monitor Tool” in Sample Monitor Tool

Kernel DensityKernel Density
Press “Press “DensityDensity” in the Sample Monitor ” in the Sample Monitor ToolTool

Kernel DensityKernel Density
Increase monitored values to 25,000Increase monitored values to 25,000

PlatesPlates
Creating a plate Creating a plate • CTRL + mouse clickCTRL + mouse click in Doodle Window in Doodle Window
• Deleting a plate: Deleting a plate: CTRL + DelCTRL + Del

Allow more complex structure, e.g.,Allow more complex structure, e.g.,• Repeated measuresRepeated measures• Hierarchical modelsHierarchical models
Extend our example to calculate powerExtend our example to calculate power• r1 and r2 from Binomial distributionr1 and r2 from Binomial distribution• Simulte r1 and r2 100 times per “update”Simulte r1 and r2 100 times per “update”• Calculate test statisticCalculate test statistic• Count number of times it falls in critical regionCount number of times it falls in critical region
PlatesPlates

HH00: p1 = p2 = p vs H: p1 = p2 = p vs H11: p1 < : p1 < p2p2
• p1 = r1/size1p1 = r1/size1 && p2 = r2/size2p2 = r2/size2
Test statisticTest statistic
Test StatisticTest Statistic
(p2 - p1)s.d.(p)
s.d.(p) = (p(1-p)(1/size1 + 1/size2))


PowerPower
DataData• list(prop1=.25, prop2=.35, list(prop1=.25, prop2=.35, size1=250,size2=150, N=100, size1=250,size2=150, N=100, alpha.val=1.96)alpha.val=1.96)
ResultsResults
Power = 57% (47%, 67%)Power = 57% (47%, 67%)

Power - HistoryPower - History

Power - DensityPower - Density

UpdatesUpdates
Updating - Bottom left hand cornerUpdating - Bottom left hand corner
After updates finishAfter updates finish

SummarySummary
BUGS is a power toolBUGS is a power tool• Bayesian AnalysisBayesian Analysis• Simulation ToolSimulation Tool
Graphical Models Graphical Models • Doodle BUGSDoodle BUGS• Simple representation of modelSimple representation of model
Easy to use!Easy to use!