WILMAR INTERNATIONAL LIMITED INVESTOR PRESENTATION
33
1 WILMAR INTERNATIONAL LIMITED INVESTOR PRESENTATION 9 JANUARY 2012 BY HO KIAM KONG CHIEF FINANCIAL OFFICER
Transcript of WILMAR INTERNATIONAL LIMITED INVESTOR PRESENTATION
1
WILMAR INTERNATIONAL LIMITED
INVESTOR PRESENTATION
9 JANUARY 2012
BY HO KIAM KONG
CHIEF FINANCIAL OFFICER
IMPORTANT NOTICE
Information in this presentation may contain projections and forward looking statements that reflect the Company’s current views with respect to future events and financial performance. These views are based on current assumptions which are subject to various risks and which may change over time. No assurance can be given that future events will occur, that projections will be achieved, or that the Company’s assumptions are correct. Actual results may differ materially from those projected.
This presentation does not constitute or form part of any opinion on any advice to sell, or any solicitation of any offer to purchase or subscribe for, any shares nor shall it or any part of it nor the fact of its presentation form the basis of, or be relied upon in connection with, any contract or investment decision.

Agenda
1 Who We Are
2 Key Investment Considerations
3 Business Segment Overview
4 Financial Profile
5 Conclusion
6 Q & A

4
Who We Are
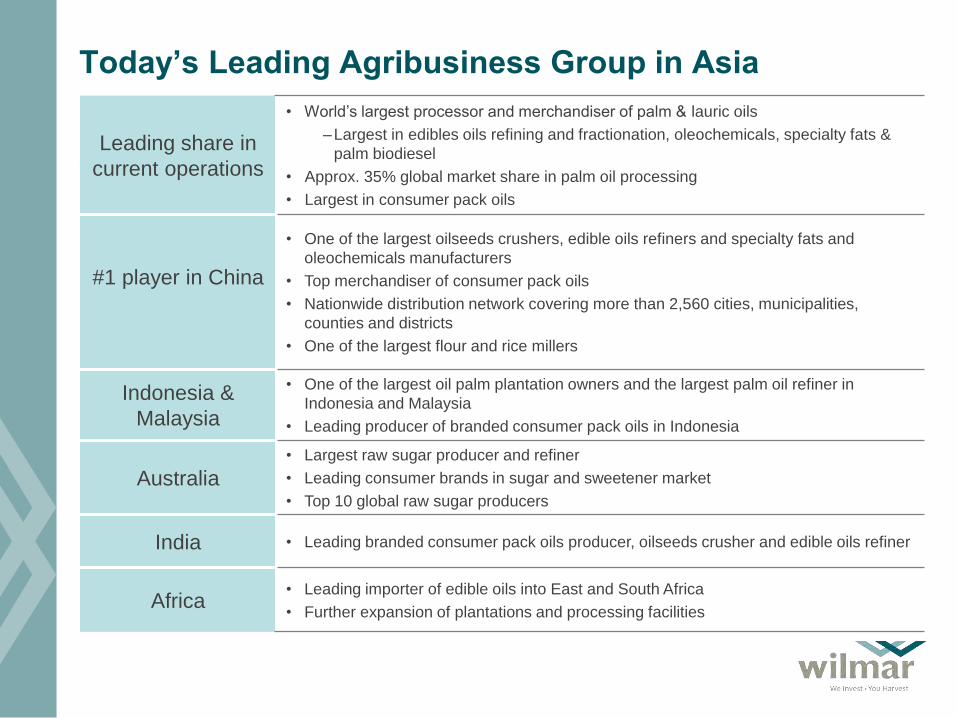
Today’s Leading Agribusiness Group in Asia
Leading share in
current operations
• World’s largest processor and merchandiser of palm & lauric oils
–Largest in edibles oils refining and fractionation, oleochemicals, specialty fats &
palm biodiesel
• Approx. 35% global market share in palm oil processing
• Largest in consumer pack oils
#1 player in China
• One of the largest oilseeds crushers, edible oils refiners and specialty fats and
oleochemicals manufacturers
• Top merchandiser of consumer pack oils
• Nationwide distribution network covering more than 2,560 cities, municipalities,
counties and districts
• One of the largest flour and rice millers
Indonesia &
Malaysia
• One of the largest oil palm plantation owners and the largest palm oil refiner in
Indonesia and Malaysia
• Leading producer of branded consumer pack oils in Indonesia
Australia
• Largest raw sugar producer and refiner
• Leading consumer brands in sugar and sweetener market
• Top 10 global raw sugar producers
India • Leading branded consumer pack oils producer, oilseeds crusher and edible oils refiner
Africa • Leading importer of edible oils into East and South Africa
• Further expansion of plantations and processing facilities
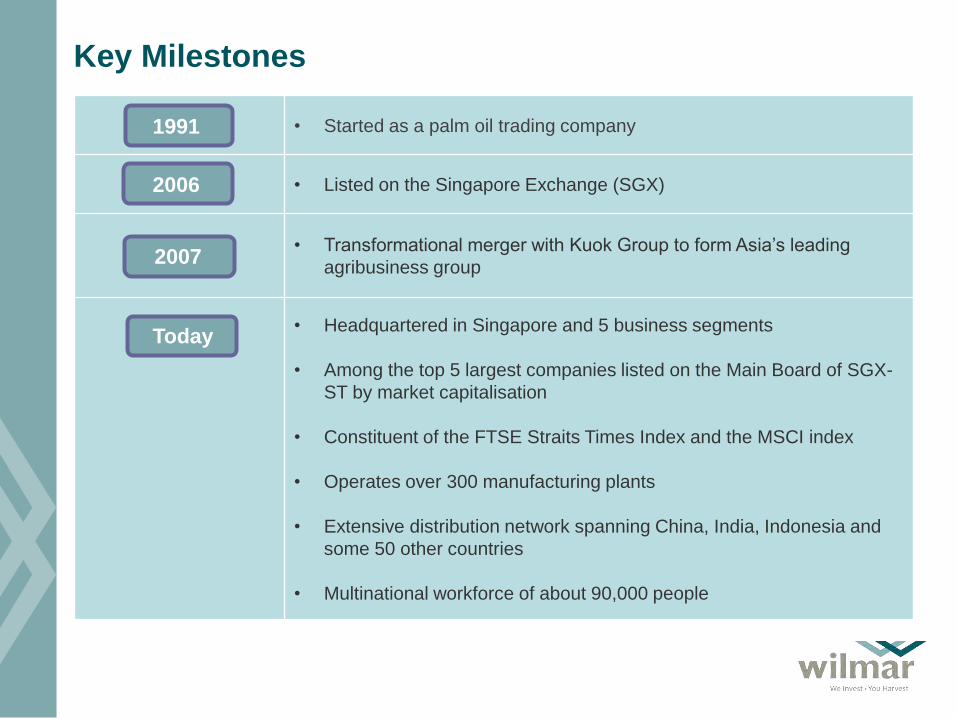
Key Milestones
• Started as a palm oil trading company
• Listed on the Singapore Exchange (SGX)
• Transformational merger with Kuok Group to form Asia’s leading
agribusiness group
• Headquartered in Singapore and 5 business segments
• Among the top 5 largest companies listed on the Main Board of SGX-
ST by market capitalisation
• Constituent of the FTSE Straits Times Index and the MSCI index
• Operates over 300 manufacturing plants
• Extensive distribution network spanning China, India, Indonesia and
some 50 other countries
• Multinational workforce of about 90,000 people
1991
2006
2007
Today

Known for its Quality Products
China:
Arawana
• American Corning 2010 Product Innovation Award
• Best Selling Brand in 2010
• Sole food and grain supplier for the Shenzhen World University Games 2011
• Gold Medal at the 9th China Rice Expo in 2010
Indonesia:
Sania
Sania Royale
• Super Brand 2010 & 2011
• Product of the Year 2011
India:
Fortune
• Super Brand 2010
Vietnam:
Neptune
SIMPLY
Meizan
• Top 500 Leading Products and Services 2011
• Vietnam’s Trusted Products and Services 2011
Bangladesh:
Rupchanda
Meizan
• Super Brand 2010
• Most Effective Rural Communication 2010

Testaments of Corporate Excellence
Wilmar is honoured to be conferred the following awards:
• Singapore 1000 Net Profit Excellence Award
(Commerce – Wholesale) 2011
• Singapore International 100 Overseas
Sales/Turnover Excellence Award (First place
ranking) 2011
• Singapore International 100 Overseas
Sales/Turnover Excellence In Market Award (China,
India, North Asia, Southeast Asia) 2011
DP Info, supported by ACRA, IE
Singapore, SPRING, IDA
• Most Transparent Company Award for Services,
Utilities & Agriculture category in 2009, 2010 & 2011
• Internal Audit Excellence Award (Merit) 2011
Securities Investors Association
(Singapore)
• Winner of Global Chinese 1000 Award for Singapore
in 2009, 2010 & 2011
Yazhou Zhoukan magazine
• 2010 World’s Most Admired Company
- Ranked 4th in Food Production Industry
Fortune Magazine
• 2010 Fortune Global 500
- Ranked 353rd
Fortune Magazine

Commitment to Corporate Social Responsibility
The Group is guided by its internal environmental policies which comprise:
Adhering to RSPO Principles and Criteria
Compliance to all national regulations when clearing forest land for plantations
No-burn policy
Adopting internationally recognised best practices in managing plantations
Wilmar is committed to the production and use of products in a sustainable
manner based on economic, social and environmental viability

Growing with the local communities
Wilmar believes that its business success can only be achieved if the local
communities in which it operates grow in tandem. The Group’s internal social
development policies cover:
Improving community and social relations
Protection of human rights
Corporate philanthropy

11
Key Investment Considerations

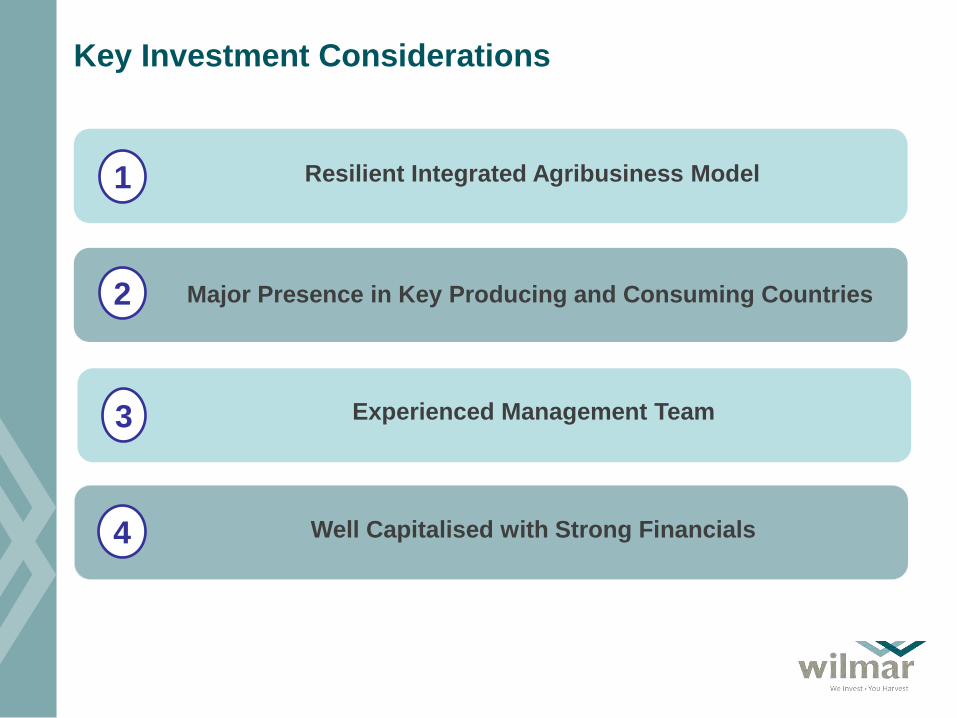
Key Investment Considerations
Resilient Integrated Agribusiness Model 1
Major Presence in Key Producing and Consuming Countries 2
Well Capitalised with Strong Financials 4
Experienced Management Team 3

Origination Processing Products Merchandising
& Distribution
• Merchandising &
Distribution
- Owns fleet of liquid bulk
vessels
- Owns ports and jetties
- Extensive distribution
network
• Processing
- Milling, crushing,
refining,
fractionation,
specialty fats,
biodiesel &
oleochemicals
manufacturing
- Oilseeds crushing
- Rice & flour milling
- Sugar milling
- Sugar refining
• Origination
- Planting
- Sourcing of FFB and
crude palm oil
- Sourcing of soybean,
other oilseeds and
grains
- Sourcing of cane and
raw sugar
• Products
- Bulk edible oils
- Consumer packs
- Oilseeds meal
- Specialty fats
- Oleochemicals
- Biodiesel
- Rice & flour
- Fertiliser
- Raw & refined
sugar
Finance / Risk management / Logistics coordination
Customers
Information flows / Visibility across value chain
1 Resilient Integrated Agribusiness Model

Major Presence in Key Producing and
Consuming Countries 2
One of the largest plantation owners with extensive manufacturing facilities in
Indonesia and Malaysia – two key palm oil producers in the world
Extensive manufacturing presence and distribution network in key consuming
countries and regions such as China, Indonesia, India, Europe and Africa
Flexibility of expanding capacity at origination and/or destination to capture
growth opportunities
Enhanced global market intelligence
Abilility to maximise processing margins through timely purchases of raw
materials and sales of finished goods
Sells and distributes globally in bulk mainly to refiners, processors, wholesalers
and retailers
Focused on building established brand names for consumer products to
achieve brand recognition and increase customer loyalty and market share

Major Presence in Key Producing and
Consuming Countries 2

Proven track record of identifying and developing business opportunities,
operating in various economic cycles and adapting to local market conditions
Experienced merchandising team backed by a strong ability to manage
commodity, customer and currency risks
A technical team that has successfully built large, integrated manufacturing
complexes and operates them efficiently
A plantations development team with technical expertise in developing
plantations and the ability to manage local conditions
Experienced Management Team 3
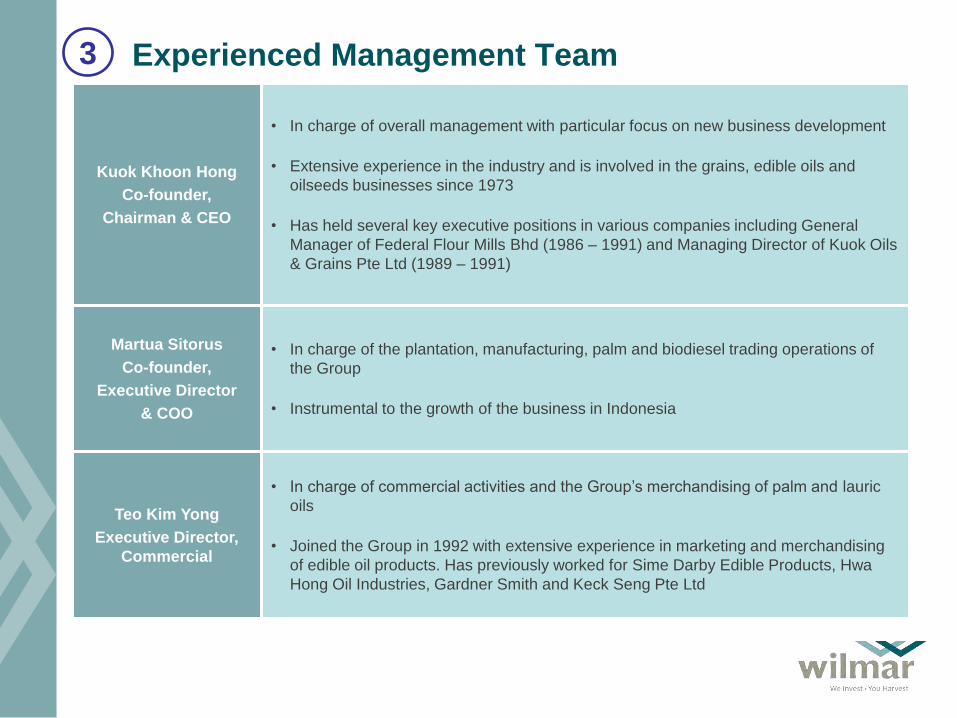
Experienced Management Team
Kuok Khoon Hong
Co-founder,
Chairman & CEO
• In charge of overall management with particular focus on new business development
• Extensive experience in the industry and is involved in the grains, edible oils and
oilseeds businesses since 1973
• Has held several key executive positions in various companies including General
Manager of Federal Flour Mills Bhd (1986 – 1991) and Managing Director of Kuok Oils
& Grains Pte Ltd (1989 – 1991)
Martua Sitorus
Co-founder,
Executive Director
& COO
• In charge of the plantation, manufacturing, palm and biodiesel trading operations of
the Group
• Instrumental to the growth of the business in Indonesia
Teo Kim Yong
Executive Director,
Commercial
• In charge of commercial activities and the Group’s merchandising of palm and lauric
oils
• Joined the Group in 1992 with extensive experience in marketing and merchandising
of edible oil products. Has previously worked for Sime Darby Edible Products, Hwa
Hong Oil Industries, Gardner Smith and Keck Seng Pte Ltd
3

Well-Capitalised with Strong Financials 4
Key Figures
Shareholders’ funds of US$12.8 billion*
Total assets of US$39.9 billion*
Leveraged with a net debt to equity of 0.96x. Adjusted debt to equity
ratio is at 0.42x.*
* As at 30 Sep 2011
Market capitalisation of about US$25.0 billion (or S$32.0 billion) as at
31 Dec 2011
19
Business Segment Overview

Wilmar’s 5 Key Business Segments
1 Plantations & Palm Oil Mills
2 Merchandising and Processing – Palm & Laurics
3 Merchandising and Processing – Oilseeds & Grains
4 Consumer Products
5 Sugar – Milling & Refining

Segment 1: Plantations & Palm Oil Mills
• One of the largest oil palm plantation owners in Indonesia and Malaysia
• Also owns plantations in Ghana, and through joint ventures in Uganda and West Africa
• As at 30 Sep 2011, the Group had a total of 248,110 hectares of planted area in Indonesia,
Malaysia and Africa
• Administers over 37,000 hectares of oil palm plantation land under the Plasma Programme in
Indonesia, a project designed to assist small landowners to become independent plantation
growers
US$m 9M 2011 9M 2010 FY 2010 FY 2009 FY 2008
Revenue 1,380 988 1,485 1,119 1,321
Profit Before Tax 357.8 255.2 635.8 396.9 326.7
Planted Area (ha) 248,110 237,186 244,965 235,799 223,258
Mature Area Harvested (ha) 207,345 187,245 186,688 159,464 141,407
FFB Production (MT) 2,955,901 2,381,751 3,348,891 3,213,360 2,960,264
FFB Yield (MT/ha) 14.3 12.7 17.9 20.2 20.9 Palm & Laurics Oilseeds & GrainsConsumer Products Plantations & Palm Oil MillsSugar AssociatesOthers
9M11 Pretax Profit
23.7%
* FFB: Fresh Fruit Bunches

Segment 2: Merchandising & Processing
• Largest global processor and merchandiser of palm and lauric oils
• Processes raw materials such as crude palm oil and crude palm kernel oil into bulk edible oils,
biodiesel, oleochemicals and specialty fats
• Owns and operates a number of strategically located and vertically integrated palm and lauric
oils processing plants in Indonesia, Malaysia, China, India, Vietnam, the Philippines, Ukraine and
Europe
• Palm oil, laurics and related products are widely used in many industries including food
manufacturing, cosmetics, industrial and pharmaceutical industries
Palm & Laurics
Palm & Laurics Oilseeds & GrainsConsumer Products Plantations & Palm Oil MillsSugar AssociatesOthers
31.6%
9M11 Pretax Profit
US$m 9M 2011 9M 2010 FY 2010 FY 2009 FY 2008
Revenue 17,442 11,666 16,821 12,627 17,497
Sales Volume (‘000 MT) 14,962 15,037 20,820 19,070 19,433
Profit before tax 477.4 428.0 587.1 692.8 644.9
Profit before tax per MT
(US$/MT) 31.9 28.5 28.2 36.3 33.2

Segment 3: Merchandising & Processing
• One of the largest oilseeds and edible oils processors in China and, through its joint ventures,
owns processing plants in India and Russia
• Crushes oilseeds such as soybean, rapeseed, groundnut, sunflower seed, sesame seed and
cottonseed into oilseeds meal and edible oils, and mills wheat and paddy into flour, rice and bran
• Owns and operates a number of strategically located crushing facilities and mills mainly in China
Oilseeds & Grains
Palm & Laurics Oilseeds & GrainsConsumer Products Plantations & Palm Oil MillsSugar AssociatesOthers
27.8%
9M11 Pretax Profit
US$m 9M 2011 9M 2010 FY 2010 FY 2009 FY 2008
Revenue 8,844 7,197 10,172 8,156 8,062
Sales Volume (‘000 MT) 13,789 13,541 18,281 15,608 13,288
Profit before tax 421.2 290.7 117.5 606.9 590.4
Profit before tax per MT
(US$/MT) 30.5 21.5 6.4 38.9 44.4
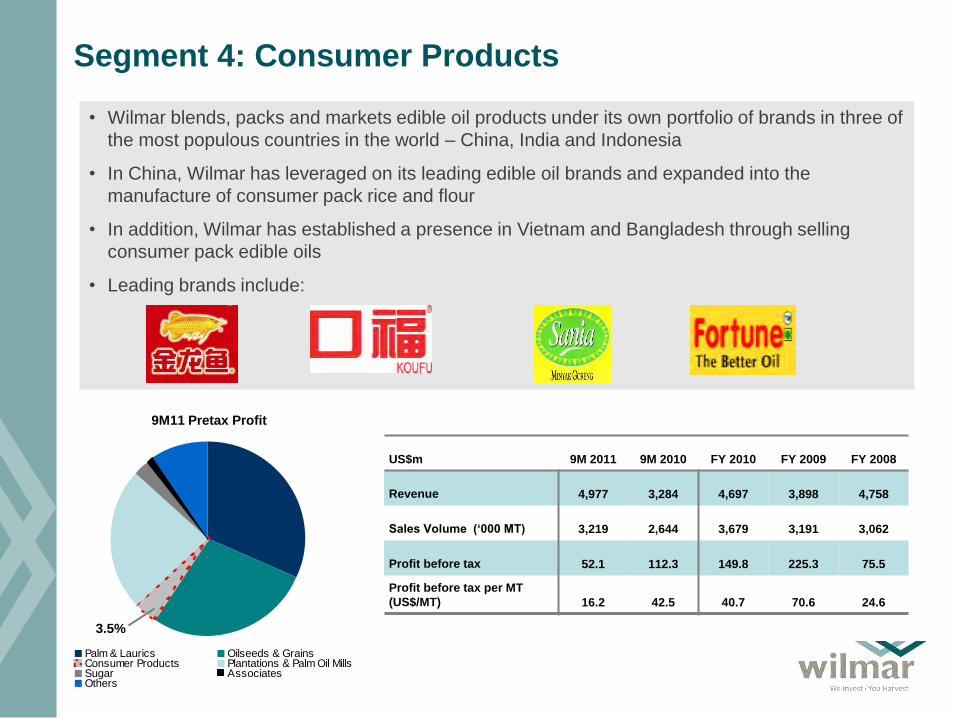
Segment 4: Consumer Products
• Wilmar blends, packs and markets edible oil products under its own portfolio of brands in three of
the most populous countries in the world – China, India and Indonesia
• In China, Wilmar has leveraged on its leading edible oil brands and expanded into the
manufacture of consumer pack rice and flour
• In addition, Wilmar has established a presence in Vietnam and Bangladesh through selling
consumer pack edible oils
• Leading brands include:
Palm & Laurics Oilseeds & GrainsConsumer Products Plantations & Palm Oil MillsSugar AssociatesOthers
3.5%
9M11 Pretax Profit
US$m 9M 2011 9M 2010 FY 2010 FY 2009 FY 2008
Revenue 4,977 3,284 4,697 3,898 4,758
Sales Volume (‘000 MT) 3,219 2,644 3,679 3,191 3,062
Profit before tax 52.1 112.3 149.8 225.3 75.5
Profit before tax per MT
(US$/MT) 16.2 42.5 40.7 70.6 24.6

Segment 5: Sugar
• Expanded into the sugar business in 2010 through the acquisition of Sucrogen Limited in
Australia, one of the world’s largest sugar companies, and PT Jawamanis Rafinasi, a leading
sugar refiner in Indonesia
• Acquired PT Duta Sugar International in Indonesia and Proserpine Sugar Mill (through Sucrogen
Limited) in Australia in 2011
• Two main businesses: - Milling of sugarcane to produce raw sugar
- Refining of raw sugar to produce food-grade products
• Vertically integrated sugar operations spanning origination, processing and a variety of
distribution channels
Palm & Laurics Oilseeds & GrainsConsumer Products Plantations & Palm Oil MillsSugar AssociatesOthers
2.8%
9M11 Pretax Profit
Milling Refining
US$m 3Q11 2Q11 1Q11 3Q11 2Q11 1Q11
Revenue 533 184 42 773 469 326
Sales Volume (‘000 MT) 1,255 264 80 976 557 359
Profit before tax 56.0 -49.6 -22.7 1.2 42.4 15.4
Profit before tax per MT
(US$/MT) 44.6 -187.9 -281.8 1.2 76.2 42.9

26
Financial Profile

Revenue and Net Profit (US$ million)
Financial Profile

28
Financial Profile As at 30 Sep or 31 Dec 9M 2011 9M 2010 FY 2010 FY 2009 FY 2008
Income Statement (US$ million)
Revenue 33,191 21,289 30,378 23,885 29,145
EBITDA 1,941 1,477 2,033 2,590 2,230
Profit Before Tax 1,403 1,215 1,644 2,294 1,789
Net Profit 1,101 1,005 1,324 1,882 1,531
Cash Flow (US$ million)
Cash Flow from Operating activities 993 266 -2,319 -520 3,231
Capital Expenditure 1,047 696 1,064 1,063 1,107
Balance Sheet (US$ million)
Total Debt 21,866 12,738 17,425 9,580 5,284
Net Debt 12,261 6,525 10,637 4,445 2,390
Liquid Working Capital* 6,869 4,356 6,095 3,764 1,407
Adjusted Net Debt 5,392 2,170 4,543 681 983
Shareholders’ Funds 12,801 11,539 11,856 10,931 9,606
Total Assets 39,949 27,690 33,969 23,449 17,869
Total Liabilities 26,359 15,605 21,412 12,037 7,894
*Liquid Working Capital = Inventories (excl. consumables) + Trade Receivables – Current Liabilities (excl. borrowings)
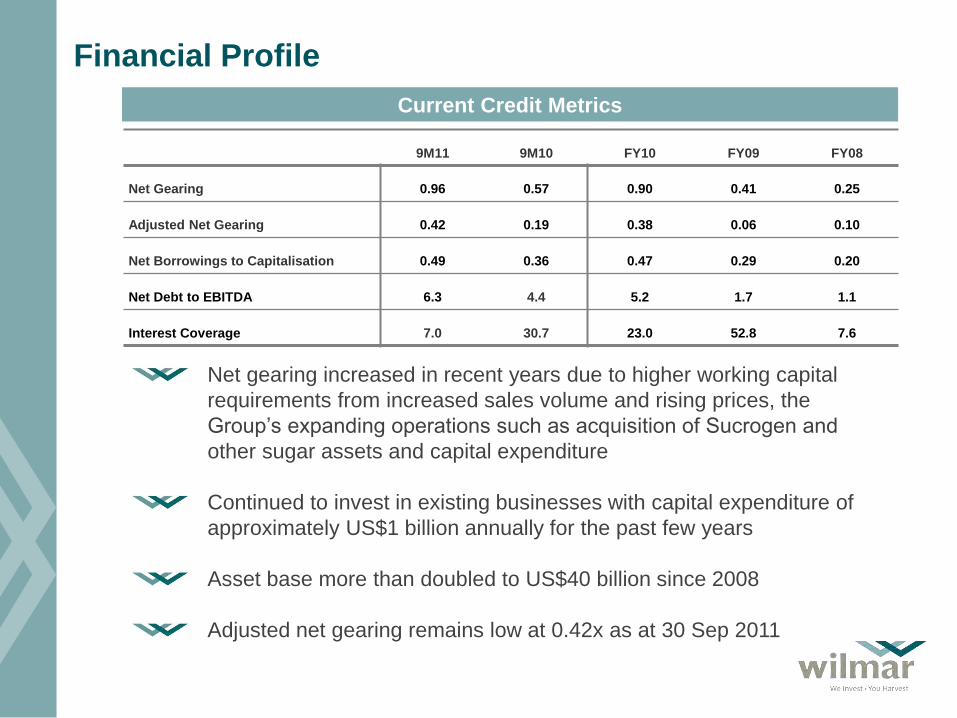
Current Credit Metrics
Financial Profile
9M11 9M10 FY10 FY09 FY08
Net Gearing 0.96 0.57 0.90 0.41 0.25
Adjusted Net Gearing 0.42 0.19 0.38 0.06 0.10
Net Borrowings to Capitalisation 0.49 0.36 0.47 0.29 0.20
Net Debt to EBITDA 6.3 4.4 5.2 1.7 1.1
Interest Coverage 7.0 30.7 23.0 52.8 7.6
Net gearing increased in recent years due to higher working capital
requirements from increased sales volume and rising prices, the
Group’s expanding operations such as acquisition of Sucrogen and
other sugar assets and capital expenditure
Continued to invest in existing businesses with capital expenditure of
approximately US$1 billion annually for the past few years
Asset base more than doubled to US$40 billion since 2008
Adjusted net gearing remains low at 0.42x as at 30 Sep 2011

30
Conclusion
Key Investment Considerations
Resilient Integrated Agribusiness Model 1
Major Presence in Key Producing and Consuming Countries 2
Well Capitalised with Strong Financials 4
Experienced Management Team 3
32
Q&A Session

THANK YOU