Wilmar Court 37 kW Solar Thermal Installation · Wilmar Court is a non-profit seniors’ residence...
20
Wilmar Court 37 kW t Solar Thermal Installation Final Report January 2013
Transcript of Wilmar Court 37 kW Solar Thermal Installation · Wilmar Court is a non-profit seniors’ residence...

Wilmar Court 37 kWt Solar Thermal Installation
Final ReportJanuary 2013

SolarCity Partnership1
Wilmar Court Final Report
PROJECT SNAPSHOTAddress: 967 Pharmacy Ave., Toronto, ONBuilding type and use: Seniors’ non-profit housingOwner: Wilmar Heights United Church Non-Profit Homes Inc.Contact: Jamie Ramesbottom, Executive Director, Wilmar Heights
United Church Non-Profit Homes Inc.Phone #: (416) 759-7269Email: [email protected] type: Solar domestic hot water (evacuated tube collectors)Array angle: 45 degrees from horizontalAzimuth: 13 degrees East of SouthSystem configuration: 24 collectors in parallelCollector manufacturer: Globe Solar Energy, Inc.Collector model: GSE IP-195Number of collectors: 24Solar storage volume: 150 L per collector (3,600 L total)Collector fluid: WaterSystem size (kW thermal): 37System aperture area (m2): 53.52Installation date: November 2009
PERFORMANCE
Pre-retrofit actual energy delivered: 54,821 kWh/yr (1,463 kWh/kWt/yr)Pre-retrofit modified RETScreen: 30,300 kWh/yr (809 kWh/kWt/yr)Post-retrofit actual* energy delivered: 33,406 kWh/yr (892 kWh/kWt/yr)Post-retrofit modified RETScreen: 29,200 kWh/yr (779 kWh/kWt/yr)
FINANCIAL
Installed cost (taxes included): $141,147External funding: $73,2002011-2012 Annual savings: $1,583Simple payback (excluding external funding):
89.2 years
Cost per kWt (excluding external funding):
$3,768
*Energy delivered from September to November 2011 was extrapolated based on the typical amount of solar radiation received in Toronto during this period.

SolarCity Partnership 2
Wilmar Court Final Report
MONITORING
Monitoring equipment installed: YesOverview of the monitoring plan: A BTU meter tracks energy production, and a web-
based monitoring system enables in-depth performance monitoring.
Cost of M&V (% of total project): UndeterminedWho is analyzing the data? SolarCity PartnershipIs there a dedicated staff person responsible for system operation management?
No, but the building manager is very involved and checks the system’s operation frequently.
Wilmar Court evacuated tube solar water heating system, Toronto, ON

SolarCity Partnership3
Wilmar Court Final Report
SUMMARYThe Wilmar Court 37 kWt solar water heating system located at 967 Pharmacy Avenue in Toronto, ON was installed for a cost of $141,147 in November 2009. The system was monitored over a period of approximately 2.5 years, from April 2010 to September 2012. During this time, a retrofit occurred which involved the replacement of a number of system components.
Pre-retrofit, actual system performance was 54,821 kWh/yr (1,463 kWh/kWt/yr), which was 80.9% greater than a RETScreen simulation based on actual hot water loads and system temperatures. Post-retrofit, system yield decreased to 33,406 kWh/yr (892 kWh/kWt/yr). This was likely due to a decrease in water flow through the system caused by an increase in the storage temperature of the boilers. However, system yield was 14.4% greater than a RETScreen model which incorporated post-retrofit system characteristics.
Based on post-retrofit system performance, the system will achieve a simple payback of 89.2 years before grants and 42.9 years after. Payback would have been considerably more favourable had the system continued to perform at pre-retrofit levels. These results highlight the importance of ensuring that all key operational parameters are thoroughly investigated during the feasibility assessment phase of the project.
BACKGROUNDWilmar Court is a non-profit seniors’ residence located in Toronto and owned by Wilmar Heights United Church Non-Profit Homes Inc. In order to take an active role in reducing the greenhouse gas emissions of its facilities, the organization, in partnership with the Canada China Environmental Cooperation Council (CCECC), has implemented a series of conservation measures over the past 25 years. These include waste reduction, water and energy conservation, air quality initiatives, and a cessation of pesticide and chemical fertilizer use.1
In November 2009, a 37 kWt solar domestic hot water (SDHW) system was installed on site at a cost of $141,147. The system preheats the building’s domestic hot water using energy from the sun, reducing the need for conventional natural gas water heating. The goals of this project were to assess the technical and financial viability of SDHW systems and educate Wilmar Court residents and employees about the benefits of renewable energy technologies. The project also serves as a model for other community organizations looking to implement similar initiatives.
1 Canada-China Environmental Cooperation Council (CCECC). 2008. A Solar Thermal Domestic Hot Water (DHW) Project at a Non-profit Seniors’ Residence with Measurable Results in Energy Savings and GHG Reduction.

SolarCity Partnership 4
Wilmar Court Final Report
SYSTEM OPERATIONThe GSE IP-195 evacuated tube system is a passive system in which the collected heat is transferred from the solar collectors directly to the storage tanks through heat pipes inserted into the solar storage tanks (Figure A1, Appendix A). When there is a hot water draw from the domestic hot water tanks inside the mechanical room, cold (“city”) water flows into the solar storage tanks, while pre-heated water flows from the solar tanks into the domestic hot water tanks (Figure A2, Appendix A). In the case of Wilmar Court, there are 24 units functioning as a pre-heating system for the domestic hot water supply. To prevent water inside the connecting pipes (the pipes connecting the mechanical room to the solar storage tanks) from freezing, heat tracing is installed. Detailed system specifications are presented in Table A1, Appendix A.
PERFORMANCE ANALYSISPre-install energy savings estimates
Two different studies have presented pre-install performance estimates. One is titled “A Solar Thermal Domestic Hot Water (DHW) Project at a Non-profit Seniors’ Residence with Measurable Results in Energy Savings and GHG Reduction”. It was in submitted in Feb. 2008 to the Toronto Atmospheric Fund (TAF) by the Canada-China Environmental Cooperation Council (CCECC) and Program Analytics Inc. This report lists estimated savings of natural gas from six potential suppliers. Although the suppliers are not identified, one of them matches the system description of the current installation, with 24 units and 3,600 liters of solar storage. This report does not present the collector area for each option analyzed or any other details on how the results were obtained.
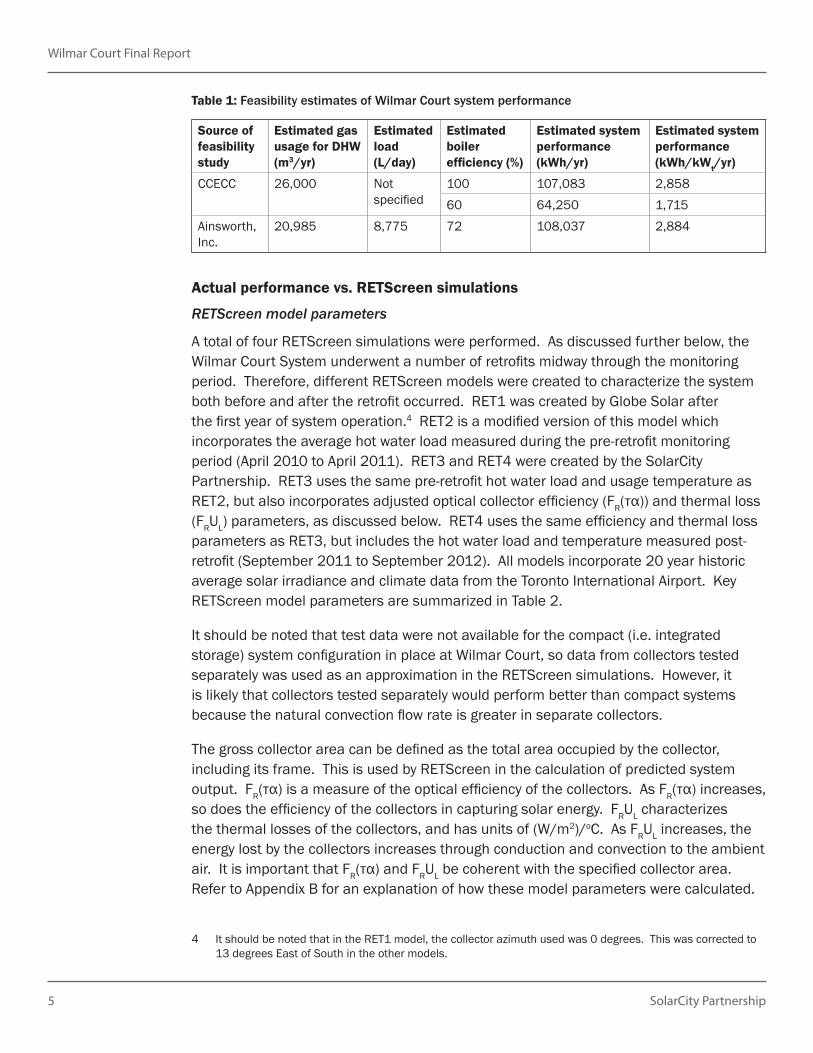
For the 24 unit evacuated tube system, the CCECC study predicts gas savings of 10,150 m3/year, based on a total of 26,000 m3 of gas used annually for water heating. Since the boiler efficiency has a direct impact on overall system energy savings, it is necessary to know the assumed efficiency. Considering a Heating Value for natural gas of 10.55 kWh/m3, the solar output would be 107,083 kWh/yr (2,858 kWh/kWt/yr) for a 100% efficient boiler or 64,250 kWh/yr (1,715 kWh/kWt/yr) for a 60% efficient boiler (Table 1).
The second study, the contractor proposal to Wilmar Court management, estimates the energy captured by the solar system at 108,037 kWh/yr (2,884 kWh/kWt/yr). It also considers 20,985 m3 of annual gas consumption used for domestic water heating and an average boiler efficiency of 72%. Assuming a cold water average temperature of 7.2°C and hot water temperature average of 50°C, this load would represent an average consumption of 8,775 litres/day.
2 Canada-China Environmental Cooperation Council (CCECC). 2008. A Solar Thermal Domestic Hot Water (DHW) Project at a Non-profit Seniors’ Residence with Measurable Results in Energy Savings and GHG Reduction.
3 Ainsworth, Inc. 2009. A Renewable Energy Proposal for Solar Thermal Heating.
SolarCity Partnership5
Wilmar Court Final Report
Actual performance vs. RETScreen simulations
RETScreen model parameters
A total of four RETScreen simulations were performed. As discussed further below, the Wilmar Court System underwent a number of retrofits midway through the monitoring period. Therefore, different RETScreen models were created to characterize the system both before and after the retrofit occurred. RET1 was created by Globe Solar after the first year of system operation.4 RET2 is a modified version of this model which incorporates the average hot water load measured during the pre-retrofit monitoring period (April 2010 to April 2011). RET3 and RET4 were created by the SolarCity Partnership. RET3 uses the same pre-retrofit hot water load and usage temperature as RET2, but also incorporates adjusted optical collector efficiency (FR(τα)) and thermal loss (FRUL) parameters, as discussed below. RET4 uses the same efficiency and thermal loss parameters as RET3, but includes the hot water load and temperature measured post-retrofit (September 2011 to September 2012). All models incorporate 20 year historic average solar irradiance and climate data from the Toronto International Airport. Key RETScreen model parameters are summarized in Table 2.
It should be noted that test data were not available for the compact (i.e. integrated storage) system configuration in place at Wilmar Court, so data from collectors tested separately was used as an approximation in the RETScreen simulations. However, it is likely that collectors tested separately would perform better than compact systems because the natural convection flow rate is greater in separate collectors.
The gross collector area can be defined as the total area occupied by the collector, including its frame. This is used by RETScreen in the calculation of predicted system output. FR(τα) is a measure of the optical efficiency of the collectors. As FR(τα) increases, so does the efficiency of the collectors in capturing solar energy. FRUL characterizes the thermal losses of the collectors, and has units of (W/m2)/oC. As FRUL increases, the energy lost by the collectors increases through conduction and convection to the ambient air. It is important that FR(τα) and FRUL be coherent with the specified collector area. Refer to Appendix B for an explanation of how these model parameters were calculated.
Table 1: Feasibility estimates of Wilmar Court system performance
Source of feasibility study
Estimated gas usage for DHW (m3/yr)
Estimated load (L/day)
Estimated boiler efficiency (%)
Estimated system performance (kWh/yr)
Estimated system performance (kWh/kWt/yr)
CCECC 26,000 Not specified
100 107,083 2,85860 64,250 1,715
Ainsworth, Inc.
20,985 8,775 72 108,037 2,884
4 It should be noted that in the RET1 model, the collector azimuth used was 0 degrees. This was corrected to 13 degrees East of South in the other models.

SolarCity Partnership 6
Wilmar Court Final Report
Pre-retrofit performance evaluation
As part of the initial installation, an energy meter was installed by the vendor to measure the thermal energy delivered by the solar system to the domestic hot water system. The results were collected and analyzed by Globe Solar, and presented in a short report in April 2011. According to the report, during the period between April 2010 and April 2011, the system delivered 187,057,000 BTU or 54,821 kWh/yr (1,463 kWh/kWt/yr), and 3,388,576 litres or 9,284 litres/day. This is 49.3% less than the contractor’s estimate, but only 8.5% below yield predicted by the RET2 model and 80.9% greater than the RET3 prediction (Table 3, Figure 1).
For this SDHW system, evaluating the specific performance (kWh/m2/yr) is not straightforward due to conflicting information regarding the system’s collector area. In the original contractor proposal, each unit is listed as having 3.514 m2 of “solar collecting area”. In Table A1, Appendix A, the same system is listed as having 2.74 m2 of “solar collecting area”. Each tube has a 47 mm external diameter and the length effectively exposed was measured at 1.425 m. If one assumes the collector rack dimensions as the gross collector area, that would be 2.76 m2 for each unit, and the production reported would be 827.6 kWh/m2/yr based on gross area. This is a relatively high number and indicates a strong performance of the system. Considering hot water at 50°C and cold water at 7.2°C, the delivered energy would represent a solar fraction of 32.5% of a load of 168,639 kWh/yr.
Model name
Model source
Reference collector area per unit (m2)
Collector optical efficiency FR(τα)
Thermal loss of collectors FRUL
Usage volume (L/day)
Usage temperature (°C)
RET1 Globe Solar Energy, Inc.
3.51 0.6 0.7 3,300 50
RET2 Globe Solar Energy, Inc.
3.51 0.6 0.7 9,284* 50
RET3 SolarCity Partnership
2.23 0.48 1.31 9,284* 50
RET4 SolarCity Partnership
2.23 0.48 1.31 5,720** 60
Table 2: Key parameters in the different RETScreen scenarios
*Measured pre-retrofit water usage**Measured post-retrofit water usage
SolarCity Partnership7
Wilmar Court Final Report
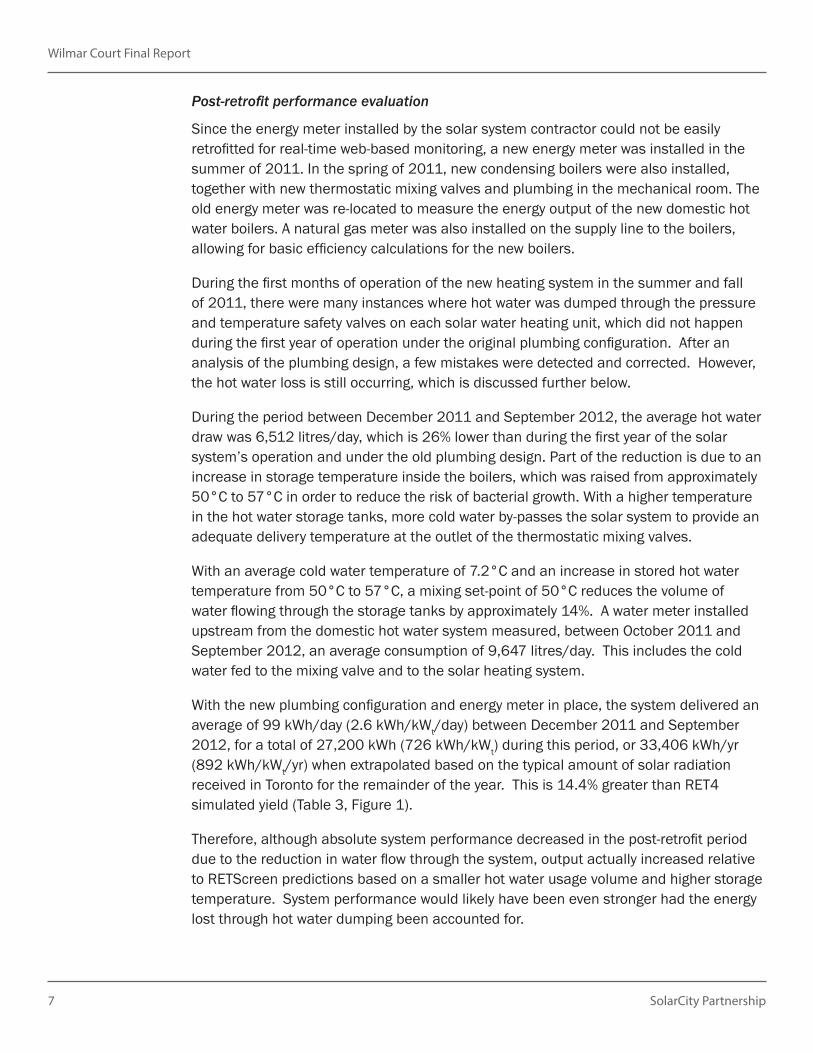
Post-retrofit performance evaluation
Since the energy meter installed by the solar system contractor could not be easily retrofitted for real-time web-based monitoring, a new energy meter was installed in the summer of 2011. In the spring of 2011, new condensing boilers were also installed, together with new thermostatic mixing valves and plumbing in the mechanical room. The old energy meter was re-located to measure the energy output of the new domestic hot water boilers. A natural gas meter was also installed on the supply line to the boilers, allowing for basic efficiency calculations for the new boilers.
During the first months of operation of the new heating system in the summer and fall of 2011, there were many instances where hot water was dumped through the pressure and temperature safety valves on each solar water heating unit, which did not happen during the first year of operation under the original plumbing configuration. After an analysis of the plumbing design, a few mistakes were detected and corrected. However, the hot water loss is still occurring, which is discussed further below.
During the period between December 2011 and September 2012, the average hot water draw was 6,512 litres/day, which is 26% lower than during the first year of the solar system’s operation and under the old plumbing design. Part of the reduction is due to an increase in storage temperature inside the boilers, which was raised from approximately 50°C to 57°C in order to reduce the risk of bacterial growth. With a higher temperature in the hot water storage tanks, more cold water by-passes the solar system to provide an adequate delivery temperature at the outlet of the thermostatic mixing valves.
With an average cold water temperature of 7.2°C and an increase in stored hot water temperature from 50°C to 57°C, a mixing set-point of 50°C reduces the volume of water flowing through the storage tanks by approximately 14%. A water meter installed upstream from the domestic hot water system measured, between October 2011 and September 2012, an average consumption of 9,647 litres/day. This includes the cold water fed to the mixing valve and to the solar heating system.
With the new plumbing configuration and energy meter in place, the system delivered an average of 99 kWh/day (2.6 kWh/kWt/day) between December 2011 and September 2012, for a total of 27,200 kWh (726 kWh/kWt) during this period, or 33,406 kWh/yr (892 kWh/kWt/yr) when extrapolated based on the typical amount of solar radiation received in Toronto for the remainder of the year. This is 14.4% greater than RET4 simulated yield (Table 3, Figure 1).
Therefore, although absolute system performance decreased in the post-retrofit period due to the reduction in water flow through the system, output actually increased relative to RETScreen predictions based on a smaller hot water usage volume and higher storage temperature. System performance would likely have been even stronger had the energy lost through hot water dumping been accounted for.

SolarCity Partnership 8
Wilmar Court Final Report
Table 3: Actual vs. RETScreen simulated yield of the Wilmar Court SDHW system
Time period Actual energy delivered (kWh/yr)
Actual water load (L/day)
RET1 energy delivered (kWh/yr)
RET2 energy delivered (kWh/yr)
RET3 energy delivered (kWh/yr)
RET4 energy delivered (kWh/yr)
Pre-retrofit
Apr 2010 – Apr 2011
54,821 9,284 (Hot water only)
47,700 59,900 30,300 -
Post-retrofit
Sep 2011 – Sep 2012
33,406* 9,647 (Hot water + mixing valve cold water)
- - - 29,200
*Energy delivered by the SDHW system from September to November 2011 was extrapolated based on the typical amount of solar radiation received in Toronto during this period.
Figure 1: Actual vs. RETScreen simulated yield of the Wilmar Court SDHW system
0
10,000
20,000
30,000
40,000
50,000
60,000
70,000
Pre-retrofit Post-retrofit
Ener
gy d
eliv
ered
(kW
h/yr
)
Actual RET1 RET2 RET3 RET4

SolarCity Partnership9
Wilmar Court Final Report
System temperature
The reduction of water flow through the SDHW system may also be contributing to the problem of hot water loss through the pressure and temperature safety valves on each unit. With less water flowing through the SDHW system, the temperature of the circulating water would increase. If the water in a unit becomes too hot, this would trigger the safety valve. The supplier has informed management that the safety valves have an opening set-point of 65.5°C (150°F). It is not clear at this point why such a relatively low temperature was chosen, perhaps to protect the plastic piping that connects the solar tanks to the mechanical room. However, most plastic piping in North America is rated for 82.2°C (180°F).
To further investigate this issue, the hourly performance of the system was analyzed for one week in August 2012. Figure 2 presents the hot water draw, cold water inlet temperature and hot water outlet temperature from the solar system over this monitoring period. The hot water delivered did not rise above 60°C at any time and usage did not drop significantly over the weekend, as some had expected. If the temperature of the system did not exceed the set point of 65.5°C at all during a week in the summer, it is unlikely that it would exceed the set point at other times of the year. Therefore, further study is needed in order to determine what is causing the safety valves to open. During the one week monitoring period, the average draw was 5,720 litres/day and the average energy delivered was 130 kWh/day (3.5 kWh/kWt/day).
It is recommended that future monitoring efforts assess potential net cooling effects of the solar thermal system during the winter. In the winter months, water which remains in the solar storage tanks overnight will likely undergo significant cooling. If the water temperature in the solar tanks drops below the temperature of the incoming municipal water, the solar system could be causing net cooling during early morning water draws when the water in the solar storage tanks has not been sufficiently heated. This effect may not be captured by the BTU meters.

SolarCity Partnership 10
Wilmar Court Final Report
Figure 2: Hot water usage and system temperatures from August 1st to 7th, 2012
0
10
20
30
40
50
60
70
0
200
400
600
800
1000
1200
12:0
0 AM
6:00
AM
12:0
0 PM
6:00
PM
12:0
0 AM
6:00
AM
12:0
0 PM
6:00
PM
12:0
0 AM
6:00
AM
12:0
0 PM
6:00
PM
12:0
0 AM
6:00
AM
12:0
0 PM
6:00
PM
12:0
0 AM
6:00
AM
12:0
0 PM
6:00
PM
12:0
0 AM
6:00
AM
12:0
0 PM
6:00
PM
12:0
0 AM
6:00
AM
12:0
0 PM
6:00
PM
Temperature (°C)
Hot w
ater
dra
w (L
)
Hot water usage Cold water inlet temp Hot water outlet temp

SolarCity Partnership11
Wilmar Court Final Report
Heat tracing equipment
Another point of interest was the energy consumed by the heat tracing equipment attached to the connecting pipes. The circuits (there are 4 independent circuits) have a set-point of 8°C. During the winter of 2009/2010, each circuit used an average of 21.38 kWh, which was considered to be negligible.
Boiler efficiency
With dedicated natural gas and energy meters installed on the new boilers, it was possible to calculate the average boiler efficiency, which was evaluated over a 7 month period (Table 4). Assuming again a heating value of 10.55 kWh/m3, the equivalent heating value for the period would have been 108,653 kWh (10,298.84 m3 x 10.55 kWh/m3), for a heating delivered by the boilers of 71,052 kWh. Therefore, the average efficiency was 65% for this period.
Date Natural gas input (x 100 ft3)
Natural gas input (m3)
Natural gas input (kWh)
Energy output (x 1000 BTU)
Energy output (kWh)
Feb 8, 2012 882 2,498 26,349 363,046 106,398Sep 12, 2012 4,519 12,796 135,002 605,487 177,451Difference 3,637 10,299 108,653 242,441 71,052
Table 4: Measured natural gas inputs and energy outputs of Wilmar Court’s DHW boilers
Since solar pre-heating can impact the boiler’s capacity to condense, the same analysis was done for February 2012, a month when the solar contribution is typically low. For the period between February 8 and February 29 2012, the average boiler efficiency was 71%. In this case, it is likely that a combination of lower solar contribution and colder mains water temperature helped to increase the average efficiency. However, this is still significantly lower than the typical efficiencies of plate condensing boilers, which usually exceed 90%. The lower than expected boiler efficiency is likely due to high recirculation flow rates and the fact that the recirculation pipe return is connected to the supply pipe to the boiler. This maintains the temperature at the inlet of the boiler at relatively high levels, preventing condensation on the boiler heat exchanger. This analysis demonstrates the importance of performance verification for all major components of system retrofits.
It should be noted that even without the impact on condensation in the boiler, solar heated water is more difficult for the boiler to heat than cold water, and so the boiler’s efficiency suffers. This is due simply to the fact that more energy is transferred between two systems with a higher differential temperature, and less energy is transferred between two systems that are closer in temperature.

SolarCity Partnership 12
Wilmar Court Final Report
BUSINESS CASETable 5 presents the business case for the Wilmar Court solar thermal project. This analysis uses the post-retrofit (2011-2012) delivered energy of 33,406 kWh/yr, which would save approximately $1,583/yr, assuming a natural gas price of 35¢/m3. The simple payback for this scenario would be 89.2 years before grants and 42.9 years after. Payback would have been more favourable had the system continued to perform at pre-retrofit levels.
Table 5: Wilmar Court solar thermal project business case*
Total cost installed
Grants Array output (kWh/yr)
Dollars saved
Simple payback (yrs)
Simple payback after grants (yrs)
Adjusted feasibility study $141,147 $73,200 33,406 $1,583 89.2 42.9
*This analysis assumes a 70% burner efficiency and a burner-tip natural gas price of $0.35/m3.

SolarCity Partnership13
Wilmar Court Final Report
APPENDIX A: SYSTEM SCHEMATICS
5 Globe Solar Energy Inc. How GSE IP-195 Works. Available at: http://www.globesolarenergy.com/php_file/product/ip195/how_work.php
Figure A1: Compact solar heating system with evacuated tube and heat pipes5

SolarCity Partnership 14
Wilmar Court Final Report
6 Globe Solar Energy Inc. GSE IP-195 User’s Manual. Available at: http://www.globesolarenergy.com/images/manuals/user_manual_online.pdf
Figure A2: Typical compact passive SDHW system installation6

SolarCity Partnership15
Wilmar Court Final Report
7 Globe Solar Energy, Inc. A Case Study on 24 Panel GSE IP-195 Solar Hot Water System for Wilmar Court.
Figure A3: Wilmar Court SDHW system layout7

SolarCity Partnership 16
Wilmar Court Final Report
Table A1: Detailed system specifications8
8 Globe Solar Energy Inc. GSE IP-195 Specifications. Available at: http://www.globesolarenergy.com/php_file/product/ip195/ip195_specification.php
Model GSE IP-195Number of tubes 24Length of tubes 1500 mmOuter tube diameter 47 mmTube thickness 1.6 mmTube thermal expansion 3.3 x 10⁻⁶ oCAbsorptive coating Graded Al-N / AlAbsorbency > 92% (AM 1.5)Volumetric capacity 150 LEmittance 7% (100oC)Insulation Polyurethane, 55 mmSolar collecting area 2.74 m2
Vacuum P < 0.005 PaStagnation temperature < 220oCHeat loss < 0.8 W/m2
Tested pressure 150 PSIWorking pressure 79 PSITilt angle 45o
Weight empty 75 kgMax. pressure 11 kg or 150 PSIInlet and outlet ½ inchesT&P valve port ¾ inchesReflector Flat plate diffuse, aluminumFrame Aluminum alloyDimensions 78 ¾“ x 56 ¾“ x 60 ½” (W x D x H for flat roofs)

SolarCity Partnership17
Wilmar Court Final Report
APPENDIX B: MODIFIED RETSCREEN INPUTSModifications were made to the RET1 and RET2 models (since these were not created by the SolarCity Partnership) in order to more accurately simulate the Wilmar Court system. The calculation of the modified RETScreen inputs used in RET3 and RET4 is explained below.
In RET1 and RET2, FR(τα) and FRUL were not appropriate for the type of collector and the chosen reference area (which appeared to be the absorber area partially based on the perimeter of the vacuum tubes). The gross area of each unit collector, measured as the area of the racking structure that supports the tubes, is 2.8 m2. The FR(τα) parameter based on gross area for double glass vacuum tubes would be in the range of 0.35 to 0.45.
The RET1 and RET2 models used a gross area of 3.51 m2 which is larger than the calculated gross area, and so FR(τα) would have been even smaller than the range stated above. Therefore, it was decided that the FR(τα) of 0.6 used in these models was an unrealistic value.
The RET3 and RET4 models were based on system aperture area. This was calculated in accordance with the ISO 9488 for tubular collectors with reflectors, and incorporated collector dimensions measured on site. System aperture area was calculated to be 2.23 m2 per unit.9
RET3 and RET4 also incorporated test data from the Solar Rating Certification Corporation (SRCC) and Solar Keymark. To determine the efficiency parameters used in RET3 and RET4, the values for the Sunrain U-tube collector model TZ47/1500-25U were used as a starting point, again based on absorber area values. This model was chosen because it has a similar geometry to the GSE IP-195 collectors used at Wilmar Court, with vacuum tubes 47 mm in diameter and 1500 mm long. However, U-tube vacuum tube collectors are more efficient than similar heat pipe collectors. Since data for similar U-tube and heat pipe collectors from SunRain was not available, data from similar Himin double-glass vacuum tube collectors was compared. When comparing a U-tube to a heat pipe collector, FR(τα) was reduced by 18% and FRUL was reduced by 13%. Therefore, in RET3 and RET4, FR(τα) was adjusted to 0.48 and FRUL to 1.31.
9 Collector aperture area = Reflector area + Tube projection area without reflector = (1.044 m x 1.723 m) + (24 x 0.047 m x 0.38 m) = 2.23 m2

SolarCity Partnership 18
Wilmar Court Final Report
Considering that the average annual solar irradiation on a plane tilted at 45o and with an azimuth of 13o SE in Toronto is 1.478 MWh/m2 and the “aperture window” above each collector is approximately 2.46 m2 (1.72 m x 1.43 m), the total available irradiation in one year would be 87.2 MWh. To produce 54.8 MWh, the system would have had to operate with an average efficiency of 62.8%. This is very unlikely, considering that the intercept point of the efficiency curve of the solar collector (FR(τα)) is below this value. The system would have had to operate significantly below ambient temperature to achieve this efficiency, and such conditions are unrealistic. Therefore, this indicates an error in the initial measurements taken by the vendor.

SolarCity Partnership19
Wilmar Court Final Report
We want to hear from you!If you have further best practice recommendations, insights into system design, deployment or maintenance or a project to profile, please get involved with the SolarCity Partnership! Contact us at:
289-268-3902www.solarcitypartnership.ca
About the SolarCity PartnershipThe SolarCity Partnership was developed to provide third party monitoring of large urban solar installations and develop best practice recommendations based on independent project evaluations. The Partnership is an information-sharing hub for both public and private organizations involved in deploying solar power. Our SolarCityPartnership.ca website provides case studies, research, and solar radiation data to help with the effec-tive use of zero emissions energy from the sun.
Supporting PartnersThe SolarCity Partnership was founded in 2008 by the Toronto Atmospheric Fund, the City of Toronto Energy and Waste Management Office, and Toronto and Region Conservation (TRCA), with support from the Federation of Canadian Municipalities Green Municipal Fund. Phase 2 of the Partnership, co-ordinated by TRCA, has expanded to include solar facility assessments across the Greater Toronto Area with funding support from the Region of Peel and York Region, and in-kind contributions from various site partners.
© 2013 (Toronto and Region Conservation Authority). All Rights Reserved. The contents of this report do not necessarily represent the policies of the supporting agencies. Although every reasonable effort has been made to ensure the integrity of the report, the supporting agencies do not make any warranty or representation, expressed or implied, with respect to the accuracy or completeness of the information contained herein. Mention of trade names or commercial products does not consistute endorsement or recommendation of those products.