Willow Oaks Village Center Feasibility Analysis
128
SETH HARRY & ASSOCIATES, INC.●ARCHITECTS AND PLANNERS 605 MORGAN STATION ROAD ● WOODBINE, MARYLAND 21797 T.410.489.4725 ● F.410.489.7554 ● www.sethharry.com ● [email protected] Willow Oaks Village Center Feasibility Analysis April 27, 2012 Introduction Market Analysis Architectural Design Package Addendum ESRI data Proforma Economic Modeling
Transcript of Willow Oaks Village Center Feasibility Analysis

SETH HARRY & ASSOCIATES , INC .●ARCHITECTS AND PLANNERS
6 0 5 M O R G A N S T A T I O N R O A D ● W O O D B IN E , M A R Y L A N D 2 1 7 9 7
T.410.489.4725 ● F.410.489.7554 ● www.sethharry.com ● [email protected]
Willow Oaks Village Center Feasibility Analysis
April 27, 2012
Introduction
Market Analysis
Architectural Design Package
Addendum
ESRI data
Proforma Economic Modeling
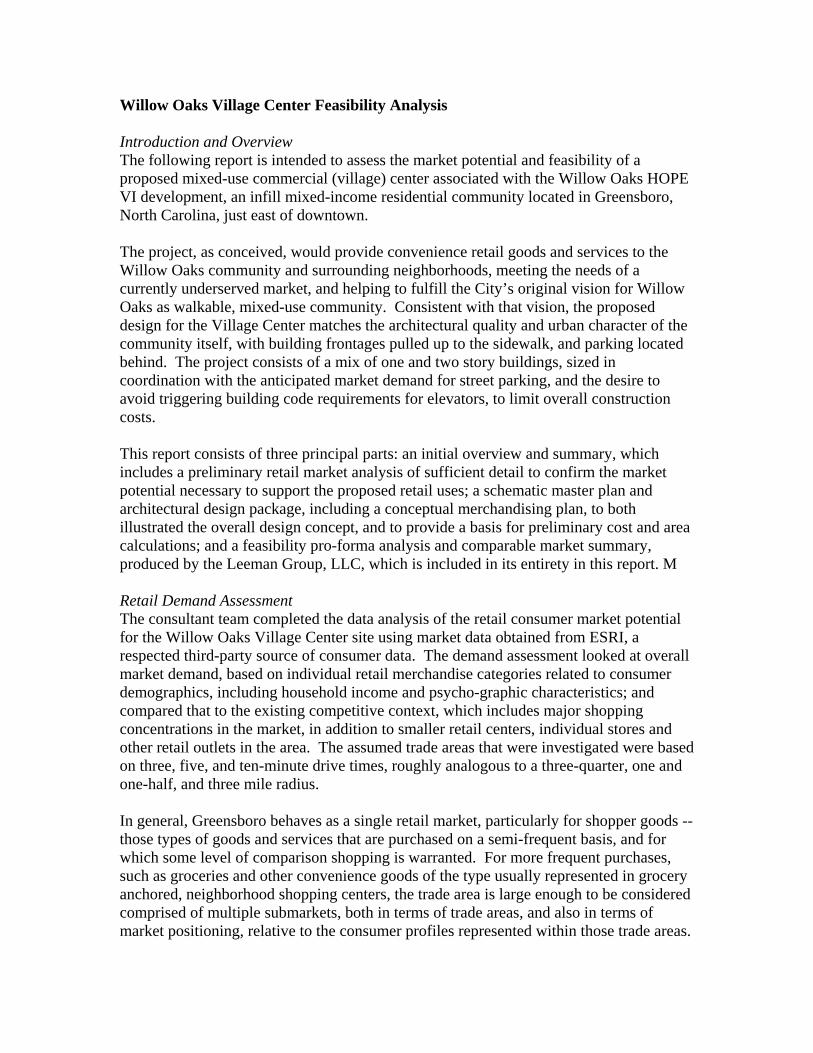
Willow Oaks Village Center Feasibility Analysis Introduction and Overview The following report is intended to assess the market potential and feasibility of a proposed mixed-use commercial (village) center associated with the Willow Oaks HOPE VI development, an infill mixed-income residential community located in Greensboro, North Carolina, just east of downtown. The project, as conceived, would provide convenience retail goods and services to the Willow Oaks community and surrounding neighborhoods, meeting the needs of a currently underserved market, and helping to fulfill the City’s original vision for Willow Oaks as walkable, mixed-use community. Consistent with that vision, the proposed design for the Village Center matches the architectural quality and urban character of the community itself, with building frontages pulled up to the sidewalk, and parking located behind. The project consists of a mix of one and two story buildings, sized in coordination with the anticipated market demand for street parking, and the desire to avoid triggering building code requirements for elevators, to limit overall construction costs. This report consists of three principal parts: an initial overview and summary, which includes a preliminary retail market analysis of sufficient detail to confirm the market potential necessary to support the proposed retail uses; a schematic master plan and architectural design package, including a conceptual merchandising plan, to both illustrated the overall design concept, and to provide a basis for preliminary cost and area calculations; and a feasibility pro-forma analysis and comparable market summary, produced by the Leeman Group, LLC, which is included in its entirety in this report. M Retail Demand Assessment The consultant team completed the data analysis of the retail consumer market potential for the Willow Oaks Village Center site using market data obtained from ESRI, a respected third-party source of consumer data. The demand assessment looked at overall market demand, based on individual retail merchandise categories related to consumer demographics, including household income and psycho-graphic characteristics; and compared that to the existing competitive context, which includes major shopping concentrations in the market, in addition to smaller retail centers, individual stores and other retail outlets in the area. The assumed trade areas that were investigated were based on three, five, and ten-minute drive times, roughly analogous to a three-quarter, one and one-half, and three mile radius. In general, Greensboro behaves as a single retail market, particularly for shopper goods -- those types of goods and services that are purchased on a semi-frequent basis, and for which some level of comparison shopping is warranted. For more frequent purchases, such as groceries and other convenience goods of the type usually represented in grocery anchored, neighborhood shopping centers, the trade area is large enough to be considered comprised of multiple submarkets, both in terms of trade areas, and also in terms of market positioning, relative to the consumer profiles represented within those trade areas.
Market positioning can often be thought of in terms of value or premium shoppers, or those who represent other specialty preferences such as organic/gourmet. In large, dense urban markets, these types of distinctions are often readily apparent and reflected in the shopping options available to the consumers in those markets. However, with the advent of large discount general merchandisers/grocers, these distinctions are typically less pronounced in smaller markets like Greensboro, where the difference in driving time and convenience between one trade area and another is not sufficient to make those kinds of differentiations relevant for most retailers or consumers. Given that, the more typical distinctions in market positioning are represented primarily at the scale of the Greensboro consumer market as a whole. In other words -- people will simply drive to where they like to shop. When looking at the ten minute drive time trade area radius for Willow Oaks, which effectively encompasses all of east Greensboro and downtown, the market is generally over-retailed in the merchandise categories which would make the most sense for a small convenience center retail mix, as would be appropriate for Willow Oaks Village Center. The same is true for the five-minute drive time trade area. However, Willow Oaks consumer market is under-retailed for those types of items, including grocery and convenience goods, in the three-minute drive time trade area. According to the market data provided by ESRI, this unmet demand roughly translates to approximately 47,000 square feet of total retail demand, based on a typical sales volume of $250 per square foot, for retail purchases of this type. This would also have to be moderated relative to the anticipated rate of market capture, which is usually expressed as a percentage of the overall unmet demand that you would be expected to attract, relative to the other options available. Taking all of this into consideration, it is reasonable to assume that -- given the emphasis on walkability and convenience associated with the developments overall design approach -- the Willow Oaks Village Center should have a relative high capture rate. Also, the more modest construction and operation costs assumed for the market, combined with a smaller anticipated per transaction sales figures, will probably allow for a higher supportable square footage number than might otherwise be assumed for a similar amount of retail demand of this type. Therefore, it is reasonable to conclude that the Willow Oaks Village Center will be able to comfortably support up to 40,000 sq. ft. of convenience retail, including limited grocery and general merchandise, with a total sales volume averaging $150 per square foot. This number does comport well with the scale and design of the Village Center as it currently exists, though it does fall outside of the conventional center type size ranges for either a convenience or grocery-anchored neighborhood shopping center types. Market Assumptions for Other Uses Because of the proposed mixed-use nature of the development, this feasibility analysis included market assumptions for other uses in addition to retail. This work was done by

the Leeman Group as part of their pro-forma and financial modeling analysis, using accepted methods of market evaluation including a survey of comparable properties, including local market rents for the relevant use types, and occupancy rates. A detailed description of assumptions and methodology are included in the Leeman study, which is contained within this document in its entirety. Summary Conclusions This analysis and feasibility study concludes that the project, in the current market environment, is not feasible, based upon accepted real estate development criteria for return on investment, relative to a combination of revenue, cost and operating considerations. However, it should be noted that all of the assumptions upon which this study is based were appropriately conservative, given the current softness in the market, and that as the market for consumer goods in general improves, the feasibility outlook for this project should improve as well. Furthermore, a significant factor in the study’s conclusion was the residual value of the real estate, based on the cap rates for the various project components in the current market. Presently, these are trending downward, and are anticipated to continue to do so as the market recovers, suggesting the project may become feasible in the near future. And finally, though every attempt was made to use comparables that reflect the specific nature of the proposed development, many of the assumptions used in this report were, of necessity, based on conventional real estate development types, whereas the long-term demographic trends favor the type of small-scale, mixed-use development types represented in the proposed design of the Willow Oaks Village Center. We believe this bodes well for the long-term prospects for the project, given the relative scarcity of similar projects in the immediate study area.

WILLOW OAKS VILLAGE CENTER
Financial Feasibility Study Pro Forma Analysis & Assumptions
……………………………………………………………………………
The Leeman Group, LLC 2012 April

Page 1
……………………………………………………………………………The Leeman Group, LLC | Beaufort, SC | 502.727.5204 | www.LeemanGroupLLC.com
Executive Summary
The proposed project, Willow Oaks Village Center, is an approximately $8 to $10 million project
encompassing between 48,000 and 62,000 square feet of mixed use space (retail, office, and residential) in
seven one- and two-story buildings, in addition to 19 to 25 townhomes. The analysis is broken into three
different scenarios that vary in density and mixture of uses.
Project Facts
Name Willow Oaks Village Center
Location Willow Oaks, Greensboro, NC
Property Type Mixed-use (retail, office, residential)
Cost $8-10 million, depending on scenarios
Size 48,000 – 62,000 SF, depending on scenarios
Townhomes 19 – 25 units, depending on scenarios
Zoning TN (Traditional Neighborhood)
For detailed information on each scenario, please refer to the return summary information on the first page
of the attached Exhibit 3.1.

Page 2
……………………………………………………………………………The Leeman Group, LLC | Beaufort, SC | 502.727.5204 | www.LeemanGroupLLC.com
S E C T I O N 1
Metro Market Analysis
For the purposes of this report the submarket for the Willow Oaks Village Center is defined as the
Greensboro/Winston-Salem metropolitan area.
Office Sector Trends
Over the past five years, office absorption in the Greensboro/Winston-Salem market has remained positive.
In 2011, approximately 91,000 square feet of office space was absorbed. Over the past five years, vacancy
rates have been high (between 17% and 21%), but have been steadily falling since 2008 and are anticipated to
continue falling over the coming years. Vacancy rates in the metro area are slightly higher than the national
average (REIS Report, April 2012).
As the graph shown in Exhibit 1.2 illustrates, office rents in the City of Greensboro are lower than the State
average, but slightly higher than the County and Metro areas. Average office rental rates are currently just
below $15.50 per square foot per year. According to REIS Reports, the average annual rent growth rate is
predicted to be 2.5% from 2012 to 2016.
EXHIBIT 1.2: Asking Price Index Trends for Greensboro, NC Office for Lease
Retail Sector Trends
Over the past five years, retail absorption in the Greensboro/Winston-Salem market has remained positive.
In 2011, approximately 52,000 square feet of retail space was absorbed. Over the past five years, retail

Page 3
……………………………………………………………………………The Leeman Group, LLC | Beaufort, SC | 502.727.5204 | www.LeemanGroupLLC.com
vacancy rates have held steady between 10% and 11%. Retail vacancy rates in the metro area are currently
about a point higher than the national average (REIS Report, April 2012).
As the graph shown in Exhibit 1.3 illustrates, retail rents in the City of Greensboro are lower than the State
average and nearly the same as rents in the County and Metro areas. Average retail rental rates are currently
just over $14.00 per square foot per year. The average annual retail rent growth rate is predicted to be 2.5%
from 2012 to 2016.
EXHIBIT 1.3: Asking Price Index Trends for Greensboro, NC Retail for Lease
In neighborhood shopping centers, the non-anchor asking rent growth rate has been positive and is currently
slightly higher than the national average (REIS Report, April 2012).
Residential Sector Trends
Residential vacancy rates averaged 9.4% over the past five years, but are trending down and are currently at
7.5%. The average two bedroom apartment in Greensboro/Winston-Salem is 939 square feet and the rent
averages $0.73 per square foot for a total of $689 per month. Two bedroom apartments constitute over 58%
of the unit type mix with three bedroom units comprising just under 8% of the total unit mix. Rental
residential absorption has remained positive over the last five years, with 1,165 units absorbed and 1,161 units
constructed in the Greensboro market over the same time period.

Page 4
……………………………………………………………………………The Leeman Group, LLC | Beaufort, SC | 502.727.5204 | www.LeemanGroupLLC.com
S E C T I O N 2
Comparable Properties
With the exception of properties in downtown Greensboro, the selection of newly constructed mixed-use
properties is fairly limited in Greensboro. This analysis of comparables analyzes each use sector separately:
office, retail, apartments, and townhomes. In today’s market, the combination of all these uses in one
centralized, walkable neighborhood such as Willow Oaks is considered to be more desirable and appealing to
prospective tenants and buyers than any one use would be without the others.
Please note that all office and retail rental rates referred to in the analysis in the section are triple net (NNN).
Office Space
The office suites proposed for Willow Oaks Village Center will be small in scale and high quality Class A
space. The suites shown in the plan vary in size from about 1000 square feet to a maximum contiguous space
of about 7600 square feet. Exhibit 2.1 outlines several comparable office properties in the Greensboro
market.
EXHIBIT 2.1
Willow Oaks Village Center Office Comparables Address SF Rent/SF Built/Renovated Building Class Avg. Tenant Size
328 E. Market St. 26,000 $17.00 1920/2009 A 9,000 SF
1914 New Garden Rd. 40,000 $15.80 – 16.80
2007 A 2,000 SF
2203 North Church St. 10,880 $16.67 Recently updated
A 2,000 SF
324 South Elm St. 25,000 $17.00 2010 A 5,000 SF Information from Costar and LoopNet
328 E. Market St. 1914 New Garden Rd. 2203 N. Church St. 324 S. Elm St.
These four properties offer similar tenant size, offer high quality Class A space, and are located fairly close to
the subject property. These comparable properties are located closer to the central business district of
downtown Greensboro than the subject property. Due the similarities in quality and size between these
properties and the subject property, but also taking into account the proximity to the CBD, the Willow Oaks
Page 5
……………………………………………………………………………The Leeman Group, LLC | Beaufort, SC | 502.727.5204 | www.LeemanGroupLLC.com
Village Center pro forma discussed in a subsequent section conservatively anticipates an office rent rate of
$15.50 per square foot.
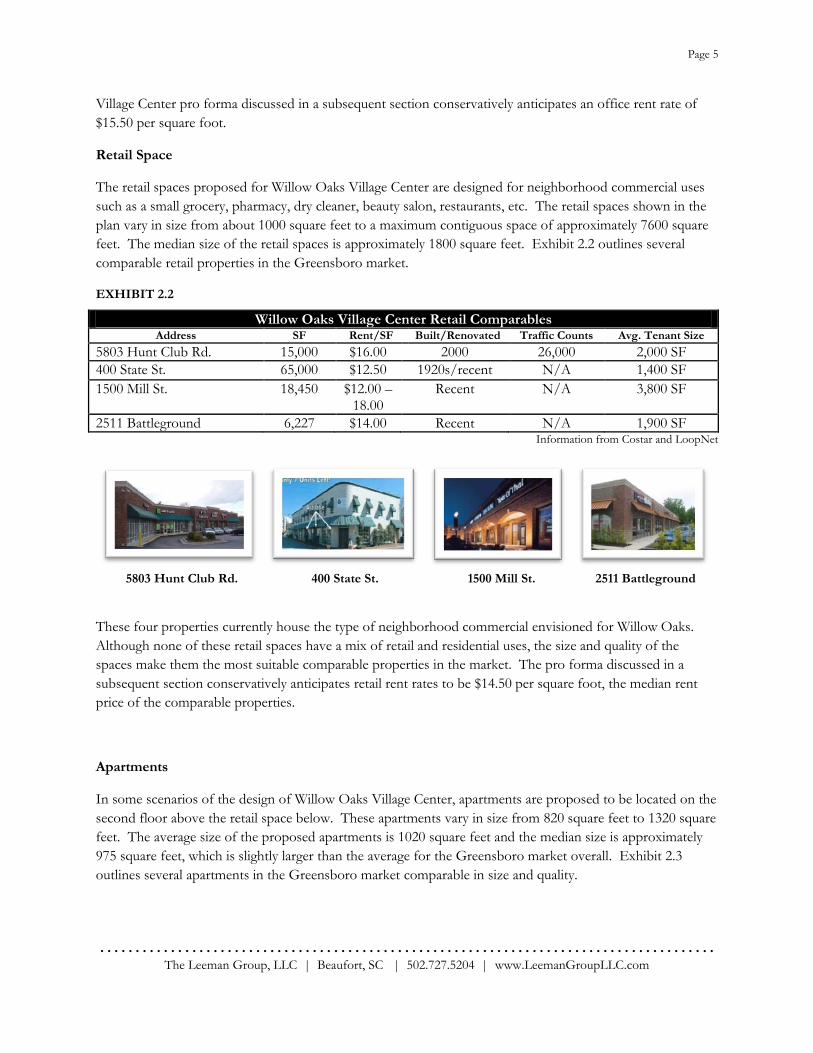
Retail Space
The retail spaces proposed for Willow Oaks Village Center are designed for neighborhood commercial uses
such as a small grocery, pharmacy, dry cleaner, beauty salon, restaurants, etc. The retail spaces shown in the
plan vary in size from about 1000 square feet to a maximum contiguous space of approximately 7600 square
feet. The median size of the retail spaces is approximately 1800 square feet. Exhibit 2.2 outlines several
comparable retail properties in the Greensboro market.
EXHIBIT 2.2
Willow Oaks Village Center Retail Comparables Address SF Rent/SF Built/Renovated Traffic Counts Avg. Tenant Size
5803 Hunt Club Rd. 15,000 $16.00 2000 26,000 2,000 SF
400 State St. 65,000 $12.50 1920s/recent N/A 1,400 SF
1500 Mill St. 18,450 $12.00 – 18.00
Recent N/A 3,800 SF
2511 Battleground 6,227 $14.00 Recent N/A 1,900 SF Information from Costar and LoopNet
5803 Hunt Club Rd. 400 State St. 1500 Mill St. 2511 Battleground
These four properties currently house the type of neighborhood commercial envisioned for Willow Oaks.
Although none of these retail spaces have a mix of retail and residential uses, the size and quality of the
spaces make them the most suitable comparable properties in the market. The pro forma discussed in a
subsequent section conservatively anticipates retail rent rates to be $14.50 per square foot, the median rent
price of the comparable properties.
Apartments
In some scenarios of the design of Willow Oaks Village Center, apartments are proposed to be located on the
second floor above the retail space below. These apartments vary in size from 820 square feet to 1320 square
feet. The average size of the proposed apartments is 1020 square feet and the median size is approximately
975 square feet, which is slightly larger than the average for the Greensboro market overall. Exhibit 2.3
outlines several apartments in the Greensboro market comparable in size and quality.

Page 6
……………………………………………………………………………The Leeman Group, LLC | Beaufort, SC | 502.727.5204 | www.LeemanGroupLLC.com
EXHIBIT 2.3
Willow Oaks Village Center Apartment Comparables Address SF Monthly Rent Bed/Bth Price/SF
1402 Bridford Parkway 985 $983 2/2 $1.00
2355 Copperstone Dr. 950 $770 2/2 $0.81
311 King St. 968 $1215 2/2 $1.25
7029 W. Friendly Ave. 937 $1049 2/2 $1.12 Information from Costar and LoopNet
1402 Bridford Pkwy 2355 Copperstone Dr. 311 King St. 7029 W. Friendly Ave.
For this type of higher end apartment homes, the average price per square foot is $1.05 and the median price
per square foot is $1.06. The pro forma detailed in a later section of this report uses the more conservative of
the two prices, $1.05 per square foot, to estimate the average cost of apartments in the Willow Oaks Village
Center.
Townhomes
The easternmost section of the proposed site plan includes several townhomes. These townhomes are
proposed to be between 1200 square feet (3B/2.5BTH) and 1300 square feet (3B/3BTH). Each will be three
stories and will have a garage on the first level of the unit. Exhibit 2.4 outlines a few townhomes in the
Greensboro market that are comparable in size and quality.
EXHIBIT 2.4
Willow Oaks Village Center Townhome Comparables Address SF Monthly Rent Bed/Bth Price/SF
Kerner Mill Townhomes 1050 $1400 2/1 $1.33
Laurel Bluff Townhomes 1700 $1050 3/2.5 $0.62
Reedy Fork Townhome 1350 $950 3/2.5 $0.70
Single Family Home (Lonita St.)
1536 $1250 3/2.5 $0.81
Information from Costar and LoopNet

Page 7
……………………………………………………………………………The Leeman Group, LLC | Beaufort, SC | 502.727.5204 | www.LeemanGroupLLC.com
Kerner Mill Laurel Bluff Reedy Fork Single Family Home
Based on a limited selection of townhomes in the Greensboro area, the average price per square foot is $0.87
and the median price per square foot is $0.76. The pro forma detailed in a later section of this report uses the
higher of the two prices, $0.87 per square foot, to estimate the average rental price of the townhomes in the
Willow Oaks Village Center. The location of the subject townhomes at Willow Oaks is considered to be
more desirable than the available comparables and the subject property will have better finishes and amenities
than the comparable properties shown above.
Land
The site is 5.46 acres total; 3.05 acres of which is mixed-use (retail, office, and residential), 2.30 acres is the
townhome development, and 0.11 acres is a public plaza. The
EXHIBIT 2.5
Willow Oaks Village Center Land Comparables Address Acres Asking Price Price/Acre Use
1407 Yanceyville St. 0.95 $450,000 $473,684 Retail, Medical
2210 Freeman Mill Rd. 6.03 $499,000 $82,753 Multi-family, Retail
2727 Ring Rd. 1.24 $810,210 $653,395 Commercial
2414 Battleground Ave. 5.27 $3,952,500 $750,000 Commercial
449 Guilford College Rd. 3.48 $699,000 $200,862 Multifamily Information from Costar and LoopNet
As Exhibit 2.5 above demonstrates, the price of land varies greatly throughout different parts of the city and
different types of land. In the absence of an appraisal of the parcel, the land price per acre for retail and
commercial uses in this location can be estimated at $450,000 and land zoned for multifamily can be
estimated at $150,000. In order to accurately determine a fair market value for the land, an official appraisal
should be conducted.
Page 8
……………………………………………………………………………The Leeman Group, LLC | Beaufort, SC | 502.727.5204 | www.LeemanGroupLLC.com
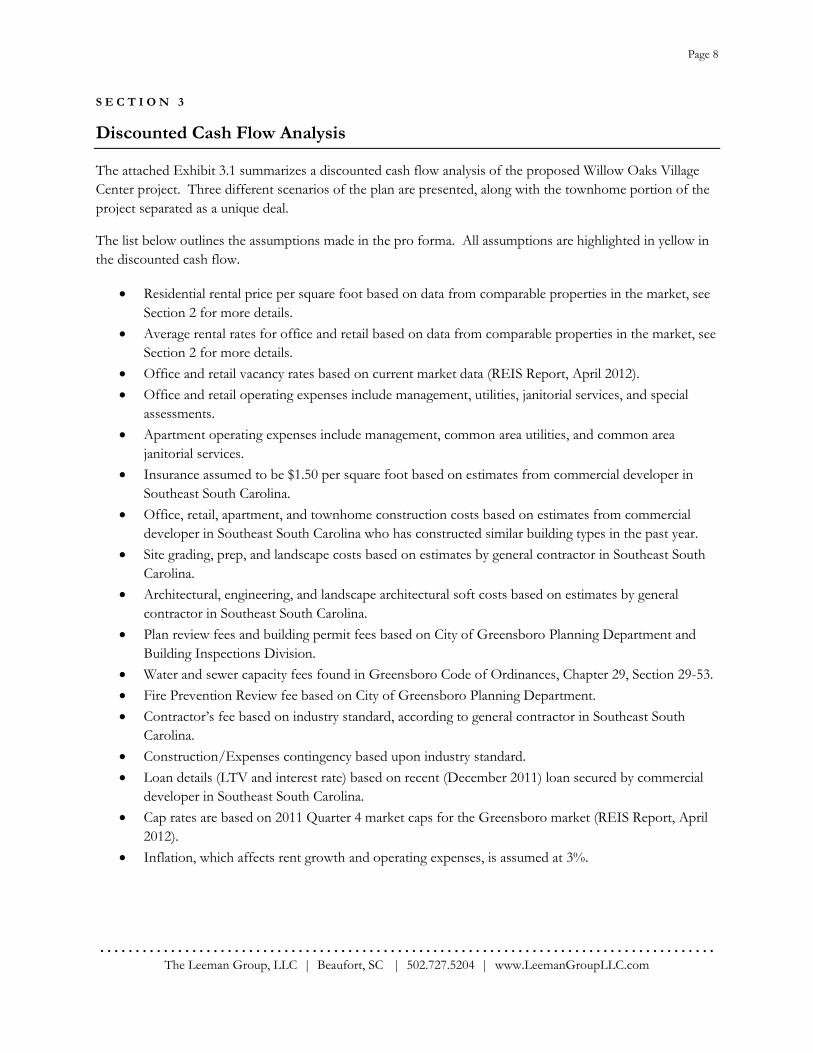
S E C T I O N 3
Discounted Cash Flow Analysis
The attached Exhibit 3.1 summarizes a discounted cash flow analysis of the proposed Willow Oaks Village
Center project. Three different scenarios of the plan are presented, along with the townhome portion of the
project separated as a unique deal.
The list below outlines the assumptions made in the pro forma. All assumptions are highlighted in yellow in
the discounted cash flow.
Residential rental price per square foot based on data from comparable properties in the market, see
Section 2 for more details.
Average rental rates for office and retail based on data from comparable properties in the market, see
Section 2 for more details.
Office and retail vacancy rates based on current market data (REIS Report, April 2012).
Office and retail operating expenses include management, utilities, janitorial services, and special
assessments.
Apartment operating expenses include management, common area utilities, and common area
janitorial services.
Insurance assumed to be $1.50 per square foot based on estimates from commercial developer in
Southeast South Carolina.
Office, retail, apartment, and townhome construction costs based on estimates from commercial
developer in Southeast South Carolina who has constructed similar building types in the past year.
Site grading, prep, and landscape costs based on estimates by general contractor in Southeast South
Carolina.
Architectural, engineering, and landscape architectural soft costs based on estimates by general
contractor in Southeast South Carolina.
Plan review fees and building permit fees based on City of Greensboro Planning Department and
Building Inspections Division.
Water and sewer capacity fees found in Greensboro Code of Ordinances, Chapter 29, Section 29-53.
Fire Prevention Review fee based on City of Greensboro Planning Department.
Contractor’s fee based on industry standard, according to general contractor in Southeast South
Carolina.
Construction/Expenses contingency based upon industry standard.
Loan details (LTV and interest rate) based on recent (December 2011) loan secured by commercial
developer in Southeast South Carolina.
Cap rates are based on 2011 Quarter 4 market caps for the Greensboro market (REIS Report, April
2012).
Inflation, which affects rent growth and operating expenses, is assumed at 3%.

Page 9
……………………………………………………………………………The Leeman Group, LLC | Beaufort, SC | 502.727.5204 | www.LeemanGroupLLC.com
S E C T I O N 4
Conclusions
A close examination of the proposed Willow Oaks Village Center shows the project is not feasible at this time
under the current assumptions. In all scenarios of the project, the internal rate of return is negative, which is
unacceptable. Generally speaking, the construction costs for this project are too high for the income
generated. Of the three scenarios, the ones utilizing the second floor space for office fare better than those
with apartments above the retail.
In order for this project to be feasible, construction costs would need to come down and rents would need to
increase. Also, lower cap rates would help close the gap by increasing the proceeds from the sale in year 10.
In all scenarios, a sale in year 5 is not feasible because there is not adequate time for the revenue stream to
stabilize. Significantly lowering the land price would also improve the overall returns.
Recommendations for the City of Greensboro
Because the proposed project is not feasible under current market conditions, the City of Greensboro, as the
parcel owner, has a few options to lower the costs of the project.
1. Land price. The land prices shown in the pro forma are below market value, assuming the City
would offer the land at a discounted rate to make the project more feasible to developers. The City
could consider being a partner in the deal by offering the land at no cost to significantly improve the
overall return of the project. Any reduction in the land price lowers the initial costs and reduces the
overall expenses for the development. The pro forma assumes the City donates the land designed to
be a public plaza.
2. Fee/tax abatement. The City could also offer reduced or abated fees (building permit, plan review,
water and sewer capacity) or tax abatement for the first few years. Reducing fees decreases initial
upfront costs and reducing the tax burden increases the NOI.
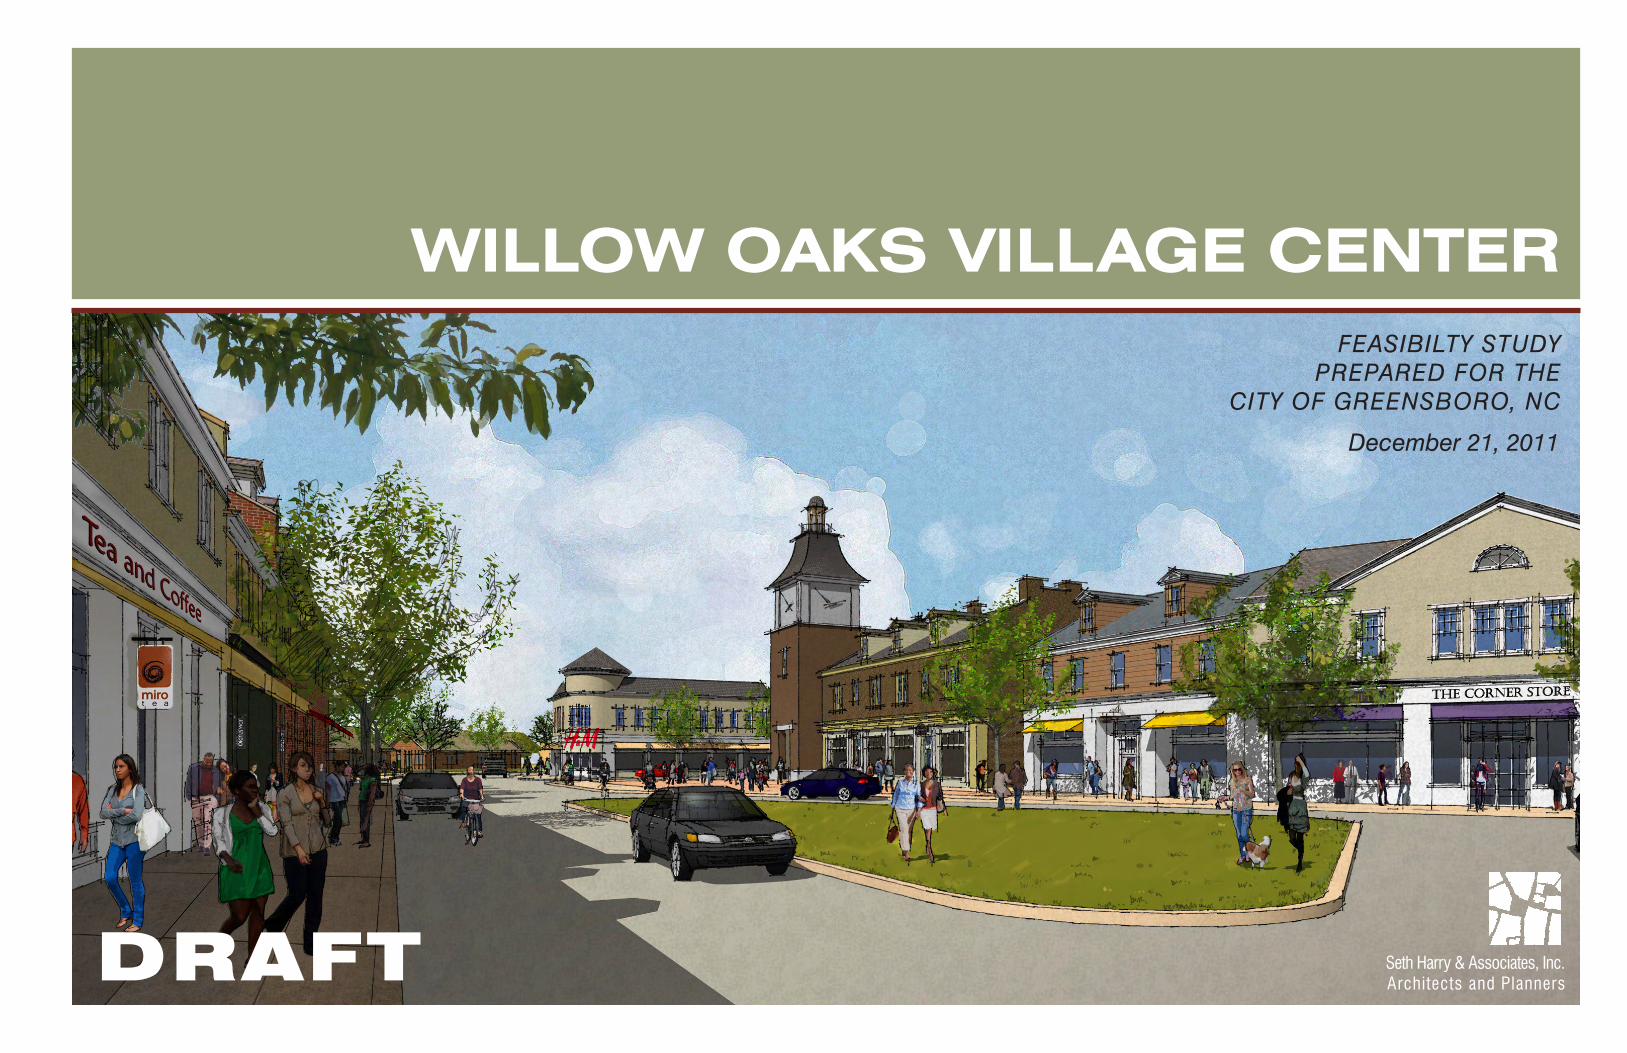
FEASIBILTY STUDYPREPARED FOR THE
CITY OF GREENSBORO, NC
WILLOW OAKS VILLAGE CENTER
December 21, 2011
Seth Harry & Associates, Inc.Architects and PlannersDRAFT

WILLOW OAKS GREENSBORO, NC
Seth Harry & Associates, Inc.Architects and Planners
Construction Type (Table 601)Type VA construction requires the structural frame, interior and exterior bearing walls, floors, and roof construction to be 1 hour rated. If a sprinkler system is not used for an area increase, then it may be used to reduce all the 1-hour ratings to 0-hours for Type VA.
Type VB construction requires a 0-hour rating for all structural members.
Type IIIA construction requires the structural frame, interior bearing walls, floors, and roof to be 1-hour rated, and the exterior bearing walls to be 2-hour rated. If a sprinkler system is not used for an area increase, then it may be used to reduce all the 1-hour ratings to 0-hours for Type IIIA.
Type IIIB construction requires exterior bearing walls to be 2-hour rated, and all other structural elements to bee 0-hour rated.
Exterior Walls (Table 602)If the exterior walls are within between 10’ and 30’ of each other then for Type VB construction the walls do not need to be rated, but for Type IIIA, IIIB, or VB, walls must be 1-hour rated. If exterior walls are within between 5’ and 10’ of each other, then the walls must be 1-hour rated for all four construction types.
If the buildings are subdivided so that the second floor units can be walk-up B occupancies, a 2-hour fire wall is required between spaces if one space is an M occupancy. If both occupancies are B, only a 1-hour fire wall is required.
Occupant Load (Table 1004.1.1)Business – 100 sf gross/occupantMercantile - Basement and at Grade Levels – 30 sf gross/occupant Upper Floors – 60 sf gross/occupant Storage Areas – 300 sf gross/occupantAssembly without fixed seats (unconcentrated tables and chairs) – 15 sf net/occupantResidential – 200 sf gross/occupant
Exit Access Travel Distance (Sect. 1016.1)Use Groups A, M and R – 200’ without a sprinkler, 250’ with a sprinklerUse Group B – 200’ without a sprinkler, 300’ with a sprinkler
Dead-End Corridors (1018.4)In a building of use group B,M, or R-2, where the building is equipped with an automatic sprinkler system, the length of a dead-end corridor shall not exceed 50’.
The current Willow Oaks Village Center Plan shows seven discreet buildings that make up the mixed-use Village Center. Five buildings are located on the north side of McConnell Road and two are located on the south side of McConnell Road. This analysis assumes that all buildings will be no taller than two stories. The buildings on the north side are thought to be more feasible than the buildings on the south side, and if the project scope is reduced, the buildings on the north side of McConnell, facing the green, are the most important to build, both urbanistically and from a retail perspective.
The code analysis was done using the 2009 International Building Code, which the 2012 North Carolina codes are based on. The City of Greensboro uses the North Carolina code.
Building FootprintsThe north side of McConnell Road has five buildings with the following footprints:Building A – 8,177 sfBuilding B – 7,597 sfBuilding C – 4,938 sfBuilding D – 4,534 sfBuilding E – 4,996 sfTotal – 30,242 sf footprint
The south side of McConnell Road has two buildings with the following footprints:Building F – 5,500 sfBuilding G – 5,298 sfTotal – 10,798 sf footprint
Use Groups (Sect. 300)The potential Use Group classifications for these buildings are Business (B), Mercantile (M), Assembly (A-2), and Residential (R). The first floors of all the buildings would most likely be either B or M, with a potential for A-2 (restaurants and cafes), and the second floors would be B, M, or R.
If the second floor is R and the first floor is B, M, or A-2, then the building will be classified as mixed-occupancy, and there would need to be a one-hour separation between floors if the building is sprinklered, and a two-hour separation if the building is not sprinklered. If the first and second floors are the same Use Group, then there is no need for a fire separation (508.4). If the buildings are sprinklered, a one-hour separation is required between A-2 and B or M uses.
The R Use Group would be classified as one of the following:R-2: Residential occupancies containing sleeping units or more than two dwelling units where the occupants are primarily permanent in nature, including apartment houses.R-3: Residential occupancies where the occupants are primarily permanent in nature and not classified as R-1, R-2, or R-4, including buildings that do not contain more than two dwelling units.
Allowable Building Height and Area (Sect. 503)Because all the buildings are under 9,000 sf and no more than two stories, and the buildings will be sprinklered (504.2, 506.3), any construction type is allowed. The most likely construction types to use for small scale buildings of this nature are either Type V or Type III.
Code Analysis

WILLOW OAKS GREENSBORO, NC
Seth Harry & Associates, Inc.Architects and Planners
Stories with One Exit (Sect. 1021.2)For A, B, and M Use Groups, if the occupant load is 49 or less and the travel distance is 75’ or less, only one exit is required for the first floor. If the occupant load is 29 or less and the travel distance is 75’ or less, only one exit is required from the second story.
For R Use Group, if the occupant load is 10 occupants or less and the travel distance is 75’ or less, only one exit is required for the first floor. If the occupant load is 4 dwelling units or less and the travel distance is 50’ or less, only one exit is required from the second floor.
If any of those numbers is larger, then two exits will be required.
Accessibility (1104.4)Multilevel Buildings – An accessible route is not required to stories with an aggregate area of less than or equal to 3,000 sf and located above or below an accessible level. This exception does not apply to multi-tenant facilities in Group M with more than five tenant spaces. If the second floor is greater than 3,000 sf, then an accessible route is required.
Residential Accessibility Group R-2 (Sect. 1107.6.2): In group R-2 occupancies containing more than 20 dwelling units or sleeping units, at least two percent but not less than one of the units shall be Type A. All R-2 units on a site shall be considered to determine the total number of units. Where there are four or more dwelling units or sleeping units intended to be occupied as a residence in a single structure, every dwelling unit and sleeping unit intended to be occupied as a residence shall be a Type B unit.
Group R-3 (Sect. 1107.6.3): In Group R-3 occupancies where there are four or more dwelling units or sleeping units intended to be occupied as a residence in a single structure, every dwelling unit and sleeping unit intended to be occupied as a residence shall be a Type B unit.
Exception (Sect. 1107.7): Where no elevator service is provided in a structure, only the dwelling units and sleeping units that are located on accessible stories are required to be Type A and/or Type B units. Although, at least one story containing dwelling units must be Type B and accessible.
Units will have to be made accessible unless there are less than four dwelling units in a single structure.
Plumbing SystemsA-2 Restaurants: WC-1/75 male, 1/75 female Lav – 1/200 Fountain – 1/500Business: WC – 1/25 for first 50, 1/50 for remainder Lav – 1/40 for first 80, 1/80 for remainder Fountain – 1/100Mercantile: WC – 1/500 Lav – 1/750 Fountain – 1/1000
Code Analysis

WILLOW OAKS GREENSBORO, NC
Seth Harry & Associates, Inc.Architects and Planners
Potential Development
Scenarios
North Side DevelopmentThere are two blocks that can be developed on the north side of McConnell Road. The western block has only one possible configuration, and has a parking lot that has 26 parking spaces and 7 on-street spaces.
The eastern block can be configured in three ways, one with a parking lot going all the way to the street to the east of the block, one with a row of townhouses enclosing the east side of the block, and one with a small green and carriage houses enclosing the block. These scenarios assume that the buildings surrounding this parking lot on the north, south, and east sides are park under or park behind townhouses, and these buildings do not use any of the parking capacity.
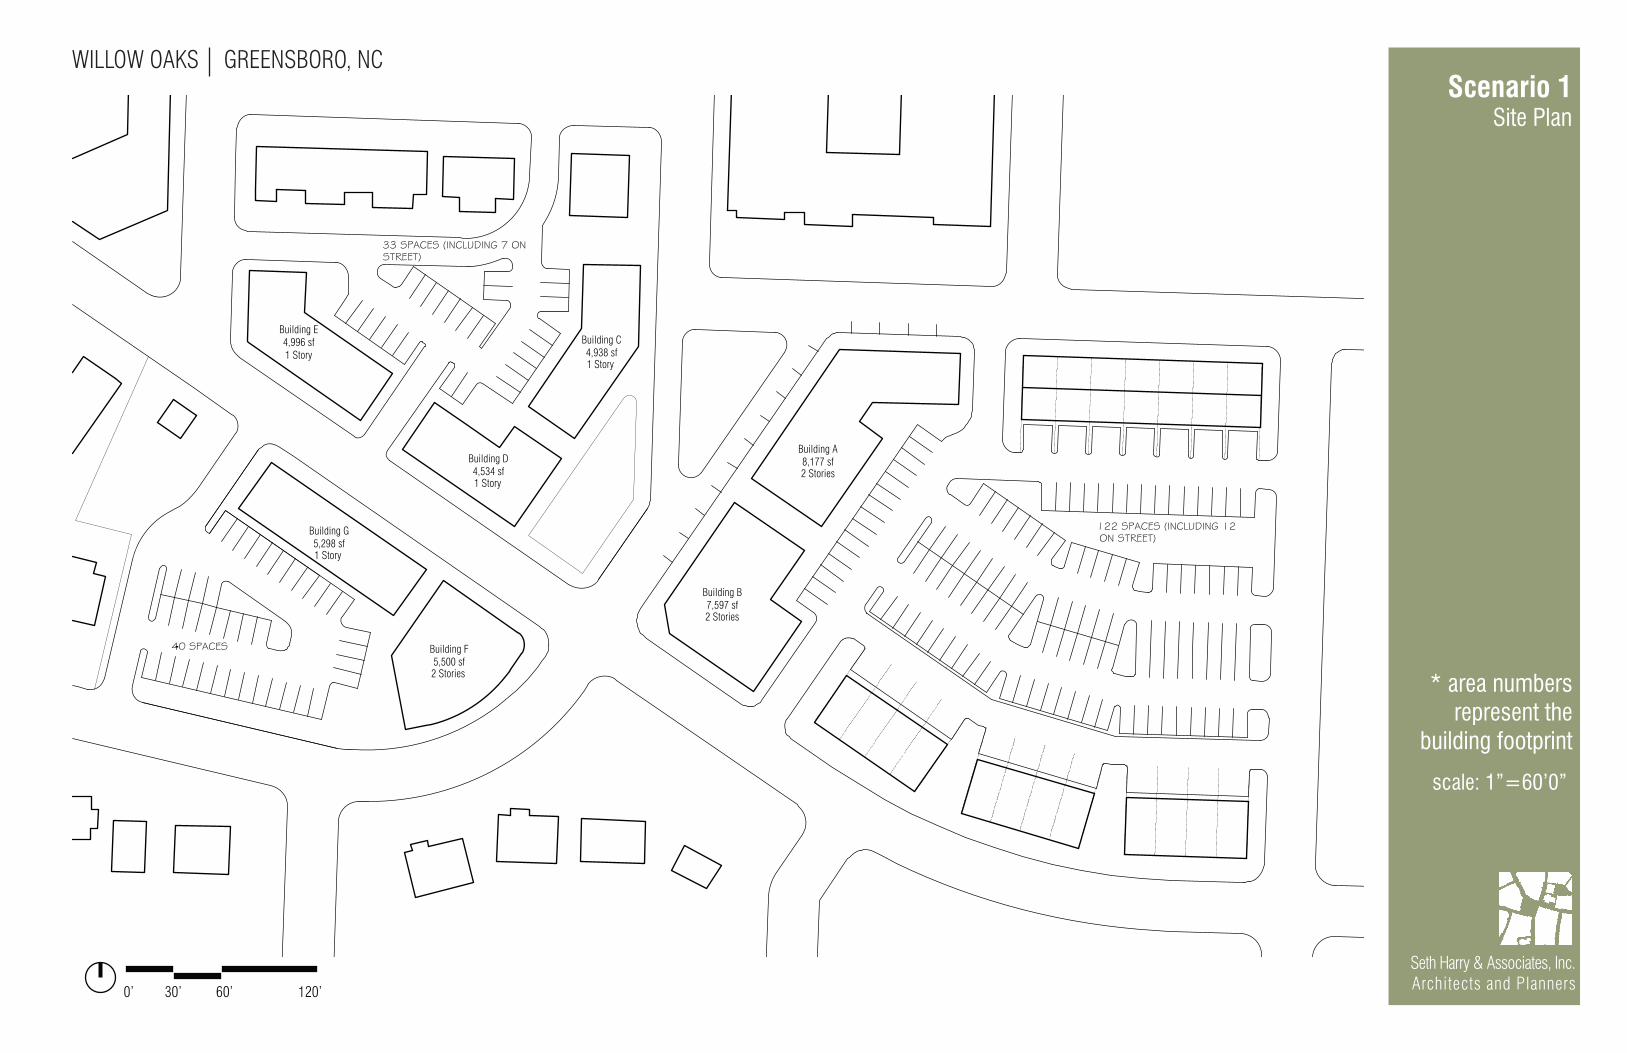
Scenario 1: If the building on the east side of the large block is not there, the lot has 122 spaces. There are also 12 on-street spaces surrounding that block. In this scenario, including both blocks on the north side of McConnell, there will be 167 spaces.
This scenario allows for the following potential buildouts and parking ratios:
Buildings B and D – 2 stories, Buildings A,C, and E – 1 story: 3.8 spaces/1000 sfBuildings A,B, and D – 2 stories, Buildings C and E – 1 story: 3.2 spaces/1000 sfBuildings B,C, and D – 2 stories, Buildings A and E - 1 story: 3.4 spaces/1000 sfBuildings A,B,C, and D – 2 stories, Building E – 1 story: 2.9 spaces/1000 sf.
The parking ratios would increase for the commercial uses if residential uses are introduced, because residential parking is calculated at a lower ratio, and may allow for shared parking to be used.
Scenario 2: If the townhouses on the east side of the large block are built, the parking lot has 78 spaces. There are also 12 on-street spaces surrounding that block. In this scenario, including both blocks on the north side of McConnell, there will be 123 spaces. If the building is built as a park-under instead of a park behind, there would be 10 more spaces.
This scenario allows for the following potential buildouts and parking ratios (with 10 additional spaces):
All Buildings 1 story: 4.0 spaces/1000 sf (4.4 spaces/1000 sf)Building B – 2 stories, Buildings A,C,D, and E – 1 story: 3.2 spaces/1000 sf (3.5 spaces/1000 sf)Buildings B and D - 2 stories, Buildings A,C and E – 1 story: 2.9 spaces/1000 sf (3.1 spaces/1000 sf)
Scenario 3: As currently built on site, the block structure includes a small green on the east side of the block. If kept, we propose that this green be fronted on either side by carriage houses for the townhouses also occupying the lot. This substantially reduces the amount of parking available to 49 spaces on that block. There are also 12 on-street spaces surrounding that block. Total north side parking would be 94 spaces. If this plan is built, in order to balance the parking, all buildings will need to be one story, and will park at 3 spaces/1000 sf.
South Side DevelopmentFor the south of McConnell site to balance, there will be only two buildings, F and G. If both buildings are one story the parking ratio is 3.7 spaces/1000 sf. If Building F is two stories of commercial and Building G is one story, the parking ratio is 2.4 If the second floor of Building F is built as residential, since it has a lower parking ratio and can share parking, the ratio is 3.1 spaces/1000 sf.
WILLOW OAKS GREENSBORO, NC
Seth Harry & Associates, Inc.Architects and Planners
Scenario 1 Site Plan
Building E4,996 sf1 Story
Building C4,938 sf1 Story
Building D4,534 sf1 Story
Building A 8,177 sf2 Stories
Building B7,597 sf2 Stories
Building F5,500 sf2 Stories
Building G5,298 sf1 Story
* area numbers represent the
building footprint
scale: 1”=60’0”
0’ 30’ 60’ 120’

WILLOW OAKS GREENSBORO, NC
Seth Harry & Associates, Inc.Architects and Planners
Scenario 2Site Plan
Building E4,996 sf1 Story
Building C4,938 sf1 Story
Building D4,534 sf2 Stories
Building A 8,177 sf1 Story
Building B7,597 sf2 Stories
Building F5,500 sf2 Stories
Building G5,298 sf1 Story
* area numbers represent the
building footprint
scale: 1”=60’0”
0’ 30’ 60’ 120’

WILLOW OAKS GREENSBORO, NC
Seth Harry & Associates, Inc.Architects and Planners
Scenario 3Site Plan
Building E4,996 sf1 Story
Building C4,938 sf1 Story
Building D4,534 sf1 Story
Building A 8,177 sf1 Story
Building B7,597 sf1 Story
Building F5,500 sf1 Story
Building G5,298 sf1 Story
* area numbers represent the
building footprint
scale: 1”=60’0”
0’ 30’ 60’ 120’
WILLOW OAKS GREENSBORO, NC
Seth Harry & Associates, Inc.Architects and Planners
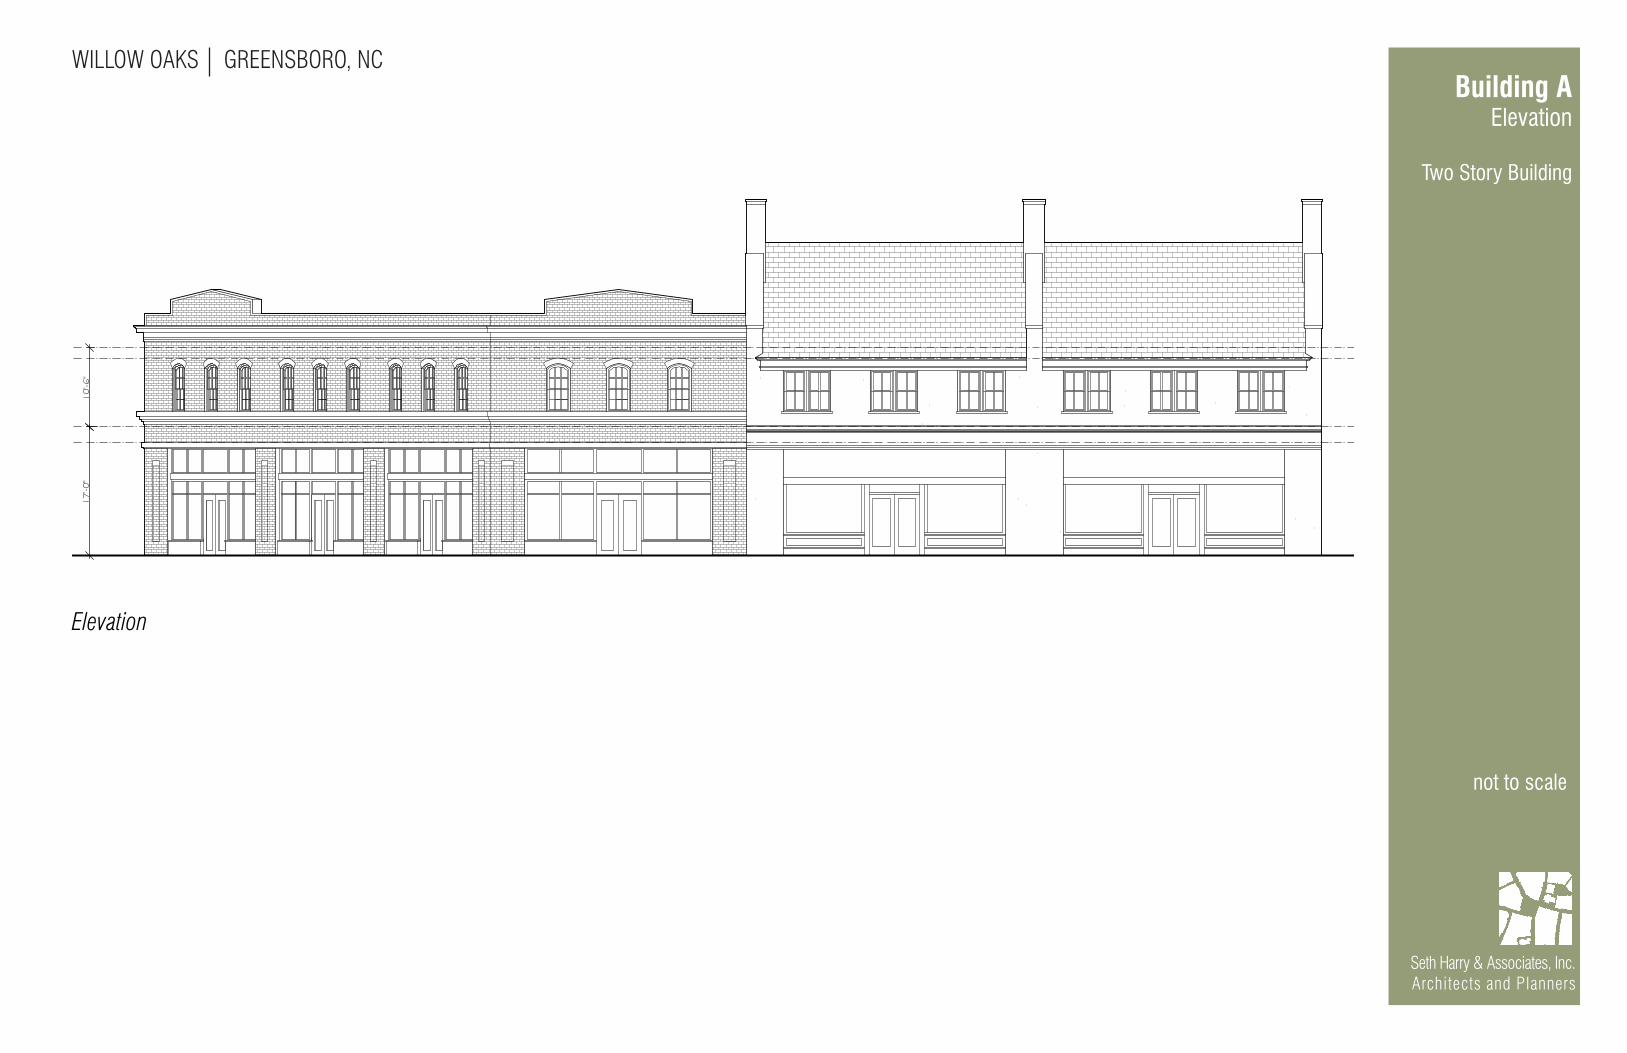
Building AElevation
Two Story Building
Elevation
not to scale
WILLOW OAKS GREENSBORO, NC
Seth Harry & Associates, Inc.Architects and Planners
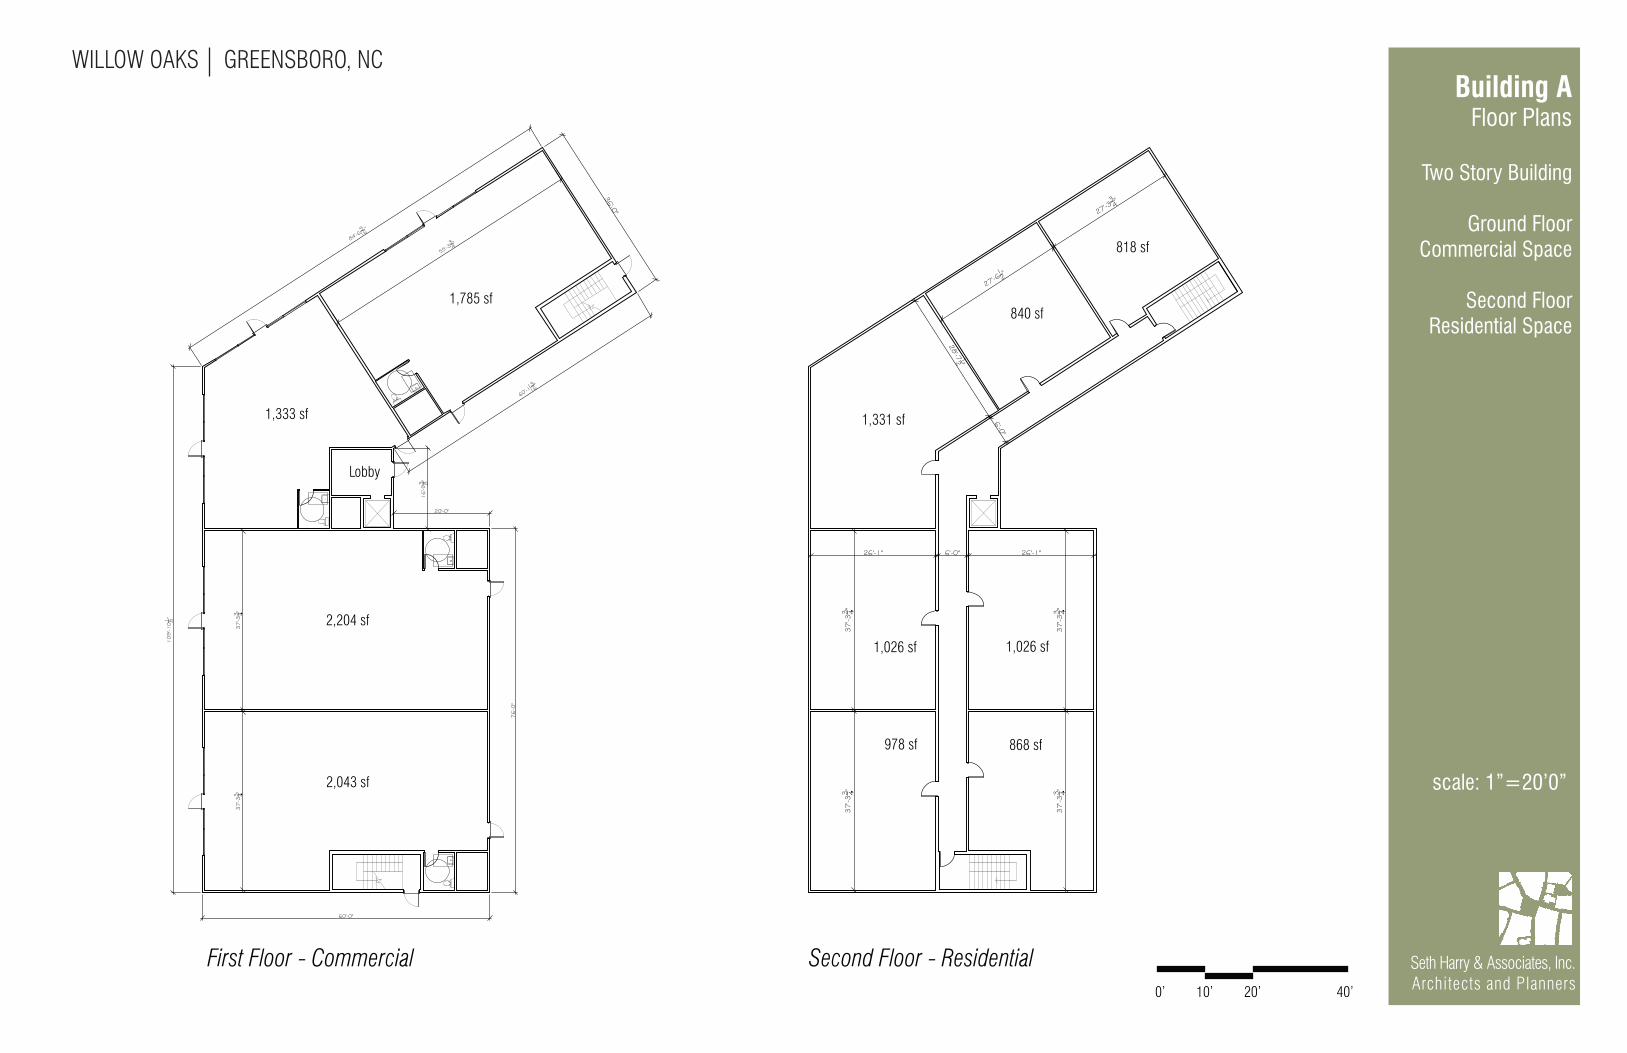
Building AFloor Plans
Two Story Building
Ground Floor Commercial Space
Second FloorResidential Space
scale: 1”=20’0”
First Floor - Commercial Second Floor - Residential
1,785 sf
1,333 sf
2,204 sf
2,043 sf
818 sf
840 sf
1,331 sf
1,026 sf
978 sf 868 sf
1,026 sf
Lobby
0’ 10’ 20’ 40’
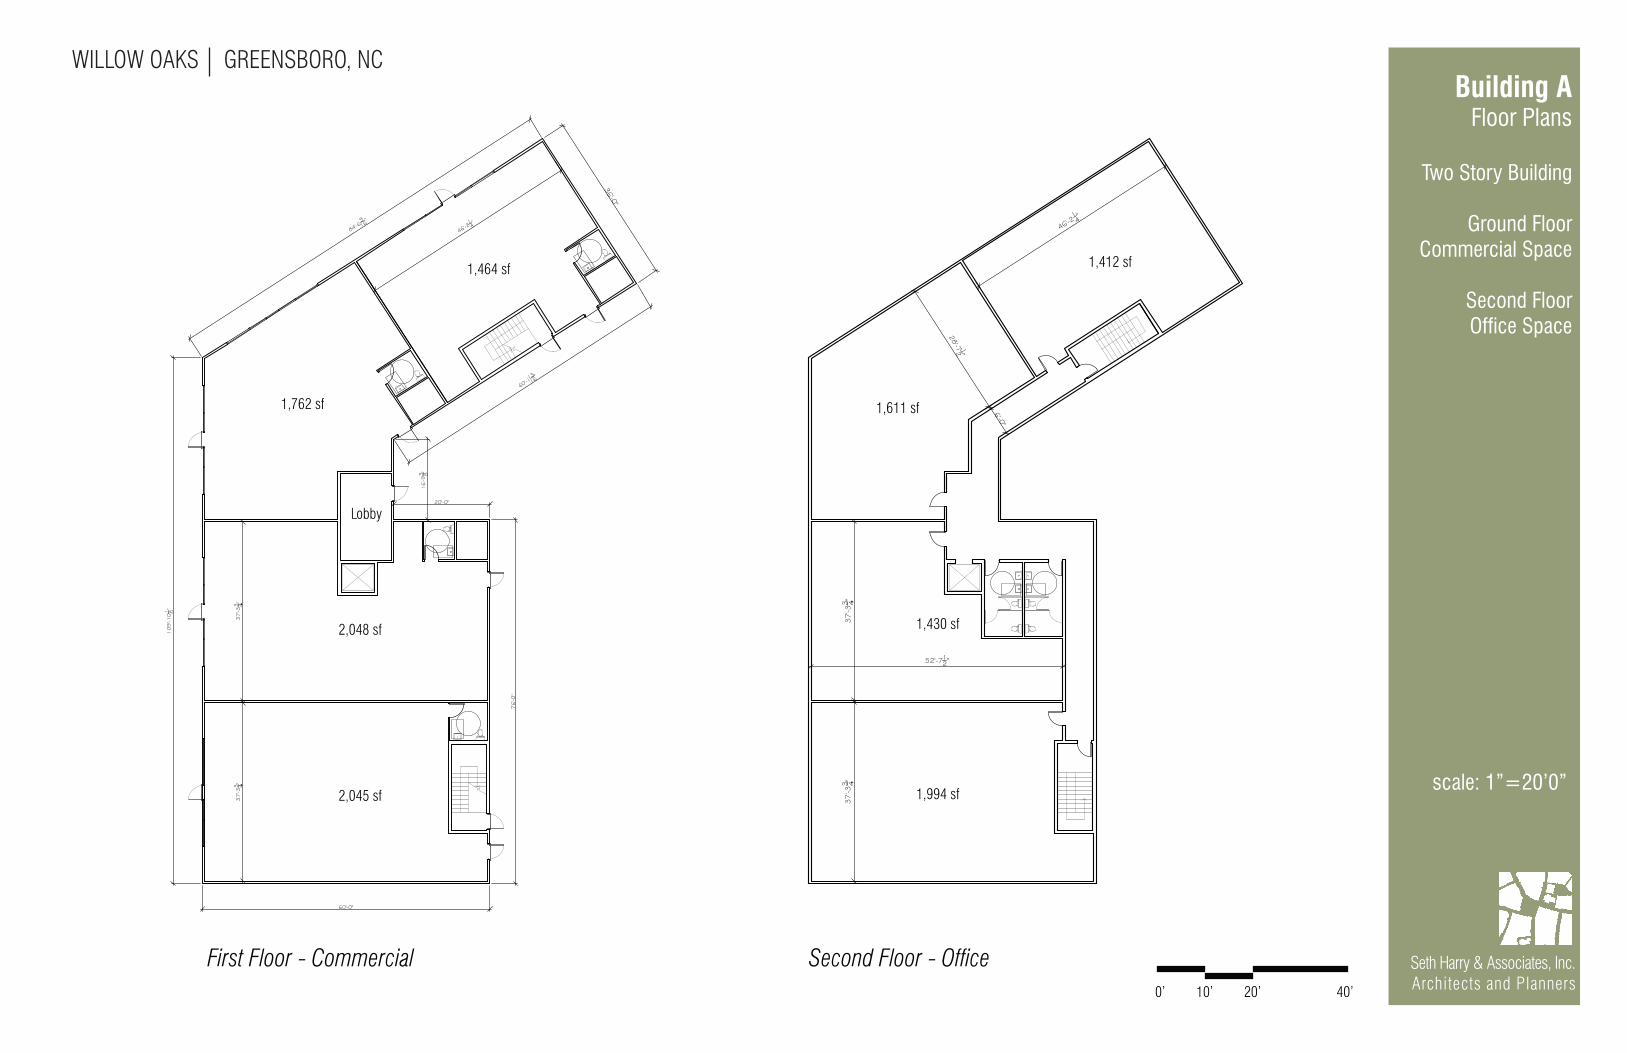
WILLOW OAKS GREENSBORO, NC
Seth Harry & Associates, Inc.Architects and Planners
Building AFloor Plans
Two Story Building
Ground Floor Commercial Space
Second FloorOffice Space
First Floor - Commercial Second Floor - Office
1,464 sf
1,762 sf
2,048 sf
2,045 sf
1,412 sf
1,611 sf
1,430 sf
1,994 sf
Lobby
scale: 1”=20’0”
0’ 10’ 20’ 40’

WILLOW OAKS GREENSBORO, NC
Seth Harry & Associates, Inc.Architects and Planners
Building AFloor Plans
One Story Building
Ground FloorCommercial Space
First Floor - Commercial
1,940 sf
1,554 sf
2,204 sf
2,204 sfscale: 1”=20’0”
0’ 10’ 20’ 40’
WILLOW OAKS GREENSBORO, NC
Seth Harry & Associates, Inc.Architects and Planners
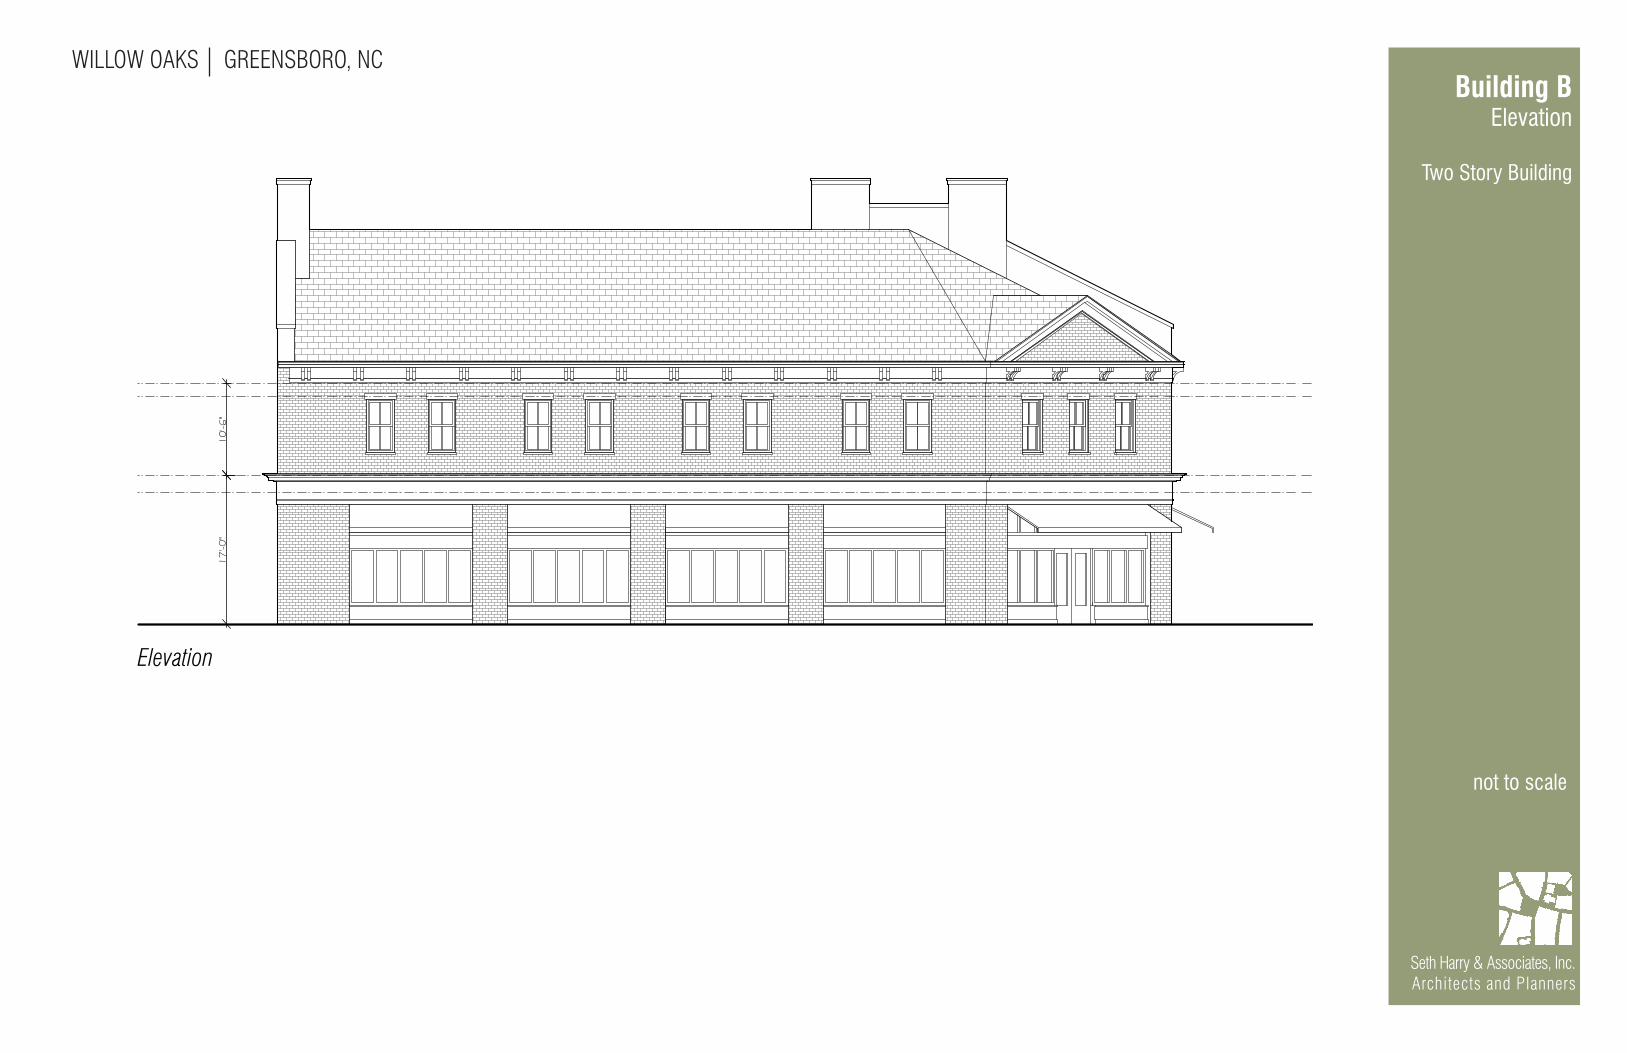
Building BElevation
Two Story Building
Elevation
not to scale

WILLOW OAKS GREENSBORO, NC
Seth Harry & Associates, Inc.Architects and Planners
Building BFloor Plans
Two Story Building
Ground Floor Commercial Space
Second FloorResidential Space
First Floor - Commercial Second Floor - Residential
2,062 sf
4,729 sf
1,083 sf
848 sf
864 sf 1,142 sf
956 sf
981 sf
Lobby
scale: 1/16”=1’0”
0’ 8’ 16’ 32’

WILLOW OAKS GREENSBORO, NC
Seth Harry & Associates, Inc.Architects and Planners
Building BFloor Plans
Two Story Building
Ground Floor Commercial Space
Second FloorOffice Space
First Floor - Commercial Second Floor - Office
2,056 sf
4,793 sf
1,994 sf
2,485 sf 1,683 sf
Lobby
scale: 1/16”=1’0”
0’ 8’ 16’ 32’
WILLOW OAKS GREENSBORO, NC
Seth Harry & Associates, Inc.Architects and Planners
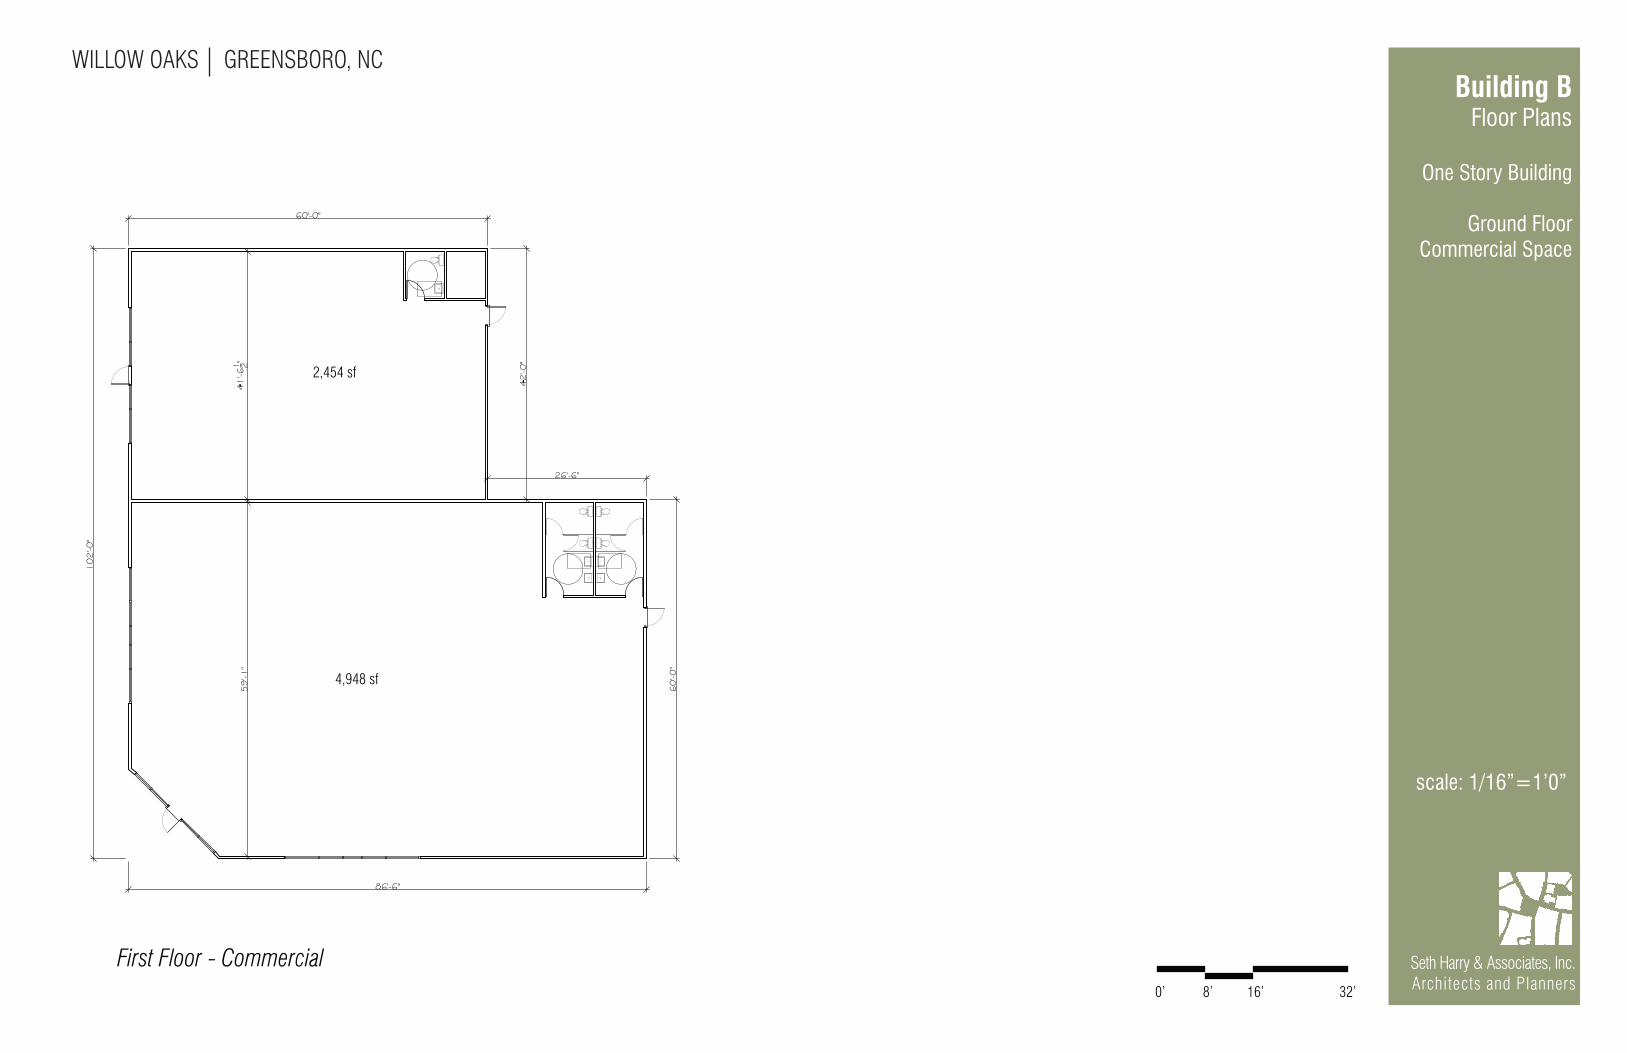
Building BFloor Plans
One Story Building
Ground Floor Commercial Space
First Floor - Commercial
2,454 sf
4,948 sf
scale: 1/16”=1’0”
0’ 8’ 16’ 32’

WILLOW OAKS GREENSBORO, NC
Seth Harry & Associates, Inc.Architects and Planners
Building CElevation &Floor Plan
One Story Building
Ground FloorCommercial Space
Elevation
elevation:not to scale
First Floor - Commercial
1,968 sf
1,281 sf1,502 sf plan scale: 1/16”=1’0”
0’ 8’ 16’ 32’
WILLOW OAKS GREENSBORO, NC
Seth Harry & Associates, Inc.Architects and Planners
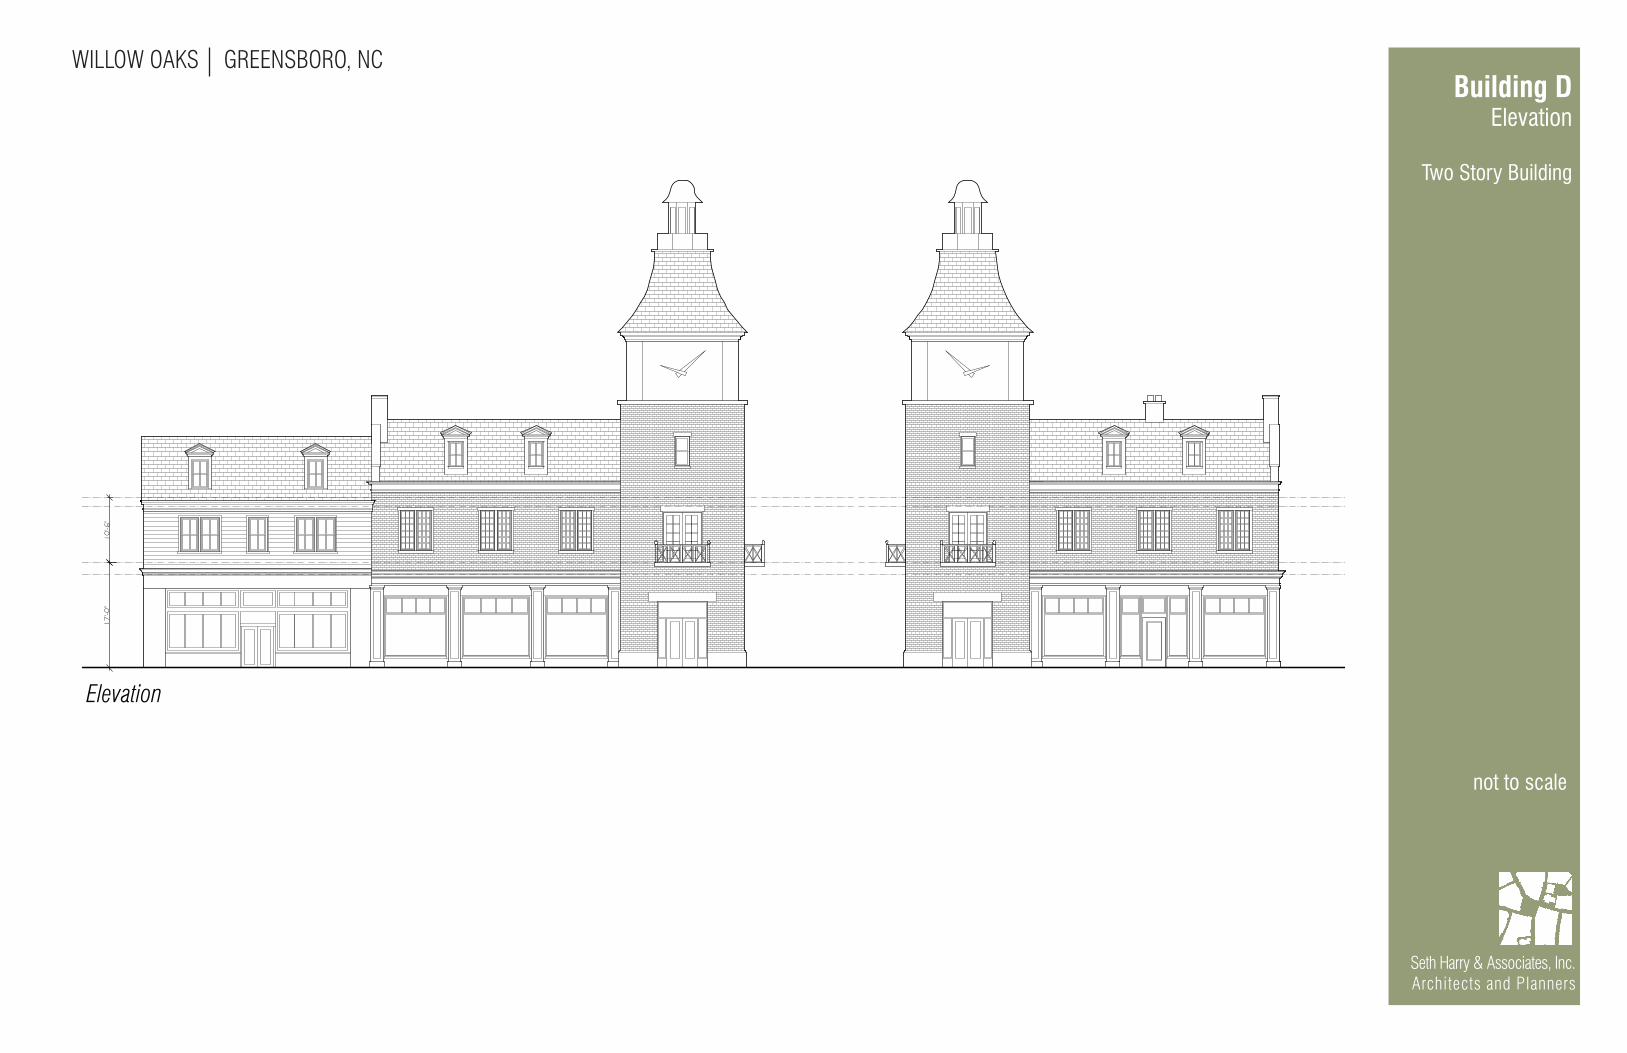
Building DElevation
Two Story Building
Elevation
not to scale

WILLOW OAKS GREENSBORO, NC
Seth Harry & Associates, Inc.Architects and Planners
Building DFloor Plans
Two Story Buildingw/ Mezzanine
Ground Floor Commercial Space
Second FloorResidential Space
or Office Space
First Floor - Commercial Second Floor - Residential Second Floor - Office
1,006 sf 1,792 sf
2 Hour Fire Wall
1,405 sf
1,006 sf
819 sf
833 sf
Mezzanine or Open to Below
2 Hour Fire Wall
Mezzanine or Open to Below
2 Hour Fire Wall
1,006 sf 1,434 sf
scale: 1/16”=1’0”
0’ 8’ 16’ 32’

WILLOW OAKS GREENSBORO, NC
Seth Harry & Associates, Inc.Architects and Planners
Building DFloor Plans
Two Story Buildingw/o Mezzanine
Ground Floor Commercial Space
Second FloorResidential Space
or Office Space
1,762 sf
1,160 sf
948 sf
870 sf 825 sf
961 sf
842 sf
1,762 sf
827 sf
948 sf
Lobby
scale: 1/16”=1’0”
First Floor - Commercial*second stair not required if second floor is residential use
Second Floor - Residential* only one stair required for residential second floor
Second Floor - Office
0’ 8’ 16’ 32’
WILLOW OAKS GREENSBORO, NC
Seth Harry & Associates, Inc.Architects and Planners
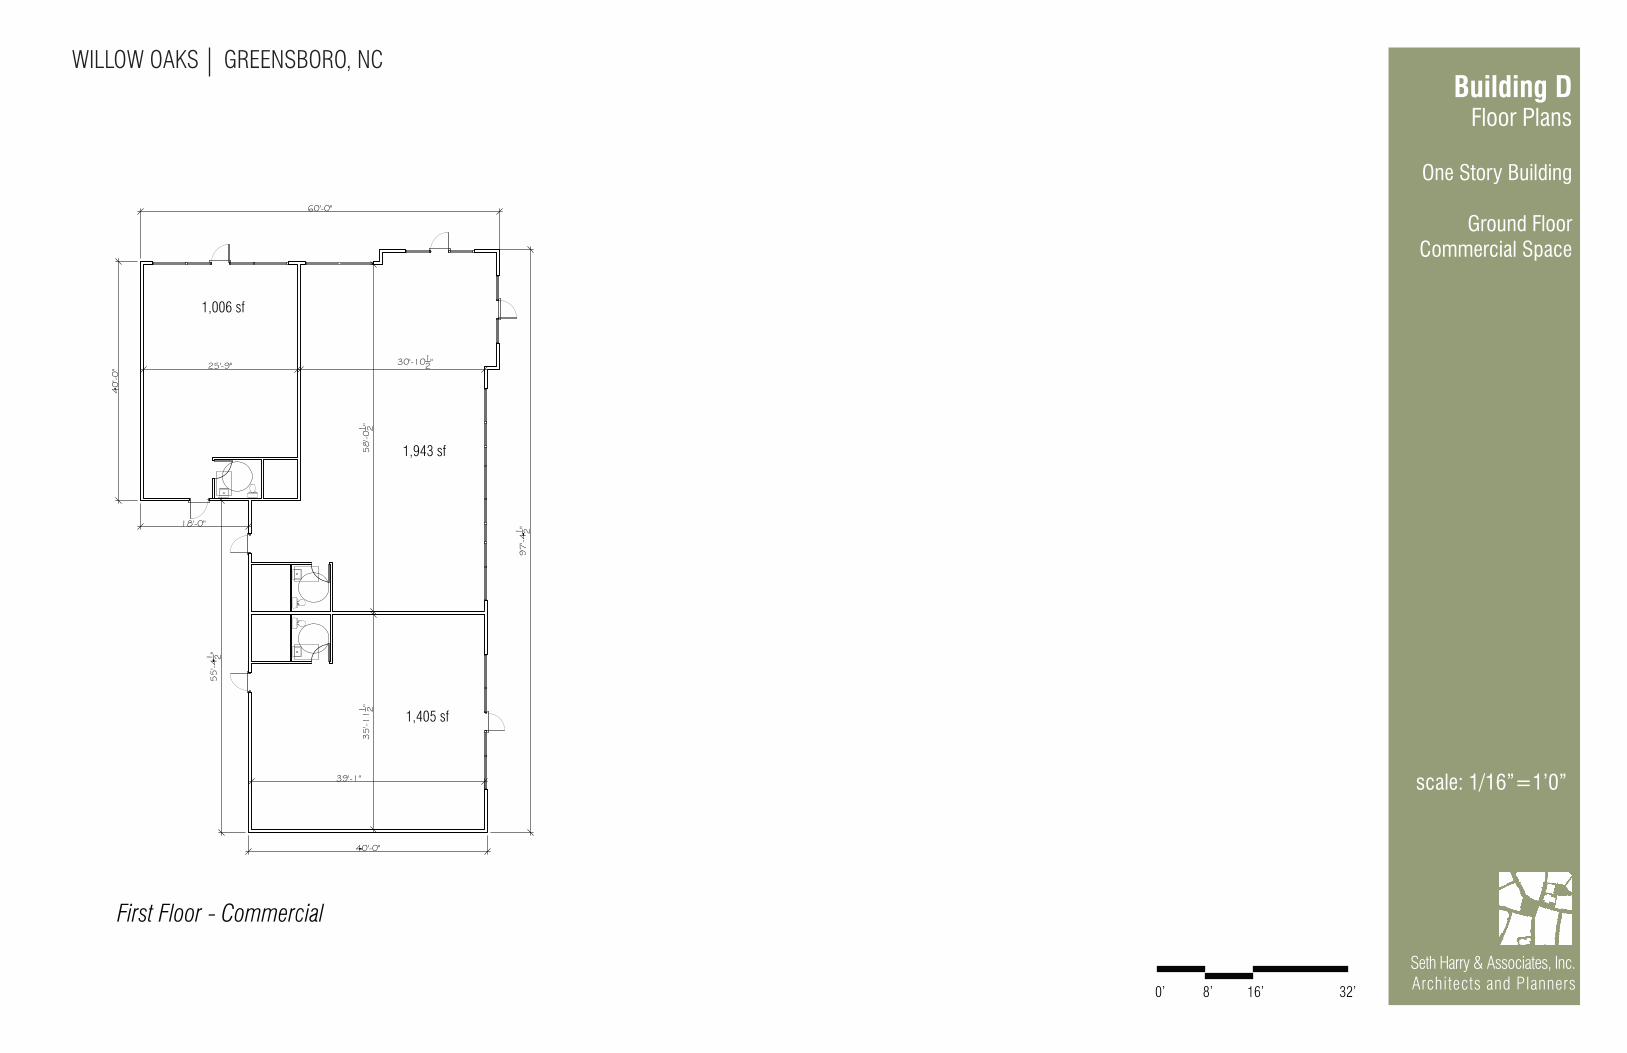
Building DFloor Plans
One Story Building
Ground FloorCommercial Space
1,006 sf
1,943 sf
1,405 sf
scale: 1/16”=1’0”
First Floor - Commercial
0’ 8’ 16’ 32’

WILLOW OAKS GREENSBORO, NC
Seth Harry & Associates, Inc.Architects and Planners
Building EElevation &Floor Plan
One Story Building
Ground FloorCommercial Space
Elevation
elevation:not to scale
plan scale: 1/16”=1’0”
First Floor - Commercial
2,414 sf 1,193 sf 1,193 sf
0’ 8’ 16’ 32’

WILLOW OAKS GREENSBORO, NC
Seth Harry & Associates, Inc.Architects and Planners
Building FElevation
Two Story Building
Elevation
not to scale

WILLOW OAKS GREENSBORO, NC
Seth Harry & Associates, Inc.Architects and Planners
Building FFloor Plans
Two Story Building
Ground Floor Commercial Space
Second FloorResidential Space
First Floor - Commercial Second Floor - Residential
5,151 sf
1,051 sf
1,400 sf
1,435 sf
1,131 sf
Enclosed CourtLobby
scale: 1/16”=1’0”
0’ 8’ 16’ 32’

WILLOW OAKS GREENSBORO, NC
Seth Harry & Associates, Inc.Architects and Planners
Building GElevation &Floor Plan
One Story Building
Ground Floor Commercial Space
First Floor - Commercial
1,271 sf 1,271 sf 1,271 sf 1,271 sf
0’ 8’ 16’ 32’
Elevation
elevation:not to scale
plan scale: 1/16”=1’0”
WILLOW OAKS GREENSBORO, NC
Seth Harry & Associates, Inc.Architects and Planners
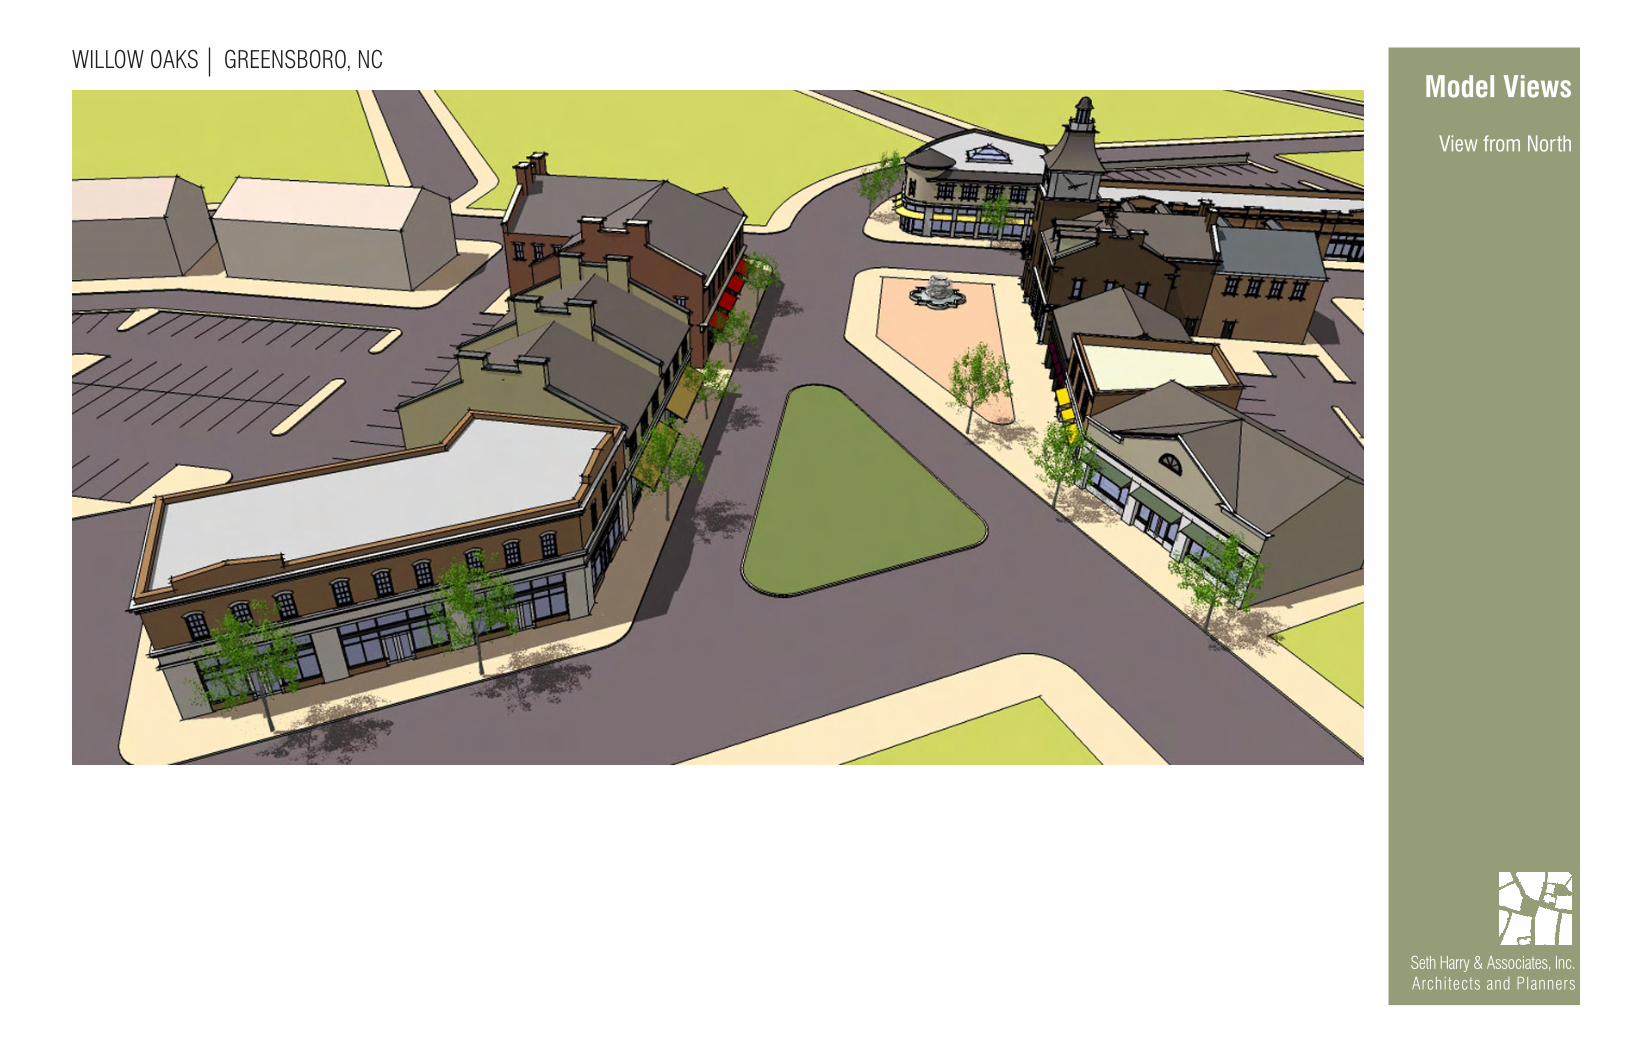
Model Views
View from North
WILLOW OAKS GREENSBORO, NC
Seth Harry & Associates, Inc.Architects and Planners
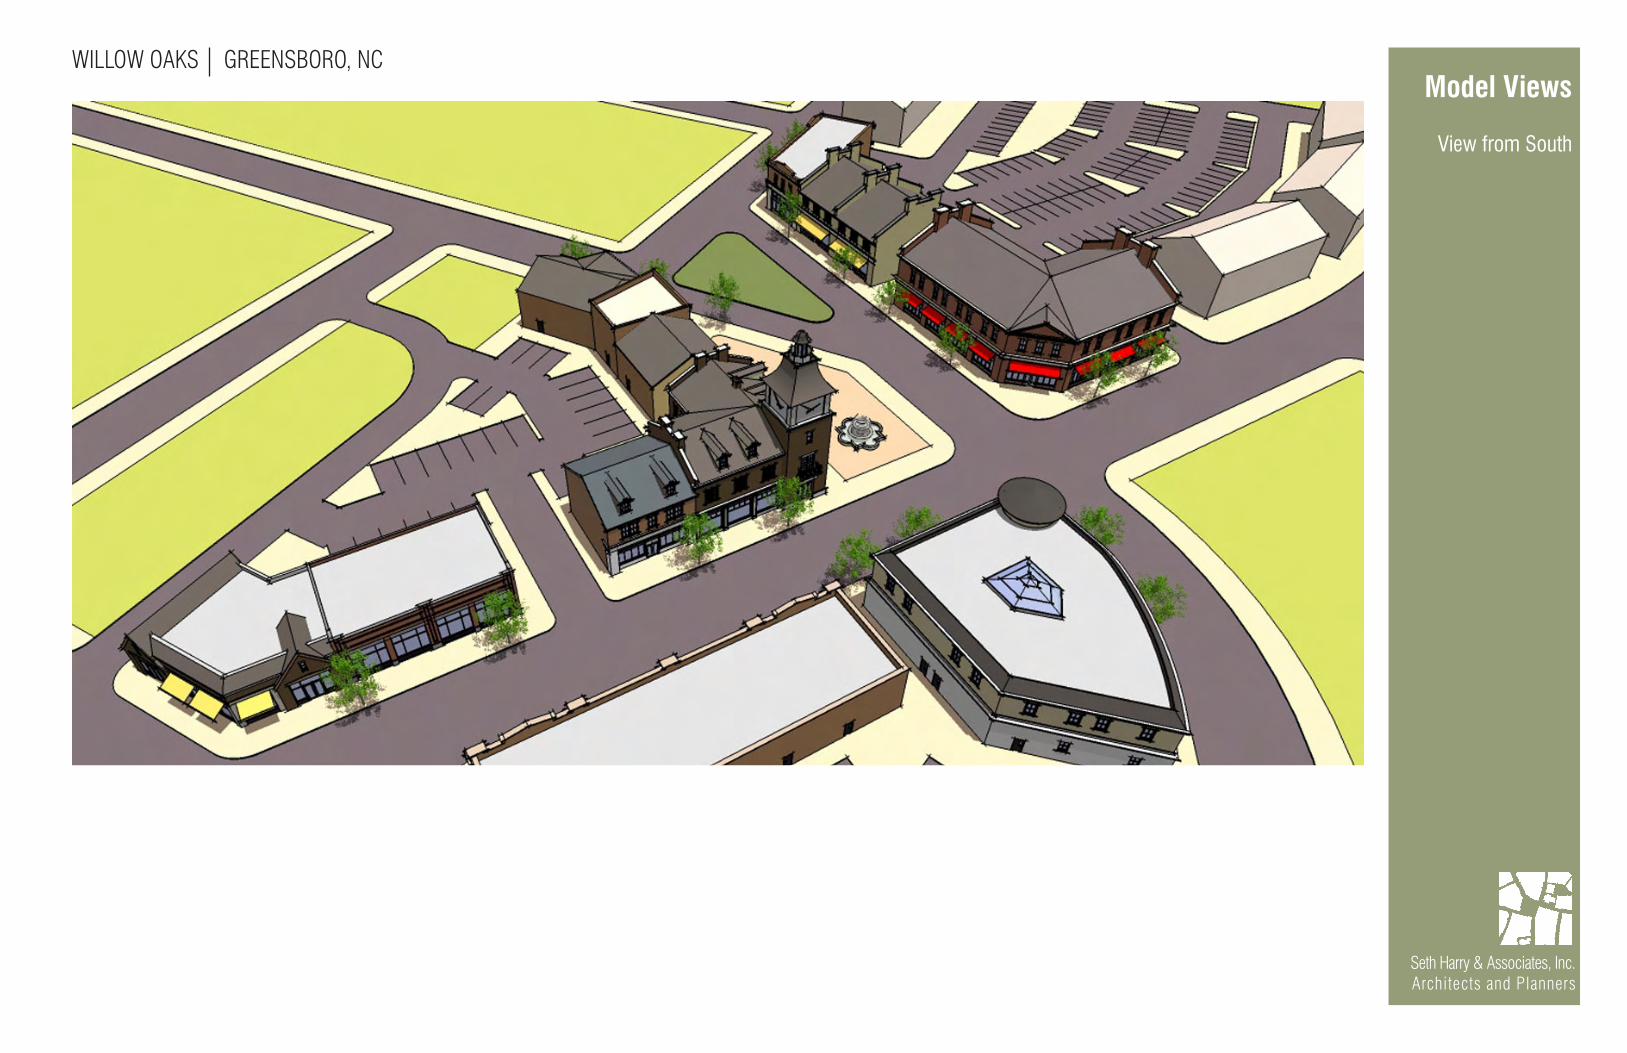
Model Views
View from South


Major Shopping Center Locator
Willow Oaks Village Center Latitude: 36.06504Mcconnell Rd, Greensboro, NC, 27401 Longitude: -79.76421Drive Time: 10 minutes
©2011 Esri On-demand reports and maps from Business Analyst Online. Order at www.esri.com/bao or call 800-447-9778 1/20/2012 Page 1 of 2
Source: Directory of Major Malls, Inc. Total Major Shopping Centers 10
Total GLA 5,595,038
Total Stores 503
Distancefrom site Year GLA in
Major Shopping Center Name and AddressType and Number of Stores
in miles Open square feet
Britt Way Commons 1.70 W 2008 800,000NEC South Elm/Eugene St. & Pleasant Garden RdGreensboro, NC 27406N/A, 10 StoresAnchors: None
Shops of Pyramids Village 3.12 N 1976 653,049Hwy. 29 North & Cone Blvd.Greensboro, NC 27405N/A, 24 StoresAnchors: Walmart Supercenter
Westover Gallery Of Shops 3.34 W 1995 100,000Westover Terrace & Mill St.Greensboro, NC 27429N/A, 28 StoresAnchors: None
The Friendly Center 3.97 W 1957 1,244,078W. Friendly Ave. & Green Valley RoadGreensboro, NC 27408N/A, 90 StoresAnchors: Sears, Macy's, Belk
Wendover Towne Center 4.03 E 2012 300,000Willowlake Rd., I-840 & U.S. Hwy. 70Greensboro, NC 27405N/A, 10 StoresAnchors: None
The Shops At Friendly Center 4.36 W 2006 306,954W. Friendly Ave, Hobbs Rd. & Northline Ave.Greensboro, NC 27410N/A, 60 StoresAnchors: Harris Teeter
Four Seasons Town Centre 4.47 W 1974 1,141,000High Point Rd. & I-40Greensboro, NC 27427Enclosed, 180 StoresAnchors: JCPenney, Belk, Dillard's
Westridge Square 5.89 NW 1981 215,721Battleground Ave. & Westridge Rd.Greensboro, NC 27410N/A, 25 StoresAnchors: Harris Teeter, Kohl's
Data Note: n/a means data was not reported. GLA = Gross Leasable Area.
Source: Directory of Major Malls, Inc.

Major Shopping Center Locator
Willow Oaks Village Center Latitude: 36.06504Mcconnell Rd, Greensboro, NC, 27401 Longitude: -79.76421Drive Time: 10 minutes
©2011 Esri On-demand reports and maps from Business Analyst Online. Order at www.esri.com/bao or call 800-447-9778 1/20/2012 Page 2 of 2
Distancefrom site Year GLA in
Major Shopping Center Name and AddressType and Number of Stores
in miles Open square feet
Wendover Village I & II 6.81 W 2004 304,962Wendover Ave. & Meadowood St.Greensboro, NC 27407N/A, 33 StoresAnchors: Costco, Vacant, Klaussner Furniture, A.C. Moore
Wendover Place 7.89 W 1997 529,274NWC W. Wendover Ave. & Bridford Pkwy.Greensboro, NC 27407-2763N/A, 43 StoresAnchors: Target, Kohl's, Dick's Sporting Goods, Babies R Us
Data Note: n/a means data was not reported. GLA = Gross Leasable Area.
Source: Directory of Major Malls, Inc.

Market ProfileWillow Oaks Village CenterMcconnell Rd, Greensboro, NC, 27401 Latitude: 36.06504Drive Time: 3, 5, 10 minutes Longitude: -79.76421
0 - 3 minutes 0 - 5 minutes 0 - 10 minutesPopulation Summary
2000 Total Population 14,688 37,454 150,8402000 Group Quarters 3,560 4,574 9,567
2010 Total Population 15,671 39,672 165,163
2015 Total Population 16,223 41,170 173,7572010-2015 Annual Rate 0.70% 0.74% 1.02%
Household Summary2000 Households 4,649 13,918 59,929
2000 Average Household Size 2.39 2.36 2.362010 Households 5,002 14,847 65,890
2010 Average Household Size 2.37 2.34 2.352015 Households 5,246 15,541 69,602
2015 Average Household Size 2.37 2.33 2.352010-2015 Annual Rate 0.96% 0.92% 1.10%
2000 Families 2,856 7,928 35,8012000 Average Family Size 2.99 3.06 2.97
2010 Families 2,954 8,064 38,0262010 Average Family Size 3.01 3.09 3.01
2015 Families 3,059 8,315 39,7502015 Average Family Size 3.01 3.10 3.012010-2015 Annual Rate 0.70% 0.62% 0.89%
Housing Unit Summary2000 Housing Units 5,299 15,493 64,943
Owner Occupied Housing Units 37.1% 35.9% 49.5%Renter Occupied Housing Units 50.9% 54.0% 42.9%Vacant Housing Units 12.1% 10.1% 7.5%
2010 Housing Units 5,880 17,118 73,280Owner Occupied Housing Units 34.7% 33.3% 47.4%Renter Occupied Housing Units 50.3% 53.4% 42.5%Vacant Housing Units 14.9% 13.3% 10.1%
2015 Housing Units 6,263 18,193 78,252Owner Occupied Housing Units 34.1% 32.6% 46.7%Renter Occupied Housing Units 49.7% 52.9% 42.2%Vacant Housing Units 16.2% 14.6% 11.1%
Median Household Income2000 $24,208 $25,210 $34,6272010 $32,237 $32,676 $45,8242015 $37,150 $37,976 $53,954
Median Home Value2000 $70,717 $72,331 $89,7232010 $86,817 $88,273 $108,7582015 $94,854 $96,787 $121,240
Per Capita Income2000 $10,658 $12,727 $19,5092010 $16,254 $17,404 $24,2712015 $18,567 $19,840 $27,364
Median Age2000 24.9 30.3 32.32010 24.8 31.1 34.12015 24.9 31.1 34.5
Data Note: Household population includes persons not residing in group quarters. Average Household Size is the household population divided by total households.Persons in families include the householder and persons related to the householder by birth, marriage, or adoption. Per Capita Income represents the income received byall persons aged 15 years and over divided by the total population. Detail may not sum to totals due to rounding.
January 20, 2012
Made with Esri Business Analyst©2012 Esri www.esri.com/ba 800-447-9778 Try it Now! Page 1 of 8
Source: U.S. Bureau of the Census, 2000 Census of Population and Housing. Esri forecasts for 2010 and 2015.

Market ProfileWillow Oaks Village CenterMcconnell Rd, Greensboro, NC, 27401 Latitude: 36.06504Drive Time: 3, 5, 10 minutes Longitude: -79.76421
0 - 3 minutes 0 - 5 minutes 0 - 10 minutes2000 Households by Income
Household Income Base 4,699 13,999 59,949<$15,000 30.4% 27.8% 18.9%$15,000 - $24,999 20.9% 21.8% 16.3%$25,000 - $34,999 16.8% 15.7% 15.3%$35,000 - $49,999 14.1% 15.3% 17.6%$50,000 - $74,999 10.8% 12.3% 17.1%$75,000 - $99,999 4.8% 4.6% 7.0%$100,000 - $149,999 1.5% 1.8% 4.4%$150,000 - $199,999 0.5% 0.4% 1.4%$200,000+ 0.2% 0.4% 2.1%
Average Household Income $30,667 $32,676 $48,201
2010 Households by IncomeHousehold Income Base 5,002 14,846 65,889
<$15,000 23.8% 22.2% 14.0%$15,000 - $24,999 15.5% 15.0% 10.7%$25,000 - $34,999 13.6% 15.3% 12.7%$35,000 - $49,999 16.9% 15.1% 16.2%$50,000 - $74,999 15.6% 17.1% 20.2%$75,000 - $99,999 10.3% 10.8% 15.5%$100,000 - $149,999 3.0% 3.1% 6.3%$150,000 - $199,999 0.8% 0.8% 1.9%$200,000+ 0.5% 0.6% 2.4%
Average Household Income $40,700 $42,027 $58,8732015 Households by Income
Household Income Base 5,244 15,542 69,601<$15,000 22.2% 20.7% 12.5%$15,000 - $24,999 13.8% 13.2% 8.9%$25,000 - $34,999 11.7% 13.2% 10.4%$35,000 - $49,999 13.5% 12.1% 12.5%$50,000 - $74,999 19.0% 20.4% 22.9%$75,000 - $99,999 13.0% 13.4% 18.0%$100,000 - $149,999 4.9% 5.1% 9.4%$150,000 - $199,999 1.2% 1.1% 2.5%$200,000+ 0.7% 0.8% 2.9%
Average Household Income $46,363 $47,699 $66,1962000 Owner Occupied Housing Units by Value
Total 1,934 5,593 32,105<$50,000 15.4% 15.2% 9.2%$50,000 - $99,999 74.6% 69.5% 52.1%$100,000 - $149,999 7.9% 9.3% 20.3%$150,000 - $199,999 1.6% 3.1% 7.4%$200,000 - $299,999 0.7% 2.3% 5.5%$300,000 - $499,999 0.0% 0.5% 3.7%$500,000 - $999,999 0.0% 0.0% 1.5%$1,000,000 + 0.0% 0.0% 0.4%
Average Home Value $74,784 $81,518 $123,3632000 Specified Renter Occupied Housing Units by Contract RentTotal 2,737 8,380 27,746
With Cash Rent 96.2% 97.1% 97.0%No Cash Rent 3.8% 2.9% 3.0%
Median Rent $342 $378 $460Average Rent $342 $374 $457
Data Note: Income represents the preceding year, expressed in current dollars. Household income includes wage and salary earnings, interest dividends, net rents,pensions, SSI and welfare payments, child support, and alimony. Specified Renter Occupied Housing Units exclude houses on 10+ acres. Average Rent excludes unitspaying no cash.
January 20, 2012
Made with Esri Business Analyst©2012 Esri www.esri.com/ba 800-447-9778 Try it Now! Page 2 of 8
Source: U.S. Bureau of the Census, 2000 Census of Population and Housing. Esri forecasts for 2010 and 2015.
Market ProfileWillow Oaks Village CenterMcconnell Rd, Greensboro, NC, 27401 Latitude: 36.06504Drive Time: 3, 5, 10 minutes Longitude: -79.76421
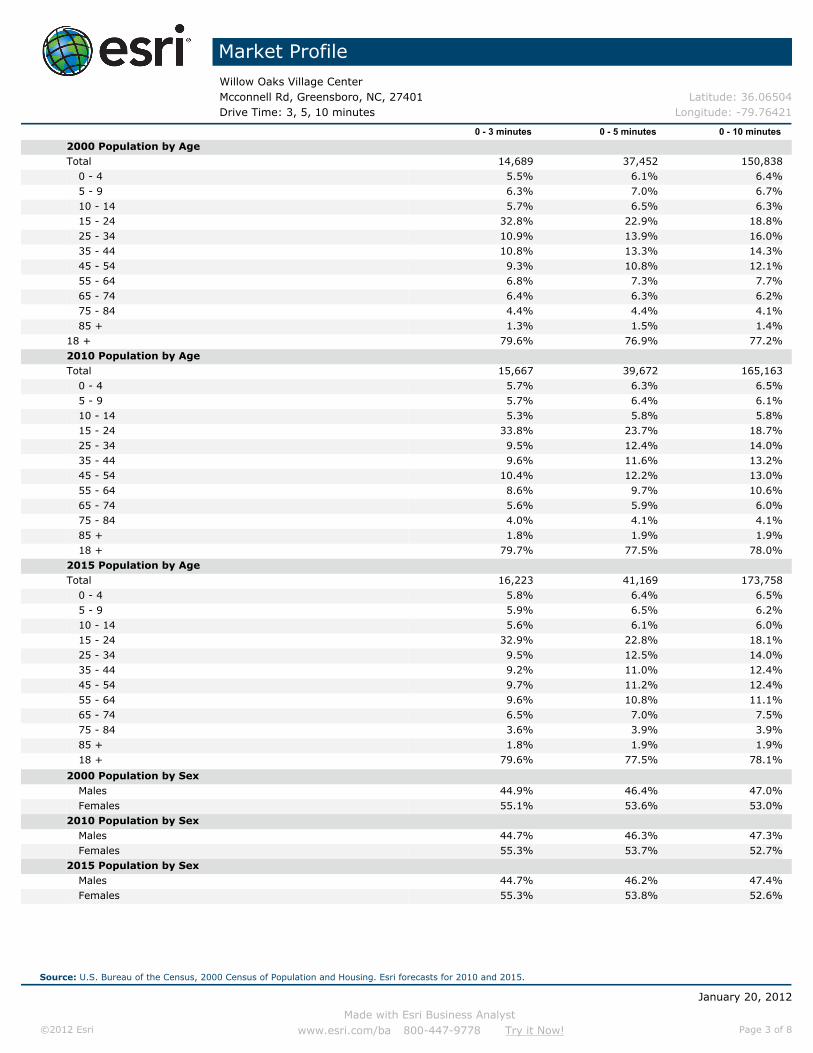
0 - 3 minutes 0 - 5 minutes 0 - 10 minutes2000 Population by AgeTotal 14,689 37,452 150,838
0 - 4 5.5% 6.1% 6.4%5 - 9 6.3% 7.0% 6.7%10 - 14 5.7% 6.5% 6.3%15 - 24 32.8% 22.9% 18.8%25 - 34 10.9% 13.9% 16.0%35 - 44 10.8% 13.3% 14.3%45 - 54 9.3% 10.8% 12.1%55 - 64 6.8% 7.3% 7.7%65 - 74 6.4% 6.3% 6.2%75 - 84 4.4% 4.4% 4.1%85 + 1.3% 1.5% 1.4%
18 + 79.6% 76.9% 77.2%2010 Population by AgeTotal 15,667 39,672 165,163
0 - 4 5.7% 6.3% 6.5%5 - 9 5.7% 6.4% 6.1%10 - 14 5.3% 5.8% 5.8%15 - 24 33.8% 23.7% 18.7%25 - 34 9.5% 12.4% 14.0%35 - 44 9.6% 11.6% 13.2%45 - 54 10.4% 12.2% 13.0%55 - 64 8.6% 9.7% 10.6%65 - 74 5.6% 5.9% 6.0%75 - 84 4.0% 4.1% 4.1%85 + 1.8% 1.9% 1.9%18 + 79.7% 77.5% 78.0%
2015 Population by AgeTotal 16,223 41,169 173,758
0 - 4 5.8% 6.4% 6.5%5 - 9 5.9% 6.5% 6.2%10 - 14 5.6% 6.1% 6.0%15 - 24 32.9% 22.8% 18.1%25 - 34 9.5% 12.5% 14.0%35 - 44 9.2% 11.0% 12.4%45 - 54 9.7% 11.2% 12.4%55 - 64 9.6% 10.8% 11.1%65 - 74 6.5% 7.0% 7.5%75 - 84 3.6% 3.9% 3.9%85 + 1.8% 1.9% 1.9%18 + 79.6% 77.5% 78.1%
2000 Population by SexMales 44.9% 46.4% 47.0%Females 55.1% 53.6% 53.0%
2010 Population by SexMales 44.7% 46.3% 47.3%Females 55.3% 53.7% 52.7%
2015 Population by SexMales 44.7% 46.2% 47.4%Females 55.3% 53.8% 52.6%
January 20, 2012
Made with Esri Business Analyst©2012 Esri www.esri.com/ba 800-447-9778 Try it Now! Page 3 of 8
Source: U.S. Bureau of the Census, 2000 Census of Population and Housing. Esri forecasts for 2010 and 2015.

Market ProfileWillow Oaks Village CenterMcconnell Rd, Greensboro, NC, 27401 Latitude: 36.06504Drive Time: 3, 5, 10 minutes Longitude: -79.76421
0 - 3 minutes 0 - 5 minutes 0 - 10 minutes2000 Population by Race/EthnicityTotal 14,686 37,454 150,841
White Alone 4.3% 17.3% 45.1%Black Alone 92.2% 77.2% 47.7%American Indian Alone 0.3% 0.4% 0.6%Asian or Pacific Islander Alone 0.3% 1.3% 2.6%Some Other Race Alone 1.8% 2.3% 2.4%Two or More Races 1.1% 1.5% 1.7%
Hispanic Origin 3.2% 4.3% 4.6%Diversity Index 20.1 42.4 60.72010 Population by Race/EthnicityTotal 15,670 39,672 165,163
White Alone 3.7% 14.7% 39.1%Black Alone 91.3% 77.5% 50.2%American Indian Alone 0.3% 0.4% 0.6%Asian or Pacific Islander Alone 0.4% 1.7% 3.4%Some Other Race Alone 2.9% 3.8% 4.3%Two or More Races 1.3% 1.9% 2.4%
Hispanic Origin 5.2% 7.2% 8.4%Diversity Index 24.7 46.0 65.62015 Population by Race/EthnicityTotal 16,223 41,170 173,756
White Alone 3.6% 14.0% 37.0%Black Alone 91.1% 77.7% 51.3%American Indian Alone 0.3% 0.4% 0.6%Asian or Pacific Islander Alone 0.5% 1.8% 3.7%Some Other Race Alone 3.1% 4.0% 4.7%Two or More Races 1.4% 2.1% 2.6%
Hispanic Origin 5.6% 8.0% 9.6%Diversity Index 25.7 46.8 66.82000 Population 3+ by School EnrollmentTotal 14,305 36,369 145,163
Enrolled in Nursery/Preschool 1.8% 1.8% 1.8%Enrolled in Kindergarten 1.5% 1.6% 1.4%Enrolled in Grade 1-8 9.9% 11.5% 10.9%Enrolled in Grade 9-12 4.7% 5.5% 5.4%Enrolled in College 26.3% 15.0% 10.6%Enrolled in Grad/Prof School 1.0% 1.1% 1.3%Not Enrolled in School 54.8% 63.5% 68.5%
2010 Population 25+ by Educational AttainmentTotal 7,755 22,919 103,798
Less Than 9th Grade 9.0% 9.3% 6.3%9th to 12th Grade, No Diploma 16.6% 16.2% 11.4%High School Graduate 32.1% 30.1% 28.4%Some College, No Degree 20.5% 20.7% 21.4%Associate Degree 4.5% 5.0% 5.8%Bachelor's Degree 11.2% 12.2% 17.5%Graduate/Professional Degree 6.1% 6.6% 9.3%
Data Note: Persons of Hispanic Origin may be of any race. The Diversity Index measures the probability that two people from the same area will be from differentrace/ethnic groups.
January 20, 2012
Made with Esri Business Analyst©2012 Esri www.esri.com/ba 800-447-9778 Try it Now! Page 4 of 8
Source: U.S. Bureau of the Census, 2000 Census of Population and Housing. Esri forecasts for 2010 and 2015.

Market ProfileWillow Oaks Village CenterMcconnell Rd, Greensboro, NC, 27401 Latitude: 36.06504Drive Time: 3, 5, 10 minutes Longitude: -79.76421
0 - 3 minutes 0 - 5 minutes 0 - 10 minutes2010 Population 15+ by Marital StatusTotal 13,057 32,325 134,741
Never Married 48.0% 45.4% 38.4%
Married 34.9% 34.2% 43.0%
Widowed 7.2% 7.8% 6.6%Divorced 9.8% 12.6% 12.0%
2000 Population 16+ by Employment StatusTotal 12,068 29,803 120,117
In Labor Force 59.2% 61.1% 67.5%Civilian Employed 44.2% 51.1% 61.6%Civilian Unemployed 15.0% 9.9% 5.8%In Armed Forces 0.0% 0.1% 0.1%
Not In Labor Force 40.8% 38.9% 32.5%2010 Civilian Population 16+ in Labor Force
Civilian Employed 77.0% 79.4% 85.5%Civilian Unemployed 23.0% 20.6% 14.5%
2015 Civilian Population 16+ in Labor Force Civilian Employed 80.9% 83.0% 88.2%Civilian Unemployed 19.1% 17.0% 11.8%
2000 Females 16+ by Employment Status and Age of ChildrenTotal 6,820 16,234 64,673
Own Children < 6 Only 5.3% 6.6% 7.6%Employed/in Armed Forces 3.3% 3.8% 4.6%Unemployed 0.6% 0.8% 0.6%Not in Labor Force 1.5% 1.9% 2.4%
Own Children <6 and 6-17 Only 3.8% 4.4% 5.1%Employed/in Armed Forces 2.9% 2.9% 3.4%Unemployed 0.1% 0.3% 0.3%Not in Labor Force 0.8% 1.2% 1.4%
Own Children 6-17 Only 10.7% 12.7% 13.9%Employed/in Armed Forces 6.2% 8.3% 10.1%Unemployed 1.2% 1.2% 0.7%Not in Labor Force 3.3% 3.2% 3.0%
No Own Children < 18 80.1% 76.4% 73.5%Employed/in Armed Forces 30.2% 32.4% 38.7%Unemployed 9.9% 6.7% 4.0%Not in Labor Force 40.0% 37.3% 30.8%
2010 Employed Population 16+ by IndustryTotal 5,222 14,235 71,204
Agriculture/Mining 0.2% 0.1% 0.1%Construction 6.1% 6.9% 7.2%Manufacturing 8.4% 9.8% 9.9%Wholesale Trade 2.9% 3.0% 3.7%Retail Trade 11.7% 10.4% 10.9%Transportation/Utilities 5.0% 5.2% 5.0%Information 1.4% 1.8% 2.4%Finance/Insurance/Real Estate 4.9% 5.4% 7.3%Services 57.0% 54.5% 50.3%Public Administration 2.4% 2.9% 3.2%
January 20, 2012
Made with Esri Business Analyst©2012 Esri www.esri.com/ba 800-447-9778 Try it Now! Page 5 of 8
Source: U.S. Bureau of the Census, 2000 Census of Population and Housing. Esri forecasts for 2010 and 2015.

Market ProfileWillow Oaks Village CenterMcconnell Rd, Greensboro, NC, 27401 Latitude: 36.06504Drive Time: 3, 5, 10 minutes Longitude: -79.76421
0 - 3 minutes 0 - 5 minutes 0 - 10 minutes2010 Employed Population 16+ by Occupation
Total 5,223 14,235 71,205White Collar 47.8% 48.8% 58.5%
Management/Business/Financial 6.5% 8.0% 11.3%Professional 14.7% 17.0% 20.4%Sales 9.7% 8.7% 11.0%Administrative Support 16.8% 15.1% 15.9%
Services 28.0% 25.1% 19.1%Blue Collar 24.2% 26.1% 22.4%
Farming/Forestry/Fishing 0.0% 0.0% 0.1%Construction/Extraction 5.5% 6.0% 6.0%Installation/Maintenance/Repair 2.6% 2.9% 2.9%Production 6.9% 7.5% 6.3%Transportation/Material Moving 9.1% 9.7% 7.1%
2000 Workers 16+ by Means of Transportation to WorkTotal 5,133 14,815 72,482
Drove Alone - Car, Truck, or Van 62.5% 66.7% 75.7%Carpooled - Car, Truck, or Van 19.7% 19.2% 15.5%Public Transportation 7.3% 5.2% 2.3%Walked 6.2% 5.2% 3.0%Other Means 1.5% 1.4% 1.3%Worked at Home 2.7% 2.3% 2.3%
2000 Workers 16+ by Travel Time to WorkTotal 5,136 14,816 72,481
Did not Work at Home 97.3% 97.7% 97.7%Less than 5 minutes 3.2% 3.0% 2.7%5 to 9 minutes 9.8% 10.8% 12.1%10 to 19 minutes 40.5% 39.9% 40.9%20 to 24 minutes 15.8% 16.5% 16.6%25 to 34 minutes 16.5% 17.0% 15.4%35 to 44 minutes 2.8% 2.8% 2.8%45 to 59 minutes 3.2% 2.8% 2.8%60 to 89 minutes 3.8% 2.9% 2.4%90 or more minutes 1.8% 1.9% 2.0%
Worked at Home 2.7% 2.3% 2.3%Average Travel Time to Work (in min) 21.9 21.3 20.92000 Households by Vehicles AvailableTotal 4,673 13,978 59,931
None 23.9% 20.7% 10.9%1 38.7% 42.9% 40.0%2 25.6% 25.7% 34.3%3 7.9% 7.5% 10.8%4 2.1% 1.9% 2.7%5+ 1.7% 1.4% 1.2%
Average Number of Vehicles Available 1.3 1.3 1.6
January 20, 2012
Made with Esri Business Analyst©2012 Esri www.esri.com/ba 800-447-9778 Try it Now! Page 6 of 8
Source: U.S. Bureau of the Census, 2000 Census of Population and Housing. Esri forecasts for 2010 and 2015.

Market ProfileWillow Oaks Village CenterMcconnell Rd, Greensboro, NC, 27401 Latitude: 36.06504Drive Time: 3, 5, 10 minutes Longitude: -79.76421
0 - 3 minutes 0 - 5 minutes 0 - 10 minutes2000 Households by TypeTotal 4,650 13,917 59,929
Family Households 61.4% 57.0% 59.7%Married-couple Family 25.2% 25.8% 37.3%
With Related Children 10.1% 11.3% 16.6%Other Family (No Spouse) 36.2% 31.1% 22.4%
With Related Children 23.6% 20.7% 14.7%Nonfamily Households 38.6% 43.0% 40.3%
Householder Living Alone 31.3% 34.9% 31.6%Householder Not Living Alone 7.3% 8.2% 8.7%
Households with Related Children 33.7% 31.9% 31.3%Households with Persons 65+ 27.9% 24.1% 21.2%
2000 Households by SizeTotal 4,649 13,918 59,929
1 Person Household 31.3% 34.9% 31.6%2 Person Household 31.7% 29.4% 32.8%3 Person Household 17.1% 16.3% 16.5%4 Person Household 10.5% 10.4% 11.3%5 Person Household 5.8% 5.6% 4.8%6 Person Household 2.0% 1.9% 1.8%7 + Person Household 1.4% 1.6% 1.2%
2000 Households by Year Householder Moved InTotal 4,673 13,979 59,930
Moved in 1999 to March 2000 22.5% 25.5% 25.2%Moved in 1995 to 1998 29.4% 30.1% 28.9%Moved in 1990 to 1994 12.6% 13.1% 13.8%Moved in 1980 to 1989 10.1% 10.5% 12.2%Moved in 1970 to 1979 9.5% 9.1% 9.2%Moved in 1969 or Earlier 15.9% 11.9% 10.7%
Median Year Householder Moved In 1995 1996 19952000 Housing Units by Units in StructureTotal 5,320 15,550 64,961
1, Detached 62.3% 57.8% 61.3%1, Attached 2.0% 2.5% 3.3%2 7.9% 6.4% 3.7%3 or 4 9.3% 10.0% 7.2%5 to 9 11.8% 12.0% 10.9%10 to 19 3.6% 4.7% 5.2%20 + 2.8% 5.9% 5.0%Mobile Home 0.4% 0.8% 3.4%Other 0.0% 0.0% 0.0%
2000 Housing Units by Year Structure BuiltTotal 5,319 15,551 64,959
1999 to March 2000 0.7% 1.3% 2.3%1995 to 1998 3.8% 3.3% 5.4%1990 to 1994 3.8% 3.7% 5.7%1980 to 1989 7.0% 7.9% 12.6%1970 to 1979 13.8% 15.1% 17.6%1969 or Earlier 70.9% 68.7% 56.4%
Median Year Structure Built 1962 1962 1967
January 20, 2012
Made with Esri Business Analyst©2012 Esri www.esri.com/ba 800-447-9778 Try it Now! Page 7 of 8
Source: U.S. Bureau of the Census, 2000 Census of Population and Housing. Esri forecasts for 2010 and 2015.

Market ProfileWillow Oaks Village CenterMcconnell Rd, Greensboro, NC, 27401 Latitude: 36.06504Drive Time: 3, 5, 10 minutes Longitude: -79.76421
0 - 3 minutes 0 - 5 minutes 0 - 10 minutesTop 3 Tapestry Segments
1. City Commons Metro City Edge Aspiring Young Families2. Family Foundations City Commons Great Expectations3. Metro City Edge Family Foundations Family Foundations
2010 Consumer Spending Apparel & Services: Total $ $5,124,311 $15,805,626 $96,659,202
Average Spent $1,024.39 $1,064.59 $1,466.98Spending Potential Index 43 44 61
Computers & Accessories: Total $ $632,716 $1,991,442 $12,641,458Average Spent $126.49 $134.13 $191.86Spending Potential Index 57 61 87
Education: Total $ $3,795,799 $11,727,358 $73,375,313Average Spent $758.81 $789.90 $1,113.61Spending Potential Index 62 65 91
Entertainment/Recreation: Total $ $9,362,235 $28,733,062 $180,764,621Average Spent $1,871.59 $1,935.32 $2,743.44Spending Potential Index 58 60 85
Food at Home: Total $ $13,925,107 $42,878,741 $256,977,101Average Spent $2,783.74 $2,888.10 $3,900.11Spending Potential Index 62 65 87
Food Away from Home: Total $ $9,931,201 $30,519,420 $186,184,983Average Spent $1,985.33 $2,055.64 $2,825.70Spending Potential Index 62 64 88
Health Care: Total $ $11,282,996 $34,053,275 $206,401,387Average Spent $2,255.56 $2,293.66 $3,132.52Spending Potential Index 61 62 84
HH Furnishings & Equipment: Total $ $5,071,313 $15,573,000 $99,221,215Average Spent $1,013.80 $1,048.92 $1,505.87Spending Potential Index 49 51 73
Investments: Total $ $3,784,074 $11,974,566 $84,343,227Average Spent $756.47 $806.55 $1,280.07Spending Potential Index 43 46 74
Retail Goods: Total $ $70,126,459 $214,677,433 $1,331,461,995Average Spent $14,018.86 $14,459.61 $20,207.41Spending Potential Index 56 58 81
Shelter: Total $ $45,574,417 $141,156,464 $885,115,775Average Spent $9,110.70 $9,507.60 $13,433.28Spending Potential Index 58 60 85
TV/Video/Audio:Total $ $3,902,745 $11,933,723 $71,793,997Average Spent $780.19 $803.80 $1,089.61Spending Potential Index 63 65 88
Travel: Total $ $4,929,551 $15,172,498 $100,178,095Average Spent $985.46 $1,021.94 $1,520.39Spending Potential Index 52 54 80
Vehicle Maintenance & Repairs: Total $ $2,814,561 $8,616,551 $53,179,851Average Spent $562.65 $580.37 $807.10Spending Potential Index 60 62 86
Data Note: Consumer spending shows the amount spent on a variety of goods and services by households that reside in the area. Expenditures are shown by broadbudget categories that are not mutually exclusive. Consumer spending does not equal business revenue. Total and Average Amount Spent Per Household represent annualfigures. The Spending Potential Index represents the amount spent in the area relative to a national average of 100.Source: Consumer Spending data are derived from the 2006 and 2007 Consumer Expenditure Surveys, Bureau of Labor Statistics. Esri.
January 20, 2012
Made with Esri Business Analyst©2012 Esri www.esri.com/ba 800-447-9778 Try it Now! Page 8 of 8
Source: U.S. Bureau of the Census, 2000 Census of Population and Housing. Esri forecasts for 2010 and 2015.

Retail Goods and Services ExpendituresWillow Oaks Village CenterMcconnell Rd, Greensboro, NC, 27401 Latitude: 36.06504Drive Time: 3 minutes Longitude: -79.76421
Top Tapestry Segments Percent Demographic Summary 2010 2015City Commons 26.9% Population 15,671 16,223Family Foundations 25.1% Households 5,002 5,246Metro City Edge 15.0% Families 2,954 3,059Modest Income Homes 13.2% Median Age 24.8 24.9College Towns 6.0% Median Household Income $32,237 $37,150
Spending Potential Average AmountIndex Spent Total
Apparel and Services 43 $1,024.39 $5,124,311Men's 39 $180.73 $904,081Women's 38 $313.57 $1,568,590Children's 47 $188.87 $944,778Footwear 31 $128.34 $642,009Watches & Jewelry 55 $106.92 $534,839Apparel Products and Services (1) 113 $105.95 $530,014
ComputerComputers and Hardware for Home Use 58 $110.39 $552,202Software and Accessories for Home Use 56 $16.10 $80,514
Entertainment & Recreation 58 $1,871.59 $9,362,235Fees and Admissions 54 $332.71 $1,664,300
Membership Fees for Clubs (2) 54 $88.76 $444,007Fees for Participant Sports, excl. Trips 54 $57.37 $286,995Admission to Movie/Theatre/Opera/Ballet 57 $86.17 $431,038Admission to Sporting Events, excl. Trips 58 $34.55 $172,835Fees for Recreational Lessons 48 $65.37 $326,993Dating Services 63 $0.49 $2,431
TV/Video/Audio 63 $780.19 $3,902,745Community Antenna or Cable TV 65 $471.64 $2,359,293Televisions 59 $114.29 $571,729VCRs, Video Cameras, and DVD Players 60 $12.24 $61,213Video Cassettes and DVDs 64 $33.51 $167,614Video and Computer Game Hardware and Software 66 $36.73 $183,713Satellite Dishes 50 $0.63 $3,174Rental of Video Cassettes and DVDs 62 $25.35 $126,796Streaming/Downloaded Video 61 $0.86 $4,295
Audio (3) 55 $80.81 $404,251Rental and Repair of TV/Radio/Sound Equipment 54 $4.13 $20,667
Pets 69 $297.87 $1,490,038Toys and Games (4) 61 $88.64 $443,417Recreational Vehicles and Fees (5) 40 $130.68 $653,673Sports/Recreation/Exercise Equipment (6) 42 $76.72 $383,763Photo Equipment and Supplies (7) 56 $57.65 $288,364Reading (8) 57 $88.54 $442,877Catered Affairs (9) 76 $18.60 $93,058
Food 62 $4,769.07 $23,856,308Food at Home 62 $2,783.74 $13,925,107
Bakery and Cereal Products 62 $370.33 $1,852,514Meats, Poultry, Fish, and Eggs 64 $660.49 $3,303,984Dairy Products 61 $303.85 $1,519,934Fruits and Vegetables 60 $473.86 $2,370,366Snacks and Other Food at Home (10) 63 $975.21 $4,878,308
Food Away from Home 62 $1,985.33 $9,931,201Alcoholic Beverages 64 $363.20 $1,816,827Nonalcoholic Beverages at Home 64 $278.85 $1,394,909
January 20, 2012
Made with Esri Business Analyst©2012 Esri www.esri.com/ba 800-447-9778 Try it Now! Page 1 of 9
Data Note: The Spending Potential Index (SPI) is household-based, and represents the amount spent for a product or service relative to a national average of 100. Detailmay not sum to totals due to rounding. Source: Esri forecasts for 2010 and 2015; Consumer Spending data are derived from the 2006 and 2007 Consumer Expenditure Surveys, Bureau of Labor Statistics.

Retail Goods and Services ExpendituresWillow Oaks Village CenterMcconnell Rd, Greensboro, NC, 27401 Latitude: 36.06504Drive Time: 3 minutes Longitude: -79.76421
Spending Potential Average AmountIndex Spent Total
FinancialInvestments 43 $756.47 $3,784,074Vehicle Loans 59 $2,910.01 $14,556,705
HealthNonprescription Drugs 61 $62.89 $314,582Prescription Drugs 65 $322.66 $1,614,024Eyeglasses and Contact Lenses 60 $45.89 $229,565
HomeMortgage Payment and Basics (11) 50 $4,636.88 $23,195,022Maintenance and Remodeling Services 49 $972.90 $4,866,732Maintenance and Remodeling Materials (12) 45 $168.48 $842,807Utilities, Fuel, and Public Services 65 $2,930.18 $14,657,622
Household Furnishings and EquipmentHousehold Textiles (13) 57 $75.75 $378,930Furniture 56 $338.96 $1,695,583Floor Coverings 56 $41.88 $209,518Major Appliances (14) 54 $164.82 $824,490Housewares (15) 50 $43.42 $217,179Small Appliances 60 $19.73 $98,714Luggage 54 $5.02 $25,128Telephones and Accessories 43 $18.13 $90,678
Household OperationsChild Care 57 $264.44 $1,322,806Lawn and Garden (16) 52 $217.28 $1,086,880Moving/Storage/Freight Express 53 $32.24 $161,280
Housekeeping Supplies (17) 62 $434.05 $2,171,261Insurance
Owners and Renters Insurance 58 $267.14 $1,336,308Vehicle Insurance 61 $714.26 $3,572,928Life/Other Insurance 57 $237.46 $1,187,847Health Insurance 61 $1,182.27 $5,914,056
Personal Care Products (18) 62 $245.36 $1,227,351School Books and Supplies (19) 69 $73.69 $368,619Smoking Products 74 $314.40 $1,572,705Transportation
Vehicle Purchases (Net Outlay) (20) 58 $2,552.24 $12,767,078Gasoline and Motor Oil 63 $1,811.08 $9,059,541Vehicle Maintenance and Repairs 60 $562.65 $2,814,561
TravelAirline Fares 52 $236.77 $1,184,416Lodging on Trips 51 $223.96 $1,120,323Auto/Truck/Van Rental on Trips 54 $19.65 $98,269Food and Drink on Trips 52 $228.43 $1,142,693
January 20, 2012
Made with Esri Business Analyst©2012 Esri www.esri.com/ba 800-447-9778 Try it Now! Page 2 of 9
Data Note: The Spending Potential Index (SPI) is household-based, and represents the amount spent for a product or service relative to a national average of 100. Detailmay not sum to totals due to rounding. Source: Esri forecasts for 2010 and 2015; Consumer Spending data are derived from the 2006 and 2007 Consumer Expenditure Surveys, Bureau of Labor Statistics.

Retail Goods and Services ExpendituresWillow Oaks Village CenterMcconnell Rd, Greensboro, NC, 27401 Latitude: 36.06504Drive Time: 3 minutes Longitude: -79.76421
(1) Apparel Products and Services includes material for making clothes, sewing patterns and notions, shoe repair and other shoe services, apparel laundry and drycleaning, alteration, repair and tailoring of apparel, clothing rental and storage, and watch and jewelry repair.
(2) Membership Fees for Clubs includes membership fees for social, recreational, and civic clubs.
(3) Audio includes satellite radio service, sound components and systems, digital audio players, records, CDs, audio tapes, streaming/downloaded audio, tape recorders,radios, musical instruments and accessories, and rental and repair of musical instruments.
(4) Toys and Games includes toys, games, arts and crafts, tricycles, playground equipment, arcade games, and online entertainment and games.
(5) Recreational Vehicles & Fees includes docking and landing fees for boats and planes, purchase and rental of RVs or boats, and camp fees.
(6) Sports/Recreation/Exercise Equipment includes exercise equipment and gear, game tables, bicycles, camping equipment, hunting and fishing equipment, wintersports equipment, water sports equipment, other sports equipment, and rental/repair of sports/recreation/exercise equipment.
(7) Photo Equipment and Supplies includes film, film processing, photographic equipment, rental and repair of photo equipment, and photographer fees. (8) Reading includes magazine and newspaper subscriptions, single copies of magazines and newspapers, and books.
(9) Catered Affairs includes expenses associated with live entertainment and rental of party supplies.
(10) Snacks and Other Food at Home includes candy, chewing gum, sugar, artificial sweeteners, jam, jelly, preserves, margarine, fat, oil, salad dressing, nondairy creamand milk, peanut butter, frozen prepared food, potato chips, nuts, salt, spices, seasonings, olives, pickles, relishes, sauces, gravy, other condiments, soup, prepared salad,prepared dessert, baby food, miscellaneous prepared food, and nonalcoholic beverages.
(11) Mortgage Payment and Basics includes mortgage interest, mortgage principal, property taxes, homeowners insurance, and ground rent.
(12) Maintenance and Remodeling Materials includes supplies/tools/equipment for painting and wallpapering, plumbing supplies and equipment, electrical/heating/ACsupplies, materials for hard surface flooring, materials for roofing/gutters, materials for plaster/panel/siding, materials for patio/fence/brick work, landscaping materials, andinsulation materials for owned homes.
(13) Household Textiles includes bathroom linens, bedroom linens, kitchen linens, dining room linens, other linens, curtains, draperies, slipcovers, decorative pillows, andmaterials for slipcovers and curtains.
(14) Major Appliances includes dishwashers, disposals, refrigerators, freezers, washers, dryers, stoves, ovens, microwaves, window air conditioners, electric floor cleaningequipment, sewing machines, and miscellaneous appliances.
(15) Housewares includes plastic dinnerware, china, flatware, glassware, serving pieces, nonelectric cookware, and tableware.
(16) Lawn and Garden includes lawn and garden supplies, equipment and care service, indoor plants, fresh flowers, and repair/rental of lawn and garden equipment.
(17) Housekeeping Supplies includes soaps and laundry detergents, cleaning products, toilet tissue, paper towels, napkins, paper/plastic/foil products, stationery, giftwrapsupplies, postage, and delivery services.
(18) Personal Care Products includes hair care products, nonelectric articles for hair, wigs, hairpieces, oral hygiene products, shaving needs, perfume, cosmetics, skincare,bath products, nail products, deodorant, feminine hygiene products, and personal care appliances.
(19) School Books and Supplies includes school books and supplies for college, elementary school, high school, and preschool.
(20) Vehicle Purchases (Net Outlay) includes net outlay for new and used cars, trucks, vans, motorcycles, and motor scooters.
January 20, 2012
Made with Esri Business Analyst©2012 Esri www.esri.com/ba 800-447-9778 Try it Now! Page 3 of 9
Data Note: The Spending Potential Index (SPI) is household-based, and represents the amount spent for a product or service relative to a national average of 100. Detailmay not sum to totals due to rounding. Source: Esri forecasts for 2010 and 2015; Consumer Spending data are derived from the 2006 and 2007 Consumer Expenditure Surveys, Bureau of Labor Statistics.
Retail Goods and Services ExpendituresWillow Oaks Village CenterMcconnell Rd, Greensboro, NC, 27401 Latitude: 36.06504Drive Time: 5 minutes Longitude: -79.76421
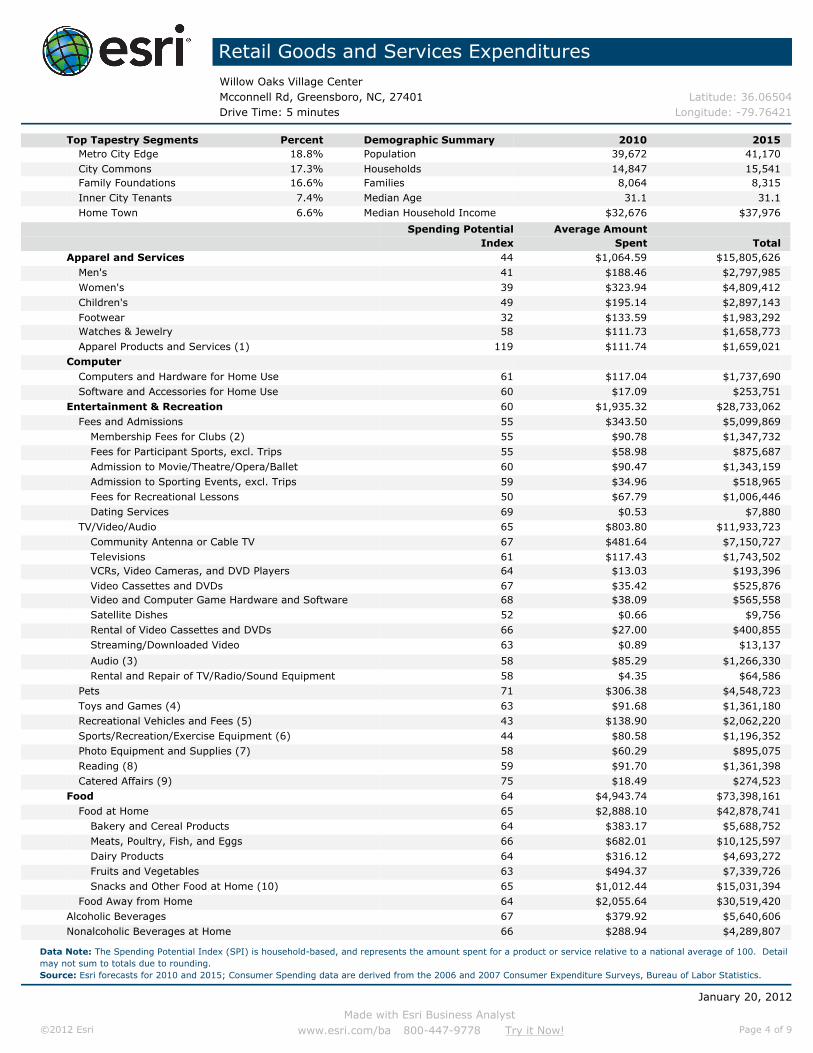
Top Tapestry Segments Percent Demographic Summary 2010 2015Metro City Edge 18.8% Population 39,672 41,170City Commons 17.3% Households 14,847 15,541Family Foundations 16.6% Families 8,064 8,315Inner City Tenants 7.4% Median Age 31.1 31.1Home Town 6.6% Median Household Income $32,676 $37,976
Spending Potential Average AmountIndex Spent Total
Apparel and Services 44 $1,064.59 $15,805,626Men's 41 $188.46 $2,797,985Women's 39 $323.94 $4,809,412Children's 49 $195.14 $2,897,143Footwear 32 $133.59 $1,983,292Watches & Jewelry 58 $111.73 $1,658,773Apparel Products and Services (1) 119 $111.74 $1,659,021
ComputerComputers and Hardware for Home Use 61 $117.04 $1,737,690Software and Accessories for Home Use 60 $17.09 $253,751
Entertainment & Recreation 60 $1,935.32 $28,733,062Fees and Admissions 55 $343.50 $5,099,869
Membership Fees for Clubs (2) 55 $90.78 $1,347,732Fees for Participant Sports, excl. Trips 55 $58.98 $875,687Admission to Movie/Theatre/Opera/Ballet 60 $90.47 $1,343,159Admission to Sporting Events, excl. Trips 59 $34.96 $518,965Fees for Recreational Lessons 50 $67.79 $1,006,446Dating Services 69 $0.53 $7,880
TV/Video/Audio 65 $803.80 $11,933,723Community Antenna or Cable TV 67 $481.64 $7,150,727Televisions 61 $117.43 $1,743,502VCRs, Video Cameras, and DVD Players 64 $13.03 $193,396Video Cassettes and DVDs 67 $35.42 $525,876Video and Computer Game Hardware and Software 68 $38.09 $565,558Satellite Dishes 52 $0.66 $9,756Rental of Video Cassettes and DVDs 66 $27.00 $400,855Streaming/Downloaded Video 63 $0.89 $13,137
Audio (3) 58 $85.29 $1,266,330Rental and Repair of TV/Radio/Sound Equipment 58 $4.35 $64,586
Pets 71 $306.38 $4,548,723Toys and Games (4) 63 $91.68 $1,361,180Recreational Vehicles and Fees (5) 43 $138.90 $2,062,220Sports/Recreation/Exercise Equipment (6) 44 $80.58 $1,196,352Photo Equipment and Supplies (7) 58 $60.29 $895,075Reading (8) 59 $91.70 $1,361,398Catered Affairs (9) 75 $18.49 $274,523
Food 64 $4,943.74 $73,398,161Food at Home 65 $2,888.10 $42,878,741
Bakery and Cereal Products 64 $383.17 $5,688,752Meats, Poultry, Fish, and Eggs 66 $682.01 $10,125,597Dairy Products 64 $316.12 $4,693,272Fruits and Vegetables 63 $494.37 $7,339,726Snacks and Other Food at Home (10) 65 $1,012.44 $15,031,394
Food Away from Home 64 $2,055.64 $30,519,420Alcoholic Beverages 67 $379.92 $5,640,606Nonalcoholic Beverages at Home 66 $288.94 $4,289,807
January 20, 2012
Made with Esri Business Analyst©2012 Esri www.esri.com/ba 800-447-9778 Try it Now! Page 4 of 9
Data Note: The Spending Potential Index (SPI) is household-based, and represents the amount spent for a product or service relative to a national average of 100. Detailmay not sum to totals due to rounding. Source: Esri forecasts for 2010 and 2015; Consumer Spending data are derived from the 2006 and 2007 Consumer Expenditure Surveys, Bureau of Labor Statistics.

Retail Goods and Services ExpendituresWillow Oaks Village CenterMcconnell Rd, Greensboro, NC, 27401 Latitude: 36.06504Drive Time: 5 minutes Longitude: -79.76421
Spending Potential Average AmountIndex Spent Total
FinancialInvestments 46 $806.55 $11,974,566Vehicle Loans 61 $3,005.99 $44,628,982
HealthNonprescription Drugs 62 $64.22 $953,380Prescription Drugs 65 $322.65 $4,790,212Eyeglasses and Contact Lenses 61 $46.79 $694,692
HomeMortgage Payment and Basics (11) 50 $4,679.93 $69,481,524Maintenance and Remodeling Services 49 $969.05 $14,387,188Maintenance and Remodeling Materials (12) 46 $172.80 $2,565,462Utilities, Fuel, and Public Services 66 $2,974.12 $44,155,820
Household Furnishings and EquipmentHousehold Textiles (13) 59 $78.34 $1,163,009Furniture 58 $349.60 $5,190,346Floor Coverings 56 $42.05 $624,277Major Appliances (14) 56 $168.65 $2,503,816Housewares (15) 53 $45.80 $679,968Small Appliances 62 $20.41 $303,029Luggage 56 $5.22 $77,494Telephones and Accessories 45 $19.06 $282,898
Household OperationsChild Care 59 $275.06 $4,083,761Lawn and Garden (16) 52 $218.41 $3,242,634Moving/Storage/Freight Express 58 $34.97 $519,146
Housekeeping Supplies (17) 63 $444.03 $6,592,308Insurance
Owners and Renters Insurance 57 $262.73 $3,900,613Vehicle Insurance 63 $733.59 $10,891,405Life/Other Insurance 57 $237.47 $3,525,598Health Insurance 62 $1,199.26 $17,805,102
Personal Care Products (18) 63 $252.83 $3,753,722School Books and Supplies (19) 74 $78.64 $1,167,564Smoking Products 76 $325.99 $4,839,912Transportation
Vehicle Purchases (Net Outlay) (20) 60 $2,641.80 $39,222,039Gasoline and Motor Oil 65 $1,860.19 $27,617,615Vehicle Maintenance and Repairs 62 $580.37 $8,616,551
TravelAirline Fares 54 $247.42 $3,673,437Lodging on Trips 53 $229.80 $3,411,778Auto/Truck/Van Rental on Trips 55 $20.28 $301,126Food and Drink on Trips 54 $236.72 $3,514,463
January 20, 2012
Made with Esri Business Analyst©2012 Esri www.esri.com/ba 800-447-9778 Try it Now! Page 5 of 9
Data Note: The Spending Potential Index (SPI) is household-based, and represents the amount spent for a product or service relative to a national average of 100. Detailmay not sum to totals due to rounding. Source: Esri forecasts for 2010 and 2015; Consumer Spending data are derived from the 2006 and 2007 Consumer Expenditure Surveys, Bureau of Labor Statistics.

Retail Goods and Services ExpendituresWillow Oaks Village CenterMcconnell Rd, Greensboro, NC, 27401 Latitude: 36.06504Drive Time: 5 minutes Longitude: -79.76421
(1) Apparel Products and Services includes material for making clothes, sewing patterns and notions, shoe repair and other shoe services, apparel laundry and drycleaning, alteration, repair and tailoring of apparel, clothing rental and storage, and watch and jewelry repair.
(2) Membership Fees for Clubs includes membership fees for social, recreational, and civic clubs.
(3) Audio includes satellite radio service, sound components and systems, digital audio players, records, CDs, audio tapes, streaming/downloaded audio, tape recorders,radios, musical instruments and accessories, and rental and repair of musical instruments.
(4) Toys and Games includes toys, games, arts and crafts, tricycles, playground equipment, arcade games, and online entertainment and games.
(5) Recreational Vehicles & Fees includes docking and landing fees for boats and planes, purchase and rental of RVs or boats, and camp fees.
(6) Sports/Recreation/Exercise Equipment includes exercise equipment and gear, game tables, bicycles, camping equipment, hunting and fishing equipment, wintersports equipment, water sports equipment, other sports equipment, and rental/repair of sports/recreation/exercise equipment.
(7) Photo Equipment and Supplies includes film, film processing, photographic equipment, rental and repair of photo equipment, and photographer fees. (8) Reading includes magazine and newspaper subscriptions, single copies of magazines and newspapers, and books.
(9) Catered Affairs includes expenses associated with live entertainment and rental of party supplies.
(10) Snacks and Other Food at Home includes candy, chewing gum, sugar, artificial sweeteners, jam, jelly, preserves, margarine, fat, oil, salad dressing, nondairy creamand milk, peanut butter, frozen prepared food, potato chips, nuts, salt, spices, seasonings, olives, pickles, relishes, sauces, gravy, other condiments, soup, prepared salad,prepared dessert, baby food, miscellaneous prepared food, and nonalcoholic beverages.
(11) Mortgage Payment and Basics includes mortgage interest, mortgage principal, property taxes, homeowners insurance, and ground rent.
(12) Maintenance and Remodeling Materials includes supplies/tools/equipment for painting and wallpapering, plumbing supplies and equipment, electrical/heating/ACsupplies, materials for hard surface flooring, materials for roofing/gutters, materials for plaster/panel/siding, materials for patio/fence/brick work, landscaping materials, andinsulation materials for owned homes.
(13) Household Textiles includes bathroom linens, bedroom linens, kitchen linens, dining room linens, other linens, curtains, draperies, slipcovers, decorative pillows, andmaterials for slipcovers and curtains.
(14) Major Appliances includes dishwashers, disposals, refrigerators, freezers, washers, dryers, stoves, ovens, microwaves, window air conditioners, electric floor cleaningequipment, sewing machines, and miscellaneous appliances.
(15) Housewares includes plastic dinnerware, china, flatware, glassware, serving pieces, nonelectric cookware, and tableware.
(16) Lawn and Garden includes lawn and garden supplies, equipment and care service, indoor plants, fresh flowers, and repair/rental of lawn and garden equipment.
(17) Housekeeping Supplies includes soaps and laundry detergents, cleaning products, toilet tissue, paper towels, napkins, paper/plastic/foil products, stationery, giftwrapsupplies, postage, and delivery services.
(18) Personal Care Products includes hair care products, nonelectric articles for hair, wigs, hairpieces, oral hygiene products, shaving needs, perfume, cosmetics, skincare,bath products, nail products, deodorant, feminine hygiene products, and personal care appliances.
(19) School Books and Supplies includes school books and supplies for college, elementary school, high school, and preschool.
(20) Vehicle Purchases (Net Outlay) includes net outlay for new and used cars, trucks, vans, motorcycles, and motor scooters.
January 20, 2012
Made with Esri Business Analyst©2012 Esri www.esri.com/ba 800-447-9778 Try it Now! Page 6 of 9
Data Note: The Spending Potential Index (SPI) is household-based, and represents the amount spent for a product or service relative to a national average of 100. Detailmay not sum to totals due to rounding. Source: Esri forecasts for 2010 and 2015; Consumer Spending data are derived from the 2006 and 2007 Consumer Expenditure Surveys, Bureau of Labor Statistics.

Retail Goods and Services ExpendituresWillow Oaks Village CenterMcconnell Rd, Greensboro, NC, 27401 Latitude: 36.06504Drive Time: 10 minutes Longitude: -79.76421
Top Tapestry Segments Percent Demographic Summary 2010 2015Aspiring Young Families 12.8% Population 165,163 173,757Great Expectations 6.5% Households 65,890 69,602Family Foundations 6.1% Families 38,026 39,750City Commons 5.9% Median Age 34.1 34.5Metropolitans 5.8% Median Household Income $45,824 $53,954
Spending Potential Average AmountIndex Spent Total
Apparel and Services 61 $1,466.98 $96,659,202Men's 57 $262.97 $17,327,044Women's 54 $449.69 $29,629,916Children's 66 $263.99 $17,393,907Footwear 44 $181.85 $11,982,332Watches & Jewelry 83 $161.98 $10,672,892Apparel Products and Services (1) 157 $146.50 $9,653,111
ComputerComputers and Hardware for Home Use 87 $167.14 $11,012,627Software and Accessories for Home Use 87 $24.72 $1,628,830
Entertainment & Recreation 85 $2,743.44 $180,764,621Fees and Admissions 82 $508.51 $33,505,573
Membership Fees for Clubs (2) 82 $134.04 $8,831,780Fees for Participant Sports, excl. Trips 82 $87.79 $5,784,664Admission to Movie/Theatre/Opera/Ballet 86 $130.09 $8,571,384Admission to Sporting Events, excl. Trips 85 $50.47 $3,325,189Fees for Recreational Lessons 77 $105.42 $6,946,316Dating Services 91 $0.70 $46,240
TV/Video/Audio 88 $1,089.61 $71,793,997Community Antenna or Cable TV 88 $638.13 $42,046,379Televisions 86 $166.35 $10,960,637VCRs, Video Cameras, and DVD Players 89 $18.20 $1,199,449Video Cassettes and DVDs 92 $48.38 $3,187,994Video and Computer Game Hardware and Software 93 $51.96 $3,423,891Satellite Dishes 79 $1.00 $65,972Rental of Video Cassettes and DVDs 92 $37.73 $2,485,849Streaming/Downloaded Video 86 $1.21 $79,735
Audio (3) 82 $120.46 $7,936,855Rental and Repair of TV/Radio/Sound Equipment 81 $6.18 $407,236
Pets 101 $435.84 $28,717,267Toys and Games (4) 87 $126.87 $8,359,186Recreational Vehicles and Fees (5) 69 $222.96 $14,690,471Sports/Recreation/Exercise Equipment (6) 65 $118.14 $7,784,321Photo Equipment and Supplies (7) 84 $87.40 $5,758,883Reading (8) 84 $129.73 $8,547,849Catered Affairs (9) 99 $24.39 $1,607,075
Food 87 $6,725.81 $443,162,084Food at Home 87 $3,900.11 $256,977,101
Bakery and Cereal Products 87 $517.64 $34,107,331Meats, Poultry, Fish, and Eggs 88 $909.96 $59,956,916Dairy Products 86 $429.73 $28,314,825Fruits and Vegetables 86 $674.55 $44,445,840Snacks and Other Food at Home (10) 88 $1,368.23 $90,152,188
Food Away from Home 88 $2,825.70 $186,184,983Alcoholic Beverages 92 $522.79 $34,446,590Nonalcoholic Beverages at Home 88 $386.62 $25,474,544
January 20, 2012
Made with Esri Business Analyst©2012 Esri www.esri.com/ba 800-447-9778 Try it Now! Page 7 of 9
Data Note: The Spending Potential Index (SPI) is household-based, and represents the amount spent for a product or service relative to a national average of 100. Detailmay not sum to totals due to rounding. Source: Esri forecasts for 2010 and 2015; Consumer Spending data are derived from the 2006 and 2007 Consumer Expenditure Surveys, Bureau of Labor Statistics.
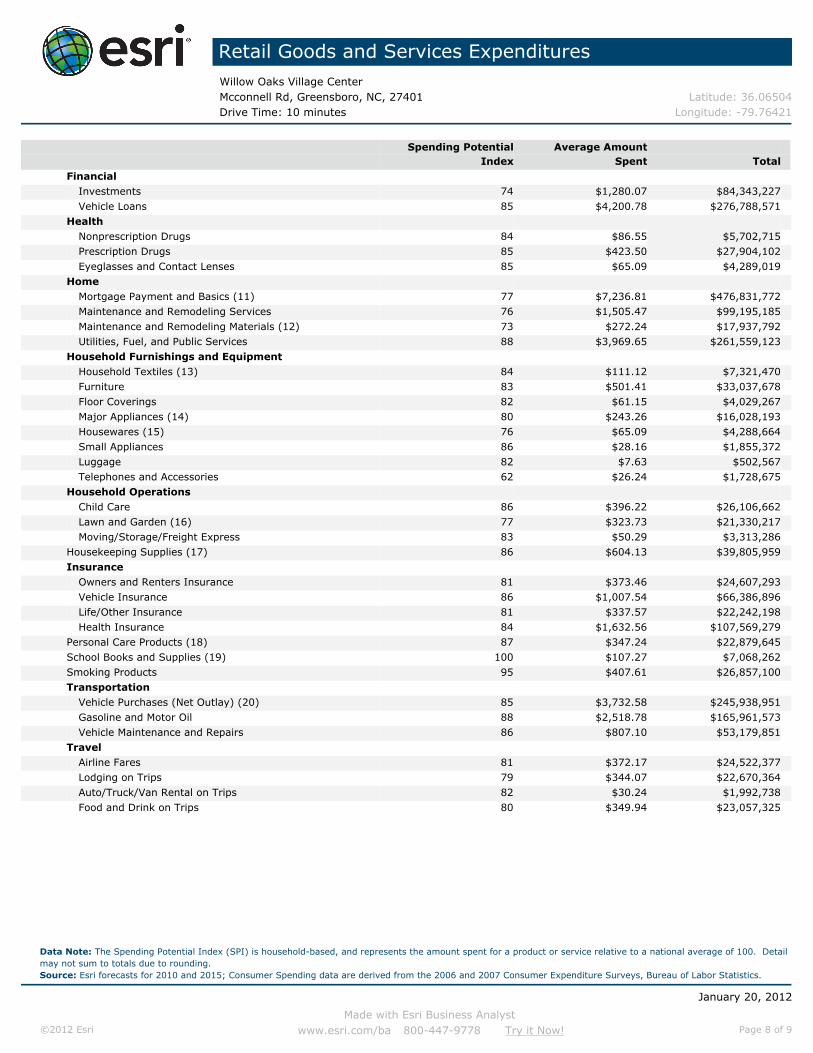
Retail Goods and Services ExpendituresWillow Oaks Village CenterMcconnell Rd, Greensboro, NC, 27401 Latitude: 36.06504Drive Time: 10 minutes Longitude: -79.76421
Spending Potential Average AmountIndex Spent Total
FinancialInvestments 74 $1,280.07 $84,343,227Vehicle Loans 85 $4,200.78 $276,788,571
HealthNonprescription Drugs 84 $86.55 $5,702,715Prescription Drugs 85 $423.50 $27,904,102Eyeglasses and Contact Lenses 85 $65.09 $4,289,019
HomeMortgage Payment and Basics (11) 77 $7,236.81 $476,831,772Maintenance and Remodeling Services 76 $1,505.47 $99,195,185Maintenance and Remodeling Materials (12) 73 $272.24 $17,937,792Utilities, Fuel, and Public Services 88 $3,969.65 $261,559,123
Household Furnishings and EquipmentHousehold Textiles (13) 84 $111.12 $7,321,470Furniture 83 $501.41 $33,037,678Floor Coverings 82 $61.15 $4,029,267Major Appliances (14) 80 $243.26 $16,028,193Housewares (15) 76 $65.09 $4,288,664Small Appliances 86 $28.16 $1,855,372Luggage 82 $7.63 $502,567Telephones and Accessories 62 $26.24 $1,728,675
Household OperationsChild Care 86 $396.22 $26,106,662Lawn and Garden (16) 77 $323.73 $21,330,217Moving/Storage/Freight Express 83 $50.29 $3,313,286
Housekeeping Supplies (17) 86 $604.13 $39,805,959Insurance
Owners and Renters Insurance 81 $373.46 $24,607,293Vehicle Insurance 86 $1,007.54 $66,386,896Life/Other Insurance 81 $337.57 $22,242,198Health Insurance 84 $1,632.56 $107,569,279
Personal Care Products (18) 87 $347.24 $22,879,645School Books and Supplies (19) 100 $107.27 $7,068,262Smoking Products 95 $407.61 $26,857,100Transportation
Vehicle Purchases (Net Outlay) (20) 85 $3,732.58 $245,938,951Gasoline and Motor Oil 88 $2,518.78 $165,961,573Vehicle Maintenance and Repairs 86 $807.10 $53,179,851
TravelAirline Fares 81 $372.17 $24,522,377Lodging on Trips 79 $344.07 $22,670,364Auto/Truck/Van Rental on Trips 82 $30.24 $1,992,738Food and Drink on Trips 80 $349.94 $23,057,325
January 20, 2012
Made with Esri Business Analyst©2012 Esri www.esri.com/ba 800-447-9778 Try it Now! Page 8 of 9
Data Note: The Spending Potential Index (SPI) is household-based, and represents the amount spent for a product or service relative to a national average of 100. Detailmay not sum to totals due to rounding. Source: Esri forecasts for 2010 and 2015; Consumer Spending data are derived from the 2006 and 2007 Consumer Expenditure Surveys, Bureau of Labor Statistics.

Retail Goods and Services ExpendituresWillow Oaks Village CenterMcconnell Rd, Greensboro, NC, 27401 Latitude: 36.06504Drive Time: 10 minutes Longitude: -79.76421
(1) Apparel Products and Services includes material for making clothes, sewing patterns and notions, shoe repair and other shoe services, apparel laundry and drycleaning, alteration, repair and tailoring of apparel, clothing rental and storage, and watch and jewelry repair.
(2) Membership Fees for Clubs includes membership fees for social, recreational, and civic clubs.
(3) Audio includes satellite radio service, sound components and systems, digital audio players, records, CDs, audio tapes, streaming/downloaded audio, tape recorders,radios, musical instruments and accessories, and rental and repair of musical instruments.
(4) Toys and Games includes toys, games, arts and crafts, tricycles, playground equipment, arcade games, and online entertainment and games.
(5) Recreational Vehicles & Fees includes docking and landing fees for boats and planes, purchase and rental of RVs or boats, and camp fees.
(6) Sports/Recreation/Exercise Equipment includes exercise equipment and gear, game tables, bicycles, camping equipment, hunting and fishing equipment, wintersports equipment, water sports equipment, other sports equipment, and rental/repair of sports/recreation/exercise equipment.
(7) Photo Equipment and Supplies includes film, film processing, photographic equipment, rental and repair of photo equipment, and photographer fees. (8) Reading includes magazine and newspaper subscriptions, single copies of magazines and newspapers, and books.
(9) Catered Affairs includes expenses associated with live entertainment and rental of party supplies.
(10) Snacks and Other Food at Home includes candy, chewing gum, sugar, artificial sweeteners, jam, jelly, preserves, margarine, fat, oil, salad dressing, nondairy creamand milk, peanut butter, frozen prepared food, potato chips, nuts, salt, spices, seasonings, olives, pickles, relishes, sauces, gravy, other condiments, soup, prepared salad,prepared dessert, baby food, miscellaneous prepared food, and nonalcoholic beverages.
(11) Mortgage Payment and Basics includes mortgage interest, mortgage principal, property taxes, homeowners insurance, and ground rent.
(12) Maintenance and Remodeling Materials includes supplies/tools/equipment for painting and wallpapering, plumbing supplies and equipment, electrical/heating/ACsupplies, materials for hard surface flooring, materials for roofing/gutters, materials for plaster/panel/siding, materials for patio/fence/brick work, landscaping materials, andinsulation materials for owned homes.
(13) Household Textiles includes bathroom linens, bedroom linens, kitchen linens, dining room linens, other linens, curtains, draperies, slipcovers, decorative pillows, andmaterials for slipcovers and curtains.
(14) Major Appliances includes dishwashers, disposals, refrigerators, freezers, washers, dryers, stoves, ovens, microwaves, window air conditioners, electric floor cleaningequipment, sewing machines, and miscellaneous appliances.
(15) Housewares includes plastic dinnerware, china, flatware, glassware, serving pieces, nonelectric cookware, and tableware.
(16) Lawn and Garden includes lawn and garden supplies, equipment and care service, indoor plants, fresh flowers, and repair/rental of lawn and garden equipment.
(17) Housekeeping Supplies includes soaps and laundry detergents, cleaning products, toilet tissue, paper towels, napkins, paper/plastic/foil products, stationery, giftwrapsupplies, postage, and delivery services.
(18) Personal Care Products includes hair care products, nonelectric articles for hair, wigs, hairpieces, oral hygiene products, shaving needs, perfume, cosmetics, skincare,bath products, nail products, deodorant, feminine hygiene products, and personal care appliances.
(19) School Books and Supplies includes school books and supplies for college, elementary school, high school, and preschool.
(20) Vehicle Purchases (Net Outlay) includes net outlay for new and used cars, trucks, vans, motorcycles, and motor scooters.
January 20, 2012
Made with Esri Business Analyst©2012 Esri www.esri.com/ba 800-447-9778 Try it Now! Page 9 of 9
Data Note: The Spending Potential Index (SPI) is household-based, and represents the amount spent for a product or service relative to a national average of 100. Detailmay not sum to totals due to rounding. Source: Esri forecasts for 2010 and 2015; Consumer Spending data are derived from the 2006 and 2007 Consumer Expenditure Surveys, Bureau of Labor Statistics.

Retail MarketPlace ProfileWillow Oaks Village CenterMcconnell Rd, Greensboro, NC, 27401 Latitude: 36.06504Drive Time: 3 minutes Longitude: -79.76421
Summary Demographics2010 Population 15,6712010 Households 5,0022010 Median Disposable Income $27,2602010 Per Capita Income $16,254
NAICS Demand Supply Retail Gap Leakage/Surplus Number ofIndustry Summary (Retail Potential) (Retail Sales) Factor Businesses
Total Retail Trade and Food & Drink 44-45,722 $77,581,582 $132,147,964 $-54,566,382 -26.0 92Total Retail Trade 44-45 $66,043,155 $122,999,089 $-56,955,934 -30.1 74Total Food & Drink 722 $11,538,427 $9,148,875 $2,389,552 11.6 18
NAICS Demand Supply Retail Gap Leakage/Surplus Number ofIndustry Group (Retail Potential) (Retail Sales) Factor Businesses
Motor Vehicle & Parts Dealers 441 $14,927,987 $41,807,516 $-26,879,529 -47.4 14 Automobile Dealers 4411 $12,869,895 $34,696,122 $-21,826,226 -45.9 10 Other Motor Vehicle Dealers 4412 $1,010,313 $4,409,078 $-3,398,766 -62.7 1 Auto Parts, Accessories & Tire Stores 4413 $1,047,779 $2,702,315 $-1,654,537 -44.1 3Furniture & Home Furnishings Stores 442 $2,325,229 $313,350 $2,011,879 76.2 1 Furniture Stores 4421 $1,693,459 $40,081 $1,653,378 95.4 0 Home Furnishings Stores 4422 $631,769 $273,268 $358,501 39.6 1Electronics & Appliance Stores 4431 $2,031,139 $488,677 $1,542,463 61.2 3Bldg Materials, Garden Equip. & Supply Stores 444 $2,304,114 $3,565,554 $-1,261,441 -21.5 8 Bldg Material & Supplies Dealers 4441 $2,106,633 $3,516,726 $-1,410,092 -25.1 8 Lawn & Garden Equip & Supply Stores 4442 $197,481 $48,829 $148,652 60.4 0Food & Beverage Stores 445 $11,564,807 $6,571,811 $4,992,996 27.5 13 Grocery Stores 4451 $10,771,523 $6,442,289 $4,329,234 25.1 11 Specialty Food Stores 4452 $388,261 $129,522 $258,739 50.0 2 Beer, Wine & Liquor Stores 4453 $405,023 $0 $405,023 100.0 0Health & Personal Care Stores 446,4461 $2,619,987 $3,682,149 $-1,062,162 -16.9 3Gasoline Stations 447,4471 $12,000,000 $8,124,795 $3,875,204 19.3 4Clothing & Clothing Accessories Stores 448 $3,011,270 $917,729 $2,093,541 53.3 5 Clothing Stores 4481 $2,280,610 $617,361 $1,663,249 57.4 2 Shoe Stores 4482 $373,752 $157,032 $216,721 40.8 1 Jewelry, Luggage & Leather Goods Stores 4483 $356,908 $143,336 $213,572 42.7 1Sporting Goods, Hobby, Book & Music Stores 451 $856,064 $1,654,813 $-798,749 -31.8 5 Sporting Goods/Hobby/Musical Instr Stores 4511 $410,129 $4,007 $406,122 98.1 0 Book, Periodical & Music Stores 4512 $445,935 $1,650,806 $-1,204,871 -57.5 5General Merchandise Stores 452 $10,365,656 $10,016,926 $348,730 1.7 6 Department Stores Excluding Leased Depts. 4521 $3,819,807 $50,061 $3,769,746 97.4 0 Other General Merchandise Stores 4529 $6,545,849 $9,966,865 $-3,421,016 -20.7 5Miscellaneous Store Retailers 453 $1,231,400 $740,787 $490,613 24.9 8 Florists 4531 $66,790 $59,980 $6,810 5.4 1 Office Supplies, Stationery & Gift Stores 4532 $408,656 $390,447 $18,209 2.3 3 Used Merchandise Stores 4533 $46,243 $30,220 $16,022 21.0 1 Other Miscellaneous Store Retailers 4539 $709,711 $260,139 $449,572 46.4 3Nonstore Retailers 454 $2,805,503 $45,114,983 $-42,309,480 -88.3 4 Electronic Shopping & Mail-Order Houses 4541 $1,076,791 $55,259 $1,021,532 90.2 0 Vending Machine Operators 4542 $578,028 $219,764 $358,264 44.9 1 Direct Selling Establishments 4543 $1,150,684 $44,839,960 $-43,689,276 -95.0 3Food Services & Drinking Places 722 $11,538,427 $9,148,875 $2,389,552 11.6 18 Full-Service Restaurants 7221 $3,983,858 $3,459,039 $524,819 7.1 11 Limited-Service Eating Places 7222 $4,880,936 $3,813,694 $1,067,243 12.3 4 Special Food Services 7223 $1,907,905 $1,789,339 $118,566 3.2 3 Drinking Places - Alcoholic Beverages 7224 $765,728 $86,803 $678,925 79.6 0
Data Note: Supply (retail sales) estimates sales to consumers by establishments. Sales to businesses are excluded. Demand (retail potential) estimates the expected amountspent by consumers at retail establishments. Supply and demand estimates are in current dollars. The Leakage/Surplus Factor presents a snapshot of retail opportunity. Thisis a measure of the relationship between supply and demand that ranges from +100 (total leakage) to -100 (total surplus). A positive value represents 'leakage' of retailopportunity outside the trade area. A negative value represents a surplus of retail sales, a market where customers are drawn in from outside the trade area. The Retail Gaprepresents the difference between Retail Potential and Retail Sales. Esri uses the North American Industry Classification System (NAICS) to classify businesses by theirprimary type of economic activity. Retail establishments are classified into 27 industry groups in the Retail Trade sector, as well as four industry groups within the FoodServices & Drinking Establishments subsector. For more information on the Retail MarketPlace data, please view the methodology statement athttp://www.esri.com/library/whitepapers/pdfs/esri-data-retail-marketplace.pdf.
January 20, 2012
Made with Esri Business Analyst©2012 Esri www.esri.com/ba 800-447-9778 Try it Now! Page 1 of 6
Source: Esri and Infogroup
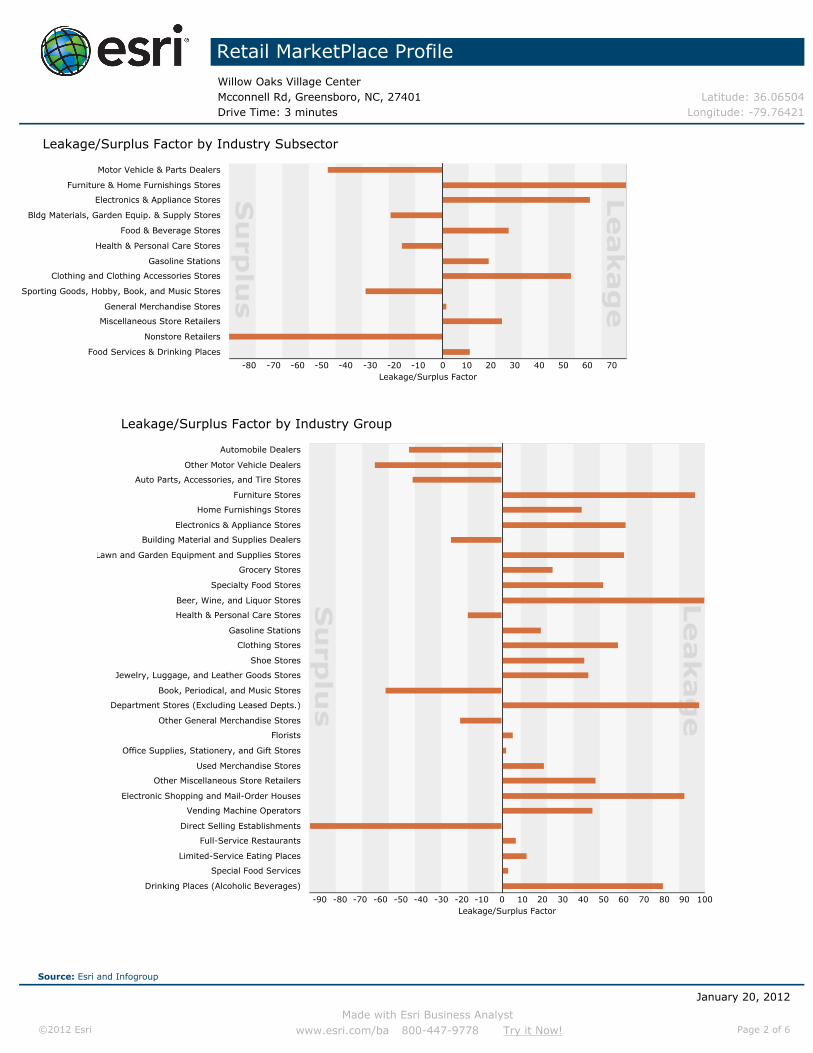
Retail MarketPlace ProfileWillow Oaks Village CenterMcconnell Rd, Greensboro, NC, 27401 Latitude: 36.06504Drive Time: 3 minutes Longitude: -79.76421
Leakage/Surplus Factor by Industry Subsector
Leakage/Surplus Factor706050403020100-10-20-30-40-50-60-70-80
Food Services & Drinking Places
Nonstore Retailers
Miscellaneous Store Retailers
General Merchandise Stores
Sporting Goods, Hobby, Book, and Music Stores
Clothing and Clothing Accessories Stores
Gasoline Stations
Health & Personal Care Stores
Food & Beverage Stores
Bldg Materials, Garden Equip. & Supply Stores
Electronics & Appliance Stores
Furniture & Home Furnishings Stores
Motor Vehicle & Parts Dealers
Leakage/Surplus Factor by Industry Group
Leakage/Surplus Factor1009080706050403020100-10-20-30-40-50-60-70-80-90
Drinking Places (Alcoholic Beverages)
Special Food Services
Limited-Service Eating Places
Full-Service Restaurants
Direct Selling Establishments
Vending Machine Operators
Electronic Shopping and Mail-Order Houses
Other Miscellaneous Store Retailers
Used Merchandise Stores
Office Supplies, Stationery, and Gift Stores
Florists
Other General Merchandise Stores
Department Stores (Excluding Leased Depts.)
Book, Periodical, and Music Stores
Jewelry, Luggage, and Leather Goods Stores
Shoe Stores
Clothing Stores
Gasoline Stations
Health & Personal Care Stores
Beer, Wine, and Liquor Stores
Specialty Food Stores
Grocery Stores
Lawn and Garden Equipment and Supplies Stores
Building Material and Supplies Dealers
Electronics & Appliance Stores
Home Furnishings Stores
Furniture Stores
Auto Parts, Accessories, and Tire Stores
Other Motor Vehicle Dealers
Automobile Dealers
January 20, 2012
Made with Esri Business Analyst©2012 Esri www.esri.com/ba 800-447-9778 Try it Now! Page 2 of 6
Source: Esri and Infogroup
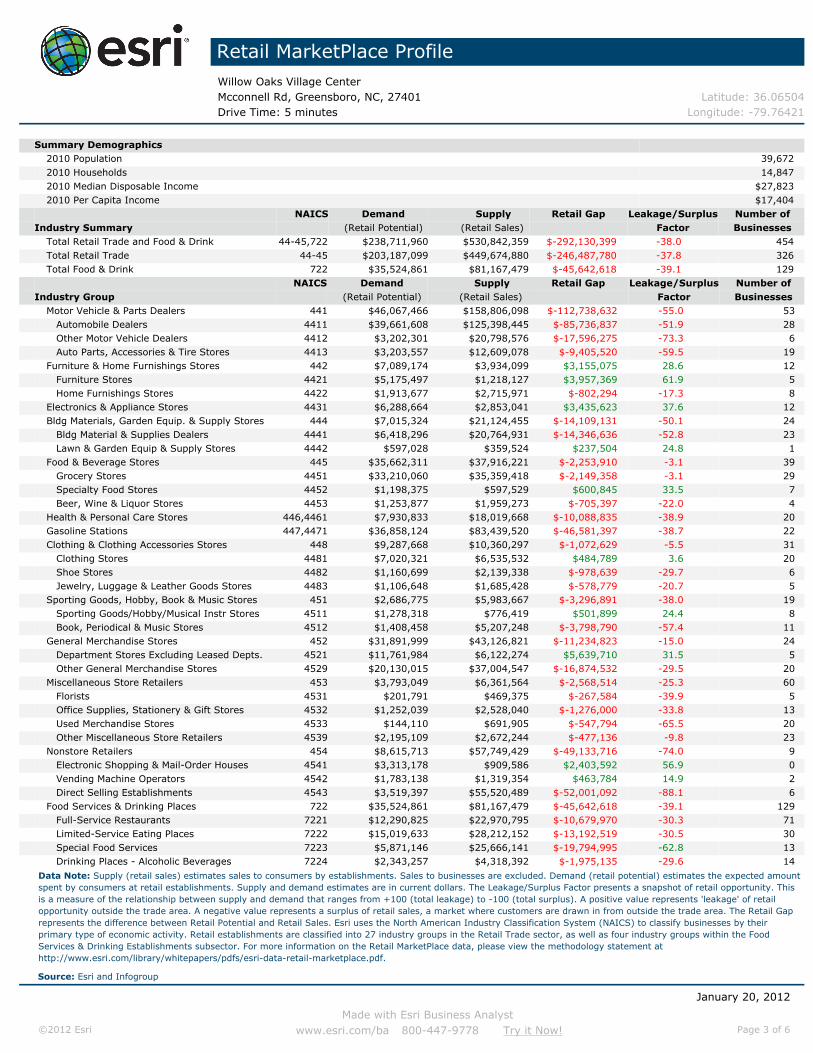
Retail MarketPlace ProfileWillow Oaks Village CenterMcconnell Rd, Greensboro, NC, 27401 Latitude: 36.06504Drive Time: 5 minutes Longitude: -79.76421
Summary Demographics2010 Population 39,6722010 Households 14,8472010 Median Disposable Income $27,8232010 Per Capita Income $17,404
NAICS Demand Supply Retail Gap Leakage/Surplus Number ofIndustry Summary (Retail Potential) (Retail Sales) Factor Businesses
Total Retail Trade and Food & Drink 44-45,722 $238,711,960 $530,842,359 $-292,130,399 -38.0 454Total Retail Trade 44-45 $203,187,099 $449,674,880 $-246,487,780 -37.8 326Total Food & Drink 722 $35,524,861 $81,167,479 $-45,642,618 -39.1 129
NAICS Demand Supply Retail Gap Leakage/Surplus Number ofIndustry Group (Retail Potential) (Retail Sales) Factor Businesses
Motor Vehicle & Parts Dealers 441 $46,067,466 $158,806,098 $-112,738,632 -55.0 53 Automobile Dealers 4411 $39,661,608 $125,398,445 $-85,736,837 -51.9 28 Other Motor Vehicle Dealers 4412 $3,202,301 $20,798,576 $-17,596,275 -73.3 6 Auto Parts, Accessories & Tire Stores 4413 $3,203,557 $12,609,078 $-9,405,520 -59.5 19Furniture & Home Furnishings Stores 442 $7,089,174 $3,934,099 $3,155,075 28.6 12 Furniture Stores 4421 $5,175,497 $1,218,127 $3,957,369 61.9 5 Home Furnishings Stores 4422 $1,913,677 $2,715,971 $-802,294 -17.3 8Electronics & Appliance Stores 4431 $6,288,664 $2,853,041 $3,435,623 37.6 12Bldg Materials, Garden Equip. & Supply Stores 444 $7,015,324 $21,124,455 $-14,109,131 -50.1 24 Bldg Material & Supplies Dealers 4441 $6,418,296 $20,764,931 $-14,346,636 -52.8 23 Lawn & Garden Equip & Supply Stores 4442 $597,028 $359,524 $237,504 24.8 1Food & Beverage Stores 445 $35,662,311 $37,916,221 $-2,253,910 -3.1 39 Grocery Stores 4451 $33,210,060 $35,359,418 $-2,149,358 -3.1 29 Specialty Food Stores 4452 $1,198,375 $597,529 $600,845 33.5 7 Beer, Wine & Liquor Stores 4453 $1,253,877 $1,959,273 $-705,397 -22.0 4Health & Personal Care Stores 446,4461 $7,930,833 $18,019,668 $-10,088,835 -38.9 20Gasoline Stations 447,4471 $36,858,124 $83,439,520 $-46,581,397 -38.7 22Clothing & Clothing Accessories Stores 448 $9,287,668 $10,360,297 $-1,072,629 -5.5 31 Clothing Stores 4481 $7,020,321 $6,535,532 $484,789 3.6 20 Shoe Stores 4482 $1,160,699 $2,139,338 $-978,639 -29.7 6 Jewelry, Luggage & Leather Goods Stores 4483 $1,106,648 $1,685,428 $-578,779 -20.7 5Sporting Goods, Hobby, Book & Music Stores 451 $2,686,775 $5,983,667 $-3,296,891 -38.0 19 Sporting Goods/Hobby/Musical Instr Stores 4511 $1,278,318 $776,419 $501,899 24.4 8 Book, Periodical & Music Stores 4512 $1,408,458 $5,207,248 $-3,798,790 -57.4 11General Merchandise Stores 452 $31,891,999 $43,126,821 $-11,234,823 -15.0 24 Department Stores Excluding Leased Depts. 4521 $11,761,984 $6,122,274 $5,639,710 31.5 5 Other General Merchandise Stores 4529 $20,130,015 $37,004,547 $-16,874,532 -29.5 20Miscellaneous Store Retailers 453 $3,793,049 $6,361,564 $-2,568,514 -25.3 60 Florists 4531 $201,791 $469,375 $-267,584 -39.9 5 Office Supplies, Stationery & Gift Stores 4532 $1,252,039 $2,528,040 $-1,276,000 -33.8 13 Used Merchandise Stores 4533 $144,110 $691,905 $-547,794 -65.5 20 Other Miscellaneous Store Retailers 4539 $2,195,109 $2,672,244 $-477,136 -9.8 23Nonstore Retailers 454 $8,615,713 $57,749,429 $-49,133,716 -74.0 9 Electronic Shopping & Mail-Order Houses 4541 $3,313,178 $909,586 $2,403,592 56.9 0 Vending Machine Operators 4542 $1,783,138 $1,319,354 $463,784 14.9 2 Direct Selling Establishments 4543 $3,519,397 $55,520,489 $-52,001,092 -88.1 6Food Services & Drinking Places 722 $35,524,861 $81,167,479 $-45,642,618 -39.1 129 Full-Service Restaurants 7221 $12,290,825 $22,970,795 $-10,679,970 -30.3 71 Limited-Service Eating Places 7222 $15,019,633 $28,212,152 $-13,192,519 -30.5 30 Special Food Services 7223 $5,871,146 $25,666,141 $-19,794,995 -62.8 13 Drinking Places - Alcoholic Beverages 7224 $2,343,257 $4,318,392 $-1,975,135 -29.6 14
Data Note: Supply (retail sales) estimates sales to consumers by establishments. Sales to businesses are excluded. Demand (retail potential) estimates the expected amountspent by consumers at retail establishments. Supply and demand estimates are in current dollars. The Leakage/Surplus Factor presents a snapshot of retail opportunity. Thisis a measure of the relationship between supply and demand that ranges from +100 (total leakage) to -100 (total surplus). A positive value represents 'leakage' of retailopportunity outside the trade area. A negative value represents a surplus of retail sales, a market where customers are drawn in from outside the trade area. The Retail Gaprepresents the difference between Retail Potential and Retail Sales. Esri uses the North American Industry Classification System (NAICS) to classify businesses by theirprimary type of economic activity. Retail establishments are classified into 27 industry groups in the Retail Trade sector, as well as four industry groups within the FoodServices & Drinking Establishments subsector. For more information on the Retail MarketPlace data, please view the methodology statement athttp://www.esri.com/library/whitepapers/pdfs/esri-data-retail-marketplace.pdf.
January 20, 2012
Made with Esri Business Analyst©2012 Esri www.esri.com/ba 800-447-9778 Try it Now! Page 3 of 6
Source: Esri and Infogroup

Retail MarketPlace ProfileWillow Oaks Village CenterMcconnell Rd, Greensboro, NC, 27401 Latitude: 36.06504Drive Time: 5 minutes Longitude: -79.76421
Leakage/Surplus Factor by Industry Subsector
Leakage/Surplus Factor3020100-10-20-30-40-50-60-70
Food Services & Drinking Places
Nonstore Retailers
Miscellaneous Store Retailers
General Merchandise Stores
Sporting Goods, Hobby, Book, and Music Stores
Clothing and Clothing Accessories Stores
Gasoline Stations
Health & Personal Care Stores
Food & Beverage Stores
Bldg Materials, Garden Equip. & Supply Stores
Electronics & Appliance Stores
Furniture & Home Furnishings Stores
Motor Vehicle & Parts Dealers
Leakage/Surplus Factor by Industry Group
Leakage/Surplus Factor6050403020100-10-20-30-40-50-60-70-80
Drinking Places (Alcoholic Beverages)
Special Food Services
Limited-Service Eating Places
Full-Service Restaurants
Direct Selling Establishments
Vending Machine Operators
Electronic Shopping and Mail-Order Houses
Other Miscellaneous Store Retailers
Used Merchandise Stores
Office Supplies, Stationery, and Gift Stores
Florists
Other General Merchandise Stores
Department Stores (Excluding Leased Depts.)
Book, Periodical, and Music Stores
Jewelry, Luggage, and Leather Goods Stores
Shoe Stores
Clothing Stores
Gasoline Stations
Health & Personal Care Stores
Beer, Wine, and Liquor Stores
Specialty Food Stores
Grocery Stores
Lawn and Garden Equipment and Supplies Stores
Building Material and Supplies Dealers
Electronics & Appliance Stores
Home Furnishings Stores
Furniture Stores
Auto Parts, Accessories, and Tire Stores
Other Motor Vehicle Dealers
Automobile Dealers
January 20, 2012
Made with Esri Business Analyst©2012 Esri www.esri.com/ba 800-447-9778 Try it Now! Page 4 of 6
Source: Esri and Infogroup
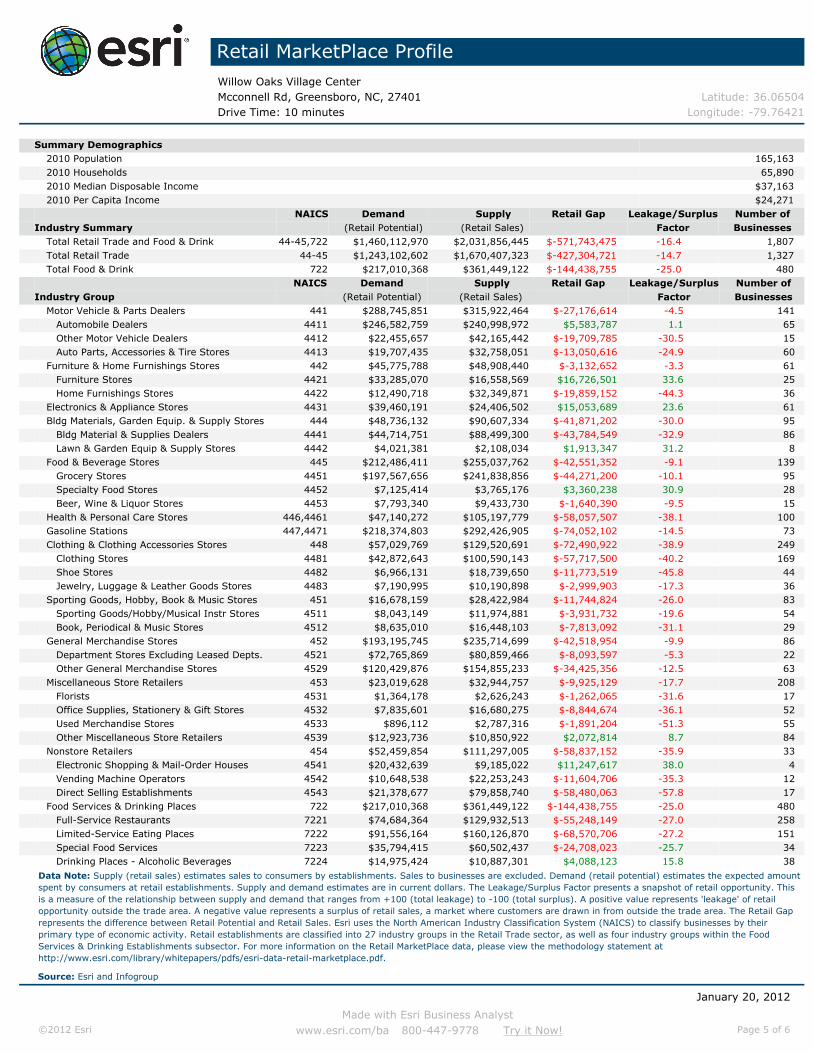
Retail MarketPlace ProfileWillow Oaks Village CenterMcconnell Rd, Greensboro, NC, 27401 Latitude: 36.06504Drive Time: 10 minutes Longitude: -79.76421
Summary Demographics2010 Population 165,1632010 Households 65,8902010 Median Disposable Income $37,1632010 Per Capita Income $24,271
NAICS Demand Supply Retail Gap Leakage/Surplus Number ofIndustry Summary (Retail Potential) (Retail Sales) Factor Businesses
Total Retail Trade and Food & Drink 44-45,722 $1,460,112,970 $2,031,856,445 $-571,743,475 -16.4 1,807Total Retail Trade 44-45 $1,243,102,602 $1,670,407,323 $-427,304,721 -14.7 1,327Total Food & Drink 722 $217,010,368 $361,449,122 $-144,438,755 -25.0 480
NAICS Demand Supply Retail Gap Leakage/Surplus Number ofIndustry Group (Retail Potential) (Retail Sales) Factor Businesses
Motor Vehicle & Parts Dealers 441 $288,745,851 $315,922,464 $-27,176,614 -4.5 141 Automobile Dealers 4411 $246,582,759 $240,998,972 $5,583,787 1.1 65 Other Motor Vehicle Dealers 4412 $22,455,657 $42,165,442 $-19,709,785 -30.5 15 Auto Parts, Accessories & Tire Stores 4413 $19,707,435 $32,758,051 $-13,050,616 -24.9 60Furniture & Home Furnishings Stores 442 $45,775,788 $48,908,440 $-3,132,652 -3.3 61 Furniture Stores 4421 $33,285,070 $16,558,569 $16,726,501 33.6 25 Home Furnishings Stores 4422 $12,490,718 $32,349,871 $-19,859,152 -44.3 36Electronics & Appliance Stores 4431 $39,460,191 $24,406,502 $15,053,689 23.6 61Bldg Materials, Garden Equip. & Supply Stores 444 $48,736,132 $90,607,334 $-41,871,202 -30.0 95 Bldg Material & Supplies Dealers 4441 $44,714,751 $88,499,300 $-43,784,549 -32.9 86 Lawn & Garden Equip & Supply Stores 4442 $4,021,381 $2,108,034 $1,913,347 31.2 8Food & Beverage Stores 445 $212,486,411 $255,037,762 $-42,551,352 -9.1 139 Grocery Stores 4451 $197,567,656 $241,838,856 $-44,271,200 -10.1 95 Specialty Food Stores 4452 $7,125,414 $3,765,176 $3,360,238 30.9 28 Beer, Wine & Liquor Stores 4453 $7,793,340 $9,433,730 $-1,640,390 -9.5 15Health & Personal Care Stores 446,4461 $47,140,272 $105,197,779 $-58,057,507 -38.1 100Gasoline Stations 447,4471 $218,374,803 $292,426,905 $-74,052,102 -14.5 73Clothing & Clothing Accessories Stores 448 $57,029,769 $129,520,691 $-72,490,922 -38.9 249 Clothing Stores 4481 $42,872,643 $100,590,143 $-57,717,500 -40.2 169 Shoe Stores 4482 $6,966,131 $18,739,650 $-11,773,519 -45.8 44 Jewelry, Luggage & Leather Goods Stores 4483 $7,190,995 $10,190,898 $-2,999,903 -17.3 36Sporting Goods, Hobby, Book & Music Stores 451 $16,678,159 $28,422,984 $-11,744,824 -26.0 83 Sporting Goods/Hobby/Musical Instr Stores 4511 $8,043,149 $11,974,881 $-3,931,732 -19.6 54 Book, Periodical & Music Stores 4512 $8,635,010 $16,448,103 $-7,813,092 -31.1 29General Merchandise Stores 452 $193,195,745 $235,714,699 $-42,518,954 -9.9 86 Department Stores Excluding Leased Depts. 4521 $72,765,869 $80,859,466 $-8,093,597 -5.3 22 Other General Merchandise Stores 4529 $120,429,876 $154,855,233 $-34,425,356 -12.5 63Miscellaneous Store Retailers 453 $23,019,628 $32,944,757 $-9,925,129 -17.7 208 Florists 4531 $1,364,178 $2,626,243 $-1,262,065 -31.6 17 Office Supplies, Stationery & Gift Stores 4532 $7,835,601 $16,680,275 $-8,844,674 -36.1 52 Used Merchandise Stores 4533 $896,112 $2,787,316 $-1,891,204 -51.3 55 Other Miscellaneous Store Retailers 4539 $12,923,736 $10,850,922 $2,072,814 8.7 84Nonstore Retailers 454 $52,459,854 $111,297,005 $-58,837,152 -35.9 33 Electronic Shopping & Mail-Order Houses 4541 $20,432,639 $9,185,022 $11,247,617 38.0 4 Vending Machine Operators 4542 $10,648,538 $22,253,243 $-11,604,706 -35.3 12 Direct Selling Establishments 4543 $21,378,677 $79,858,740 $-58,480,063 -57.8 17Food Services & Drinking Places 722 $217,010,368 $361,449,122 $-144,438,755 -25.0 480 Full-Service Restaurants 7221 $74,684,364 $129,932,513 $-55,248,149 -27.0 258 Limited-Service Eating Places 7222 $91,556,164 $160,126,870 $-68,570,706 -27.2 151 Special Food Services 7223 $35,794,415 $60,502,437 $-24,708,023 -25.7 34 Drinking Places - Alcoholic Beverages 7224 $14,975,424 $10,887,301 $4,088,123 15.8 38
Data Note: Supply (retail sales) estimates sales to consumers by establishments. Sales to businesses are excluded. Demand (retail potential) estimates the expected amountspent by consumers at retail establishments. Supply and demand estimates are in current dollars. The Leakage/Surplus Factor presents a snapshot of retail opportunity. Thisis a measure of the relationship between supply and demand that ranges from +100 (total leakage) to -100 (total surplus). A positive value represents 'leakage' of retailopportunity outside the trade area. A negative value represents a surplus of retail sales, a market where customers are drawn in from outside the trade area. The Retail Gaprepresents the difference between Retail Potential and Retail Sales. Esri uses the North American Industry Classification System (NAICS) to classify businesses by theirprimary type of economic activity. Retail establishments are classified into 27 industry groups in the Retail Trade sector, as well as four industry groups within the FoodServices & Drinking Establishments subsector. For more information on the Retail MarketPlace data, please view the methodology statement athttp://www.esri.com/library/whitepapers/pdfs/esri-data-retail-marketplace.pdf.
January 20, 2012
Made with Esri Business Analyst©2012 Esri www.esri.com/ba 800-447-9778 Try it Now! Page 5 of 6
Source: Esri and Infogroup

Retail MarketPlace ProfileWillow Oaks Village CenterMcconnell Rd, Greensboro, NC, 27401 Latitude: 36.06504Drive Time: 10 minutes Longitude: -79.76421
Leakage/Surplus Factor by Industry Subsector
Leakage/Surplus Factor20151050-5-10-15-20-25-30-35
Food Services & Drinking Places
Nonstore Retailers
Miscellaneous Store Retailers
General Merchandise Stores
Sporting Goods, Hobby, Book, and Music Stores
Clothing and Clothing Accessories Stores
Gasoline Stations
Health & Personal Care Stores
Food & Beverage Stores
Bldg Materials, Garden Equip. & Supply Stores
Electronics & Appliance Stores
Furniture & Home Furnishings Stores
Motor Vehicle & Parts Dealers
Leakage/Surplus Factor by Industry Group
Leakage/Surplus Factor35302520151050-5-10-15-20-25-30-35-40-45-50-55
Drinking Places (Alcoholic Beverages)
Special Food Services
Limited-Service Eating Places
Full-Service Restaurants
Direct Selling Establishments
Vending Machine Operators
Electronic Shopping and Mail-Order Houses
Other Miscellaneous Store Retailers
Used Merchandise Stores
Office Supplies, Stationery, and Gift Stores
Florists
Other General Merchandise Stores
Department Stores (Excluding Leased Depts.)
Book, Periodical, and Music Stores
Jewelry, Luggage, and Leather Goods Stores
Shoe Stores
Clothing Stores
Gasoline Stations
Health & Personal Care Stores
Beer, Wine, and Liquor Stores
Specialty Food Stores
Grocery Stores
Lawn and Garden Equipment and Supplies Stores
Building Material and Supplies Dealers
Electronics & Appliance Stores
Home Furnishings Stores
Furniture Stores
Auto Parts, Accessories, and Tire Stores
Other Motor Vehicle Dealers
Automobile Dealers
January 20, 2012
Made with Esri Business Analyst©2012 Esri www.esri.com/ba 800-447-9778 Try it Now! Page 6 of 6
Source: Esri and Infogroup
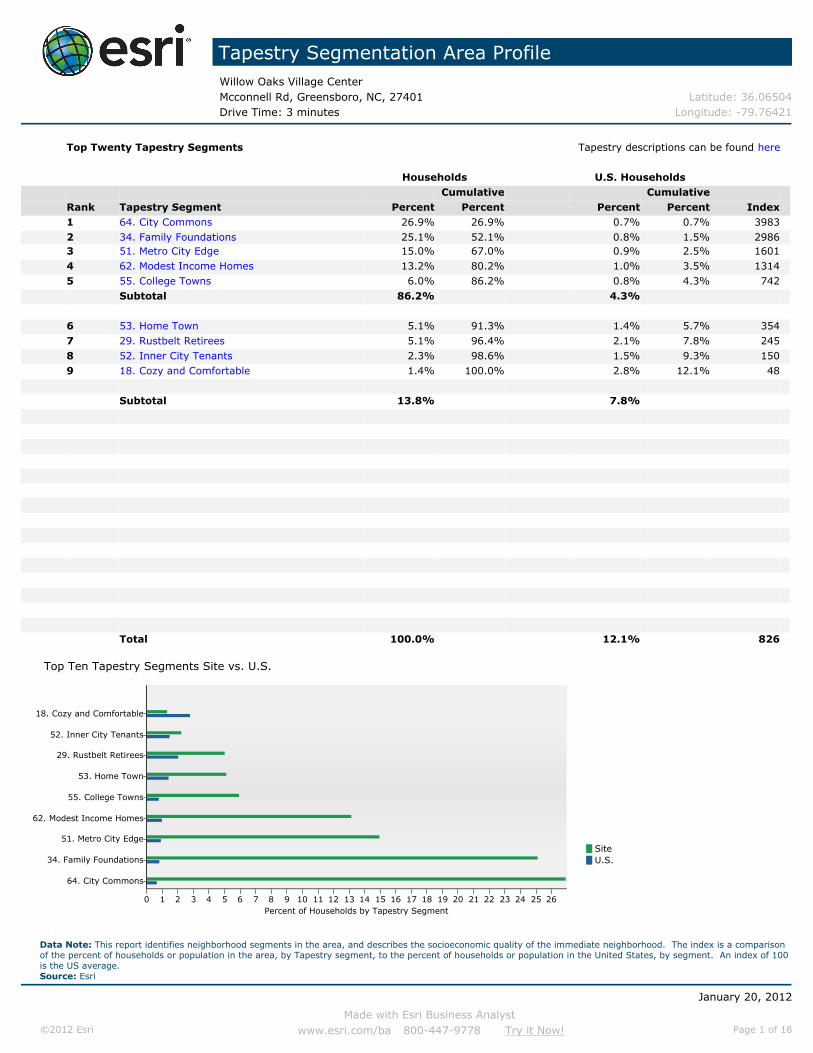
Tapestry Segmentation Area ProfileWillow Oaks Village CenterMcconnell Rd, Greensboro, NC, 27401 Latitude: 36.06504Drive Time: 3 minutes Longitude: -79.76421
Top Twenty Tapestry Segments Tapestry descriptions can be found here
Households U.S. HouseholdsCumulative Cumulative
Rank Tapestry Segment Percent Percent Percent Percent Index1 64. City Commons 26.9% 26.9% 0.7% 0.7% 39832 34. Family Foundations 25.1% 52.1% 0.8% 1.5% 29863 51. Metro City Edge 15.0% 67.0% 0.9% 2.5% 16014 62. Modest Income Homes 13.2% 80.2% 1.0% 3.5% 13145 55. College Towns 6.0% 86.2% 0.8% 4.3% 742
Subtotal 86.2% 4.3%
6 53. Home Town 5.1% 91.3% 1.4% 5.7% 3547 29. Rustbelt Retirees 5.1% 96.4% 2.1% 7.8% 2458 52. Inner City Tenants 2.3% 98.6% 1.5% 9.3% 1509 18. Cozy and Comfortable 1.4% 100.0% 2.8% 12.1% 48
Subtotal 13.8% 7.8%
Total 100.0% 12.1% 826
SiteU.S.
Top Ten Tapestry Segments Site vs. U.S.
Percent of Households by Tapestry Segment26252423222120191817161514131211109876543210
64. City Commons
34. Family Foundations
51. Metro City Edge
62. Modest Income Homes
55. College Towns
53. Home Town
29. Rustbelt Retirees
52. Inner City Tenants
18. Cozy and Comfortable
January 20, 2012
Made with Esri Business Analyst©2012 Esri www.esri.com/ba 800-447-9778 Try it Now! Page 1 of 18
Data Note: This report identifies neighborhood segments in the area, and describes the socioeconomic quality of the immediate neighborhood. The index is a comparisonof the percent of households or population in the area, by Tapestry segment, to the percent of households or population in the United States, by segment. An index of 100is the US average.Source: Esri

Tapestry Segmentation Area ProfileWillow Oaks Village CenterMcconnell Rd, Greensboro, NC, 27401 Latitude: 36.06504Drive Time: 3 minutes Longitude: -79.76421
Tapestry Indexes by Households
Index3,5003,0002,5002,0001,5001,0005000
Tap
estr
y Seg
men
ts
01
03
05
07
09
11
13
15
17
19
21
23
25
27
29
31
33
35
37
39
41
43
45
47
49
51
53
55
57
59
61
63
65
Tapestry Indexes by Population
Index3,5003,0002,5002,0001,5001,0005000
Tap
estr
y Seg
men
ts
01
03
05
07
09
11
13
15
17
19
21
23
25
27
29
31
33
35
37
39
41
43
45
47
49
51
53
55
57
59
61
63
65
January 20, 2012
Made with Esri Business Analyst©2012 Esri www.esri.com/ba 800-447-9778 Try it Now! Page 2 of 18
Data Note: This report identifies neighborhood segments in the area, and describes the socioeconomic quality of the immediate neighborhood. The index is a comparisonof the percent of households or population in the area, by Tapestry segment, to the percent of households or population in the United States, by segment. An index of 100is the US average.Source: Esri

Tapestry Segmentation Area ProfileWillow Oaks Village CenterMcconnell Rd, Greensboro, NC, 27401 Latitude: 36.06504Drive Time: 3 minutes Longitude: -79.76421
Tapestry LifeMode Groups 2010 Households 2010 PopulationNumber Percent Index Number Percent Index
Total: 5,002 100.0% 15,670 100.0%
L1. High Society 0 0.0% 0 0 0.0% 001 Top Rung 0 0.0% 0 0 0.0% 002 Suburban Splendor 0 0.0% 0 0 0.0% 003 Connoisseurs 0 0.0% 0 0 0.0% 004 Boomburbs 0 0.0% 0 0 0.0% 0
05 Wealthy Seaboard Suburbs 0 0.0% 0 0 0.0% 006 Sophisticated Squires 0 0.0% 0 0 0.0% 007 Exurbanites 0 0.0% 0 0 0.0% 0
L2. Upscale Avenues 68 1.4% 10 188 1.2% 909 Urban Chic 0 0.0% 0 0 0.0% 010 Pleasant-Ville 0 0.0% 0 0 0.0% 011 Pacific Heights 0 0.0% 0 0 0.0% 013 In Style 0 0.0% 0 0 0.0% 016 Enterprising Professionals 0 0.0% 0 0 0.0% 017 Green Acres 0 0.0% 0 0 0.0% 018 Cozy and Comfortable 68 1.4% 48 188 1.2% 43
L3. Metropolis 1,408 28.1% 537 3,305 21.1% 40320 City Lights 0 0.0% 0 0 0.0% 022 Metropolitans 0 0.0% 0 0 0.0% 045 City Strivers 0 0.0% 0 0 0.0% 051 Metro City Edge 749 15.0% 1601 1,668 10.6% 103854 Urban Rows 0 0.0% 0 0 0.0% 062 Modest Income Homes 659 13.2% 1314 1,637 10.4% 1034
L4. Solo Acts 0 0.0% 0 0 0.0% 008 Laptops and Lattes 0 0.0% 0 0 0.0% 023 Trendsetters 0 0.0% 0 0 0.0% 027 Metro Renters 0 0.0% 0 0 0.0% 036 Old and Newcomers 0 0.0% 0 0 0.0% 039 Young and Restless 0 0.0% 0 0 0.0% 0
L5. Senior Styles 253 5.1% 41 731 4.7% 4514 Prosperous Empty Nesters 0 0.0% 0 0 0.0% 015 Silver and Gold 0 0.0% 0 0 0.0% 029 Rustbelt Retirees 253 5.1% 245 731 4.7% 25130 Retirement Communities 0 0.0% 0 0 0.0% 043 The Elders 0 0.0% 0 0 0.0% 049 Senior Sun Seekers 0 0.0% 0 0 0.0% 050 Heartland Communities 0 0.0% 0 0 0.0% 057 Simple Living 0 0.0% 0 0 0.0% 065 Social Security Set 0 0.0% 0 0 0.0% 0
L6. Scholars & Patriots 299 6.0% 411 4,221 26.9% 149840 Military Proximity 0 0.0% 0 0 0.0% 055 College Towns 299 6.0% 742 4,221 26.9% 3578
63 Dorms to Diplomas 0 0.0% 0 0 0.0% 0
January 20, 2012
Made with Esri Business Analyst©2012 Esri www.esri.com/ba 800-447-9778 Try it Now! Page 3 of 18
Data Note: This report identifies neighborhood segments in the area, and describes the socioeconomic quality of the immediate neighborhood. The index is a comparisonof the percent of households or population in the area, by Tapestry segment, to the percent of households or population in the United States, by segment. An index of 100is the US average.Source: Esri
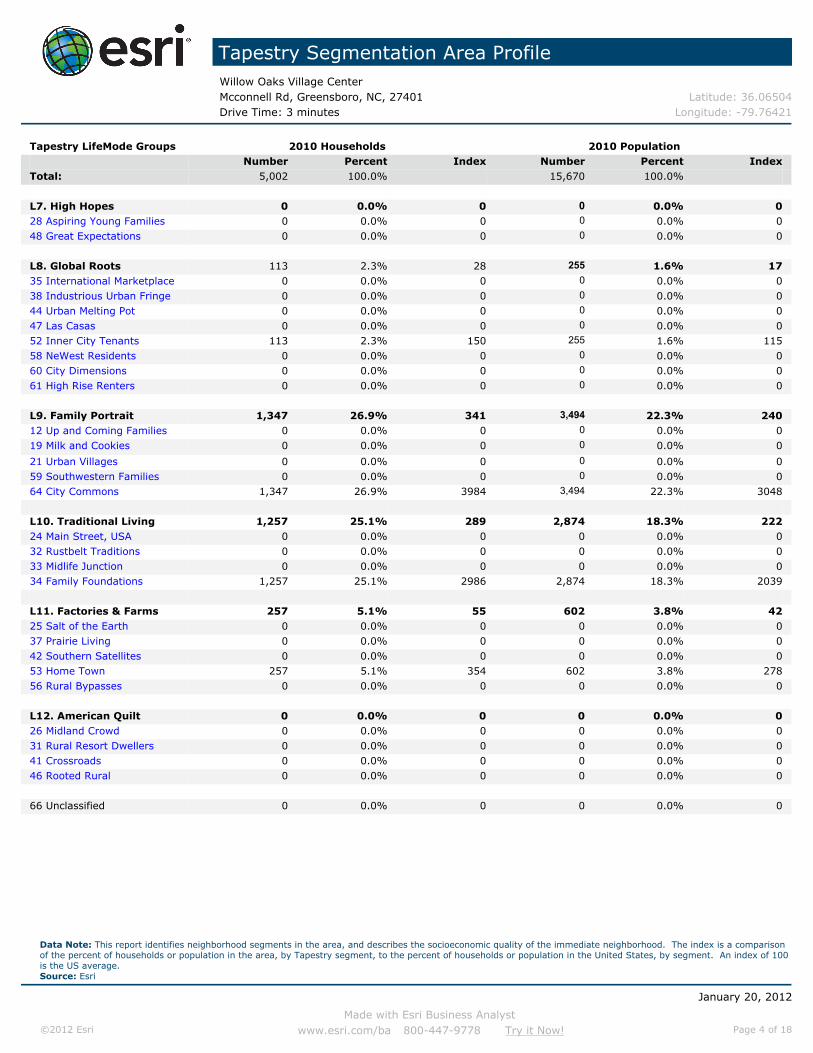
Tapestry Segmentation Area ProfileWillow Oaks Village CenterMcconnell Rd, Greensboro, NC, 27401 Latitude: 36.06504Drive Time: 3 minutes Longitude: -79.76421
Tapestry LifeMode Groups 2010 Households 2010 PopulationNumber Percent Index Number Percent Index
Total: 5,002 100.0% 15,670 100.0%
L7. High Hopes 0 0.0% 0 0 0.0% 028 Aspiring Young Families 0 0.0% 0 0 0.0% 048 Great Expectations 0 0.0% 0 0 0.0% 0
L8. Global Roots 113 2.3% 28 255 1.6% 1735 International Marketplace 0 0.0% 0 0 0.0% 038 Industrious Urban Fringe 0 0.0% 0 0 0.0% 044 Urban Melting Pot 0 0.0% 0 0 0.0% 047 Las Casas 0 0.0% 0 0 0.0% 052 Inner City Tenants 113 2.3% 150 255 1.6% 11558 NeWest Residents 0 0.0% 0 0 0.0% 060 City Dimensions 0 0.0% 0 0 0.0% 061 High Rise Renters 0 0.0% 0 0 0.0% 0
L9. Family Portrait 1,347 26.9% 341 3,494 22.3% 24012 Up and Coming Families 0 0.0% 0 0 0.0% 019 Milk and Cookies 0 0.0% 0 0 0.0% 0
21 Urban Villages 0 0.0% 0 0 0.0% 059 Southwestern Families 0 0.0% 0 0 0.0% 064 City Commons 1,347 26.9% 3984 3,494 22.3% 3048
L10. Traditional Living 1,257 25.1% 289 2,874 18.3% 22224 Main Street, USA 0 0.0% 0 0 0.0% 032 Rustbelt Traditions 0 0.0% 0 0 0.0% 033 Midlife Junction 0 0.0% 0 0 0.0% 034 Family Foundations 1,257 25.1% 2986 2,874 18.3% 2039
L11. Factories & Farms 257 5.1% 55 602 3.8% 4225 Salt of the Earth 0 0.0% 0 0 0.0% 037 Prairie Living 0 0.0% 0 0 0.0% 042 Southern Satellites 0 0.0% 0 0 0.0% 053 Home Town 257 5.1% 354 602 3.8% 27856 Rural Bypasses 0 0.0% 0 0 0.0% 0
L12. American Quilt 0 0.0% 0 0 0.0% 026 Midland Crowd 0 0.0% 0 0 0.0% 031 Rural Resort Dwellers 0 0.0% 0 0 0.0% 041 Crossroads 0 0.0% 0 0 0.0% 046 Rooted Rural 0 0.0% 0 0 0.0% 0
66 Unclassified 0 0.0% 0 0 0.0% 0
January 20, 2012
Made with Esri Business Analyst©2012 Esri www.esri.com/ba 800-447-9778 Try it Now! Page 4 of 18
Data Note: This report identifies neighborhood segments in the area, and describes the socioeconomic quality of the immediate neighborhood. The index is a comparisonof the percent of households or population in the area, by Tapestry segment, to the percent of households or population in the United States, by segment. An index of 100is the US average.Source: Esri

Tapestry Segmentation Area ProfileWillow Oaks Village CenterMcconnell Rd, Greensboro, NC, 27401 Latitude: 36.06504Drive Time: 3 minutes Longitude: -79.76421
Tapestry Urbanization Groups 2010 Households 2010 PopulationNumber Percent Index Number Percent Index
Total: 5,002 100.0% 15,670 100.0%
U1. Principal Urban Centers I 0 0.0% 0 0 0.0% 008 Laptops and Lattes 0 0.0% 0 0 0.0% 011 Pacific Heights 0 0.0% 0 0 0.0% 020 City Lights 0 0.0% 0 0 0.0% 021 Urban Villages 0 0.0% 0 0 0.0% 023 Trendsetters 0 0.0% 0 0 0.0% 027 Metro Renters 0 0.0% 0 0 0.0% 035 International Marketplace 0 0.0% 0 0 0.0% 044 Urban Melting Pot 0 0.0% 0 0 0.0% 0
U2. Principal Urban Centers II 1,347 26.9% 570 3,494 22.3% 40145 City Strivers 0 0.0% 0 0 0.0% 047 Las Casas 0 0.0% 0 0 0.0% 054 Urban Rows 0 0.0% 0 0 0.0% 058 NeWest Residents 0 0.0% 0 0 0.0% 061 High Rise Renters 0 0.0% 0 0 0.0% 064 City Commons 1,347 26.9% 3984 3,494 22.3% 3048
65 Social Security Set 0 0.0% 0 0 0.0% 0
U3. Metro Cities I 0 0.0% 0 0 0.0% 0
01 Top Rung 0 0.0% 0 0 0.0% 003 Connoisseurs 0 0.0% 0 0 0.0% 005 Wealthy Seaboard Suburbs 0 0.0% 0 0 0.0% 009 Urban Chic 0 0.0% 0 0 0.0% 010 Pleasant-Ville 0 0.0% 0 0 0.0% 016 Enterprising Professionals 0 0.0% 0 0 0.0% 019 Milk and Cookies 0 0.0% 0 0 0.0% 022 Metropolitans 0 0.0% 0 0 0.0% 0
U4. Metro Cities II 1,370 27.4% 253 3,129 20.0% 20228 Aspiring Young Families 0 0.0% 0 0 0.0% 030 Retirement Communities 0 0.0% 0 0 0.0% 034 Family Foundations 1,257 25.1% 2986 2,874 18.3% 2039
36 Old and Newcomers 0 0.0% 0 0 0.0% 039 Young and Restless 0 0.0% 0 0 0.0% 052 Inner City Tenants 113 2.3% 150 255 1.6% 11560 City Dimensions 0 0.0% 0 0 0.0% 063 Dorms to Diplomas 0 0.0% 0 0 0.0% 0
U5. Urban Outskirts I 0 0.0% 0 0 0.0% 004 Boomburbs 0 0.0% 0 0 0.0% 024 Main Street, USA 0 0.0% 0 0 0.0% 032 Rustbelt Traditions 0 0.0% 0 0 0.0% 038 Industrious Urban Fringe 0 0.0% 0 0 0.0% 048 Great Expectations 0 0.0% 0 0 0.0% 0
January 20, 2012
Made with Esri Business Analyst©2012 Esri www.esri.com/ba 800-447-9778 Try it Now! Page 5 of 18
Data Note: This report identifies neighborhood segments in the area, and describes the socioeconomic quality of the immediate neighborhood. The index is a comparisonof the percent of households or population in the area, by Tapestry segment, to the percent of households or population in the United States, by segment. An index of 100is the US average.Source: Esri

Tapestry Segmentation Area ProfileWillow Oaks Village CenterMcconnell Rd, Greensboro, NC, 27401 Latitude: 36.06504Drive Time: 3 minutes Longitude: -79.76421
Tapestry Urbanization Groups 2010 Households 2010 PopulationNumber Percent Index Number Percent Index
Total: 5,002 100.0% 15,670 100.0%
U6. Urban Outskirts II 1,707 34.1% 666 7,526 48.0% 91351 Metro City Edge 749 15.0% 1601 1,668 10.6% 103855 College Towns 299 6.0% 742 4,221 26.9% 357857 Simple Living 0 0.0% 0 0 0.0% 059 Southwestern Families 0 0.0% 0 0 0.0% 062 Modest Income Homes 659 13.2% 1314 1,637 10.4% 0
U7. Suburban Periphery I 0 0.0% 0 0 0.0% 002 Suburban Splendor 0 0.0% 0 0 0.0% 006 Sophisticated Squires 0 0.0% 0 0 0.0% 007 Exurbanites 0 0.0% 0 0 0.0% 012 Up and Coming Families 0 0.0% 0 0 0.0% 013 In Style 0 0.0% 0 0 0.0% 014 Prosperous Empty Nesters 0 0.0% 0 0 0.0% 015 Silver and Gold 0 0.0% 0 0 0.0% 0
U8. Suburban Periphery II 578 11.6% 120 1,521 9.7% 10818 Cozy and Comfortable 68 1.4% 48 188 1.2% 4329 Rustbelt Retirees 253 5.1% 245 731 4.7% 25133 Midlife Junction 0 0.0% 0 0 0.0% 040 Military Proximity 0 0.0% 0 0 0.0% 043 The Elders 0 0.0% 0 0 0.0% 053 Home Town 257 5.1% 354 602 3.8% 278
U9. Small Towns 0 0.0% 0 0 0.0% 041 Crossroads 0 0.0% 0 0 0.0% 049 Senior Sun Seekers 0 0.0% 0 0 0.0% 050 Heartland Communities 0 0.0% 0 0 0.0% 0
U10. Rural I 0 0.0% 0 0 0.0% 0
17 Green Acres 0 0.0% 0 0 0.0% 025 Salt of the Earth 0 0.0% 0 0 0.0% 026 Midland Crowd 0 0.0% 0 0 0.0% 031 Rural Resort Dwellers 0 0.0% 0 0 0.0% 0
U11. Rural II 0 0.0% 0 0 0.0% 037 Prairie Living 0 0.0% 0 0 0.0% 042 Southern Satellites 0 0.0% 0 0 0.0% 046 Rooted Rural 0 0.0% 0 0 0.0% 056 Rural Bypasses 0 0.0% 0 0 0.0% 0
66 Unclassified 0 0.0% 0 0 0.0% 0
January 20, 2012
Made with Esri Business Analyst©2012 Esri www.esri.com/ba 800-447-9778 Try it Now! Page 6 of 18
Data Note: This report identifies neighborhood segments in the area, and describes the socioeconomic quality of the immediate neighborhood. The index is a comparisonof the percent of households or population in the area, by Tapestry segment, to the percent of households or population in the United States, by segment. An index of 100is the US average.Source: Esri

Tapestry Segmentation Area ProfileWillow Oaks Village CenterMcconnell Rd, Greensboro, NC, 27401 Latitude: 36.06504Drive Time: 5 minutes Longitude: -79.76421
Top Twenty Tapestry Segments Tapestry descriptions can be found here
Households U.S. HouseholdsCumulative Cumulative
Rank Tapestry Segment Percent Percent Percent Percent Index1 51. Metro City Edge 18.8% 18.8% 0.9% 0.9% 20052 64. City Commons 17.3% 36.1% 0.7% 1.6% 25653 34. Family Foundations 16.6% 52.7% 0.8% 2.5% 19714 52. Inner City Tenants 7.4% 60.1% 1.5% 4.0% 4915 53. Home Town 6.6% 66.7% 1.4% 5.4% 453
Subtotal 66.7% 5.4%
6 55. College Towns 5.9% 72.6% 0.8% 6.2% 7377 60. City Dimensions 5.5% 78.1% 0.9% 7.1% 6328 62. Modest Income Homes 4.9% 82.9% 1.0% 8.1% 4849 65. Social Security Set 4.2% 87.2% 0.6% 8.7% 65310 36. Old and Newcomers 4.1% 91.3% 1.9% 10.7% 213
Subtotal 24.7% 5.3%
11 48. Great Expectations 2.4% 93.7% 1.7% 12.4% 13612 50. Heartland Communities 2.3% 96.0% 2.1% 14.5% 10913 29. Rustbelt Retirees 1.9% 97.9% 2.1% 16.6% 9314 18. Cozy and Comfortable 1.2% 99.1% 2.8% 19.4% 4315 57. Simple Living 0.4% 99.6% 1.4% 20.8% 32
Subtotal 8.3% 10.1%
16 22. Metropolitans 0.3% 99.9% 1.2% 22.0% 2817 41. Crossroads 0.1% 100.0% 1.5% 23.5% 518 28. Aspiring Young Families 0.0% 100.0% 2.4% 25.9% 0
Subtotal 0.4% 5.1%
Total 100.0% 25.9% 386
SiteU.S.
Top Ten Tapestry Segments Site vs. U.S.
Percent of Households by Tapestry Segment1817161514131211109876543210
51. Metro City Edge
64. City Commons
34. Family Foundations
52. Inner City Tenants
53. Home Town
55. College Towns
60. City Dimensions
62. Modest Income Homes
65. Social Security Set
36. Old and Newcomers
January 20, 2012
Made with Esri Business Analyst©2012 Esri www.esri.com/ba 800-447-9778 Try it Now! Page 7 of 18
Data Note: This report identifies neighborhood segments in the area, and describes the socioeconomic quality of the immediate neighborhood. The index is a comparisonof the percent of households or population in the area, by Tapestry segment, to the percent of households or population in the United States, by segment. An index of 100is the US average.Source: Esri

Tapestry Segmentation Area ProfileWillow Oaks Village CenterMcconnell Rd, Greensboro, NC, 27401 Latitude: 36.06504Drive Time: 5 minutes Longitude: -79.76421
Tapestry Indexes by Households
Index2,5002,0001,5001,0005000
Tap
estr
y Seg
men
ts
01
03
05
07
09
11
13
15
17
19
21
23
25
27
29
31
33
35
37
39
41
43
45
47
49
51
53
55
57
59
61
63
65
Tapestry Indexes by Population
Index2,0001,5001,0005000
Tap
estr
y Seg
men
ts
01
03
05
07
09
11
13
15
17
19
21
23
25
27
29
31
33
35
37
39
41
43
45
47
49
51
53
55
57
59
61
63
65
January 20, 2012
Made with Esri Business Analyst©2012 Esri www.esri.com/ba 800-447-9778 Try it Now! Page 8 of 18
Data Note: This report identifies neighborhood segments in the area, and describes the socioeconomic quality of the immediate neighborhood. The index is a comparisonof the percent of households or population in the area, by Tapestry segment, to the percent of households or population in the United States, by segment. An index of 100is the US average.Source: Esri

Tapestry Segmentation Area ProfileWillow Oaks Village CenterMcconnell Rd, Greensboro, NC, 27401 Latitude: 36.06504Drive Time: 5 minutes Longitude: -79.76421
Tapestry LifeMode Groups 2010 Households 2010 PopulationNumber Percent Index Number Percent Index
Total: 14,846 100.0% 39,670 100.0%
L1. High Society 0 0.0% 0 0 0.0% 001 Top Rung 0 0.0% 0 0 0.0% 002 Suburban Splendor 0 0.0% 0 0 0.0% 003 Connoisseurs 0 0.0% 0 0 0.0% 004 Boomburbs 0 0.0% 0 0 0.0% 0
05 Wealthy Seaboard Suburbs 0 0.0% 0 0 0.0% 006 Sophisticated Squires 0 0.0% 0 0 0.0% 007 Exurbanites 0 0.0% 0 0 0.0% 0
L2. Upscale Avenues 181 1.2% 9 494 1.2% 909 Urban Chic 0 0.0% 0 0 0.0% 010 Pleasant-Ville 0 0.0% 0 0 0.0% 011 Pacific Heights 0 0.0% 0 0 0.0% 013 In Style 0 0.0% 0 0 0.0% 016 Enterprising Professionals 0 0.0% 0 0 0.0% 017 Green Acres 0 0.0% 0 0 0.0% 018 Cozy and Comfortable 181 1.2% 43 494 1.2% 45
L3. Metropolis 3,555 23.9% 457 9,051 22.8% 43620 City Lights 0 0.0% 0 0 0.0% 022 Metropolitans 50 0.3% 28 108 0.3% 2845 City Strivers 0 0.0% 0 0 0.0% 051 Metro City Edge 2,784 18.8% 2005 7,164 18.1% 176154 Urban Rows 0 0.0% 0 0 0.0% 062 Modest Income Homes 721 4.9% 484 1,779 4.5% 444
L4. Solo Acts 616 4.1% 61 1,036 2.6% 5108 Laptops and Lattes 0 0.0% 0 0 0.0% 023 Trendsetters 0 0.0% 0 0 0.0% 027 Metro Renters 0 0.0% 0 0 0.0% 036 Old and Newcomers 616 4.1% 213 1,036 2.6% 17339 Young and Restless 0 0.0% 0 0 0.0% 0
L5. Senior Styles 1,324 8.9% 73 2,561 6.5% 6314 Prosperous Empty Nesters 0 0.0% 0 0 0.0% 015 Silver and Gold 0 0.0% 0 0 0.0% 029 Rustbelt Retirees 286 1.9% 93 805 2.0% 10930 Retirement Communities 0 0.0% 0 0 0.0% 043 The Elders 0 0.0% 0 0 0.0% 049 Senior Sun Seekers 0 0.0% 0 0 0.0% 050 Heartland Communities 342 2.3% 109 782 2.0% 10457 Simple Living 66 0.4% 32 188 0.5% 4165 Social Security Set 630 4.2% 654 786 2.0% 419
L6. Scholars & Patriots 881 5.9% 408 5,521 13.9% 77440 Military Proximity 0 0.0% 0 0 0.0% 055 College Towns 881 5.9% 737 5,521 13.9% 1849
63 Dorms to Diplomas 0 0.0% 0 0 0.0% 0
January 20, 2012
Made with Esri Business Analyst©2012 Esri www.esri.com/ba 800-447-9778 Try it Now! Page 9 of 18
Data Note: This report identifies neighborhood segments in the area, and describes the socioeconomic quality of the immediate neighborhood. The index is a comparisonof the percent of households or population in the area, by Tapestry segment, to the percent of households or population in the United States, by segment. An index of 100is the US average.Source: Esri

Tapestry Segmentation Area ProfileWillow Oaks Village CenterMcconnell Rd, Greensboro, NC, 27401 Latitude: 36.06504Drive Time: 5 minutes Longitude: -79.76421
Tapestry LifeMode Groups 2010 Households 2010 PopulationNumber Percent Index Number Percent Index
Total: 14,846 100.0% 39,670 100.0%
L7. High Hopes 351 2.4% 58 846 2.1% 5628 Aspiring Young Families 1 0.0% 0 7 0.0% 148 Great Expectations 350 2.4% 136 839 2.1% 136
L8. Global Roots 1,914 12.9% 158 4,638 11.7% 12035 International Marketplace 0 0.0% 0 0 0.0% 038 Industrious Urban Fringe 0 0.0% 0 0 0.0% 044 Urban Melting Pot 0 0.0% 0 0 0.0% 047 Las Casas 0 0.0% 0 0 0.0% 052 Inner City Tenants 1,102 7.4% 491 2,524 6.4% 44758 NeWest Residents 0 0.0% 0 0 0.0% 060 City Dimensions 812 5.5% 632 2,114 5.3% 59061 High Rise Renters 0 0.0% 0 0 0.0% 0
L9. Family Portrait 2,575 17.3% 220 6,926 17.5% 18812 Up and Coming Families 0 0.0% 0 0 0.0% 019 Milk and Cookies 0 0.0% 0 0 0.0% 0
21 Urban Villages 0 0.0% 0 0 0.0% 059 Southwestern Families 0 0.0% 0 0 0.0% 064 City Commons 2,575 17.3% 2565 6,926 17.5% 2386
L10. Traditional Living 2,462 16.6% 190 5,913 14.9% 18124 Main Street, USA 0 0.0% 0 0 0.0% 032 Rustbelt Traditions 0 0.0% 0 0 0.0% 033 Midlife Junction 0 0.0% 0 0 0.0% 034 Family Foundations 2,462 16.6% 1971 5,913 14.9% 1657
L11. Factories & Farms 976 6.6% 70 2,661 6.7% 7325 Salt of the Earth 0 0.0% 0 0 0.0% 037 Prairie Living 0 0.0% 0 0 0.0% 042 Southern Satellites 0 0.0% 0 0 0.0% 053 Home Town 976 6.6% 453 2,661 6.7% 48556 Rural Bypasses 0 0.0% 0 0 0.0% 0
L12. American Quilt 11 0.1% 1 23 0.1% 126 Midland Crowd 0 0.0% 0 0 0.0% 031 Rural Resort Dwellers 0 0.0% 0 0 0.0% 041 Crossroads 11 0.1% 5 23 0.1% 446 Rooted Rural 0 0.0% 0 0 0.0% 0
66 Unclassified 0 0.0% 0 0 0.0% 0
January 20, 2012
Made with Esri Business Analyst©2012 Esri www.esri.com/ba 800-447-9778 Try it Now! Page 10 of 18
Data Note: This report identifies neighborhood segments in the area, and describes the socioeconomic quality of the immediate neighborhood. The index is a comparisonof the percent of households or population in the area, by Tapestry segment, to the percent of households or population in the United States, by segment. An index of 100is the US average.Source: Esri

Tapestry Segmentation Area ProfileWillow Oaks Village CenterMcconnell Rd, Greensboro, NC, 27401 Latitude: 36.06504Drive Time: 5 minutes Longitude: -79.76421
Tapestry Urbanization Groups 2010 Households 2010 PopulationNumber Percent Index Number Percent Index
Total: 14,846 100.0% 39,670 100.0%
U1. Principal Urban Centers I 0 0.0% 0 0 0.0% 008 Laptops and Lattes 0 0.0% 0 0 0.0% 011 Pacific Heights 0 0.0% 0 0 0.0% 020 City Lights 0 0.0% 0 0 0.0% 021 Urban Villages 0 0.0% 0 0 0.0% 023 Trendsetters 0 0.0% 0 0 0.0% 027 Metro Renters 0 0.0% 0 0 0.0% 035 International Marketplace 0 0.0% 0 0 0.0% 044 Urban Melting Pot 0 0.0% 0 0 0.0% 0
U2. Principal Urban Centers II 3,205 21.6% 457 7,712 19.4% 34945 City Strivers 0 0.0% 0 0 0.0% 047 Las Casas 0 0.0% 0 0 0.0% 054 Urban Rows 0 0.0% 0 0 0.0% 058 NeWest Residents 0 0.0% 0 0 0.0% 061 High Rise Renters 0 0.0% 0 0 0.0% 064 City Commons 2,575 17.3% 2565 6,926 17.5% 2386
65 Social Security Set 630 4.2% 654 786 2.0% 419
U3. Metro Cities I 50 0.3% 3 108 0.3% 2
01 Top Rung 0 0.0% 0 0 0.0% 003 Connoisseurs 0 0.0% 0 0 0.0% 005 Wealthy Seaboard Suburbs 0 0.0% 0 0 0.0% 009 Urban Chic 0 0.0% 0 0 0.0% 010 Pleasant-Ville 0 0.0% 0 0 0.0% 016 Enterprising Professionals 0 0.0% 0 0 0.0% 019 Milk and Cookies 0 0.0% 0 0 0.0% 022 Metropolitans 50 0.3% 28 108 0.3% 28
U4. Metro Cities II 4,993 33.6% 310 11,594 29.2% 29628 Aspiring Young Families 1 0.0% 0 7 0.0% 130 Retirement Communities 0 0.0% 0 0 0.0% 034 Family Foundations 2,462 16.6% 1971 5,913 14.9% 1657
36 Old and Newcomers 616 4.1% 213 1,036 2.6% 17339 Young and Restless 0 0.0% 0 0 0.0% 052 Inner City Tenants 1,102 7.4% 491 2,524 6.4% 44760 City Dimensions 812 5.5% 632 2,114 5.3% 59063 Dorms to Diplomas 0 0.0% 0 0 0.0% 0
U5. Urban Outskirts I 350 2.4% 22 839 2.1% 1904 Boomburbs 0 0.0% 0 0 0.0% 024 Main Street, USA 0 0.0% 0 0 0.0% 032 Rustbelt Traditions 0 0.0% 0 0 0.0% 038 Industrious Urban Fringe 0 0.0% 0 0 0.0% 048 Great Expectations 350 2.4% 136 839 2.1% 136
January 20, 2012
Made with Esri Business Analyst©2012 Esri www.esri.com/ba 800-447-9778 Try it Now! Page 11 of 18
Data Note: This report identifies neighborhood segments in the area, and describes the socioeconomic quality of the immediate neighborhood. The index is a comparisonof the percent of households or population in the area, by Tapestry segment, to the percent of households or population in the United States, by segment. An index of 100is the US average.Source: Esri

Tapestry Segmentation Area ProfileWillow Oaks Village CenterMcconnell Rd, Greensboro, NC, 27401 Latitude: 36.06504Drive Time: 5 minutes Longitude: -79.76421
Tapestry Urbanization Groups 2010 Households 2010 PopulationNumber Percent Index Number Percent Index
Total: 14,846 100.0% 39,670 100.0%
U6. Urban Outskirts II 4,452 30.0% 585 14,652 36.9% 70251 Metro City Edge 2,784 18.8% 2005 7,164 18.1% 176155 College Towns 881 5.9% 737 5,521 13.9% 184957 Simple Living 66 0.4% 32 188 0.5% 4159 Southwestern Families 0 0.0% 0 0 0.0% 062 Modest Income Homes 721 4.9% 484 1,779 4.5% 0
U7. Suburban Periphery I 0 0.0% 0 0 0.0% 002 Suburban Splendor 0 0.0% 0 0 0.0% 006 Sophisticated Squires 0 0.0% 0 0 0.0% 007 Exurbanites 0 0.0% 0 0 0.0% 012 Up and Coming Families 0 0.0% 0 0 0.0% 013 In Style 0 0.0% 0 0 0.0% 014 Prosperous Empty Nesters 0 0.0% 0 0 0.0% 015 Silver and Gold 0 0.0% 0 0 0.0% 0
U8. Suburban Periphery II 1,443 9.7% 101 3,960 10.0% 11118 Cozy and Comfortable 181 1.2% 43 494 1.2% 4529 Rustbelt Retirees 286 1.9% 93 805 2.0% 10933 Midlife Junction 0 0.0% 0 0 0.0% 040 Military Proximity 0 0.0% 0 0 0.0% 043 The Elders 0 0.0% 0 0 0.0% 053 Home Town 976 6.6% 453 2,661 6.7% 485
U9. Small Towns 353 2.4% 49 805 2.0% 4541 Crossroads 11 0.1% 5 23 0.1% 449 Senior Sun Seekers 0 0.0% 0 0 0.0% 050 Heartland Communities 342 2.3% 109 782 2.0% 104
U10. Rural I 0 0.0% 0 0 0.0% 0
17 Green Acres 0 0.0% 0 0 0.0% 025 Salt of the Earth 0 0.0% 0 0 0.0% 026 Midland Crowd 0 0.0% 0 0 0.0% 031 Rural Resort Dwellers 0 0.0% 0 0 0.0% 0
U11. Rural II 0 0.0% 0 0 0.0% 037 Prairie Living 0 0.0% 0 0 0.0% 042 Southern Satellites 0 0.0% 0 0 0.0% 046 Rooted Rural 0 0.0% 0 0 0.0% 056 Rural Bypasses 0 0.0% 0 0 0.0% 0
66 Unclassified 0 0.0% 0 0 0.0% 0
January 20, 2012
Made with Esri Business Analyst©2012 Esri www.esri.com/ba 800-447-9778 Try it Now! Page 12 of 18
Data Note: This report identifies neighborhood segments in the area, and describes the socioeconomic quality of the immediate neighborhood. The index is a comparisonof the percent of households or population in the area, by Tapestry segment, to the percent of households or population in the United States, by segment. An index of 100is the US average.Source: Esri
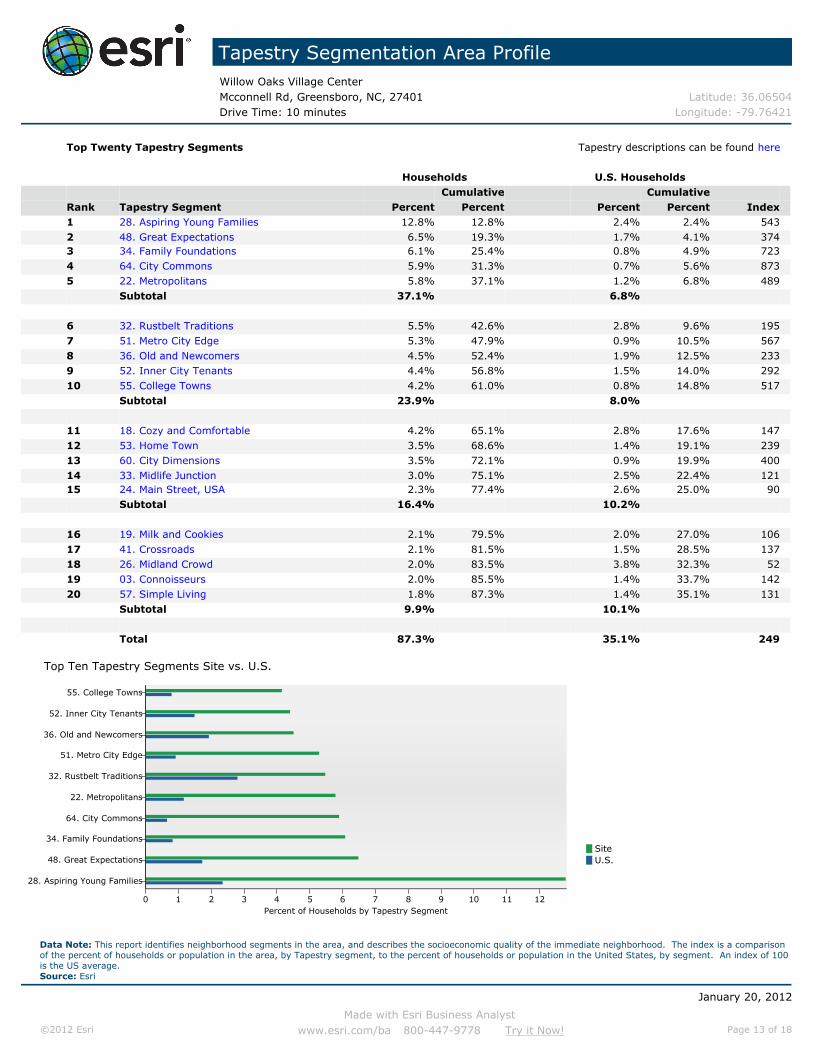
Tapestry Segmentation Area ProfileWillow Oaks Village CenterMcconnell Rd, Greensboro, NC, 27401 Latitude: 36.06504Drive Time: 10 minutes Longitude: -79.76421
Top Twenty Tapestry Segments Tapestry descriptions can be found here
Households U.S. HouseholdsCumulative Cumulative
Rank Tapestry Segment Percent Percent Percent Percent Index1 28. Aspiring Young Families 12.8% 12.8% 2.4% 2.4% 5432 48. Great Expectations 6.5% 19.3% 1.7% 4.1% 3743 34. Family Foundations 6.1% 25.4% 0.8% 4.9% 7234 64. City Commons 5.9% 31.3% 0.7% 5.6% 8735 22. Metropolitans 5.8% 37.1% 1.2% 6.8% 489
Subtotal 37.1% 6.8%
6 32. Rustbelt Traditions 5.5% 42.6% 2.8% 9.6% 1957 51. Metro City Edge 5.3% 47.9% 0.9% 10.5% 5678 36. Old and Newcomers 4.5% 52.4% 1.9% 12.5% 2339 52. Inner City Tenants 4.4% 56.8% 1.5% 14.0% 29210 55. College Towns 4.2% 61.0% 0.8% 14.8% 517
Subtotal 23.9% 8.0%
11 18. Cozy and Comfortable 4.2% 65.1% 2.8% 17.6% 14712 53. Home Town 3.5% 68.6% 1.4% 19.1% 23913 60. City Dimensions 3.5% 72.1% 0.9% 19.9% 40014 33. Midlife Junction 3.0% 75.1% 2.5% 22.4% 12115 24. Main Street, USA 2.3% 77.4% 2.6% 25.0% 90
Subtotal 16.4% 10.2%
16 19. Milk and Cookies 2.1% 79.5% 2.0% 27.0% 10617 41. Crossroads 2.1% 81.5% 1.5% 28.5% 13718 26. Midland Crowd 2.0% 83.5% 3.8% 32.3% 5219 03. Connoisseurs 2.0% 85.5% 1.4% 33.7% 14220 57. Simple Living 1.8% 87.3% 1.4% 35.1% 131
Subtotal 9.9% 10.1%
Total 87.3% 35.1% 249
SiteU.S.
Top Ten Tapestry Segments Site vs. U.S.
Percent of Households by Tapestry Segment1211109876543210
28. Aspiring Young Families
48. Great Expectations
34. Family Foundations
64. City Commons
22. Metropolitans
32. Rustbelt Traditions
51. Metro City Edge
36. Old and Newcomers
52. Inner City Tenants
55. College Towns
January 20, 2012
Made with Esri Business Analyst©2012 Esri www.esri.com/ba 800-447-9778 Try it Now! Page 13 of 18
Data Note: This report identifies neighborhood segments in the area, and describes the socioeconomic quality of the immediate neighborhood. The index is a comparisonof the percent of households or population in the area, by Tapestry segment, to the percent of households or population in the United States, by segment. An index of 100is the US average.Source: Esri

Tapestry Segmentation Area ProfileWillow Oaks Village CenterMcconnell Rd, Greensboro, NC, 27401 Latitude: 36.06504Drive Time: 10 minutes Longitude: -79.76421
Tapestry Indexes by Households
Index8007006005004003002001000
Tap
estr
y Seg
men
ts
01
03
05
07
09
11
13
15
17
19
21
23
25
27
29
31
33
35
37
39
41
43
45
47
49
51
53
55
57
59
61
63
65
Tapestry Indexes by Population
Index8007006005004003002001000
Tap
estr
y Seg
men
ts
01
03
05
07
09
11
13
15
17
19
21
23
25
27
29
31
33
35
37
39
41
43
45
47
49
51
53
55
57
59
61
63
65
January 20, 2012
Made with Esri Business Analyst©2012 Esri www.esri.com/ba 800-447-9778 Try it Now! Page 14 of 18
Data Note: This report identifies neighborhood segments in the area, and describes the socioeconomic quality of the immediate neighborhood. The index is a comparisonof the percent of households or population in the area, by Tapestry segment, to the percent of households or population in the United States, by segment. An index of 100is the US average.Source: Esri

Tapestry Segmentation Area ProfileWillow Oaks Village CenterMcconnell Rd, Greensboro, NC, 27401 Latitude: 36.06504Drive Time: 10 minutes Longitude: -79.76421
Tapestry LifeMode Groups 2010 Households 2010 PopulationNumber Percent Index Number Percent Index
Total: 65,888 100.0% 165,163 100.0%
L1. High Society 2,714 4.1% 32 6,610 4.0% 2901 Top Rung 610 0.9% 134 1,515 0.9% 12002 Suburban Splendor 0 0.0% 0 0 0.0% 003 Connoisseurs 1,294 2.0% 142 3,120 1.9% 13504 Boomburbs 0 0.0% 0 0 0.0% 0
05 Wealthy Seaboard Suburbs 0 0.0% 0 0 0.0% 006 Sophisticated Squires 0 0.0% 0 0 0.0% 007 Exurbanites 810 1.2% 49 1,975 1.2% 46
L2. Upscale Avenues 3,134 4.8% 34 8,080 4.9% 3609 Urban Chic 344 0.5% 39 828 0.5% 4110 Pleasant-Ville 0 0.0% 0 0 0.0% 011 Pacific Heights 0 0.0% 0 0 0.0% 013 In Style 33 0.1% 2 67 0.0% 216 Enterprising Professionals 0 0.0% 0 0 0.0% 017 Green Acres 21 0.0% 1 48 0.0% 118 Cozy and Comfortable 2,736 4.2% 147 7,137 4.3% 155
L3. Metropolis 8,242 12.5% 238 19,161 11.6% 22220 City Lights 0 0.0% 0 0 0.0% 022 Metropolitans 3,823 5.8% 489 7,735 4.7% 47345 City Strivers 0 0.0% 0 0 0.0% 051 Metro City Edge 3,495 5.3% 567 9,160 5.5% 54154 Urban Rows 0 0.0% 0 0 0.0% 062 Modest Income Homes 924 1.4% 140 2,266 1.4% 136
L4. Solo Acts 4,009 6.1% 89 7,588 4.6% 9008 Laptops and Lattes 0 0.0% 0 0 0.0% 023 Trendsetters 0 0.0% 0 0 0.0% 027 Metro Renters 0 0.0% 0 0 0.0% 036 Old and Newcomers 2,983 4.5% 233 5,549 3.4% 22339 Young and Restless 1,026 1.6% 109 2,039 1.2% 114
L5. Senior Styles 4,400 6.7% 54 9,439 5.7% 5514 Prosperous Empty Nesters 990 1.5% 82 2,139 1.3% 7715 Silver and Gold 0 0.0% 0 0 0.0% 029 Rustbelt Retirees 1,154 1.8% 85 2,674 1.6% 8730 Retirement Communities 0 0.0% 0 0 0.0% 043 The Elders 0 0.0% 0 0 0.0% 049 Senior Sun Seekers 0 0.0% 0 0 0.0% 050 Heartland Communities 412 0.6% 30 968 0.6% 3157 Simple Living 1,214 1.8% 131 2,872 1.7% 15065 Social Security Set 630 1.0% 147 786 0.5% 101
L6. Scholars & Patriots 3,347 5.1% 350 13,911 8.4% 46840 Military Proximity 0 0.0% 0 0 0.0% 055 College Towns 2,743 4.2% 517 9,494 5.7% 763
63 Dorms to Diplomas 604 0.9% 204 4,417 2.7% 400
January 20, 2012
Made with Esri Business Analyst©2012 Esri www.esri.com/ba 800-447-9778 Try it Now! Page 15 of 18
Data Note: This report identifies neighborhood segments in the area, and describes the socioeconomic quality of the immediate neighborhood. The index is a comparisonof the percent of households or population in the area, by Tapestry segment, to the percent of households or population in the United States, by segment. An index of 100is the US average.Source: Esri
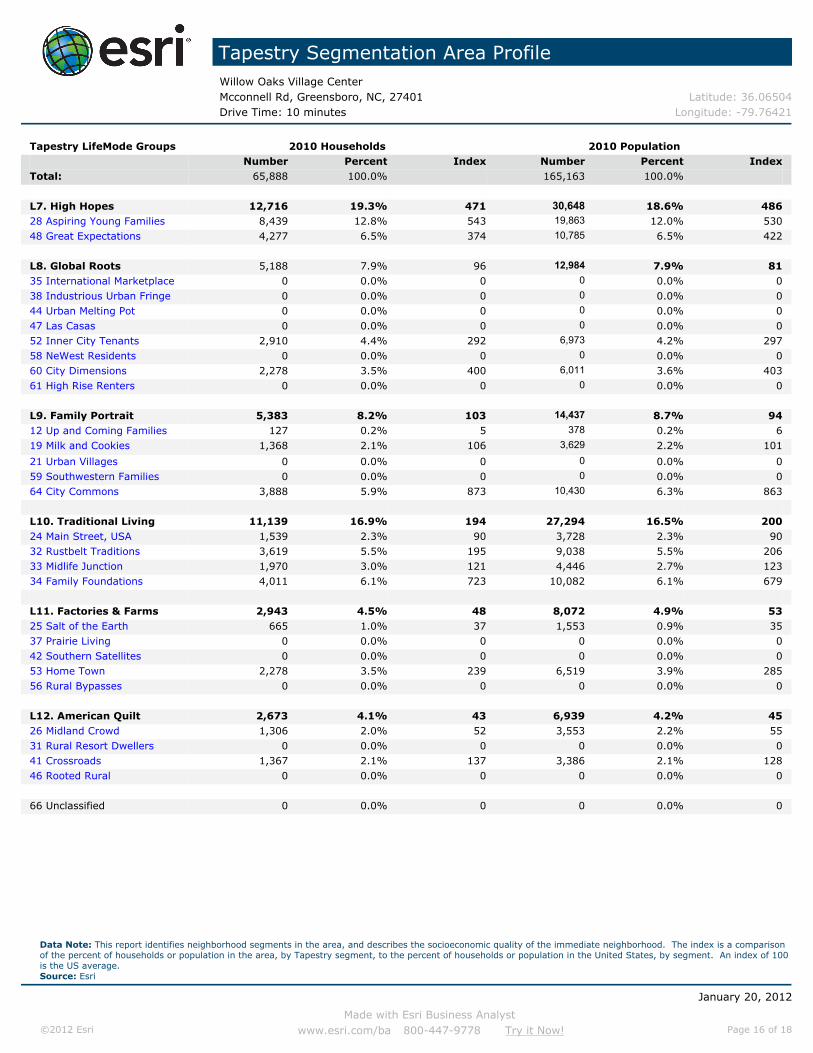
Tapestry Segmentation Area ProfileWillow Oaks Village CenterMcconnell Rd, Greensboro, NC, 27401 Latitude: 36.06504Drive Time: 10 minutes Longitude: -79.76421
Tapestry LifeMode Groups 2010 Households 2010 PopulationNumber Percent Index Number Percent Index
Total: 65,888 100.0% 165,163 100.0%
L7. High Hopes 12,716 19.3% 471 30,648 18.6% 48628 Aspiring Young Families 8,439 12.8% 543 19,863 12.0% 53048 Great Expectations 4,277 6.5% 374 10,785 6.5% 422
L8. Global Roots 5,188 7.9% 96 12,984 7.9% 8135 International Marketplace 0 0.0% 0 0 0.0% 038 Industrious Urban Fringe 0 0.0% 0 0 0.0% 044 Urban Melting Pot 0 0.0% 0 0 0.0% 047 Las Casas 0 0.0% 0 0 0.0% 052 Inner City Tenants 2,910 4.4% 292 6,973 4.2% 29758 NeWest Residents 0 0.0% 0 0 0.0% 060 City Dimensions 2,278 3.5% 400 6,011 3.6% 40361 High Rise Renters 0 0.0% 0 0 0.0% 0
L9. Family Portrait 5,383 8.2% 103 14,437 8.7% 9412 Up and Coming Families 127 0.2% 5 378 0.2% 619 Milk and Cookies 1,368 2.1% 106 3,629 2.2% 101
21 Urban Villages 0 0.0% 0 0 0.0% 059 Southwestern Families 0 0.0% 0 0 0.0% 064 City Commons 3,888 5.9% 873 10,430 6.3% 863
L10. Traditional Living 11,139 16.9% 194 27,294 16.5% 20024 Main Street, USA 1,539 2.3% 90 3,728 2.3% 9032 Rustbelt Traditions 3,619 5.5% 195 9,038 5.5% 20633 Midlife Junction 1,970 3.0% 121 4,446 2.7% 12334 Family Foundations 4,011 6.1% 723 10,082 6.1% 679
L11. Factories & Farms 2,943 4.5% 48 8,072 4.9% 5325 Salt of the Earth 665 1.0% 37 1,553 0.9% 3537 Prairie Living 0 0.0% 0 0 0.0% 042 Southern Satellites 0 0.0% 0 0 0.0% 053 Home Town 2,278 3.5% 239 6,519 3.9% 28556 Rural Bypasses 0 0.0% 0 0 0.0% 0
L12. American Quilt 2,673 4.1% 43 6,939 4.2% 4526 Midland Crowd 1,306 2.0% 52 3,553 2.2% 5531 Rural Resort Dwellers 0 0.0% 0 0 0.0% 041 Crossroads 1,367 2.1% 137 3,386 2.1% 12846 Rooted Rural 0 0.0% 0 0 0.0% 0
66 Unclassified 0 0.0% 0 0 0.0% 0
January 20, 2012
Made with Esri Business Analyst©2012 Esri www.esri.com/ba 800-447-9778 Try it Now! Page 16 of 18
Data Note: This report identifies neighborhood segments in the area, and describes the socioeconomic quality of the immediate neighborhood. The index is a comparisonof the percent of households or population in the area, by Tapestry segment, to the percent of households or population in the United States, by segment. An index of 100is the US average.Source: Esri
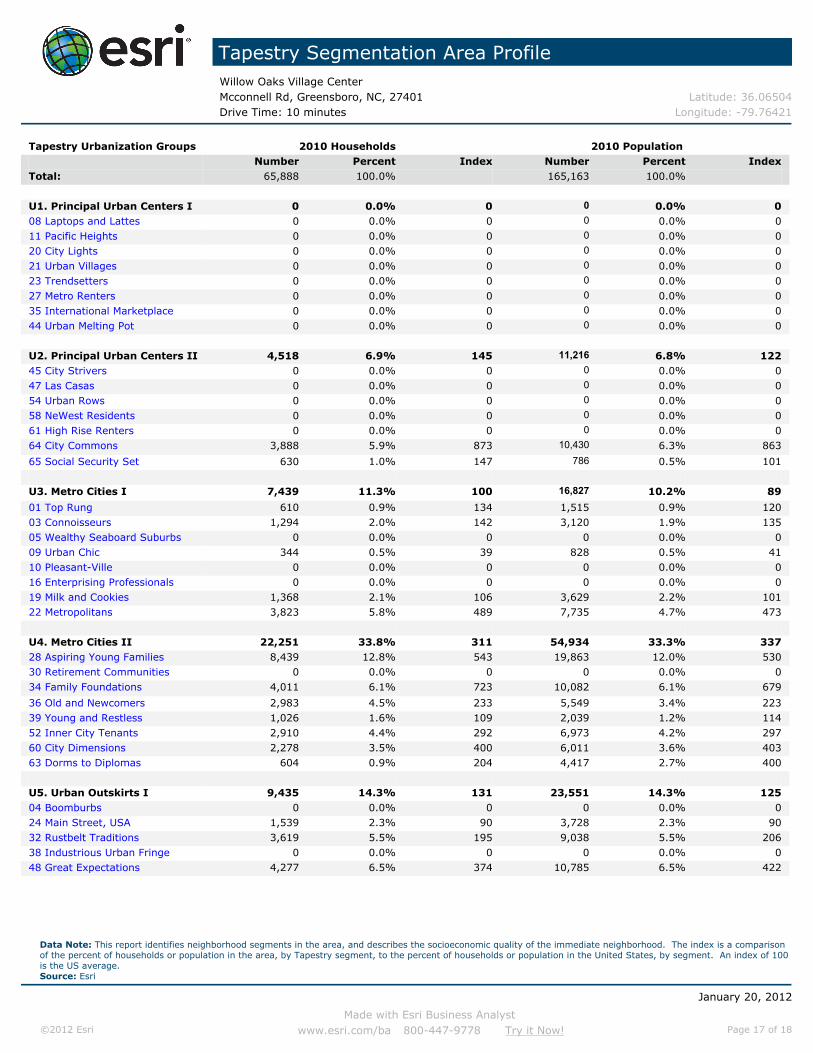
Tapestry Segmentation Area ProfileWillow Oaks Village CenterMcconnell Rd, Greensboro, NC, 27401 Latitude: 36.06504Drive Time: 10 minutes Longitude: -79.76421
Tapestry Urbanization Groups 2010 Households 2010 PopulationNumber Percent Index Number Percent Index
Total: 65,888 100.0% 165,163 100.0%
U1. Principal Urban Centers I 0 0.0% 0 0 0.0% 008 Laptops and Lattes 0 0.0% 0 0 0.0% 011 Pacific Heights 0 0.0% 0 0 0.0% 020 City Lights 0 0.0% 0 0 0.0% 021 Urban Villages 0 0.0% 0 0 0.0% 023 Trendsetters 0 0.0% 0 0 0.0% 027 Metro Renters 0 0.0% 0 0 0.0% 035 International Marketplace 0 0.0% 0 0 0.0% 044 Urban Melting Pot 0 0.0% 0 0 0.0% 0
U2. Principal Urban Centers II 4,518 6.9% 145 11,216 6.8% 12245 City Strivers 0 0.0% 0 0 0.0% 047 Las Casas 0 0.0% 0 0 0.0% 054 Urban Rows 0 0.0% 0 0 0.0% 058 NeWest Residents 0 0.0% 0 0 0.0% 061 High Rise Renters 0 0.0% 0 0 0.0% 064 City Commons 3,888 5.9% 873 10,430 6.3% 863
65 Social Security Set 630 1.0% 147 786 0.5% 101
U3. Metro Cities I 7,439 11.3% 100 16,827 10.2% 89
01 Top Rung 610 0.9% 134 1,515 0.9% 12003 Connoisseurs 1,294 2.0% 142 3,120 1.9% 13505 Wealthy Seaboard Suburbs 0 0.0% 0 0 0.0% 009 Urban Chic 344 0.5% 39 828 0.5% 4110 Pleasant-Ville 0 0.0% 0 0 0.0% 016 Enterprising Professionals 0 0.0% 0 0 0.0% 019 Milk and Cookies 1,368 2.1% 106 3,629 2.2% 10122 Metropolitans 3,823 5.8% 489 7,735 4.7% 473
U4. Metro Cities II 22,251 33.8% 311 54,934 33.3% 33728 Aspiring Young Families 8,439 12.8% 543 19,863 12.0% 53030 Retirement Communities 0 0.0% 0 0 0.0% 034 Family Foundations 4,011 6.1% 723 10,082 6.1% 679
36 Old and Newcomers 2,983 4.5% 233 5,549 3.4% 22339 Young and Restless 1,026 1.6% 109 2,039 1.2% 11452 Inner City Tenants 2,910 4.4% 292 6,973 4.2% 29760 City Dimensions 2,278 3.5% 400 6,011 3.6% 40363 Dorms to Diplomas 604 0.9% 204 4,417 2.7% 400
U5. Urban Outskirts I 9,435 14.3% 131 23,551 14.3% 12504 Boomburbs 0 0.0% 0 0 0.0% 024 Main Street, USA 1,539 2.3% 90 3,728 2.3% 9032 Rustbelt Traditions 3,619 5.5% 195 9,038 5.5% 20638 Industrious Urban Fringe 0 0.0% 0 0 0.0% 048 Great Expectations 4,277 6.5% 374 10,785 6.5% 422
January 20, 2012
Made with Esri Business Analyst©2012 Esri www.esri.com/ba 800-447-9778 Try it Now! Page 17 of 18
Data Note: This report identifies neighborhood segments in the area, and describes the socioeconomic quality of the immediate neighborhood. The index is a comparisonof the percent of households or population in the area, by Tapestry segment, to the percent of households or population in the United States, by segment. An index of 100is the US average.Source: Esri

Tapestry Segmentation Area ProfileWillow Oaks Village CenterMcconnell Rd, Greensboro, NC, 27401 Latitude: 36.06504Drive Time: 10 minutes Longitude: -79.76421
Tapestry Urbanization Groups 2010 Households 2010 PopulationNumber Percent Index Number Percent Index
Total: 65,888 100.0% 165,163 100.0%
U6. Urban Outskirts II 8,376 12.7% 248 23,792 14.4% 27451 Metro City Edge 3,495 5.3% 567 9,160 5.5% 54155 College Towns 2,743 4.2% 517 9,494 5.7% 76357 Simple Living 1,214 1.8% 131 2,872 1.7% 15059 Southwestern Families 0 0.0% 0 0 0.0% 062 Modest Income Homes 924 1.4% 140 2,266 1.4% 0
U7. Suburban Periphery I 1,960 3.0% 19 4,559 2.8% 1702 Suburban Splendor 0 0.0% 0 0 0.0% 006 Sophisticated Squires 0 0.0% 0 0 0.0% 007 Exurbanites 810 1.2% 49 1,975 1.2% 4612 Up and Coming Families 127 0.2% 5 378 0.2% 613 In Style 33 0.1% 2 67 0.0% 214 Prosperous Empty Nesters 990 1.5% 82 2,139 1.3% 7715 Silver and Gold 0 0.0% 0 0 0.0% 0
U8. Suburban Periphery II 8,138 12.4% 129 20,776 12.6% 14018 Cozy and Comfortable 2,736 4.2% 147 7,137 4.3% 15529 Rustbelt Retirees 1,154 1.8% 85 2,674 1.6% 8733 Midlife Junction 1,970 3.0% 121 4,446 2.7% 12340 Military Proximity 0 0.0% 0 0 0.0% 043 The Elders 0 0.0% 0 0 0.0% 053 Home Town 2,278 3.5% 239 6,519 3.9% 285
U9. Small Towns 1,779 2.7% 56 4,354 2.6% 5941 Crossroads 1,367 2.1% 137 3,386 2.1% 12849 Senior Sun Seekers 0 0.0% 0 0 0.0% 050 Heartland Communities 412 0.6% 30 968 0.6% 31
U10. Rural I 1,992 3.0% 27 5,154 3.1% 27
17 Green Acres 21 0.0% 1 48 0.0% 125 Salt of the Earth 665 1.0% 37 1,553 0.9% 3526 Midland Crowd 1,306 2.0% 52 3,553 2.2% 5531 Rural Resort Dwellers 0 0.0% 0 0 0.0% 0
U11. Rural II 0 0.0% 0 0 0.0% 037 Prairie Living 0 0.0% 0 0 0.0% 042 Southern Satellites 0 0.0% 0 0 0.0% 046 Rooted Rural 0 0.0% 0 0 0.0% 056 Rural Bypasses 0 0.0% 0 0 0.0% 0
66 Unclassified 0 0.0% 0 0 0.0% 0
January 20, 2012
Made with Esri Business Analyst©2012 Esri www.esri.com/ba 800-447-9778 Try it Now! Page 18 of 18
Data Note: This report identifies neighborhood segments in the area, and describes the socioeconomic quality of the immediate neighborhood. The index is a comparisonof the percent of households or population in the area, by Tapestry segment, to the percent of households or population in the United States, by segment. An index of 100is the US average.Source: Esri

Dominant Tapestry Site MapWillow Oaks Village CenterMcconnell Rd, Greensboro, NC, 27401 Latitude: 36.06504Drive Time: 3, 5, 10 Minutes Longitude: -79.76421
January 30, 2012
Made with Esri Business Analyst©2012 Esri www.esri.com/ba 800-447-9778 Try it Now! Page 1 of 2
Source: Esri

Dominant Tapestry Site MapWillow Oaks Village CenterMcconnell Rd, Greensboro, NC, 27401 Latitude: 36.06504Drive Time: 3, 5, 10 Minutes Longitude: -79.76421
Tapestry Segmentation
Tapestry Segmentation represents the fourth generation of market segmentation systems that began 30 years ago. The 65-segment Tapestry Segmentation system classifies U.S. neighborhoods based on their socioeconomic and demographiccomposition. Each segment is identified by its two-digit Segment Code. Match the two-digit segment labels on the map to thelist below. A longer description of each segment is available at:
http://www.esri.com/library/whitepapers/pdfs/community-tapestry.pdf
Segment 01: Top Rung Segment 34: Family Foundations
Segment 02: Suburban Splendor Segment 35: International Marketplace
Segment 03: Connoisseurs Segment 36: Old and Newcomers
Segment 04: Boomburbs Segment 37: Prairie Living
Segment 05: Wealthy Seaboard Suburbs Segment 38: Industrious Urban Fringe
Segment 06: Sophisticated Squires Segment 39: Young and Restless
Segment 07: Exurbanites Segment 40: Military Proximity
Segment 08: Laptops and Lattes Segment 41: Crossroads
Segment 09: Urban Chic Segment 42: Southern Satellites
Segment 10: Pleasant-Ville Segment 43: The Elders
Segment 11: Pacific Heights Segment 44: Urban Melting Pot
Segment 12: Up and Coming Families Segment 45: City Strivers
Segment 13: In Style Segment 46: Rooted Rural
Segment 14: Prosperous Empty Nesters Segment 47: Las Casas
Segment 15: Silver and Gold Segment 48: Great Expectations
Segment 16: Enterprising Professionals Segment 49: Senior Sun Seekers
Segment 17: Green Acres Segment 50: Heartland Communities
Segment 18: Cozy and Comfortable Segment 51: Metro City Edge
Segment 19: Milk and Cookies Segment 52: Inner City Tenants
Segment 20: City Lights Segment 53: Home Town
Segment 21: Urban Villages Segment 54: Urban Rows
Segment 22: Metropolitans Segment 55: College Towns
Segment 23: Trendsetters Segment 56: Rural Bypasses
Segment 24: Main Street, USA Segment 57: Simple Living
Segment 25: Salt of the Earth Segment 58: NeWest Residents
Segment 26: Midland Crowd Segment 59: Southwestern Families
Segment 27: Metro Renters Segment 60: City Dimensions
Segment 28: Aspiring Young Families Segment 61: High Rise Renters
Segment 29: Rustbelt Retirees Segment 62: Modest Income Homes
Segment 30: Retirement Communities Segment 63: Dorms to Diplomas
Segment 31: Rural Resort Dwellers Segment 64: City Commons
Segment 32: Rustbelt Traditions Segment 65: Social Security Set
Segment 33: Midlife Junction Segment 66: Unclassified
January 30, 2012
Made with Esri Business Analyst©2012 Esri www.esri.com/ba 800-447-9778 Try it Now! Page 2 of 2
Source: Esri

Major Shopping Center MapWillow Oaks Village CenterMcconnell Rd, Greensboro, NC, 27401 Latitude: 36.06504Drive Time: 3, 5, 10 Minutes Longitude: -79.76421
January 30, 2012
Made with Esri Business Analyst©2012 Esri www.esri.com/ba 800-447-9778 Try it Now! Page 1 of 1
Source: Directory of Major Malls, Inc.

An Esri
® White Paper • May 2011
Methodology Statement: Esri® Data—Market Potential
Esri, 380 New York St., Redlands, CA 92373-8100 USA TEL 909-793-2853 • FAX 909-793-5953 • E-MAIL [email protected] • WEB esri.com

Copyright © 2011 Esri All rights reserved. Printed in the United States of America. The information contained in this document is the exclusive property of Esri. This work is protected under United States copyright law and other international copyright treaties and conventions. No part of this work may be reproduced or transmitted in any form or by any means, electronic or mechanical, including photocopying and recording, or by any information storage or retrieval system, except as expressly permitted in writing by Esri. All requests should be sent to Attention: Contracts and Legal Services Manager, Esri, 380 New York Street, Redlands, CA 92373-8100 USA. The information contained in this document is subject to change without notice. Esri, the Esri globe logo, Tapestry, esri.com, and @esri.com are trademarks, registered trademarks, or service marks of Esri in the United States, the European Community, or certain other jurisdictions. Other companies and products mentioned herein may be trademarks or registered trademarks of their respective trademark owners.
J-9672
Esri White Paper i
Methodology Statement: Esri Data—Market Potential
An Esri White Paper Contents Page Market Potential Index.......................................................................... 1 How Esri Calculates Market Potential .................................................. 1 Esri's Data Development Team............................................................. 2
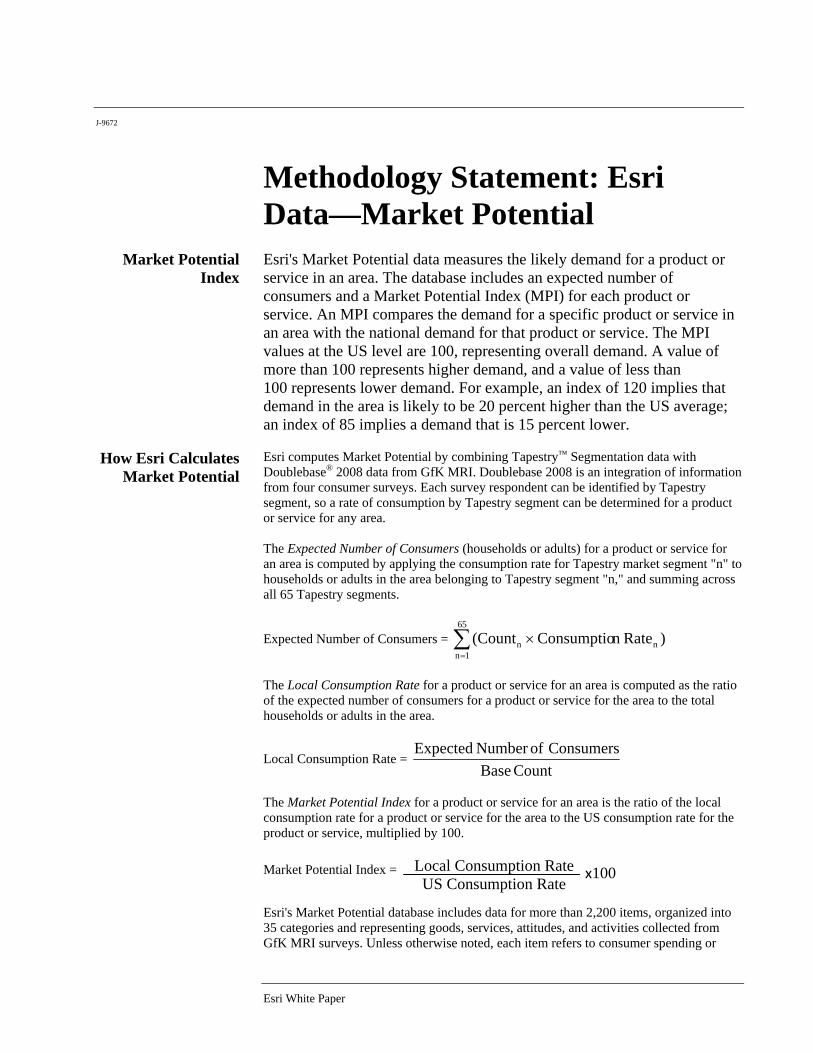
J-9672
Esri White Paper
Methodology Statement: Esri Data—Market Potential
Market Potential Index
Esri's Market Potential data measures the likely demand for a product or service in an area. The database includes an expected number of consumers and a Market Potential Index (MPI) for each product or service. An MPI compares the demand for a specific product or service in an area with the national demand for that product or service. The MPI values at the US level are 100, representing overall demand. A value of more than 100 represents higher demand, and a value of less than 100 represents lower demand. For example, an index of 120 implies that demand in the area is likely to be 20 percent higher than the US average; an index of 85 implies a demand that is 15 percent lower.
How Esri Calculates Market Potential
Esri computes Market Potential by combining Tapestry™ Segmentation data with Doublebase® 2008 data from GfK MRI. Doublebase 2008 is an integration of information from four consumer surveys. Each survey respondent can be identified by Tapestry segment, so a rate of consumption by Tapestry segment can be determined for a product or service for any area. The Expected Number of Consumers (households or adults) for a product or service for an area is computed by applying the consumption rate for Tapestry market segment "n" to households or adults in the area belonging to Tapestry segment "n," and summing across all 65 Tapestry segments.
Expected Number of Consumers = ∑=
×65
1nnn )Raten Consumptio(Count
The Local Consumption Rate for a product or service for an area is computed as the ratio of the expected number of consumers for a product or service for the area to the total households or adults in the area.
Local Consumption Rate = CountBase
Consumers ofNumber Expected
The Market Potential Index for a product or service for an area is the ratio of the local consumption rate for a product or service for the area to the US consumption rate for the product or service, multiplied by 100. Market Potential Index = Esri's Market Potential database includes data for more than 2,200 items, organized into 35 categories and representing goods, services, attitudes, and activities collected from GfK MRI surveys. Unless otherwise noted, each item refers to consumer spending or
Local Consumption Rate US Consumption Rate
x100

Methodology Statement: Esri Data—Market Potential
J-9672
May 2011 2
behavior in a 12-month period. The a or h following the five-digit product code denotes the consumer base as being composed of adults or households. Products and services, such as apparel items, types of digital cameras, video game systems, financial accounts and services, health-related items, Internet activities, satellite TV providers, personal care services, and detailed information about cell phones/PDAs (brands, service providers, average monthly bills, and purchase locations), are included. A product description was revised since the last Market Potential update if a product change was made by GfK MRI, if ranges had to be collapsed, or if more clarification was required. A product was dropped since the last Market Potential update if it did not pass a sample size test, became outdated or unnecessary, or no longer exists in the GfK MRI database.
Esri's Data Development Team
Led by chief demographer Lynn Wombold, Esri's data development team has a 30-year history of excellence in market intelligence. The combined expertise of the team's economists, statisticians, demographers, geographers, and analysts totals nearly a century of data and segmentation development experience. The team develops datasets, including the demographic update, Tapestry Segmentation, Consumer Spending, Market Potential, and Retail MarketPlace, that are now industry benchmarks. For more information about the Market Potential data, please call 1-800-447-9778.

PROJECT SUMMARY
BUILDING SUMMARY SF Stories Total SF INCOME INFORMATION RESIDENTIAL INFORMATIONBuilding A 8177 1 8177 Area Median Family Income 55,300$ Vacancy 5%Building B 7597 1 7597 Workforce (80% of Median) 44,240$ Absorption Rate (units/yr) N/ABuilding C 4938 1 4938 Amount to be Spent on Housing 30% Efficiency Rate (apts) 80%Building D 4534 1 4534 Funds Available for Housing 13,272$ Efficiency Rate (tnhms) 100%Building E 4996 1 4996 Monthly Funds Avail. for Housing 1,106$ Building F 5500 2 11000Building G 5298 1 5298TOTAL SF 46,540
RETAIL SF OFFICE SF RESIDENTIAL (APTS) SF UnitsBuilding A ‐ Story 1 8177 Building A ‐ Story 2 0 Building A ‐ Story 2 0 0Building B ‐ Story 1 7597 Building B ‐ Story 2 0 Building B ‐ Story 2 0 0Building C ‐ Story 1 4938 Building C ‐ Story 2 0 Building C ‐ Story 2 0 0Building D ‐ Story 1 4534 Building D ‐ Story 2 0 Building D ‐ Story 2 0 0Building E ‐ Story 1 4996 Building E ‐ Story 2 0 Building E ‐ Story 2 0 0Building F ‐ Story 1 5500 Building F ‐ Story 2 0 Building F ‐ Story 2 5500 4Building G ‐ Story 1 5298 Building G ‐ Story 2 0 Building G ‐ Story 2 0 0TOTAL RETAIL SF 41,040 TOTAL OFFICE SF 0 TOTAL RESIDENTIAL (APTS) 5500 4
RETAIL OFFICE RESIDENTIAL (TOWNHOMES)Total SF 41,040 Total SF ‐ Total Units 19Efficiency Rate 80% Efficiency Rate 80% Total Percent 100%Gross Leaseable SF 32,832 Gross Leaseable SF ‐ Percent Market Rate 100%Average Rent Rate per SF 14.00$ Average Rent Rate per SF 15.50$ Total Market Rate Units 19
Percent Affordable 0%Total Affordable Units 0Average Unit Size (SF) 1260
REVENUE
RETAIL REVENUE OFFICE REVENUE RESIDENTIAL REVENUEAnnual Rent 367,718$ Annual Rent ‐$ Market Rate Townhomes 19 1,250$ 23,750$ Vacancy Rate 10% Vacancy Rate 10% Affordable Townhomes 0 1,106$ ‐$ Net Annual Rent 330,947$ Net Annual Rent ‐$ Apartments 4 900$ 3,600$
Monthly Rent 27,350$ Annual Rent 328,200$ Vacancy Rate 5%Net Annual Rent 311,790$
EXPENSES
EXPENSES Per SF Total DEVELOPMENT COSTS (excluding land) Per SF TotalOperating Expenses 61,560$ Hard Costs 6,521,600$ where does insurance fit in? Retail Operating 1.50$ 61,560$ Retail Hard Costs 80$ 3,283,200$ development fee? 4% ‐ 5% Office Operating 1.50$ ‐$ Office Hard Costs 80$ 0 depreciate parking costs? Residential Operating 1.50$ Residential Hard Costs 110$ 3,238,400$ Real Estate Taxes per SF 1.00$ ‐$ Site grading, prep, landscape 1,000,000$ Replacement Reserves per SF 5% of Gross Rent Soft Costs 7% 456,512$ Land Parcel 300,000$ Subtotal 7,978,112$ Development Costs 8,377,018$ Contingency 5% 398,906$ Total Development Costs (including land) 8,677,018$ Development Costs (excluding land) 8,377,018$
TAXES

Income Tax Rate 35%Capital Gains Tax Rate 15%Depreciation (Commercial) 39 yearsDepreciation (Residential) 27.5 yearsAnnual Comm. Depreciation 84,185$ Annual Resi. Depreciation 117,760$ Total Annual Depreciation 201,945$
LOAN
LOAN DETAILSLTV 70%Loan Amount 6,073,912$ Equity 2,603,105$ Amortization Term (years) 30Interest Rate 6.00%Montly Payment ($36,416)Annual Payment ($436,994)
LOAN 1 2 3 4 5 6 7 8 9 10Beg Balance 6,073,912$ 5,999,324$ 5,920,135$ 5,836,062$ 5,746,804$ 5,652,040$ 5,551,432$ 5,444,618$ 5,331,216$ 5,210,820$ Debt Service ($436,994) ($436,994) ($436,994) ($436,994) ($436,994) ($436,994) ($436,994) ($436,994) ($436,994) ($436,994)Interest 362,406$ 357,805$ 352,921$ 347,736$ 342,230$ 336,386$ 330,180$ 323,592$ 316,598$ 309,172$ Amortization 74,588$ 79,189$ 84,073$ 89,258$ 94,764$ 100,609$ 106,814$ 113,402$ 120,396$ 127,822$ End Balance 5,999,324$ 5,920,135$ 5,836,062$ 5,746,804$ 5,652,040$ 5,551,432$ 5,444,618$ 5,331,216$ 5,210,820$ 5,082,998$
SALESALE IN YR 10 SALE IN YR 5
Terminal Cap Rate (Year 10) 9% Year 11 NOI 737,863$ Year 6 NOI 636,488$ Terminal Cap Rate (Year 5) 9% Value at Terminal Cap Rate 8,198,483$ Value at Terminal Cap Rate 7,072,084$ Closing Costs 5% Cost of Sale (409,924)$ Cost of Sale (353,604)$ Replacement Reserves Net Sale Value 7,788,559$ Net Sale Value 6,718,479$
Development Cost 8,677,018$ Development Cost 8,677,018$ Capital Improvements 368,413$ Capital Improvements 170,619$ Accum. Depreciation 2,019,446$ Accum. Depreciation 1,009,723$ Net Book Value 11,064,876$ Net Book Value 9,857,359$
Capital Gain Tax Liability (3,276,317)$ Capital Gain Tax Liability (3,138,880)$ Capital Gains Tax Payable (491,448)$ Capital Gains Tax Payable (470,832)$
Net Sale Value 7,788,559$ Net Sale Value 6,718,479$ Less Loan Repayment (5,210,820)$ Less Loan Repayment (5,746,804)$ Less Capital Gains Tax (491,448)$ Less Capital Gains Tax (470,832)$ Net Cash from Sale 2,086,292$ Net Cash from Sale 500,844$
DISCOUNTED CASH FLOW 0 1 2 3 4 5 6 7 8 9 10 11REVENUEResidential 311,790$ 321,144$ 330,778$ 340,701$ 350,922$ 361,450$ 372,294$ 383,462$ 394,966$ 406,815$ 419,020$ Retail 330,947$ 340,875$ 351,101$ 361,634$ 372,483$ 383,658$ 395,167$ 407,023$ 419,233$ 431,810$ 444,765$ NOTE: Builds in Office ‐$ ‐$ ‐$ ‐$ ‐$ ‐$ ‐$ ‐$ ‐$ ‐$ ‐$ Gross Rent 642,737$ 662,019$ 681,879$ 702,336$ 723,406$ 745,108$ 767,461$ 790,485$ 814,199$ 838,625$ 863,784$
EXPENSESOperating 61,560$ 63,407$ 65,309$ 67,268$ 69,286$ 71,365$ 73,506$ 75,711$ 77,982$ 80,322$ 82,731$ Real Estate Taxes ‐$ ‐$ ‐$ ‐$ ‐$ ‐$ ‐$ ‐$ ‐$ ‐$ ‐$
Fully spent over hold period
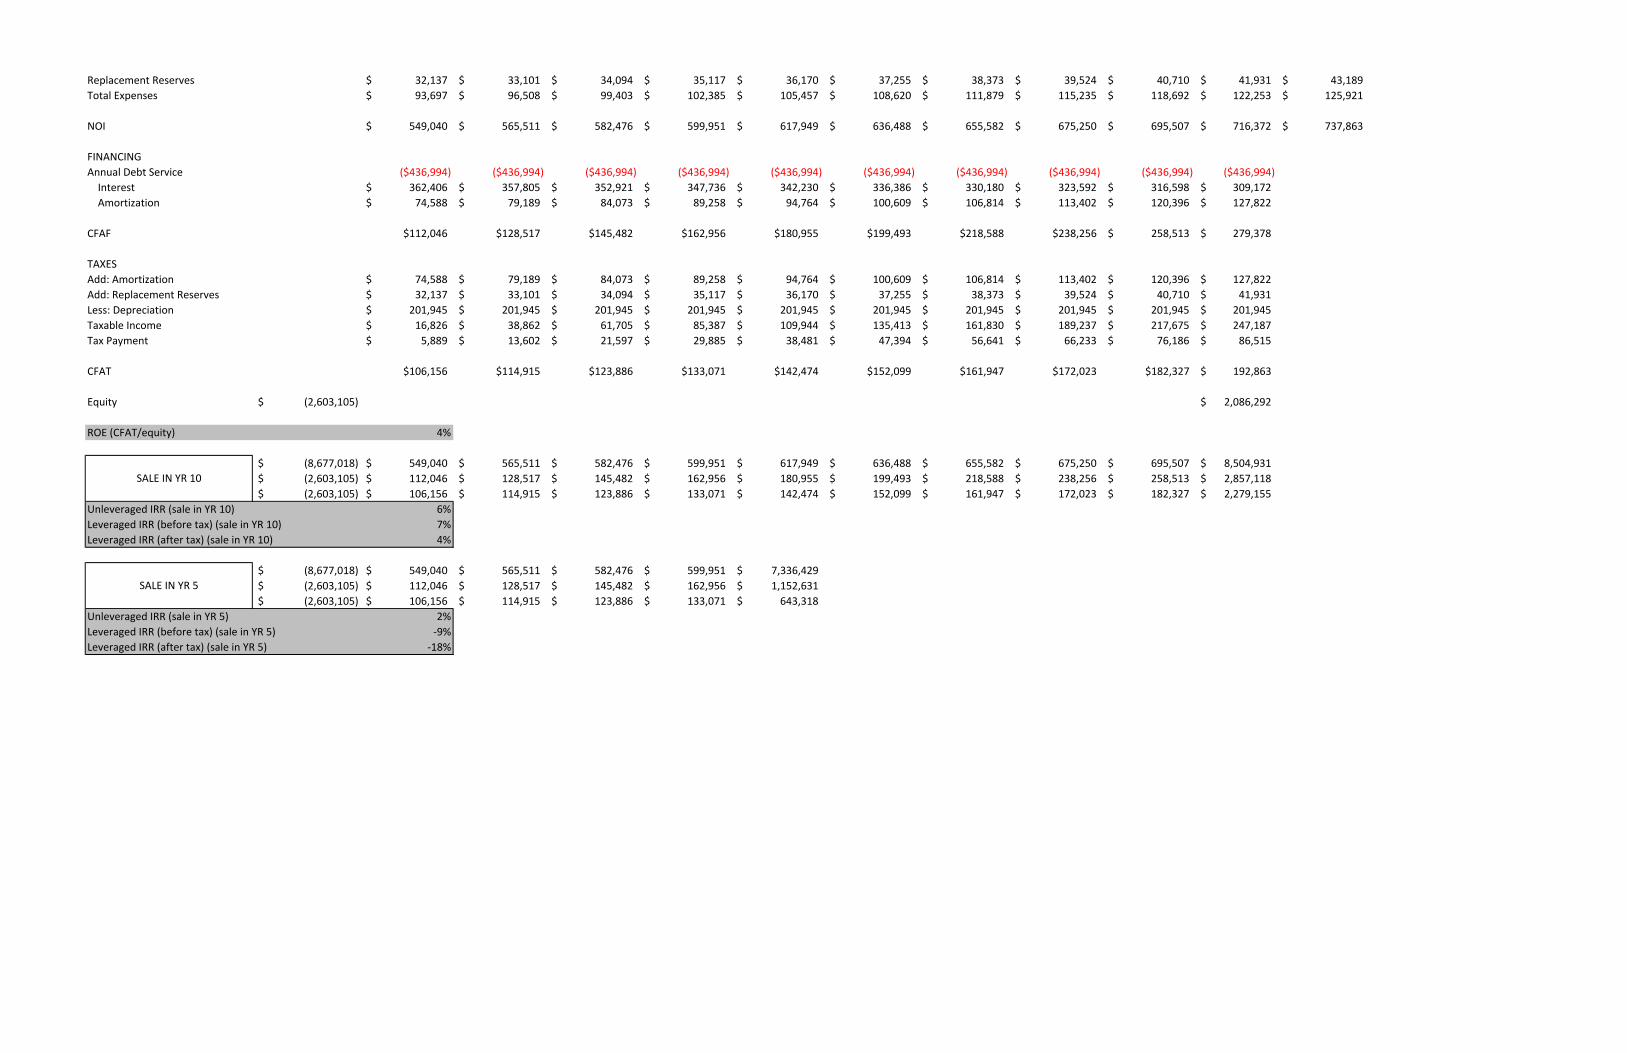
Replacement Reserves 32,137$ 33,101$ 34,094$ 35,117$ 36,170$ 37,255$ 38,373$ 39,524$ 40,710$ 41,931$ 43,189$ Total Expenses 93,697$ 96,508$ 99,403$ 102,385$ 105,457$ 108,620$ 111,879$ 115,235$ 118,692$ 122,253$ 125,921$
NOI 549,040$ 565,511$ 582,476$ 599,951$ 617,949$ 636,488$ 655,582$ 675,250$ 695,507$ 716,372$ 737,863$
FINANCINGAnnual Debt Service ($436,994) ($436,994) ($436,994) ($436,994) ($436,994) ($436,994) ($436,994) ($436,994) ($436,994) ($436,994) Interest 362,406$ 357,805$ 352,921$ 347,736$ 342,230$ 336,386$ 330,180$ 323,592$ 316,598$ 309,172$ Amortization 74,588$ 79,189$ 84,073$ 89,258$ 94,764$ 100,609$ 106,814$ 113,402$ 120,396$ 127,822$
CFAF $112,046 $128,517 $145,482 $162,956 $180,955 $199,493 $218,588 $238,256 258,513$ 279,378$
TAXESAdd: Amortization 74,588$ 79,189$ 84,073$ 89,258$ 94,764$ 100,609$ 106,814$ 113,402$ 120,396$ 127,822$ Add: Replacement Reserves 32,137$ 33,101$ 34,094$ 35,117$ 36,170$ 37,255$ 38,373$ 39,524$ 40,710$ 41,931$ Less: Depreciation 201,945$ 201,945$ 201,945$ 201,945$ 201,945$ 201,945$ 201,945$ 201,945$ 201,945$ 201,945$ Taxable Income 16,826$ 38,862$ 61,705$ 85,387$ 109,944$ 135,413$ 161,830$ 189,237$ 217,675$ 247,187$ Tax Payment 5,889$ 13,602$ 21,597$ 29,885$ 38,481$ 47,394$ 56,641$ 66,233$ 76,186$ 86,515$
CFAT $106,156 $114,915 $123,886 $133,071 $142,474 $152,099 $161,947 $172,023 $182,327 192,863$
Equity (2,603,105)$ 2,086,292$
ROE (CFAT/equity) 4%
(8,677,018)$ 549,040$ 565,511$ 582,476$ 599,951$ 617,949$ 636,488$ 655,582$ 675,250$ 695,507$ 8,504,931$ (2,603,105)$ 112,046$ 128,517$ 145,482$ 162,956$ 180,955$ 199,493$ 218,588$ 238,256$ 258,513$ 2,857,118$ (2,603,105)$ 106,156$ 114,915$ 123,886$ 133,071$ 142,474$ 152,099$ 161,947$ 172,023$ 182,327$ 2,279,155$
Unleveraged IRR (sale in YR 10) 6%Leveraged IRR (before tax) (sale in YR 10) 7%Leveraged IRR (after tax) (sale in YR 10) 4%
(8,677,018)$ 549,040$ 565,511$ 582,476$ 599,951$ 7,336,429$ (2,603,105)$ 112,046$ 128,517$ 145,482$ 162,956$ 1,152,631$ (2,603,105)$ 106,156$ 114,915$ 123,886$ 133,071$ 643,318$
Unleveraged IRR (sale in YR 5) 2%Leveraged IRR (before tax) (sale in YR 5) ‐9%Leveraged IRR (after tax) (sale in YR 5) ‐18%
SALE IN YR 10
SALE IN YR 5

GENERAL SITE INFORMATION
SITE AREA SUMMARY SF Acres LAND PRICE Price Per Acre Total
Mixed Use 132,664 3.05 Mixed Use Component 200,000$ 609,109$
Townhomes 100,236 2.30 Townhome Component 80,000$ 184,088$
Public Plaza 4,875 0.11 Public Plaza 1$ 0$
TOTAL AREA 237,775 5.46 TOTAL LAND PRICE 793,198$
RETURN SUMMARY
BUILDING SUMMARY PROJECT ASSUMPTIONS FINANCING ASSUMPTIONS
Office SF - Development Costs 6,883,789$ Equity 2,247,869$
Retail SF 41,040 Land Price 609,109$ Loan 70% 5,245,029$
Residential SF 21,274 Total Purchase Price 7,492,898$ Interest Rate 5.50%
TOTAL SF 62,314
LIQUIDATION ASSUMPTIONS (Sale in Yr 10)
Sale Cap Rate 6%
Sale Closing Costs (283,449)
Yr 11 NOI 340,138$
Net Cash from Sales 1,818,179$
BUILDING SUMMARY PROJECT ASSUMPTIONS FINANCING ASSUMPTIONS
Office SF 21,274 Development Costs 6,642,312$ Equity 2,175,426$
Retail SF 41,040 Land Price 609,109$ Loan 70% 5,075,995$
Residential SF - Total Purchase Price 7,251,421$ Interest Rate 5.50%
TOTAL SF 62,314
LIQUIDATION ASSUMPTIONS (Sale in Yr 10)
Sale Cap Rate 6%
Sale Closing Costs (296,665)
Yr 11 NOI 355,997$
Net Cash from Sales 2,184,247$
BUILDING SUMMARY PROJECT ASSUMPTIONS FINANCING ASSUMPTIONS
Retail SF 41,040 Development Costs 6,497,761$ Equity 2,132,061$
Office SF - Land Price 609,109$ Loan 70% 4,974,809$
Residential SF 17,631 Total Purchase Price 7,106,871$ Interest Rate 5.50%
TOTAL SF 58,671
LIQUIDATION ASSUMPTIONS (Sale in Yr 10)
Sale Cap Rate 6%
Sale Closing Costs (255,595)
Yr 11 NOI 306,714$
Net Cash from Sales 1,472,745$
SCENARIO 1 - APTS PROJECT LEVERAGED IRR -8%
SCENARIO 2 - APTS PROJECT LEVERAGED IRR -10%
SCENARIO 1 - OFFICE PROJECT LEVERAGED IRR -5%
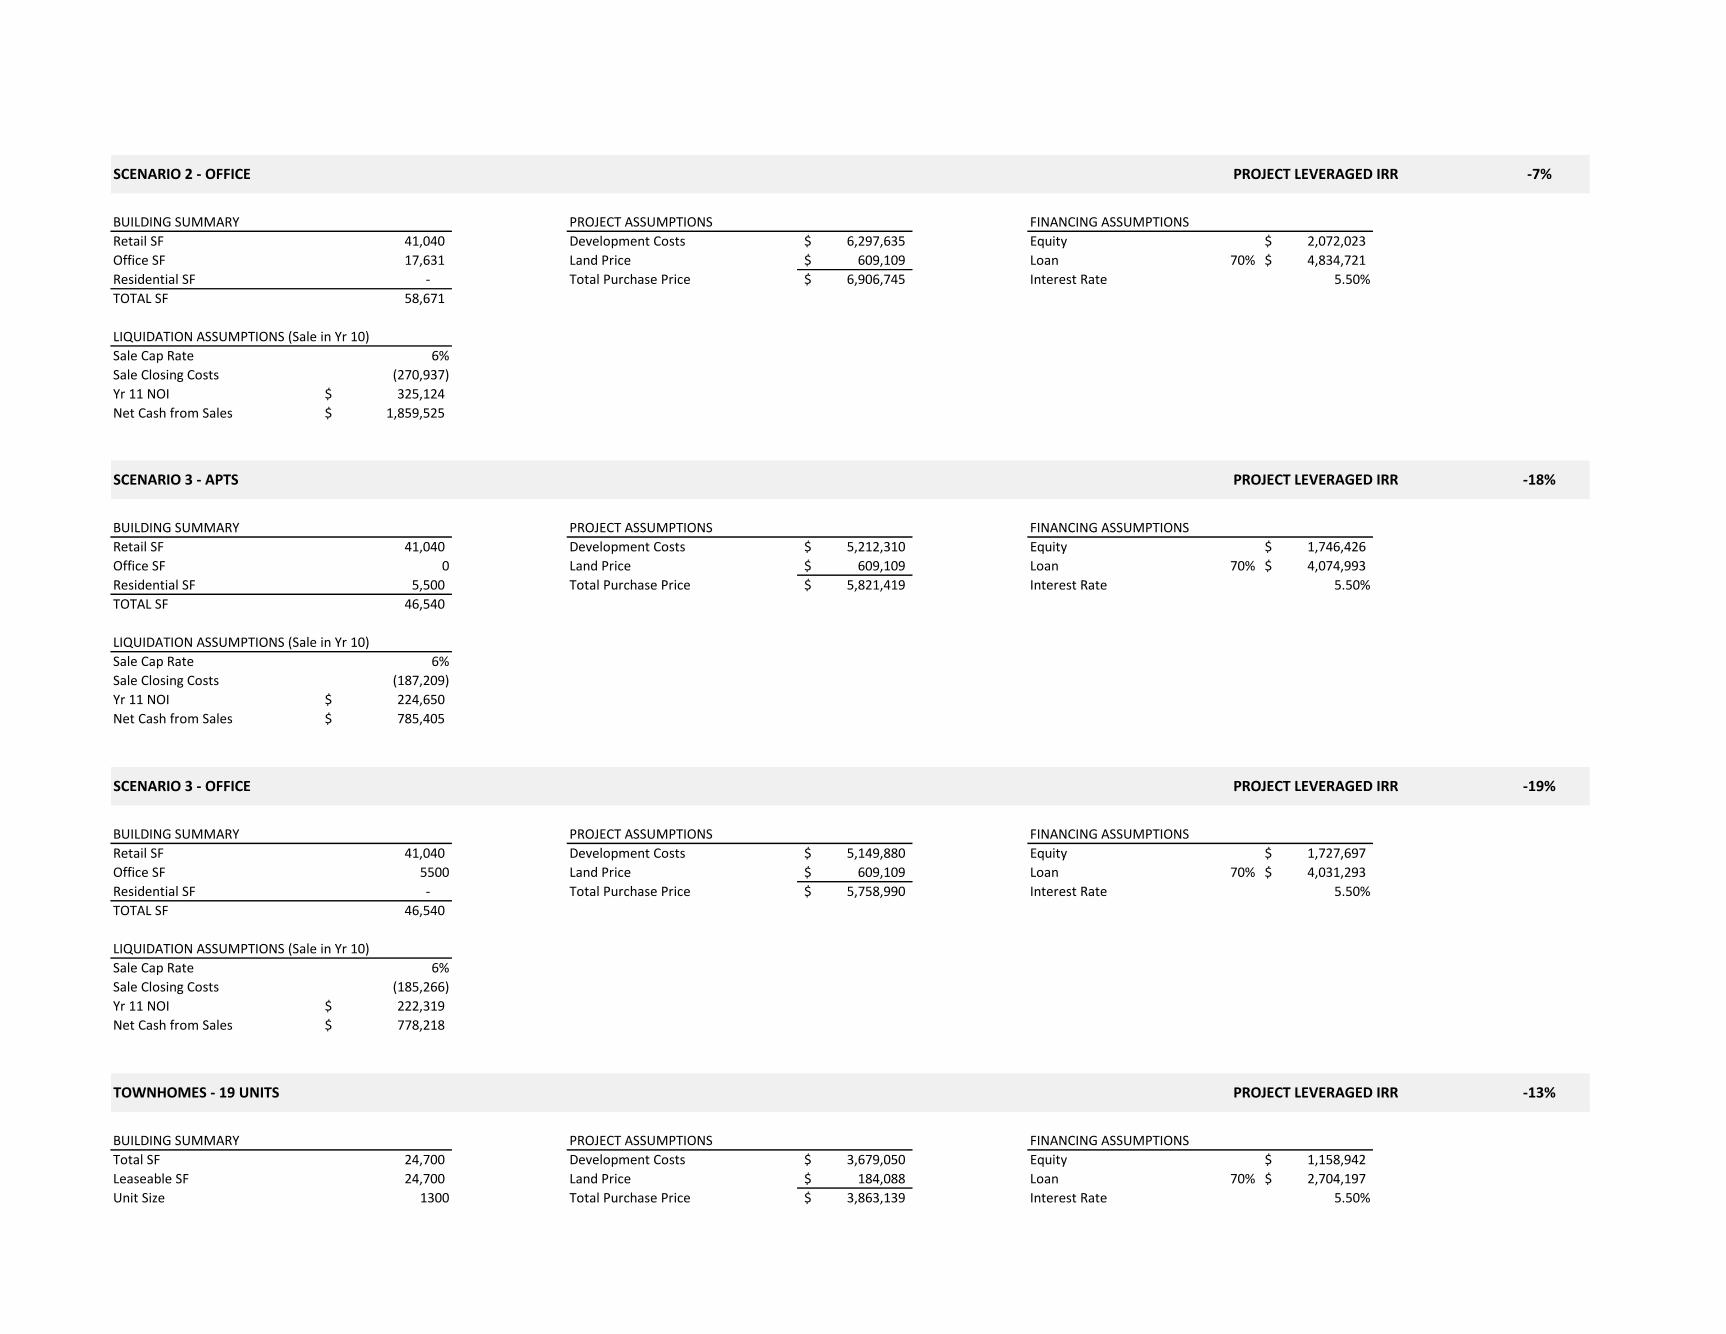
BUILDING SUMMARY PROJECT ASSUMPTIONS FINANCING ASSUMPTIONS
Retail SF 41,040 Development Costs 6,297,635$ Equity 2,072,023$
Office SF 17,631 Land Price 609,109$ Loan 70% 4,834,721$
Residential SF - Total Purchase Price 6,906,745$ Interest Rate 5.50%
TOTAL SF 58,671
LIQUIDATION ASSUMPTIONS (Sale in Yr 10)
Sale Cap Rate 6%
Sale Closing Costs (270,937)
Yr 11 NOI 325,124$
Net Cash from Sales 1,859,525$
BUILDING SUMMARY PROJECT ASSUMPTIONS FINANCING ASSUMPTIONS
Retail SF 41,040 Development Costs 5,212,310$ Equity 1,746,426$
Office SF 0 Land Price 609,109$ Loan 70% 4,074,993$
Residential SF 5,500 Total Purchase Price 5,821,419$ Interest Rate 5.50%
TOTAL SF 46,540
LIQUIDATION ASSUMPTIONS (Sale in Yr 10)
Sale Cap Rate 6%
Sale Closing Costs (187,209)
Yr 11 NOI 224,650$
Net Cash from Sales 785,405$
BUILDING SUMMARY PROJECT ASSUMPTIONS FINANCING ASSUMPTIONS
Retail SF 41,040 Development Costs 5,149,880$ Equity 1,727,697$
Office SF 5500 Land Price 609,109$ Loan 70% 4,031,293$
Residential SF - Total Purchase Price 5,758,990$ Interest Rate 5.50%
TOTAL SF 46,540
LIQUIDATION ASSUMPTIONS (Sale in Yr 10)
Sale Cap Rate 6%
Sale Closing Costs (185,266)
Yr 11 NOI 222,319$
Net Cash from Sales 778,218$
BUILDING SUMMARY PROJECT ASSUMPTIONS FINANCING ASSUMPTIONS
Total SF 24,700 Development Costs 3,679,050$ Equity 1,158,942$
Leaseable SF 24,700 Land Price 184,088$ Loan 70% 2,704,197$
Unit Size 1300 Total Purchase Price 3,863,139$ Interest Rate 5.50%
TOWNHOMES - 19 UNITS PROJECT LEVERAGED IRR
SCENARIO 3 - APTS PROJECT LEVERAGED IRR -18%
-13%
SCENARIO 2 - OFFICE PROJECT LEVERAGED IRR -7%
SCENARIO 3 - OFFICE PROJECT LEVERAGED IRR -19%

LIQUIDATION ASSUMPTIONS (Sale in Yr 10)
Sale Cap Rate 7%
Sale Closing Costs (127,749)
Yr 11 NOI 178,848$
Net Cash from Sales 587,996$
BUILDING SUMMARY PROJECT ASSUMPTIONS FINANCING ASSUMPTIONS
Total SF 30,000 Development Costs 4,361,638$ Equity 1,363,718$
Leaseable SF 30,000 Land Price 184,088$ Loan 70% 3,182,008$
Unit Size (SF) 1200 Total Purchase Price 4,545,726$ Interest Rate 5.50%
LIQUIDATION ASSUMPTIONS (Sale in Yr 10)
Sale Cap Rate 7%
Sale Closing Costs (157,085)
Yr 11 NOI 219,919$
Net Cash from Sales 820,404$
TOWNHOMES - 25 UNITS PROJECT LEVERAGED IRR -10%

SCENARIO 1 (APARTMENTS) PROJECT SUMMARY
PROJECT ASSUMPTIONS LIQUIDATION ASSUMPTIONS (Sale in Yr 10)
Development Costs 6,883,789$ Sale Cap Rate 6%
Land Price 609,109$ Sale Closing Costs 5%
Total Purchase Price 7,492,898$ Yr 11 NOI 340,138$
Net Cash from Sales 1,818,179$
FINANCING ASSUMPTIONS
Equity 2,247,869$
Loan 5,245,029$
Interest Rate 5.50%
GENERAL SITE INFORMATION
BUILDING SUMMARY SF Stories Total SF INCOME INFORMATION RESIDENTIAL INFORMATION
Building A 8,177 2 16,354 Area Median Family Income 55,300$ Vacancy 5%
Building B 7,597 2 15,194 Workforce (80% of Median) 44,240$ Absorption Rate (units/yr) N/A
Building C 4,938 1 4,938 Amount to be Spent on Housing 30% Efficiency Rate (apts) 80%
Building D 4,534 1 4,534 Funds Available for Housing 13,272$ Efficiency Rate (tnhms) 100%
Building E 4,996 1 4,996 Monthly Funds Avail. for Housing 1,106$ Price PSF for Apartments 1.05$
Building F 5,500 2 11,000
Building G 5,298 1 5,298
TOTAL SF 62,314
Townhomes -
TOTAL SF (including townhomes) 62,314
SITE SUMMARY SF Acres
TOTAL AREA 132,664 3.05
RETAIL SF OFFICE SF RESIDENTIAL (APTS) Average SF/Unit Units Total SF
Building A - Story 1 8,177 Building A - Story 2 0 Building A - Story 2 984 7 8,177
Building B - Story 1 7,597 Building B - Story 2 0 Building B - Story 2 979 6 7,597
Building C - Story 1 4,938 Building C - Story 2 0 Building C - Story 2 0 0 0
Building D - Story 1 4,534 Building D - Story 2 0 Building D - Story 2 875 4 0
Building E - Story 1 4,996 Building E - Story 2 0 Building E - Story 2 0 0 0
Building F - Story 1 5,500 Building F - Story 2 0 Building F - Story 2 1,254 4 5,500
Building G - Story 1 5,298 Building G - Story 2 0 Building G - Story 2 0 0 0
TOTAL RETAIL SF 41,040 TOTAL OFFICE SF - TOTAL RESIDENTIAL (APTS) 21 21,274
RETAIL OFFICE RESIDENTIAL Total SF Leaseable SF Monthly Rent
Total SF 41,040 Total SF - Building A 8177
Efficiency Rate 80% Efficiency Rate 80% Unit 1 818 859$
Gross Leaseable SF 32,832 Gross Leaseable SF - Unit 2 840 882$
Average Rent Rate per SF 14.50$ Average Rent Rate per SF 15.50$ Unit 3 1331 1,398$
Unit 4 1026 1,077$
Unit 5 1026 1,077$
Unit 6 978 1,027$
Unit 7 868 911$
SUBTOTAL 6,887$ 7,231$
Building B 7597
Unit 1 1,083 1,137$
Unit 2 981 1,030$
Unit 3 848 890$
Unit 4 956 1,004$
Unit 5 864 907$
Unit 6 1,142 1,199$
SUBTOTAL 5,874 6,168$
Building D 0
Unit 1 870 914$
Unit 2 825 866$
Unit 3 961 1,009$
PROJECT LEVERAGED IRR -8%
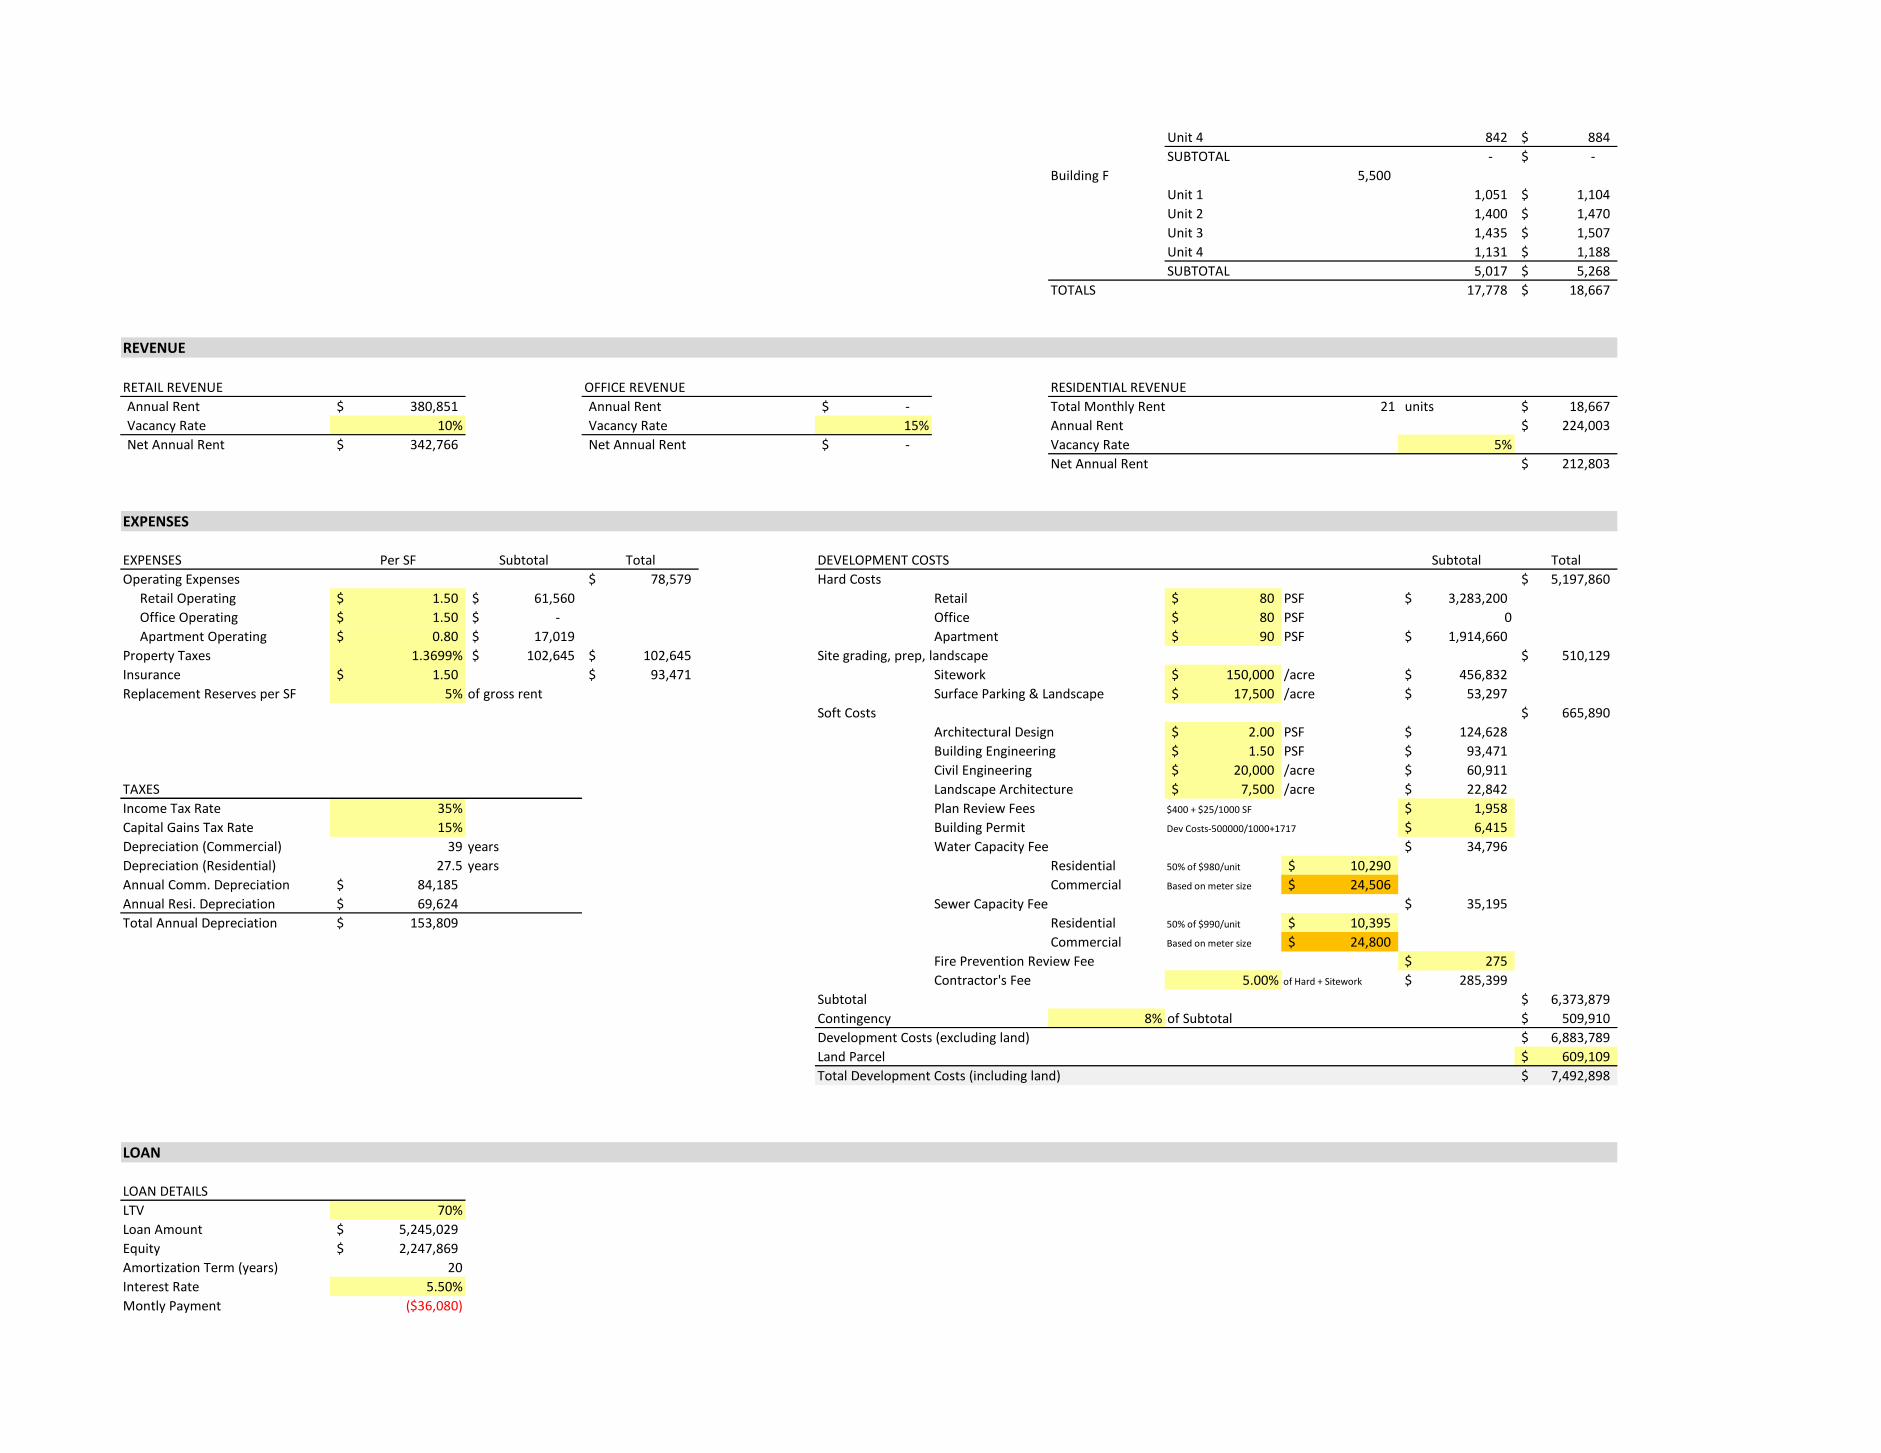
Unit 4 842 884$
SUBTOTAL - -$
Building F 5,500
Unit 1 1,051 1,104$
Unit 2 1,400 1,470$
Unit 3 1,435 1,507$
Unit 4 1,131 1,188$
SUBTOTAL 5,017 5,268$
TOTALS 17,778 18,667$
REVENUE
RETAIL REVENUE OFFICE REVENUE RESIDENTIAL REVENUE
Annual Rent 380,851$ Annual Rent -$ Total Monthly Rent 21 units 18,667$
Vacancy Rate 10% Vacancy Rate 15% Annual Rent 224,003$
Net Annual Rent 342,766$ Net Annual Rent -$ Vacancy Rate 5%
Net Annual Rent 212,803$
EXPENSES
EXPENSES Per SF Subtotal Total DEVELOPMENT COSTS Subtotal Total
Operating Expenses 78,579$ Hard Costs 5,197,860$
Retail Operating 1.50$ 61,560$ Retail 80$ PSF 3,283,200$
Office Operating 1.50$ -$ Office 80$ PSF 0
Apartment Operating 0.80$ 17,019$ Apartment 90$ PSF 1,914,660$
Property Taxes 1.3699% 102,645$ 102,645$ Site grading, prep, landscape 510,129$
Insurance 1.50$ 93,471$ Sitework 150,000$ /acre 456,832$
Replacement Reserves per SF 5% of gross rent Surface Parking & Landscape 17,500$ /acre 53,297$
Soft Costs 665,890$
Architectural Design 2.00$ PSF 124,628$
Building Engineering 1.50$ PSF 93,471$
Civil Engineering 20,000$ /acre 60,911$
TAXES Landscape Architecture 7,500$ /acre 22,842$
Income Tax Rate 35% Plan Review Fees $400 + $25/1000 SF 1,958$
Capital Gains Tax Rate 15% Building Permit Dev Costs-500000/1000+1717 6,415$
Depreciation (Commercial) 39 years Water Capacity Fee 34,796$
Depreciation (Residential) 27.5 years Residential 50% of $980/unit 10,290$
Annual Comm. Depreciation 84,185$ Commercial Based on meter size 24,506$
Annual Resi. Depreciation 69,624$ Sewer Capacity Fee 35,195$
Total Annual Depreciation 153,809$ Residential 50% of $990/unit 10,395$
Commercial Based on meter size 24,800$
Fire Prevention Review Fee 275$
Contractor's Fee 5.00% of Hard + Sitework 285,399$
Subtotal 6,373,879$
Contingency 8% of Subtotal 509,910$
Development Costs (excluding land) 6,883,789$
Land Parcel 609,109$
Total Development Costs (including land) 7,492,898$
LOAN
LOAN DETAILS
LTV 70%
Loan Amount 5,245,029$
Equity 2,247,869$
Amortization Term (years) 20
Interest Rate 5.50%
Montly Payment ($36,080)

Annual Payment ($432,959)
LOAN 1 2 3 4 5 6 7 8 9 10
Beg Balance 5,245,029$ 5,096,848$ 4,940,309$ 4,774,940$ 4,600,243$ 4,415,692$ 4,220,730$ 4,014,771$ 3,797,195$ 3,567,345$
Debt Service ($432,959) ($432,959) ($432,959) ($432,959) ($432,959) ($432,959) ($432,959) ($432,959) ($432,959) ($432,959)
Interest 284,778$ 276,420$ 267,590$ 258,262$ 248,407$ 237,997$ 227,000$ 215,382$ 203,109$ 190,144$
Amortization 148,180$ 156,539$ 165,369$ 174,697$ 184,551$ 194,962$ 205,959$ 217,577$ 229,850$ 242,815$
End Balance 5,096,848$ 4,940,309$ 4,774,940$ 4,600,243$ 4,415,692$ 4,220,730$ 4,014,771$ 3,797,195$ 3,567,345$ 3,324,530$
SALESALE IN YR 10 SALE IN YR 5
Terminal Cap Rate (Year 10) 6% Year 11 NOI 340,138$ Year 6 NOI 293,406$
Terminal Cap Rate (Year 5) 6% Value at Terminal Cap Rate 5,668,973$ Value at Terminal Cap Rate 4,890,106$
Closing Costs 5% Cost of Sale (283,449)$ Cost of Sale (244,505)$
Replacement Reserves Net Sale Value 5,385,524$ Net Sale Value 4,645,600$
Development Cost 7,492,898$ Development Cost 7,492,898$
Capital Improvements 318,449$ Capital Improvements 147,479$
Accum. Depreciation 1,538,086$ Accum. Depreciation 769,043$
Net Book Value 9,349,433$ Net Book Value 8,409,421$
Capital Gain Tax Liability (3,963,909)$ Capital Gain Tax Liability (3,763,820)$
Capital Gains Tax Payable -$ Capital Gains Tax Payable -$
Net Sale Value 5,385,524$ Net Sale Value 4,645,600$
Less Loan Repayment (3,567,345)$ Less Loan Repayment (4,600,243)$
Less Capital Gains Tax -$ Less Capital Gains Tax -$
Net Cash from Sale 1,818,179$ Net Cash from Sale 45,357$
DISCOUNTED CASH FLOW 0 1 2 3 4 5 6 7 8 9 10 11
REVENUE
Residential 212,803$ 219,187$ 225,762$ 232,535$ 239,511$ 246,697$ 254,098$ 261,720$ 269,572$ 277,659$ 285,989$
Retail 342,766$ 353,049$ 363,641$ 374,550$ 385,786$ 397,360$ 409,281$ 421,559$ 434,206$ 447,232$ 460,649$
Office -$ -$ -$ -$ -$ -$ -$ -$ -$ -$ -$
Gross Rent 555,569$ 572,236$ 589,403$ 607,085$ 625,298$ 644,056$ 663,378$ 683,279$ 703,778$ 724,891$ 746,638$
EXPENSES
Operating 78,579$ 80,937$ 83,365$ 85,866$ 88,442$ 91,095$ 93,828$ 96,643$ 99,542$ 102,528$ 105,604$
Real Estate Taxes 102,645$ 105,725$ 108,896$ 112,163$ 115,528$ 118,994$ 122,564$ 126,241$ 130,028$ 133,929$ 137,947$
Insurance 93,471$ 96,275$ 99,163$ 102,138$ 105,202$ 108,359$ 111,609$ 114,958$ 118,406$ 121,958$ 125,617$
Replacement Reserves 27,778$ 28,612$ 29,470$ 30,354$ 31,265$ 32,203$ 33,169$ 34,164$ 35,189$ 36,245$ 37,332$
Total Expenses 302,474$ 311,548$ 320,895$ 330,521$ 340,437$ 350,650$ 361,170$ 372,005$ 383,165$ 394,660$ 406,500$
NOI 253,095$ 260,688$ 268,508$ 276,564$ 284,861$ 293,406$ 302,209$ 311,275$ 320,613$ 330,231$ 340,138$
FINANCING
Annual Debt Service ($432,959) ($432,959) ($432,959) ($432,959) ($432,959) ($432,959) ($432,959) ($432,959) ($432,959) ($432,959)
Interest 284,778$ 276,420$ 267,590$ 258,262$ 248,407$ 237,997$ 227,000$ 215,382$ 203,109$ 190,144$
Amortization 148,180$ 156,539$ 165,369$ 174,697$ 184,551$ 194,962$ 205,959$ 217,577$ 229,850$ 242,815$
CFAF ($179,864) ($172,271) ($164,450) ($156,395) ($148,098) ($139,552) ($130,750) ($121,684) (112,346)$ (102,727)$
TAXES
Add: Amortization 148,180$ 156,539$ 165,369$ 174,697$ 184,551$ 194,962$ 205,959$ 217,577$ 229,850$ 242,815$
Add: Replacement Reserves 27,778$ 28,612$ 29,470$ 30,354$ 31,265$ 32,203$ 33,169$ 34,164$ 35,189$ 36,245$
Less: Depreciation 153,809$ 153,809$ 153,809$ 153,809$ 153,809$ 153,809$ 153,809$ 153,809$ 153,809$ 153,809$
Taxable Income (157,713)$ (140,929)$ (123,420)$ (105,152)$ (86,090)$ (66,197)$ (45,431)$ (23,752)$ (1,116)$ 22,524$
Tax Payment (55,200)$ (49,325)$ (43,197)$ (36,803)$ (30,132)$ (23,169)$ (15,901)$ (8,313)$ (390)$ 7,883$
CFAT ($124,664) ($122,946) ($121,253) ($119,592) ($117,966) ($116,384) ($114,849) ($113,371) ($111,955) (110,611)$
Fully spent over hold period

Equity (2,247,869)$ 1,818,179$
Cash Return -6%
(7,492,898)$ 253,095$ 260,688$ 268,508$ 276,564$ 284,861$ 293,406$ 302,209$ 311,275$ 320,613$ 5,715,756$
(2,247,869)$ (179,864)$ (172,271)$ (164,450)$ (156,395)$ (148,098)$ (139,552)$ (130,750)$ (121,684)$ (112,346)$ 1,715,452$
(2,247,869)$ (124,664)$ (122,946)$ (121,253)$ (119,592)$ (117,966)$ (116,384)$ (114,849)$ (113,371)$ (111,955)$ 1,707,569$
Unleveraged IRR 1%
Leveraged IRR (before tax) -9%
Leveraged IRR (after tax) -8%
(7,492,898)$ 253,095$ 260,688$ 268,508$ 276,564$ 4,930,461$
(2,247,869)$ (179,864)$ (172,271)$ (164,450)$ (156,395)$ (102,741)$
(2,247,869)$ (124,664)$ (122,946)$ (121,253)$ (119,592)$ (72,609)$
Unleveraged IRR -5%
Leveraged IRR (before tax) #NUM!
Leveraged IRR (after tax) #NUM!
SALE IN YR 10
SALE IN YR 5

SCENARIO 1 (OFFICE) - PROJECT SUMMARY
PROJECT ASSUMPTIONS LIQUIDATION ASSUMPTIONS (Sale in Yr 10)
Development Costs 6,642,312$ Sale Cap Rate 6%
Land Price 609,109$ Sale Closing Costs 5%
Total Purchase Price 7,251,421$ Yr 11 NOI 355,997$
Net Cash from Sales 2,184,247$
FINANCING ASSUMPTIONS
Equity 2,175,426$
Loan 5,075,995$
Interest Rate 5.50%
GENERAL SITE INFORMATION
BUILDING SUMMARY SF Stories Total SF INCOME INFORMATION RESIDENTIAL INFORMATION
Building A 8,177 2 16,354 Area Median Family Income 55,300$ Vacancy 5%
Building B 7,597 2 15,194 Workforce (80% of Median) 44,240$ Absorption Rate (units/yr) N/A
Building C 4,938 1 4,938 Amount to be Spent on Housing 30% Efficiency Rate (apts) 80%
Building D 4,534 1 4,534 Funds Available for Housing 13,272$ Efficiency Rate (tnhms) 100%
Building E 4,996 1 4,996 Monthly Funds Avail. for Housing 1,106$ Price PSF for Apartments 1.05$
Building F 5,500 2 11,000
Building G 5,298 1 5,298
TOTAL SF 62,314
Townhomes -
TOTAL SF (including townhomes) 62,314
SITE SUMMARY SF Acres
TOTAL AREA 132,664 3.05
RETAIL SF OFFICE SF RESIDENTIAL (APTS) Average SF/Unit Units Total SF
Building A - Story 1 8,177 Building A - Story 2 8,177 Building A - Story 2 984 7 0
Building B - Story 1 7,597 Building B - Story 2 7,597 Building B - Story 2 979 6 0
Building C - Story 1 4,938 Building C - Story 2 0 Building C - Story 2 0 0 0
Building D - Story 1 4,534 Building D - Story 2 0 Building D - Story 2 875 4 0
Building E - Story 1 4,996 Building E - Story 2 0 Building E - Story 2 0 0 0
Building F - Story 1 5,500 Building F - Story 2 5,500 Building F - Story 2 1,254 4 0
Building G - Story 1 5,298 Building G - Story 2 0 Building G - Story 2 0 0 0
TOTAL RETAIL SF 41,040 TOTAL OFFICE SF 21,274 TOTAL RESIDENTIAL (APTS) 21 -
RETAIL OFFICE RESIDENTIAL Total SF Leaseable SF Monthly Rent
Total SF 41,040 Total SF 21,274 Building A 0
Efficiency Rate 80% Efficiency Rate 80% Unit 1 818 859$
Gross Leaseable SF 32,832 Gross Leaseable SF 17,019 Unit 2 840 882$
Average Rent Rate per SF 14.50$ Average Rent Rate per SF 15.50$ Unit 3 1331 1,398$
Unit 4 1026 1,077$
Unit 5 1026 1,077$
Unit 6 978 1,027$
Unit 7 868 911$
SUBTOTAL -$ -$
Building B 0
Unit 1 1,083 1,137$
Unit 2 981 1,030$
Unit 3 848 890$
Unit 4 956 1,004$
Unit 5 864 907$
Unit 6 1,142 1,199$
SUBTOTAL - -$
Building D 0
Unit 1 870 914$
Unit 2 825 866$
Unit 3 961 1,009$
PROJECT LEVERAGED IRR -5%

Unit 4 842 884$
SUBTOTAL - -$
Building F -
Unit 1 1,051 1,104$
Unit 2 1,400 1,470$
Unit 3 1,435 1,507$
Unit 4 1,131 1,188$
SUBTOTAL - -$
TOTALS - -$
REVENUE
RETAIL REVENUE OFFICE REVENUE RESIDENTIAL REVENUE
Annual Rent 380,851$ Annual Rent 263,798$ Total Monthly Rent 21 units -$
Vacancy Rate 10% Vacancy Rate 15% Annual Rent -$
Net Annual Rent 342,766$ Net Annual Rent 237,418$ Vacancy Rate 5%
Net Annual Rent -$
EXPENSES
EXPENSES Per SF Subtotal Total DEVELOPMENT COSTS Subtotal Total
Operating Expenses 93,471$ Hard Costs 4,985,120$
Retail Operating 1.50$ 61,560$ Retail 80$ PSF 3,283,200$
Office Operating 1.50$ 31,911$ Office 80$ PSF 1,701,920$
Apartment Operating 0.80$ -$ Apartment 90$ PSF -$
Property Taxes 1.3699% 99,337$ 99,337$ Site grading, prep, landscape 510,129$
Insurance 1.50$ 93,471$ Sitework 150,000$ /acre 456,832$
Replacement Reserves per SF 5% of gross rent Surface Parking & Landscape 17,500$ /acre 53,297$
Soft Costs 655,040$
Architectural Design 2.00$ PSF 124,628$
Building Engineering 1.50$ PSF 93,471$
Civil Engineering 20,000$ /acre 60,911$
TAXES Landscape Architecture 7,500$ /acre 22,842$
Income Tax Rate 35% Plan Review Fees $400 + $25/1000 SF 1,958$
Capital Gains Tax Rate 15% Building Permit Dev Costs-500000/1000+1717 6,202$
Depreciation (Commercial) 39 years Water Capacity Fee 34,796$
Depreciation (Residential) 27.5 years Residential 50% of $980/unit 10,290$
Annual Comm. Depreciation 127,824$ Commercial Based on meter size 24,506$
Annual Resi. Depreciation -$ Sewer Capacity Fee 35,195$
Total Annual Depreciation 127,824$ Residential 50% of $990/unit 10,395$
Commercial Based on meter size 24,800$
Fire Prevention Review Fee 275$
Contractor's Fee 5.00% of Hard + Sitework 274,762$
Subtotal 6,150,289$
Contingency 8% of Subtotal 492,023$
Development Costs (excluding land) 6,642,312$
Land Parcel 609,109$
Total Development Costs (including land) 7,251,421$
LOAN
LOAN DETAILS
LTV 70%
Loan Amount 5,075,995$
Equity 2,175,426$
Amortization Term (years) 20
Interest Rate 5.50%
Montly Payment ($34,917)

Annual Payment ($419,005)
LOAN 1 2 3 4 5 6 7 8 9 10
Beg Balance 5,075,995$ 4,932,590$ 4,781,096$ 4,621,056$ 4,451,989$ 4,273,385$ 4,084,707$ 3,885,386$ 3,674,821$ 3,452,379$
Debt Service ($419,005) ($419,005) ($419,005) ($419,005) ($419,005) ($419,005) ($419,005) ($419,005) ($419,005) ($419,005)
Interest 275,601$ 267,511$ 258,966$ 249,938$ 240,402$ 230,327$ 219,684$ 208,441$ 196,563$ 184,016$
Amortization 143,405$ 151,494$ 160,040$ 169,067$ 178,604$ 188,678$ 199,321$ 210,565$ 222,442$ 234,990$
End Balance 4,932,590$ 4,781,096$ 4,621,056$ 4,451,989$ 4,273,385$ 4,084,707$ 3,885,386$ 3,674,821$ 3,452,379$ 3,217,389$
SALESALE IN YR 10 SALE IN YR 5
Terminal Cap Rate (Year 10) 6% Year 11 NOI 355,997$ Year 6 NOI 307,086$
Terminal Cap Rate (Year 5) 6% Value at Terminal Cap Rate 5,933,290$ Value at Terminal Cap Rate 5,118,108$
Closing Costs 5% Cost of Sale (296,665)$ Cost of Sale (255,905)$
Replacement Reserves Net Sale Value 5,636,626$ Net Sale Value 4,862,203$
Development Cost 7,251,421$ Development Cost 7,251,421$
Capital Improvements 332,558$ Capital Improvements 154,014$
Accum. Depreciation 1,278,236$ Accum. Depreciation 639,118$
Net Book Value 8,862,215$ Net Book Value 8,044,553$
Capital Gain Tax Liability (3,225,590)$ Capital Gain Tax Liability (3,182,350)$
Capital Gains Tax Payable -$ Capital Gains Tax Payable -$
Net Sale Value 5,636,626$ Net Sale Value 4,862,203$
Less Loan Repayment (3,452,379)$ Less Loan Repayment (4,451,989)$
Less Capital Gains Tax -$ Less Capital Gains Tax -$
Net Cash from Sale 2,184,247$ Net Cash from Sale 410,214$
DISCOUNTED CASH FLOW 0 1 2 3 4 5 6 7 8 9 10 11
REVENUE
Residential -$ -$ -$ -$ -$ -$ -$ -$ -$ -$ -$
Retail 342,766$ 353,049$ 363,641$ 374,550$ 385,786$ 397,360$ 409,281$ 421,559$ 434,206$ 447,232$ 460,649$
Office 237,418$ 244,540$ 251,877$ 259,433$ 267,216$ 275,232$ 283,489$ 291,994$ 300,754$ 309,776$ 319,070$
Gross Rent 580,184$ 597,589$ 615,517$ 633,983$ 653,002$ 672,592$ 692,770$ 713,553$ 734,960$ 757,008$ 779,719$
EXPENSES
Operating 93,471$ 96,275$ 99,163$ 102,138$ 105,202$ 108,359$ 111,609$ 114,958$ 118,406$ 121,958$ 125,617$
Real Estate Taxes 99,337$ 102,317$ 105,387$ 108,548$ 111,805$ 115,159$ 118,614$ 122,172$ 125,837$ 129,613$ 133,501$
Insurance 93,471$ 96,275$ 99,163$ 102,138$ 105,202$ 108,359$ 111,609$ 114,958$ 118,406$ 121,958$ 125,617$
Replacement Reserves 29,009$ 29,879$ 30,776$ 31,699$ 32,650$ 33,630$ 34,638$ 35,678$ 36,748$ 37,850$ 38,986$
Total Expenses 315,288$ 324,747$ 334,489$ 344,524$ 354,860$ 365,506$ 376,471$ 387,765$ 399,398$ 411,380$ 423,721$
NOI 264,896$ 272,842$ 281,028$ 289,458$ 298,142$ 307,086$ 316,299$ 325,788$ 335,562$ 345,629$ 355,997$
FINANCING
Annual Debt Service ($419,005) ($419,005) ($419,005) ($419,005) ($419,005) ($419,005) ($419,005) ($419,005) ($419,005) ($419,005)
Interest 275,601$ 267,511$ 258,966$ 249,938$ 240,402$ 230,327$ 219,684$ 208,441$ 196,563$ 184,016$
Amortization 143,405$ 151,494$ 160,040$ 169,067$ 178,604$ 188,678$ 199,321$ 210,565$ 222,442$ 234,990$
CFAF ($154,110) ($146,163) ($137,978) ($129,547) ($120,863) ($111,919) ($102,706) ($93,217) (83,444)$ (73,377)$
TAXES
Add: Amortization 143,405$ 151,494$ 160,040$ 169,067$ 178,604$ 188,678$ 199,321$ 210,565$ 222,442$ 234,990$
Add: Replacement Reserves 29,009$ 29,879$ 30,776$ 31,699$ 32,650$ 33,630$ 34,638$ 35,678$ 36,748$ 37,850$
Less: Depreciation 127,824$ 127,824$ 127,824$ 127,824$ 127,824$ 127,824$ 127,824$ 127,824$ 127,824$ 127,824$
Taxable Income (109,519)$ (92,613)$ (74,986)$ (56,604)$ (37,433)$ (17,435)$ 3,430$ 25,201$ 47,923$ 71,640$
Tax Payment (38,332)$ (32,415)$ (26,245)$ (19,812)$ (13,102)$ (6,102)$ 1,200$ 8,820$ 16,773$ 25,074$
CFAT ($115,778) ($113,749) ($111,733) ($109,735) ($107,762) ($105,817) ($103,907) ($102,038) ($100,217) (98,451)$
Fully spent over hold period
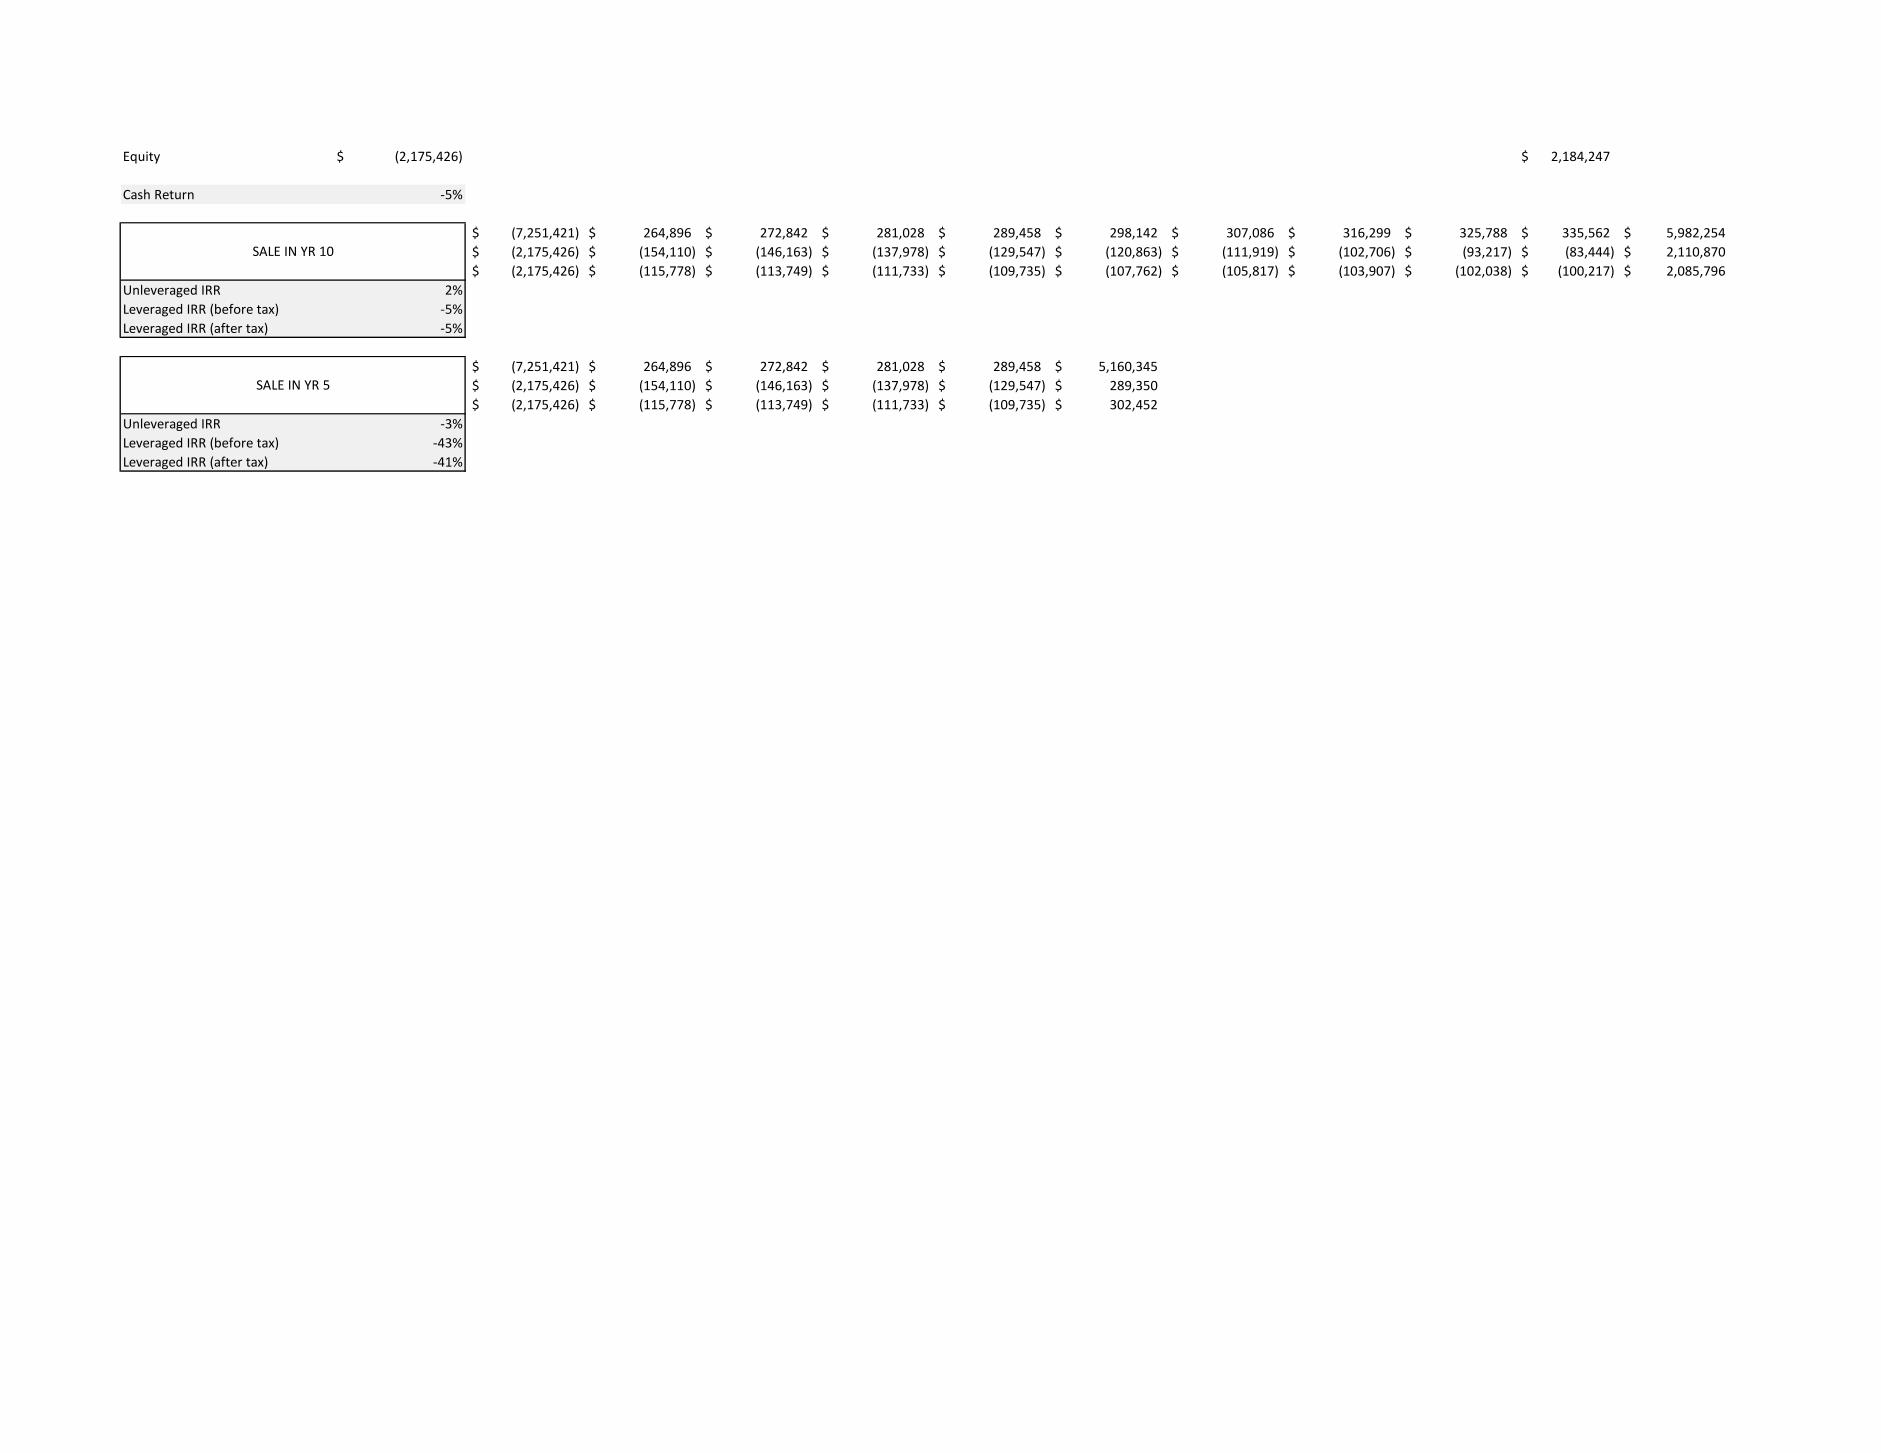
Equity (2,175,426)$ 2,184,247$
Cash Return -5%
(7,251,421)$ 264,896$ 272,842$ 281,028$ 289,458$ 298,142$ 307,086$ 316,299$ 325,788$ 335,562$ 5,982,254$
(2,175,426)$ (154,110)$ (146,163)$ (137,978)$ (129,547)$ (120,863)$ (111,919)$ (102,706)$ (93,217)$ (83,444)$ 2,110,870$
(2,175,426)$ (115,778)$ (113,749)$ (111,733)$ (109,735)$ (107,762)$ (105,817)$ (103,907)$ (102,038)$ (100,217)$ 2,085,796$
Unleveraged IRR 2%
Leveraged IRR (before tax) -5%
Leveraged IRR (after tax) -5%
(7,251,421)$ 264,896$ 272,842$ 281,028$ 289,458$ 5,160,345$
(2,175,426)$ (154,110)$ (146,163)$ (137,978)$ (129,547)$ 289,350$
(2,175,426)$ (115,778)$ (113,749)$ (111,733)$ (109,735)$ 302,452$
Unleveraged IRR -3%
Leveraged IRR (before tax) -43%
Leveraged IRR (after tax) -41%
SALE IN YR 10
SALE IN YR 5

SCENARIO 2 (APARTMENTS) - PROJECT SUMMARY
PROJECT ASSUMPTIONS LIQUIDATION ASSUMPTIONS (Sale in Yr 10)
Development Costs 6,497,761$ Sale Cap Rate 6%
Land Price 609,109$ Sale Closing Costs 5%
Total Purchase Price 7,106,871$ Yr 11 NOI 306,714$
Net Cash from Sales 1,472,745$
FINANCING ASSUMPTIONS
Equity 2,132,061$
Loan 4,974,809$
Interest Rate 5.50%
GENERAL SITE INFORMATION
BUILDING SUMMARY SF Stories Total SF INCOME INFORMATION RESIDENTIAL INFORMATION
Building A 8,177 1 8,177 Area Median Family Income 55,300$ Vacancy 5%
Building B 7,597 2 15,194 Workforce (80% of Median) 44,240$ Absorption Rate (units/yr) N/A
Building C 4,938 1 4,938 Amount to be Spent on Housing 30% Efficiency Rate (apts) 80%
Building D 4,534 2 9,068 Funds Available for Housing 13,272$ Efficiency Rate (tnhms) 100%
Building E 4,996 1 4,996 Monthly Funds Avail. for Housing 1,106$ Price PSF for Apartments 1.05$
Building F 5,500 2 11,000
Building G 5,298 1 5,298
TOTAL SF 58,671
Townhomes -
TOTAL SF (including townhomes) 58,671
SITE SUMMARY SF Acres
TOTAL AREA 132,664 3.05
RETAIL SF OFFICE SF RESIDENTIAL (APTS) Average SF/Unit Units Total SF
Building A - Story 1 8,177 Building A - Story 2 0 Building A - Story 2 984 7 0
Building B - Story 1 7,597 Building B - Story 2 0 Building B - Story 2 979 6 7,597
Building C - Story 1 4,938 Building C - Story 2 0 Building C - Story 2 0 0 0
Building D - Story 1 4,534 Building D - Story 2 0 Building D - Story 2 875 4 4,534
Building E - Story 1 4,996 Building E - Story 2 0 Building E - Story 2 0 0 0
Building F - Story 1 5,500 Building F - Story 2 0 Building F - Story 2 1,254 4 5,500
Building G - Story 1 5,298 Building G - Story 2 0 Building G - Story 2 0 0 0
TOTAL RETAIL SF 41,040 TOTAL OFFICE SF - TOTAL RESIDENTIAL (APTS) 21 17,631
RETAIL OFFICE RESIDENTIAL Total SF Leaseable SF Monthly Rent
Total SF 41,040 Total SF - Building A 0
Efficiency Rate 80% Efficiency Rate 80% Unit 1 818 859$
Gross Leaseable SF 32,832 Gross Leaseable SF - Unit 2 840 882$
Average Rent Rate per SF 14.50$ Average Rent Rate per SF 15.50$ Unit 3 1331 1,398$
Unit 4 1026 1,077$
Unit 5 1026 1,077$
Unit 6 978 1,027$
Unit 7 868 911$
SUBTOTAL -$ -$
Building B 7597
Unit 1 1,083 1,137$
Unit 2 981 1,030$
Unit 3 848 890$
Unit 4 956 1,004$
Unit 5 864 907$
Unit 6 1,142 1,199$
SUBTOTAL 5,874 6,168$
Building D 4534
Unit 1 870 914$
Unit 2 825 866$
Unit 3 961 1,009$
PROJECT LEVERAGED IRR -10%

Unit 4 842 884$
SUBTOTAL 3,498 3,673$
Building F 5,500
Unit 1 1,051 1,104$
Unit 2 1,400 1,470$
Unit 3 1,435 1,507$
Unit 4 1,131 1,188$
SUBTOTAL 5,017 5,268$
TOTALS 14,389 15,108$
REVENUE
RETAIL REVENUE OFFICE REVENUE RESIDENTIAL REVENUE
Annual Rent 380,851$ Annual Rent -$ Total Monthly Rent 21 units 15,108$
Vacancy Rate 10% Vacancy Rate 15% Annual Rent 181,301$
Net Annual Rent 342,766$ Net Annual Rent -$ Vacancy Rate 5%
Net Annual Rent 172,236$
EXPENSES
EXPENSES Per SF Subtotal Total DEVELOPMENT COSTS Subtotal Total
Operating Expenses 75,665$ Hard Costs 4,869,990$
Retail Operating 1.50$ 61,560$ Retail 80$ PSF 3,283,200$
Office Operating 1.50$ -$ Office 80$ PSF 0
Apartment Operating 0.80$ 14,105$ Apartment 90$ PSF 1,586,790$
Property Taxes 1.3699% 97,357$ 97,357$ Site grading, prep, landscape 510,129$
Insurance 1.50$ 88,007$ Sitework 150,000$ /acre 456,832$
Replacement Reserves per SF 5% of gross rent Surface Parking & Landscape 17,500$ /acre 53,297$
Soft Costs 636,327$
Architectural Design 2.00$ PSF 117,342$
Building Engineering 1.50$ PSF 88,007$
Civil Engineering 20,000$ /acre 60,911$
TAXES Landscape Architecture 7,500$ /acre 22,842$
Income Tax Rate 35% Plan Review Fees $400 + $25/1000 SF 1,867$
Capital Gains Tax Rate 15% Building Permit Dev Costs-500000/1000+1717 6,087$
Depreciation (Commercial) 39 years Water Capacity Fee 34,796$
Depreciation (Residential) 27.5 years Residential 50% of $980/unit 10,290$
Annual Comm. Depreciation 84,185$ Commercial Based on meter size 24,506$
Annual Resi. Depreciation 57,701$ Sewer Capacity Fee 35,195$
Total Annual Depreciation 141,886$ Residential 50% of $990/unit 10,395$
Commercial Based on meter size 24,800$
Fire Prevention Review Fee 275$
Contractor's Fee 5.00% of Hard + Sitework 269,006$
Subtotal 6,016,446$
Contingency 8% of Subtotal 481,316$
Development Costs (excluding land) 6,497,761$
Land Parcel 609,109$
Total Development Costs (including land) 7,106,871$
LOAN
LOAN DETAILS
LTV 70%
Loan Amount 4,974,809$
Equity 2,132,061$
Amortization Term (years) 20
Interest Rate 5.50%
Montly Payment ($34,221)

Annual Payment ($410,653)
LOAN 1 2 3 4 5 6 7 8 9 10
Beg Balance 4,974,809$ 4,834,263$ 4,685,789$ 4,528,940$ 4,363,243$ 4,188,199$ 4,003,282$ 3,807,934$ 3,601,567$ 3,383,559$
Debt Service ($410,653) ($410,653) ($410,653) ($410,653) ($410,653) ($410,653) ($410,653) ($410,653) ($410,653) ($410,653)
Interest 270,107$ 262,179$ 253,804$ 244,956$ 235,610$ 225,736$ 215,305$ 204,286$ 192,645$ 180,348$
Amortization 140,546$ 148,474$ 156,849$ 165,697$ 175,043$ 184,917$ 195,348$ 206,367$ 218,008$ 230,305$
End Balance 4,834,263$ 4,685,789$ 4,528,940$ 4,363,243$ 4,188,199$ 4,003,282$ 3,807,934$ 3,601,567$ 3,383,559$ 3,153,253$
SALESALE IN YR 10 SALE IN YR 5
Terminal Cap Rate (Year 10) 6% Year 11 NOI 306,714$ Year 6 NOI 264,574$
Terminal Cap Rate (Year 5) 6% Value at Terminal Cap Rate 5,111,899$ Value at Terminal Cap Rate 4,409,569$
Closing Costs 5% Cost of Sale (255,595)$ Cost of Sale (220,478)$
Replacement Reserves Net Sale Value 4,856,304$ Net Sale Value 4,189,090$
Development Cost 7,106,871$ Development Cost 7,106,871$
Capital Improvements 295,196$ Capital Improvements 136,711$
Accum. Depreciation 1,418,861$ Accum. Depreciation 709,430$
Net Book Value 8,820,928$ Net Book Value 7,953,012$
Capital Gain Tax Liability (3,964,624)$ Capital Gain Tax Liability (3,763,922)$
Capital Gains Tax Payable -$ Capital Gains Tax Payable -$
Net Sale Value 4,856,304$ Net Sale Value 4,189,090$
Less Loan Repayment (3,383,559)$ Less Loan Repayment (4,363,243)$
Less Capital Gains Tax -$ Less Capital Gains Tax -$
Net Cash from Sale 1,472,745$ Net Cash from Sale (174,152)$
DISCOUNTED CASH FLOW 0 1 2 3 4 5 6 7 8 9 10 11
REVENUE
Residential 172,236$ 177,403$ 182,726$ 188,207$ 193,854$ 199,669$ 205,659$ 211,829$ 218,184$ 224,729$ 231,471$
Retail 342,766$ 353,049$ 363,641$ 374,550$ 385,786$ 397,360$ 409,281$ 421,559$ 434,206$ 447,232$ 460,649$
Office -$ -$ -$ -$ -$ -$ -$ -$ -$ -$ -$
Gross Rent 515,002$ 530,452$ 546,366$ 562,757$ 579,640$ 597,029$ 614,940$ 633,388$ 652,390$ 671,961$ 692,120$
EXPENSES
Operating 75,665$ 77,935$ 80,273$ 82,681$ 85,161$ 87,716$ 90,348$ 93,058$ 95,850$ 98,725$ 101,687$
Real Estate Taxes 97,357$ 100,278$ 103,286$ 106,385$ 109,576$ 112,863$ 116,249$ 119,737$ 123,329$ 127,029$ 130,840$
Insurance 88,007$ 90,647$ 93,366$ 96,167$ 99,052$ 102,024$ 105,084$ 108,237$ 111,484$ 114,829$ 118,273$
Replacement Reserves 25,750$ 26,523$ 27,318$ 28,138$ 28,982$ 29,851$ 30,747$ 31,669$ 32,619$ 33,598$ 34,606$
Total Expenses 286,778$ 295,382$ 304,243$ 313,371$ 322,772$ 332,455$ 342,428$ 352,701$ 363,282$ 374,181$ 385,406$
NOI 228,224$ 235,071$ 242,123$ 249,386$ 256,868$ 264,574$ 272,511$ 280,687$ 289,107$ 297,781$ 306,714$
FINANCING
Annual Debt Service ($410,653) ($410,653) ($410,653) ($410,653) ($410,653) ($410,653) ($410,653) ($410,653) ($410,653) ($410,653)
Interest 270,107$ 262,179$ 253,804$ 244,956$ 235,610$ 225,736$ 215,305$ 204,286$ 192,645$ 180,348$
Amortization 140,546$ 148,474$ 156,849$ 165,697$ 175,043$ 184,917$ 195,348$ 206,367$ 218,008$ 230,305$
CFAF ($182,429) ($175,582) ($168,530) ($161,267) ($153,785) ($146,079) ($138,142) ($129,966) (121,546)$ (112,872)$
TAXES
Add: Amortization 140,546$ 148,474$ 156,849$ 165,697$ 175,043$ 184,917$ 195,348$ 206,367$ 218,008$ 230,305$
Add: Replacement Reserves 25,750$ 26,523$ 27,318$ 28,138$ 28,982$ 29,851$ 30,747$ 31,669$ 32,619$ 33,598$
Less: Depreciation 141,886$ 141,886$ 141,886$ 141,886$ 141,886$ 141,886$ 141,886$ 141,886$ 141,886$ 141,886$
Taxable Income (158,019)$ (142,472)$ (126,249)$ (109,318)$ (91,646)$ (73,196)$ (53,933)$ (33,816)$ (12,804)$ 9,145$
Tax Payment (55,307)$ (49,865)$ (44,187)$ (38,261)$ (32,076)$ (25,619)$ (18,876)$ (11,835)$ (4,481)$ 3,201$
CFAT ($127,122) ($125,717) ($124,343) ($123,005) ($121,709) ($120,460) ($119,265) ($118,131) ($117,064) (116,073)$
Fully spent over hold period

Equity (2,132,061)$ 1,472,745$
Cash Return -6%
(7,106,871)$ 228,224$ 235,071$ 242,123$ 249,386$ 256,868$ 264,574$ 272,511$ 280,687$ 289,107$ 5,154,084$
(2,132,061)$ (182,429)$ (175,582)$ (168,530)$ (161,267)$ (153,785)$ (146,079)$ (138,142)$ (129,966)$ (121,546)$ 1,359,873$
(2,132,061)$ (127,122)$ (125,717)$ (124,343)$ (123,005)$ (121,709)$ (120,460)$ (119,265)$ (118,131)$ (117,064)$ 1,356,672$
Unleveraged IRR 1%
Leveraged IRR (before tax) -12%
Leveraged IRR (after tax) -10%
(7,106,871)$ 228,224$ 235,071$ 242,123$ 249,386$ 4,445,958$
(2,132,061)$ (182,429)$ (175,582)$ (168,530)$ (161,267)$ (327,937)$
(2,132,061)$ (127,122)$ (125,717)$ (124,343)$ (123,005)$ (295,861)$
Unleveraged IRR -6%
Leveraged IRR (before tax) #NUM!
Leveraged IRR (after tax) #NUM!
SALE IN YR 10
SALE IN YR 5

SCENARIO 2 (OFFICE) - PROJECT SUMMARY
PROJECT ASSUMPTIONS LIQUIDATION ASSUMPTIONS (Sale in Yr 10)
Development Costs 6,297,635$ Sale Cap Rate 6%
Land Price 609,109$ Sale Closing Costs 5%
Total Purchase Price 6,906,745$ Yr 11 NOI 325,124$
Net Cash from Sales 1,859,525$
FINANCING ASSUMPTIONS
Equity 2,072,023$
Loan 4,834,721$
Interest Rate 5.50%
GENERAL SITE INFORMATION
BUILDING SUMMARY SF Stories Total SF INCOME INFORMATION RESIDENTIAL INFORMATION
Building A 8,177 1 8,177 Area Median Family Income 55,300$ Vacancy 5%
Building B 7,597 2 15,194 Workforce (80% of Median) 44,240$ Absorption Rate (units/yr) N/A
Building C 4,938 1 4,938 Amount to be Spent on Housing 30% Efficiency Rate (apts) 80%
Building D 4,534 2 9,068 Funds Available for Housing 13,272$ Efficiency Rate (tnhms) 100%
Building E 4,996 1 4,996 Monthly Funds Avail. for Housing 1,106$ Price PSF for Apartments 1.05$
Building F 5,500 2 11,000
Building G 5,298 1 5,298
TOTAL SF 58,671
Townhomes -
TOTAL SF (including townhomes) 58,671
SITE SUMMARY SF Acres
TOTAL AREA 132,664 3.05
RETAIL SF OFFICE SF RESIDENTIAL (APTS) Average SF/Unit Units Total SF
Building A - Story 1 8,177 Building A - Story 2 0 Building A - Story 2 984 7 0
Building B - Story 1 7,597 Building B - Story 2 7,597 Building B - Story 2 979 6 0
Building C - Story 1 4,938 Building C - Story 2 0 Building C - Story 2 0 0 0
Building D - Story 1 4,534 Building D - Story 2 4,534 Building D - Story 2 875 4 0
Building E - Story 1 4,996 Building E - Story 2 0 Building E - Story 2 0 0 0
Building F - Story 1 5,500 Building F - Story 2 5,500 Building F - Story 2 1,254 4 0
Building G - Story 1 5,298 Building G - Story 2 0 Building G - Story 2 0 0 0
TOTAL RETAIL SF 41,040 TOTAL OFFICE SF 17,631 TOTAL RESIDENTIAL (APTS) 21 -
RETAIL OFFICE RESIDENTIAL Total SF Leaseable SF Monthly Rent
Total SF 41,040 Total SF 17,631 Building A 0
Efficiency Rate 80% Efficiency Rate 80% Unit 1 818 859$
Gross Leaseable SF 32,832 Gross Leaseable SF 14,105 Unit 2 840 882$
Average Rent Rate per SF 14.50$ Average Rent Rate per SF 15.50$ Unit 3 1331 1,398$
Unit 4 1026 1,077$
Unit 5 1026 1,077$
Unit 6 978 1,027$
Unit 7 868 911$
SUBTOTAL -$ -$
Building B 0
Unit 1 1,083 1,137$
Unit 2 981 1,030$
Unit 3 848 890$
Unit 4 956 1,004$
Unit 5 864 907$
Unit 6 1,142 1,199$
SUBTOTAL - -$
Building D 0
Unit 1 870 914$
Unit 2 825 866$
Unit 3 961 1,009$
PROJECT LEVERAGED IRR -7%

Unit 4 842 884$
SUBTOTAL - -$
Building F -
Unit 1 1,051 1,104$
Unit 2 1,400 1,470$
Unit 3 1,435 1,507$
Unit 4 1,131 1,188$
SUBTOTAL - -$
TOTALS - -$
REVENUE
RETAIL REVENUE OFFICE REVENUE RESIDENTIAL REVENUE
Annual Rent 380,851$ Annual Rent 218,624.40$ Total Monthly Rent 21 units -$
Vacancy Rate 10% Vacancy Rate 15% Annual Rent -$
Net Annual Rent 342,766$ Net Annual Rent 196,761.96$ Vacancy Rate 5%
Net Annual Rent -$
EXPENSES
EXPENSES Per SF Subtotal Total DEVELOPMENT COSTS Subtotal Total
Operating Expenses 88,007$ Hard Costs 4,693,680$
Retail Operating 1.50$ 61,560$ Retail 80$ PSF 3,283,200$
Office Operating 1.50$ 26,447$ Office 80$ PSF 1410480
Apartment Operating 0.80$ -$ Apartment 90$ PSF -$
Property Taxes 1.3699% 94,615$ 94,615$ Site grading, prep, landscape 510,129$
Insurance 1.50$ 88,007$ Sitework 150,000$ /acre 456,832$
Replacement Reserves per SF 5% of gross rent Surface Parking & Landscape 17,500$ /acre 53,297$
Soft Costs 627,335$
Architectural Design 2.00$ PSF 117,342$
Building Engineering 1.50$ PSF 88,007$
Civil Engineering 20,000$ /acre 60,911$
TAXES Landscape Architecture 7,500$ /acre 22,842$
Income Tax Rate 35% Plan Review Fees $400 + $25/1000 SF 1,867$
Capital Gains Tax Rate 15% Building Permit Dev Costs-500000/1000+1717 5,911$
Depreciation (Commercial) 39 years Water Capacity Fee 34,796$
Depreciation (Residential) 27.5 years Residential 50% of $980/unit 10,290$
Annual Comm. Depreciation 120,351$ Commercial Based on meter size 24,506$
Annual Resi. Depreciation -$ Sewer Capacity Fee 35,195$
Total Annual Depreciation 120,351$ Residential 50% of $990/unit 10,395$
Commercial Based on meter size 24,800$
Fire Prevention Review Fee 275$
Contractor's Fee 5.00% of Hard + Sitework 260,190$
Subtotal 5,831,144$
Contingency 8% of Subtotal 466,492$
Development Costs (excluding land) 6,297,635$
Land Parcel 609,109$
Total Development Costs (including land) 6,906,745$
LOAN
LOAN DETAILS
LTV 70%
Loan Amount 4,834,721$
Equity 2,072,023$
Amortization Term (years) 20
Interest Rate 5.50%
Montly Payment ($33,257)
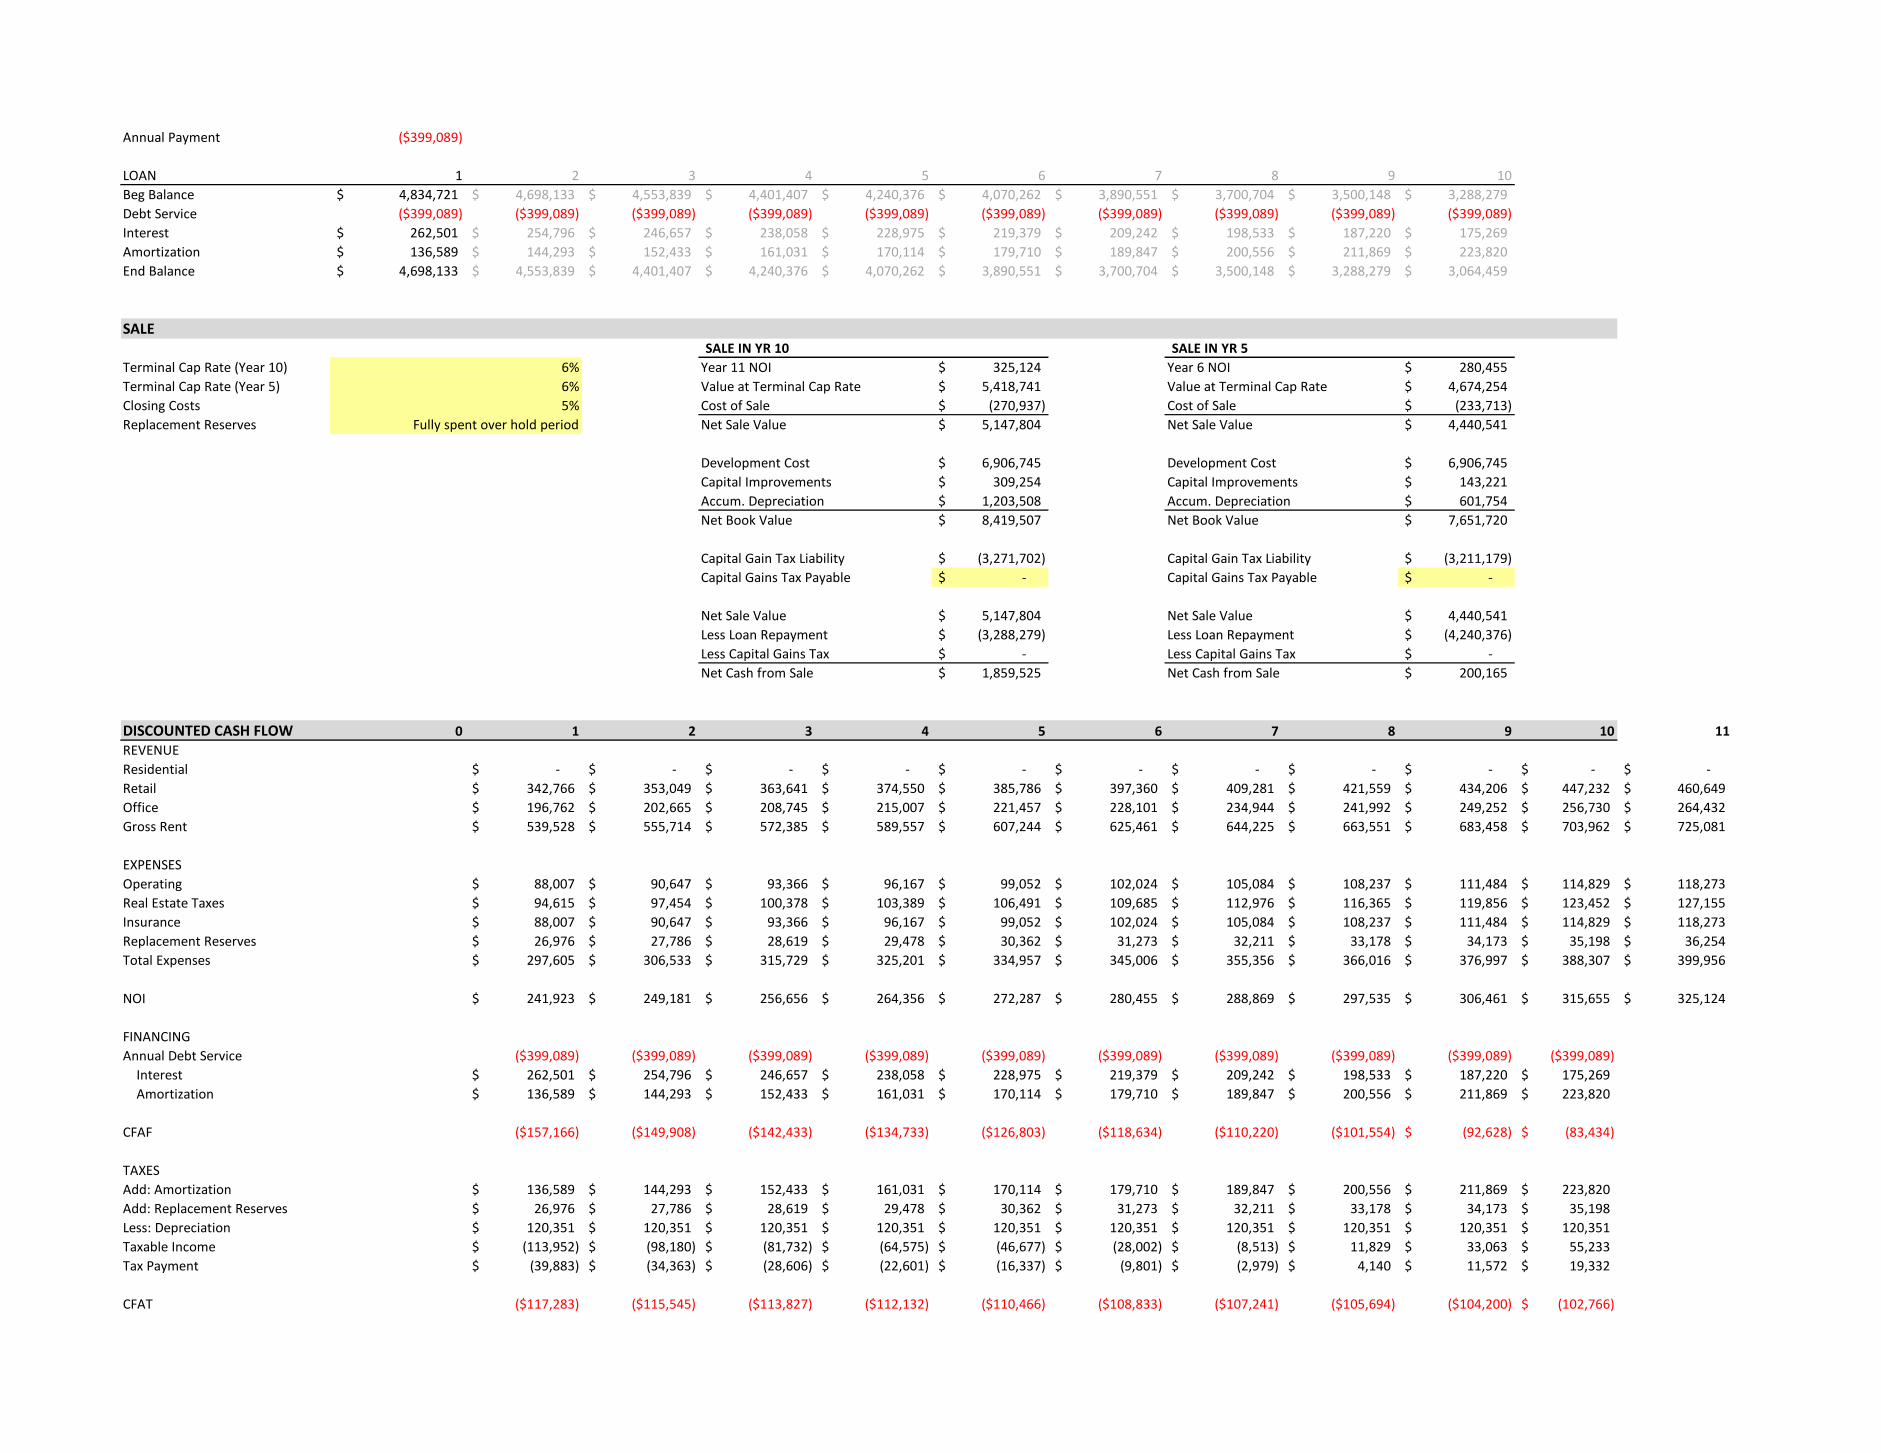
Annual Payment ($399,089)
LOAN 1 2 3 4 5 6 7 8 9 10
Beg Balance 4,834,721$ 4,698,133$ 4,553,839$ 4,401,407$ 4,240,376$ 4,070,262$ 3,890,551$ 3,700,704$ 3,500,148$ 3,288,279$
Debt Service ($399,089) ($399,089) ($399,089) ($399,089) ($399,089) ($399,089) ($399,089) ($399,089) ($399,089) ($399,089)
Interest 262,501$ 254,796$ 246,657$ 238,058$ 228,975$ 219,379$ 209,242$ 198,533$ 187,220$ 175,269$
Amortization 136,589$ 144,293$ 152,433$ 161,031$ 170,114$ 179,710$ 189,847$ 200,556$ 211,869$ 223,820$
End Balance 4,698,133$ 4,553,839$ 4,401,407$ 4,240,376$ 4,070,262$ 3,890,551$ 3,700,704$ 3,500,148$ 3,288,279$ 3,064,459$
SALESALE IN YR 10 SALE IN YR 5
Terminal Cap Rate (Year 10) 6% Year 11 NOI 325,124$ Year 6 NOI 280,455$
Terminal Cap Rate (Year 5) 6% Value at Terminal Cap Rate 5,418,741$ Value at Terminal Cap Rate 4,674,254$
Closing Costs 5% Cost of Sale (270,937)$ Cost of Sale (233,713)$
Replacement Reserves Net Sale Value 5,147,804$ Net Sale Value 4,440,541$
Development Cost 6,906,745$ Development Cost 6,906,745$
Capital Improvements 309,254$ Capital Improvements 143,221$
Accum. Depreciation 1,203,508$ Accum. Depreciation 601,754$
Net Book Value 8,419,507$ Net Book Value 7,651,720$
Capital Gain Tax Liability (3,271,702)$ Capital Gain Tax Liability (3,211,179)$
Capital Gains Tax Payable -$ Capital Gains Tax Payable -$
Net Sale Value 5,147,804$ Net Sale Value 4,440,541$
Less Loan Repayment (3,288,279)$ Less Loan Repayment (4,240,376)$
Less Capital Gains Tax -$ Less Capital Gains Tax -$
Net Cash from Sale 1,859,525$ Net Cash from Sale 200,165$
DISCOUNTED CASH FLOW 0 1 2 3 4 5 6 7 8 9 10 11
REVENUE
Residential -$ -$ -$ -$ -$ -$ -$ -$ -$ -$ -$
Retail 342,766$ 353,049$ 363,641$ 374,550$ 385,786$ 397,360$ 409,281$ 421,559$ 434,206$ 447,232$ 460,649$
Office 196,762$ 202,665$ 208,745$ 215,007$ 221,457$ 228,101$ 234,944$ 241,992$ 249,252$ 256,730$ 264,432$
Gross Rent 539,528$ 555,714$ 572,385$ 589,557$ 607,244$ 625,461$ 644,225$ 663,551$ 683,458$ 703,962$ 725,081$
EXPENSES
Operating 88,007$ 90,647$ 93,366$ 96,167$ 99,052$ 102,024$ 105,084$ 108,237$ 111,484$ 114,829$ 118,273$
Real Estate Taxes 94,615$ 97,454$ 100,378$ 103,389$ 106,491$ 109,685$ 112,976$ 116,365$ 119,856$ 123,452$ 127,155$
Insurance 88,007$ 90,647$ 93,366$ 96,167$ 99,052$ 102,024$ 105,084$ 108,237$ 111,484$ 114,829$ 118,273$
Replacement Reserves 26,976$ 27,786$ 28,619$ 29,478$ 30,362$ 31,273$ 32,211$ 33,178$ 34,173$ 35,198$ 36,254$
Total Expenses 297,605$ 306,533$ 315,729$ 325,201$ 334,957$ 345,006$ 355,356$ 366,016$ 376,997$ 388,307$ 399,956$
NOI 241,923$ 249,181$ 256,656$ 264,356$ 272,287$ 280,455$ 288,869$ 297,535$ 306,461$ 315,655$ 325,124$
FINANCING
Annual Debt Service ($399,089) ($399,089) ($399,089) ($399,089) ($399,089) ($399,089) ($399,089) ($399,089) ($399,089) ($399,089)
Interest 262,501$ 254,796$ 246,657$ 238,058$ 228,975$ 219,379$ 209,242$ 198,533$ 187,220$ 175,269$
Amortization 136,589$ 144,293$ 152,433$ 161,031$ 170,114$ 179,710$ 189,847$ 200,556$ 211,869$ 223,820$
CFAF ($157,166) ($149,908) ($142,433) ($134,733) ($126,803) ($118,634) ($110,220) ($101,554) (92,628)$ (83,434)$
TAXES
Add: Amortization 136,589$ 144,293$ 152,433$ 161,031$ 170,114$ 179,710$ 189,847$ 200,556$ 211,869$ 223,820$
Add: Replacement Reserves 26,976$ 27,786$ 28,619$ 29,478$ 30,362$ 31,273$ 32,211$ 33,178$ 34,173$ 35,198$
Less: Depreciation 120,351$ 120,351$ 120,351$ 120,351$ 120,351$ 120,351$ 120,351$ 120,351$ 120,351$ 120,351$
Taxable Income (113,952)$ (98,180)$ (81,732)$ (64,575)$ (46,677)$ (28,002)$ (8,513)$ 11,829$ 33,063$ 55,233$
Tax Payment (39,883)$ (34,363)$ (28,606)$ (22,601)$ (16,337)$ (9,801)$ (2,979)$ 4,140$ 11,572$ 19,332$
CFAT ($117,283) ($115,545) ($113,827) ($112,132) ($110,466) ($108,833) ($107,241) ($105,694) ($104,200) (102,766)$
Fully spent over hold period

Equity (2,072,023)$ 1,859,525$
Cash Return -6%
(6,906,745)$ 241,923$ 249,181$ 256,656$ 264,356$ 272,287$ 280,455$ 288,869$ 297,535$ 306,461$ 5,463,459$
(2,072,023)$ (157,166)$ (149,908)$ (142,433)$ (134,733)$ (126,803)$ (118,634)$ (110,220)$ (101,554)$ (92,628)$ 1,776,091$
(2,072,023)$ (117,283)$ (115,545)$ (113,827)$ (112,132)$ (110,466)$ (108,833)$ (107,241)$ (105,694)$ (104,200)$ 1,756,759$
Unleveraged IRR 2%
Leveraged IRR (before tax) -7%
Leveraged IRR (after tax) -7%
(6,906,745)$ 241,923$ 249,181$ 256,656$ 264,356$ 4,712,828$
(2,072,023)$ (157,166)$ (149,908)$ (142,433)$ (134,733)$ 73,363$
(2,072,023)$ (117,283)$ (115,545)$ (113,827)$ (112,132)$ 89,699$
Unleveraged IRR -4%
Leveraged IRR (before tax) -67%
Leveraged IRR (after tax) -61%
SALE IN YR 10
SALE IN YR 5

SCENARIO 3 (APARTMENTS) - PROJECT SUMMARY
PROJECT ASSUMPTIONS LIQUIDATION ASSUMPTIONS (Sale in Yr 10)
Development Costs 5,212,310$ Sale Cap Rate 6%
Land Price 609,109$ Sale Closing Costs 5%
Total Purchase Price 5,821,419$ Yr 11 NOI 224,650$
Net Cash from Sales 785,405$
FINANCING ASSUMPTIONS
Equity 1,746,426$
Loan 4,074,993$
Interest Rate 5.50%
GENERAL SITE INFORMATION
BUILDING SUMMARY SF Stories Total SF INCOME INFORMATION RESIDENTIAL INFORMATION
Building A 8177 1 8177 Area Median Family Income 55,300$ Vacancy 5%
Building B 7597 1 7597 Workforce (80% of Median) 44,240$ Absorption Rate (units/yr) N/A
Building C 4938 1 4938 Amount to be Spent on Housing 30% Efficiency Rate (apts) 80%
Building D 4534 1 4534 Funds Available for Housing 13,272$ Efficiency Rate (tnhms) 100%
Building E 4996 1 4996 Monthly Funds Avail. for Housing 1,106$ Price PSF for Apartments 1.05$
Building F 5500 2 11000
Building G 5298 1 5298
TOTAL SF 46,540
Townhomes -
TOTAL SF (including townhomes) 46,540
SITE SUMMARY SF Acres
TOTAL AREA 132,664 3.05
RETAIL SF OFFICE SF RESIDENTIAL (APTS) Average SF/Unit Units Total SF
Building A - Story 1 8,177 Building A - Story 2 0 Building A - Story 2 984 7 0
Building B - Story 1 7,597 Building B - Story 2 0 Building B - Story 2 979 6 0
Building C - Story 1 4,938 Building C - Story 2 0 Building C - Story 2 0 0 0
Building D - Story 1 4,534 Building D - Story 2 0 Building D - Story 2 875 4 0
Building E - Story 1 4,996 Building E - Story 2 0 Building E - Story 2 0 0 0
Building F - Story 1 5,500 Building F - Story 2 0 Building F - Story 2 1,254 4 5,500
Building G - Story 1 5,298 Building G - Story 2 0 Building G - Story 2 0 0 0
TOTAL RETAIL SF 41,040 TOTAL OFFICE SF - TOTAL RESIDENTIAL (APTS) 21 5,500
RETAIL OFFICE RESIDENTIAL Total SF Leaseable SF Monthly Rent
Total SF 41,040 Total SF - Building A 0
Efficiency Rate 80% Efficiency Rate 80% Unit 1 818 859$
Gross Leaseable SF 32,832 Gross Leaseable SF - Unit 2 840 882$
Average Rent Rate per SF 14.50$ Average Rent Rate per SF 15.50$ Unit 3 1331 1,398$
Unit 4 1026 1,077$
Unit 5 1026 1,077$
Unit 6 978 1,027$
Unit 7 868 911$
SUBTOTAL -$ -$
Building B 0
Unit 1 1,083 1,137$
Unit 2 981 1,030$
Unit 3 848 890$
Unit 4 956 1,004$
Unit 5 864 907$
Unit 6 1,142 1,199$
SUBTOTAL - -$
Building D 0
Unit 1 870 914$
Unit 2 825 866$
Unit 3 961 1,009$
PROJECT LEVERAGED IRR -18%

Unit 4 842 884$
SUBTOTAL - -$
Building F 5,500
Unit 1 1,051 1,104$
Unit 2 1,400 1,470$
Unit 3 1,435 1,507$
Unit 4 1,131 1,188$
SUBTOTAL 5,017 5,268$
TOTALS 5,017 5,268$
REVENUE
RETAIL REVENUE OFFICE REVENUE RESIDENTIAL REVENUE
Annual Rent 380,851$ Annual Rent -$ Total Monthly Rent 21 units 5,268$
Vacancy Rate 10% Vacancy Rate 15% Annual Rent 63,214$
Net Annual Rent 342,766$ Net Annual Rent -$ Vacancy Rate 5%
Net Annual Rent 60,053$
EXPENSES
EXPENSES Per SF Subtotal Total DEVELOPMENT COSTS Subtotal Total
Operating Expenses 65,960$ Hard Costs 3,778,200$
Retail Operating 1.50$ 61,560$ Retail 80$ PSF 3,283,200$
Office Operating 1.50$ -$ Office 80$ PSF 0
Apartment Operating 0.80$ 4,400$ Apartment 90$ PSF 495,000$
Property Taxes 1.3699% 79,748$ 79,748$ Site grading, prep, landscape 510,129$
Insurance 1.50$ 69,810$ Sitework 150,000$ /acre 456,832$
Replacement Reserves per SF 5% of gross rent Surface Parking & Landscape 17,500$ /acre 53,297$
Soft Costs 537,884$
Architectural Design 2.00$ PSF 93,080$
Building Engineering 1.50$ PSF 69,810$
Civil Engineering 20,000$ /acre 60,911$
TAXES Landscape Architecture 7,500$ /acre 22,842$
Income Tax Rate 35% Plan Review Fees $400 + $25/1000 SF 1,564$
Capital Gains Tax Rate 15% Building Permit Dev Costs-500000/1000+1717 4,995$
Depreciation (Commercial) 39 years Water Capacity Fee 34,796$
Depreciation (Residential) 27.5 years Residential 50% of $980/unit 10,290$
Annual Comm. Depreciation 84,185$ Commercial Based on meter size 24,506$
Annual Resi. Depreciation 18,000$ Sewer Capacity Fee 35,195$
Total Annual Depreciation 102,185$ Residential 50% of $990/unit 10,395$
Commercial Based on meter size 24,800$
Fire Prevention Review Fee 275$
Contractor's Fee 5.00% of Hard + Sitework 214,416$
Subtotal 4,826,213$
Contingency 8% of Subtotal 386,097$
Development Costs (excluding land) 5,212,310$
Land Parcel 609,109$
Total Development Costs (including land) 5,821,419$
LOAN
LOAN DETAILS
LTV 70%
Loan Amount 4,074,993$
Equity 1,746,426$
Amortization Term (years) 20
Interest Rate 5.50%
Montly Payment ($28,031)

Annual Payment ($336,376)
LOAN 1 2 3 4 5 6 7 8 9 10
Beg Balance 4,074,993$ 3,959,868$ 3,838,249$ 3,709,770$ 3,574,043$ 3,430,661$ 3,279,190$ 3,119,176$ 2,950,135$ 2,771,559$
Debt Service ($336,376) ($336,376) ($336,376) ($336,376) ($336,376) ($336,376) ($336,376) ($336,376) ($336,376) ($336,376)
Interest 221,251$ 214,757$ 207,897$ 200,650$ 192,994$ 184,906$ 176,362$ 167,336$ 157,800$ 147,727$
Amortization 115,125$ 121,619$ 128,479$ 135,727$ 143,383$ 151,470$ 160,015$ 169,041$ 178,576$ 188,649$
End Balance 3,959,868$ 3,838,249$ 3,709,770$ 3,574,043$ 3,430,661$ 3,279,190$ 3,119,176$ 2,950,135$ 2,771,559$ 2,582,910$
SALESALE IN YR 10 SALE IN YR 5
Terminal Cap Rate (Year 10) 6% Year 11 NOI 224,650$ Year 6 NOI 193,785$
Terminal Cap Rate (Year 5) 6% Value at Terminal Cap Rate 3,744,173$ Value at Terminal Cap Rate 3,229,756$
Closing Costs 5% Cost of Sale (187,209)$ Cost of Sale (161,488)$
Replacement Reserves Net Sale Value 3,556,964$ Net Sale Value 3,068,269$
Development Cost 5,821,419$ Development Cost 5,821,419$
Capital Improvements 230,894$ Capital Improvements 106,931$
Accum. Depreciation 1,021,846$ Accum. Depreciation 510,923$
Net Book Value 7,074,159$ Net Book Value 6,439,273$
Capital Gain Tax Liability (3,517,195)$ Capital Gain Tax Liability (3,371,005)$
Capital Gains Tax Payable -$ Capital Gains Tax Payable -$
Net Sale Value 3,556,964$ Net Sale Value 3,068,269$
Less Loan Repayment (2,771,559)$ Less Loan Repayment (3,574,043)$
Less Capital Gains Tax -$ Less Capital Gains Tax -$
Net Cash from Sale 785,405$ Net Cash from Sale (505,775)$
DISCOUNTED CASH FLOW 0 1 2 3 4 5 6 7 8 9 10 11
REVENUE
Residential 60,053$ 61,855$ 63,711$ 65,622$ 67,591$ 69,618$ 71,707$ 73,858$ 76,074$ 78,356$ 80,707$
Retail 342,766$ 353,049$ 363,641$ 374,550$ 385,786$ 397,360$ 409,281$ 421,559$ 434,206$ 447,232$ 460,649$
Office -$ -$ -$ -$ -$ -$ -$ -$ -$ -$ -$
Gross Rent 402,820$ 414,904$ 427,351$ 440,172$ 453,377$ 466,978$ 480,988$ 495,417$ 510,280$ 525,588$ 541,356$
EXPENSES
Operating 65,960$ 67,939$ 69,977$ 72,076$ 74,239$ 76,466$ 78,760$ 81,122$ 83,556$ 86,063$ 88,645$
Real Estate Taxes 79,748$ 82,140$ 84,604$ 87,142$ 89,757$ 92,449$ 95,223$ 98,080$ 101,022$ 104,053$ 107,174$
Insurance 69,810$ 71,904$ 74,061$ 76,283$ 78,572$ 80,929$ 83,357$ 85,857$ 88,433$ 91,086$ 93,819$
Replacement Reserves 20,141$ 20,745$ 21,368$ 22,009$ 22,669$ 23,349$ 24,049$ 24,771$ 25,514$ 26,279$ 27,068$
Total Expenses 235,659$ 242,728$ 250,010$ 257,511$ 265,236$ 273,193$ 281,389$ 289,830$ 298,525$ 307,481$ 316,705$
NOI 167,161$ 172,176$ 177,341$ 182,661$ 188,141$ 193,785$ 199,599$ 205,587$ 211,755$ 218,107$ 224,650$
FINANCING
Annual Debt Service ($336,376) ($336,376) ($336,376) ($336,376) ($336,376) ($336,376) ($336,376) ($336,376) ($336,376) ($336,376)
Interest 221,251$ 214,757$ 207,897$ 200,650$ 192,994$ 184,906$ 176,362$ 167,336$ 157,800$ 147,727$
Amortization 115,125$ 121,619$ 128,479$ 135,727$ 143,383$ 151,470$ 160,015$ 169,041$ 178,576$ 188,649$
CFAF ($169,215) ($164,201) ($159,035) ($153,715) ($148,235) ($142,591) ($136,777) ($130,789) (124,622)$ (118,269)$
TAXES
Add: Amortization 115,125$ 121,619$ 128,479$ 135,727$ 143,383$ 151,470$ 160,015$ 169,041$ 178,576$ 188,649$
Add: Replacement Reserves 20,141$ 20,745$ 21,368$ 22,009$ 22,669$ 23,349$ 24,049$ 24,771$ 25,514$ 26,279$
Less: Depreciation 102,185$ 102,185$ 102,185$ 102,185$ 102,185$ 102,185$ 102,185$ 102,185$ 102,185$ 102,185$
Taxable Income (136,134)$ (124,021)$ (111,373)$ (98,165)$ (84,368)$ (69,956)$ (54,898)$ (39,162)$ (22,717)$ (5,525)$
Tax Payment (47,647)$ (43,407)$ (38,981)$ (34,358)$ (29,529)$ (24,485)$ (19,214)$ (13,707)$ (7,951)$ (1,934)$
CFAT ($121,568) ($120,793) ($120,055) ($119,357) ($118,706) ($118,106) ($117,563) ($117,083) ($116,671) (116,335)$
Fully spent over hold period

Equity (1,746,426)$ 785,405$
Cash Return -7%
(5,821,419)$ 167,161$ 172,176$ 177,341$ 182,661$ 188,141$ 193,785$ 199,599$ 205,587$ 211,755$ 3,775,071$
(1,746,426)$ (169,215)$ (164,201)$ (159,035)$ (153,715)$ (148,235)$ (142,591)$ (136,777)$ (130,789)$ (124,622)$ 667,136$
(1,746,426)$ (121,568)$ (120,793)$ (120,055)$ (119,357)$ (118,706)$ (118,106)$ (117,563)$ (117,083)$ (116,671)$ 669,070$
Unleveraged IRR -1%
Leveraged IRR (before tax) -20%
Leveraged IRR (after tax) -18%
(5,821,419)$ 167,161$ 172,176$ 177,341$ 182,661$ 3,256,410$
(1,746,426)$ (169,215)$ (164,201)$ (159,035)$ (153,715)$ (654,010)$
(1,746,426)$ (121,568)$ (120,793)$ (120,055)$ (119,357)$ (624,481)$
Unleveraged IRR -8%
Leveraged IRR (before tax) #NUM!
Leveraged IRR (after tax) #NUM!
SALE IN YR 10
SALE IN YR 5

SCENARIO 3 (OFFICE) - PROJECT SUMMARY
PROJECT ASSUMPTIONS LIQUIDATION ASSUMPTIONS (Sale in Yr 10)
Development Costs 5,149,880$ Sale Cap Rate 6%
Land Price 609,109$ Sale Closing Costs 5%
Total Purchase Price 5,758,990$ Yr 11 NOI 222,319$
Net Cash from Sales 778,218$
FINANCING ASSUMPTIONS
Equity 1,727,697$
Loan 4,031,293$
Interest Rate 5.50%
GENERAL SITE INFORMATION
BUILDING SUMMARY SF Stories Total SF INCOME INFORMATION RESIDENTIAL INFORMATION
Building A 8177 1 8177 Area Median Family Income 55,300$ Vacancy 5%
Building B 7597 1 7597 Workforce (80% of Median) 44,240$ Absorption Rate (units/yr) N/A
Building C 4938 1 4938 Amount to be Spent on Housing 30% Efficiency Rate (apts) 80%
Building D 4534 1 4534 Funds Available for Housing 13,272$ Efficiency Rate (tnhms) 100%
Building E 4996 1 4996 Monthly Funds Avail. for Housing 1,106$ Price PSF for Apartments 1.05$
Building F 5500 2 11000
Building G 5298 1 5298
TOTAL SF 46,540
Townhomes -
TOTAL SF (including townhomes) 46,540
SITE SUMMARY SF Acres
TOTAL AREA 132,664 3.05
RETAIL SF OFFICE SF RESIDENTIAL (APTS) Average SF/Unit Units Total SF
Building A - Story 1 8,177 Building A - Story 2 0 Building A - Story 2 984 7 0
Building B - Story 1 7,597 Building B - Story 2 0 Building B - Story 2 979 6 0
Building C - Story 1 4,938 Building C - Story 2 0 Building C - Story 2 0 0 0
Building D - Story 1 4,534 Building D - Story 2 0 Building D - Story 2 875 4 0
Building E - Story 1 4,996 Building E - Story 2 0 Building E - Story 2 0 0 0
Building F - Story 1 5,500 Building F - Story 2 5500 Building F - Story 2 1,254 4 -
Building G - Story 1 5,298 Building G - Story 2 0 Building G - Story 2 0 0 0
TOTAL RETAIL SF 41,040 TOTAL OFFICE SF 5,500 TOTAL RESIDENTIAL (APTS) 21 -
RETAIL OFFICE RESIDENTIAL Total SF Leaseable SF Monthly Rent
Total SF 41,040 Total SF 5,500 Building A 0
Efficiency Rate 80% Efficiency Rate 80% Unit 1 818 859$
Gross Leaseable SF 32,832 Gross Leaseable SF 4,400 Unit 2 840 882$
Average Rent Rate per SF 14.50$ Average Rent Rate per SF 15.50$ Unit 3 1331 1,398$
Unit 4 1026 1,077$
Unit 5 1026 1,077$
Unit 6 978 1,027$
Unit 7 868 911$
SUBTOTAL -$ -$
Building B 0
Unit 1 1,083 1,137$
Unit 2 981 1,030$
Unit 3 848 890$
Unit 4 956 1,004$
Unit 5 864 907$
Unit 6 1,142 1,199$
SUBTOTAL - -$
Building D 0
Unit 1 870 914$
Unit 2 825 866$
Unit 3 961 1,009$
PROJECT LEVERAGED IRR -19%

Unit 4 842 884$
SUBTOTAL - -$
Building F -
Unit 1 1,051 1,104$
Unit 2 1,400 1,470$
Unit 3 1,435 1,507$
Unit 4 1,131 1,188$
SUBTOTAL - -$
TOTALS - -$
REVENUE
RETAIL REVENUE OFFICE REVENUE RESIDENTIAL REVENUE
Annual Rent 380,851$ Annual Rent 68,200.00$ Total Monthly Rent 21 units -$
Vacancy Rate 10% Vacancy Rate 15% Annual Rent -$
Net Annual Rent 342,766$ Net Annual Rent 61,380.00$ Vacancy Rate 5%
Net Annual Rent -$
EXPENSES
EXPENSES Per SF Subtotal Total DEVELOPMENT COSTS Subtotal Total
Operating Expenses 69,810$ Hard Costs 3,723,200$
Retail Operating 1.50$ 61,560$ Retail 80$ PSF 3,283,200$
Office Operating 1.50$ 8,250$ Office 80$ PSF 440000
Apartment Operating 0.80$ -$ Apartment 90$ PSF -$
Property Taxes 1.3699% 78,892$ 78,892$ Site grading, prep, landscape 510,129$
Insurance 1.50$ 69,810$ Sitework 150,000$ /acre 456,832$
Replacement Reserves per SF 5% of gross rent Surface Parking & Landscape 17,500$ /acre 53,297$
Soft Costs 535,079$ 14%
Architectural Design 2.00$ PSF 93,080$
Building Engineering 1.50$ PSF 69,810$
Civil Engineering 20,000$ /acre 60,911$
TAXES Landscape Architecture 7,500$ /acre 22,842$
Income Tax Rate 35% Plan Review Fees $400 + $25/1000 SF 1,564$
Capital Gains Tax Rate 15% Building Permit Dev Costs-500000/1000+1717 4,940$
Depreciation (Commercial) 39 years Water Capacity Fee 34,796$
Depreciation (Residential) 27.5 years Residential 50% of $980/unit 10,290$
Annual Comm. Depreciation 95,467$ Commercial Based on meter size 24,506$
Annual Resi. Depreciation -$ Sewer Capacity Fee 35,195$
Total Annual Depreciation 95,467$ Residential 50% of $990/unit 10,395$
Commercial Based on meter size 24,800$
Fire Prevention Review Fee 275$
Contractor's Fee 5.00% of Hard + Sitework 211,666$
Subtotal 4,768,408$
Contingency 8% of Subtotal 381,473$
Development Costs (excluding land) 5,149,880$
Land Parcel 609,109$
Total Development Costs (including land) 5,758,990$
LOAN
LOAN DETAILS
LTV 70%
Loan Amount 4,031,293$
Equity 1,727,697$
Amortization Term (years) 20
Interest Rate 5.50%
Montly Payment ($27,731)

Annual Payment ($332,769)
LOAN 1 2 3 4 5 6 7 8 9 10
Beg Balance 4,031,293$ 3,917,402$ 3,797,087$ 3,669,986$ 3,535,715$ 3,393,870$ 3,244,024$ 3,085,725$ 2,918,497$ 2,741,837$
Debt Service ($332,769) ($332,769) ($332,769) ($332,769) ($332,769) ($332,769) ($332,769) ($332,769) ($332,769) ($332,769)
Interest 218,879$ 212,454$ 205,668$ 198,498$ 190,924$ 182,923$ 174,470$ 165,541$ 156,108$ 146,143$
Amortization 113,890$ 120,315$ 127,101$ 134,271$ 141,845$ 149,846$ 158,299$ 167,228$ 176,661$ 186,626$
End Balance 3,917,402$ 3,797,087$ 3,669,986$ 3,535,715$ 3,393,870$ 3,244,024$ 3,085,725$ 2,918,497$ 2,741,837$ 2,555,211$
SALESALE IN YR 10 SALE IN YR 5
Terminal Cap Rate (Year 10) 6% Year 11 NOI 222,319$ Year 6 NOI 191,775$
Terminal Cap Rate (Year 5) 6% Value at Terminal Cap Rate 3,705,320$ Value at Terminal Cap Rate 3,196,242$
Closing Costs 5% Cost of Sale (185,266)$ Cost of Sale (159,812)$
Replacement Reserves Net Sale Value 3,520,054$ Net Sale Value 3,036,430$
Development Cost 5,758,990$ Development Cost 5,758,990$
Capital Improvements 231,654$ Capital Improvements 107,283$
Accum. Depreciation 954,667$ Accum. Depreciation 477,333$
Net Book Value 6,945,310$ Net Book Value 6,343,606$
Capital Gain Tax Liability (3,425,256)$ Capital Gain Tax Liability (3,307,176)$
Capital Gains Tax Payable -$ Capital Gains Tax Payable -$
Net Sale Value 3,520,054$ Net Sale Value 3,036,430$
Less Loan Repayment (2,741,837)$ Less Loan Repayment (3,535,715)$
Less Capital Gains Tax -$ Less Capital Gains Tax -$
Net Cash from Sale 778,218$ Net Cash from Sale (499,285)$
DISCOUNTED CASH FLOW 0 1 2 3 4 5 6 7 8 9 10 11
REVENUE
Residential -$ -$ -$ -$ -$ -$ -$ -$ -$ -$ -$
Retail 342,766$ 353,049$ 363,641$ 374,550$ 385,786$ 397,360$ 409,281$ 421,559$ 434,206$ 447,232$ 460,649$
Office 61,380$ 63,221$ 65,118$ 67,072$ 69,084$ 71,156$ 73,291$ 75,490$ 77,754$ 80,087$ 82,490$
Gross Rent 404,146$ 416,270$ 428,759$ 441,621$ 454,870$ 468,516$ 482,572$ 497,049$ 511,960$ 527,319$ 543,139$
EXPENSES
Operating 69,810$ 71,904$ 74,061$ 76,283$ 78,572$ 80,929$ 83,357$ 85,857$ 88,433$ 91,086$ 93,819$
Real Estate Taxes 78,892$ 81,259$ 83,697$ 86,208$ 88,794$ 91,458$ 94,202$ 97,028$ 99,939$ 102,937$ 106,025$
Insurance 69,810$ 71,904$ 74,061$ 76,283$ 78,572$ 80,929$ 83,357$ 85,857$ 88,433$ 91,086$ 93,819$
Replacement Reserves 20,207$ 20,814$ 21,438$ 22,081$ 22,743$ 23,426$ 24,129$ 24,852$ 25,598$ 26,366$ 27,157$
Total Expenses 238,720$ 245,881$ 253,258$ 260,855$ 268,681$ 276,742$ 285,044$ 293,595$ 302,403$ 311,475$ 320,819$
NOI 165,426$ 170,389$ 175,501$ 180,766$ 186,189$ 191,775$ 197,528$ 203,454$ 209,557$ 215,844$ 222,319$
FINANCING
Annual Debt Service ($332,769) ($332,769) ($332,769) ($332,769) ($332,769) ($332,769) ($332,769) ($332,769) ($332,769) ($332,769)
Interest 218,879$ 212,454$ 205,668$ 198,498$ 190,924$ 182,923$ 174,470$ 165,541$ 156,108$ 146,143$
Amortization 113,890$ 120,315$ 127,101$ 134,271$ 141,845$ 149,846$ 158,299$ 167,228$ 176,661$ 186,626$
CFAF ($167,343) ($162,380) ($157,268) ($152,003) ($146,580) ($140,994) ($135,241) ($129,315) (123,212)$ (116,925)$
TAXES
Add: Amortization 113,890$ 120,315$ 127,101$ 134,271$ 141,845$ 149,846$ 158,299$ 167,228$ 176,661$ 186,626$
Add: Replacement Reserves 20,207$ 20,814$ 21,438$ 22,081$ 22,743$ 23,426$ 24,129$ 24,852$ 25,598$ 26,366$
Less: Depreciation 95,467$ 95,467$ 95,467$ 95,467$ 95,467$ 95,467$ 95,467$ 95,467$ 95,467$ 95,467$
Taxable Income (128,712)$ (116,718)$ (104,195)$ (91,118)$ (77,458)$ (63,189)$ (48,281)$ (32,702)$ (16,420)$ 600$
Tax Payment (45,049)$ (40,851)$ (36,468)$ (31,891)$ (27,110)$ (22,116)$ (16,898)$ (11,446)$ (5,747)$ 210$
CFAT ($122,294) ($121,528) ($120,800) ($120,112) ($119,470) ($118,878) ($118,343) ($117,870) ($117,465) (117,135)$
Fully spent over hold period

Equity (1,727,697)$ 778,218$
Cash Return -7%
(5,758,990)$ 165,426$ 170,389$ 175,501$ 180,766$ 186,189$ 191,775$ 197,528$ 203,454$ 209,557$ 3,735,898$
(1,727,697)$ (167,343)$ (162,380)$ (157,268)$ (152,003)$ (146,580)$ (140,994)$ (135,241)$ (129,315)$ (123,212)$ 661,293$
(1,727,697)$ (122,294)$ (121,528)$ (120,800)$ (120,112)$ (119,470)$ (118,878)$ (118,343)$ (117,870)$ (117,465)$ 661,083$
Unleveraged IRR -1%
Leveraged IRR (before tax) -20%
Leveraged IRR (after tax) -19%
(5,758,990)$ 165,426$ 170,389$ 175,501$ 180,766$ 3,222,619$
(1,727,697)$ (167,343)$ (162,380)$ (157,268)$ (152,003)$ (645,865)$
(1,727,697)$ (122,294)$ (121,528)$ (120,800)$ (120,112)$ (618,755)$
Unleveraged IRR -8%
Leveraged IRR (before tax) #NUM!
Leveraged IRR (after tax) #NUM!
SALE IN YR 10
SALE IN YR 5

TOWNHOMES (25 UNITS) - PROJECT SUMMARY
PROJECT ASSUMPTIONS LIQUIDATION ASSUMPTIONS (Sale in Yr 10)
Development Costs 4,361,638$ Sale Cap Rate 7%
Land Price 184,088$ Sale Closing Costs 5%
Total Purchase Price 4,545,726$ Yr 11 NOI 219,919$
Net Cash from Sales 820,404$
FINANCING ASSUMPTIONS
Equity 1,363,718$
Loan 3,182,008$
Interest Rate 5.50%
GENERAL SITE INFORMATION
TOWNHOMES SF Stories INCOME INFORMATION RESIDENTIAL INFORMATION
Total Units 25 Area Median Family Income 55,300$ Vacancy 5%
Total Percent 100% Workforce (80% of Median) 44,240$ Absorption Rate (units/yr) N/A
Percent Market Rate 100% Amount to be Spent on Housing 30% Efficiency Rate (apts) 80%
Total Market Rate Units 25 Funds Available for Housing 13,272$ Efficiency Rate (tnhms) 100%
Percent Affordable 0% Monthly Funds Avail. for Housing 1,106$
Total Affordable Units 0
Average Unit Size (SF) 1200
TOTAL SF 30,000
SITE SUMMARY SF Acres
TOTAL SITE AREA 100,236 2.30
REVENUE
RESIDENTIAL REVENUE Units
Market Rate Townhomes 25 1,056$ 26,400$
Affordable Townhomes 0 1,106$ -$
Monthly Rent 26,400$
Annual Rent 316,800$
Vacancy Rate 5%
Net Annual Rent 300,960$
EXPENSES
ANNUAL EXPENSES Per SF Total DEVELOPMENT COSTS Subtotal Total
Operating Expenses 0.50$ 15,000$ Hard Costs 110$ PSF 3,300,000$ 3,300,000$
Property Taxes 1.3699% 62,272$ Site grading, prep, landscape 385,435$
Insurance 1.50$ 45,000$ Sitework 150,000$ /acre 345,165$
Replacement Reserves per SF 5% of gross rent Surface Parking & Landscape 17,500$ /acre 40,269$
Soft Costs 353,119$ 11%
Architectural Design 1.50$ PSF 45,000$
Building Engineering 1.00$ PSF 30,000$
TAXES Civil Engineering 20,000$ /acre 46,022$
Income Tax Rate 35% Landscape Architecture 7,500$ /acre 17,258$
Capital Gains Tax Rate 15% Plan Review Fees $400 + $25/1000 SF 1,150$
Depreciation (Residential) 27.5 years Building Permit Dev Costs-500000/1000+1717 4,517$
Annual Depreciation 120,000$ Water Capacity Fee 50% of $980/unit 12,250$ 12,250$
Sewer Capacity Fee 50% of $990/unit 12,375$ 12,375$
Fire Prevention Review Fee 275$
Contractor's Fee 5.00% of Hard + Sitework 184,272$
Subtotal 4,038,554$
Contingency 8% of Subtotal 323,084$
Development Costs (excluding land) 4,361,638$
PROJECT LEVERAGED IRR -10%
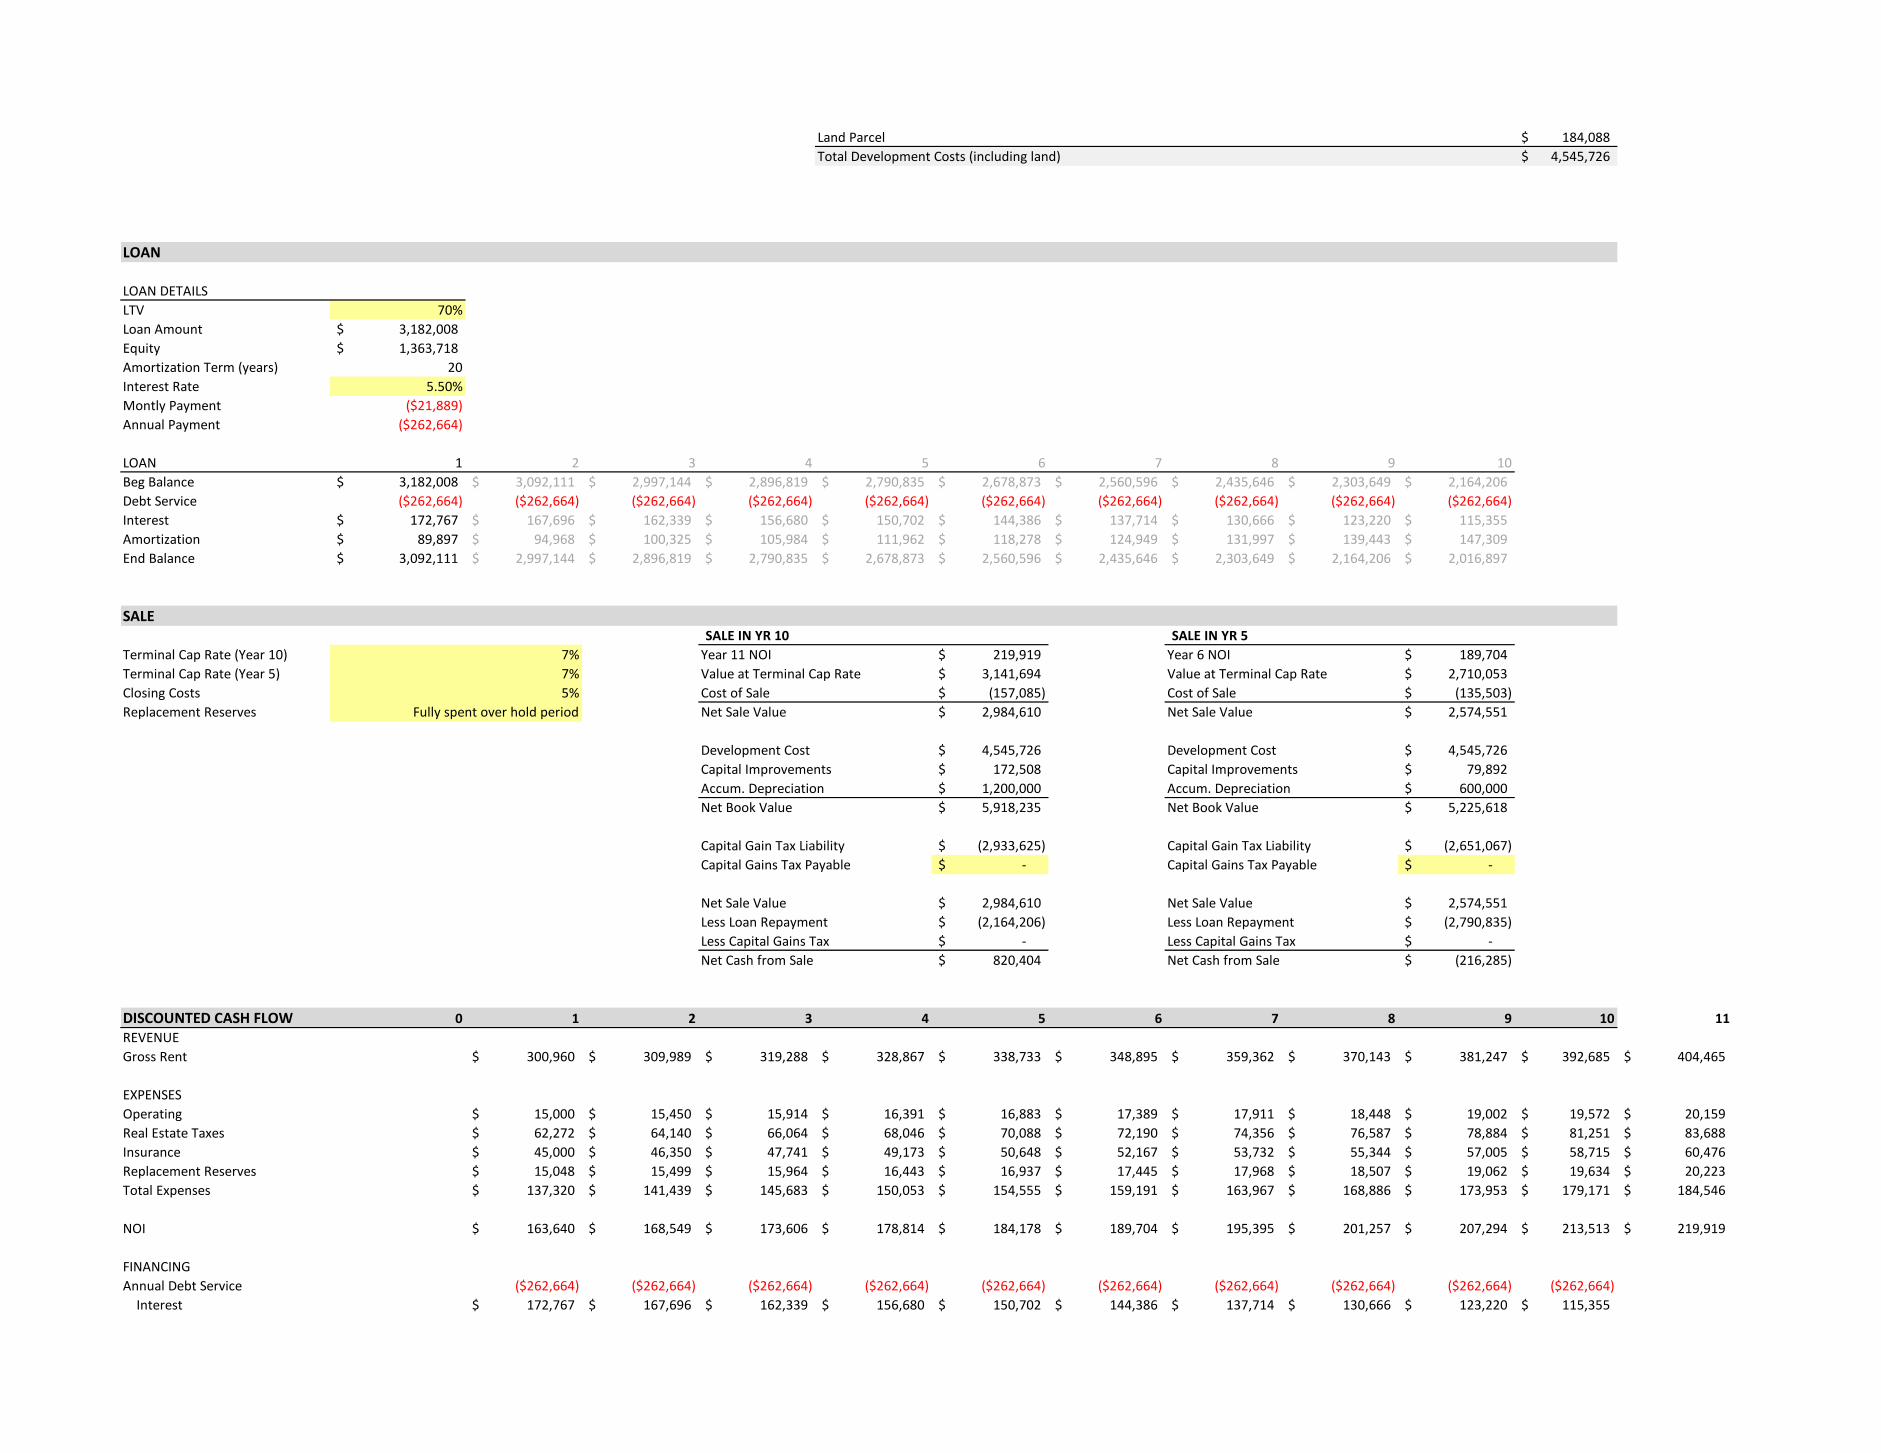
Land Parcel 184,088$
Total Development Costs (including land) 4,545,726$
LOAN
LOAN DETAILS
LTV 70%
Loan Amount 3,182,008$
Equity 1,363,718$
Amortization Term (years) 20
Interest Rate 5.50%
Montly Payment ($21,889)
Annual Payment ($262,664)
LOAN 1 2 3 4 5 6 7 8 9 10
Beg Balance 3,182,008$ 3,092,111$ 2,997,144$ 2,896,819$ 2,790,835$ 2,678,873$ 2,560,596$ 2,435,646$ 2,303,649$ 2,164,206$
Debt Service ($262,664) ($262,664) ($262,664) ($262,664) ($262,664) ($262,664) ($262,664) ($262,664) ($262,664) ($262,664)
Interest 172,767$ 167,696$ 162,339$ 156,680$ 150,702$ 144,386$ 137,714$ 130,666$ 123,220$ 115,355$
Amortization 89,897$ 94,968$ 100,325$ 105,984$ 111,962$ 118,278$ 124,949$ 131,997$ 139,443$ 147,309$
End Balance 3,092,111$ 2,997,144$ 2,896,819$ 2,790,835$ 2,678,873$ 2,560,596$ 2,435,646$ 2,303,649$ 2,164,206$ 2,016,897$
SALESALE IN YR 10 SALE IN YR 5
Terminal Cap Rate (Year 10) 7% Year 11 NOI 219,919$ Year 6 NOI 189,704$
Terminal Cap Rate (Year 5) 7% Value at Terminal Cap Rate 3,141,694$ Value at Terminal Cap Rate 2,710,053$
Closing Costs 5% Cost of Sale (157,085)$ Cost of Sale (135,503)$
Replacement Reserves Net Sale Value 2,984,610$ Net Sale Value 2,574,551$
Development Cost 4,545,726$ Development Cost 4,545,726$
Capital Improvements 172,508$ Capital Improvements 79,892$
Accum. Depreciation 1,200,000$ Accum. Depreciation 600,000$
Net Book Value 5,918,235$ Net Book Value 5,225,618$
Capital Gain Tax Liability (2,933,625)$ Capital Gain Tax Liability (2,651,067)$
Capital Gains Tax Payable -$ Capital Gains Tax Payable -$
Net Sale Value 2,984,610$ Net Sale Value 2,574,551$
Less Loan Repayment (2,164,206)$ Less Loan Repayment (2,790,835)$
Less Capital Gains Tax -$ Less Capital Gains Tax -$
Net Cash from Sale 820,404$ Net Cash from Sale (216,285)$
DISCOUNTED CASH FLOW 0 1 2 3 4 5 6 7 8 9 10 11
REVENUE
Gross Rent 300,960$ 309,989$ 319,288$ 328,867$ 338,733$ 348,895$ 359,362$ 370,143$ 381,247$ 392,685$ 404,465$
EXPENSES
Operating 15,000$ 15,450$ 15,914$ 16,391$ 16,883$ 17,389$ 17,911$ 18,448$ 19,002$ 19,572$ 20,159$
Real Estate Taxes 62,272$ 64,140$ 66,064$ 68,046$ 70,088$ 72,190$ 74,356$ 76,587$ 78,884$ 81,251$ 83,688$
Insurance 45,000$ 46,350$ 47,741$ 49,173$ 50,648$ 52,167$ 53,732$ 55,344$ 57,005$ 58,715$ 60,476$
Replacement Reserves 15,048$ 15,499$ 15,964$ 16,443$ 16,937$ 17,445$ 17,968$ 18,507$ 19,062$ 19,634$ 20,223$
Total Expenses 137,320$ 141,439$ 145,683$ 150,053$ 154,555$ 159,191$ 163,967$ 168,886$ 173,953$ 179,171$ 184,546$
NOI 163,640$ 168,549$ 173,606$ 178,814$ 184,178$ 189,704$ 195,395$ 201,257$ 207,294$ 213,513$ 219,919$
FINANCING
Annual Debt Service ($262,664) ($262,664) ($262,664) ($262,664) ($262,664) ($262,664) ($262,664) ($262,664) ($262,664) ($262,664)
Interest 172,767$ 167,696$ 162,339$ 156,680$ 150,702$ 144,386$ 137,714$ 130,666$ 123,220$ 115,355$
Fully spent over hold period

Amortization 89,897$ 94,968$ 100,325$ 105,984$ 111,962$ 118,278$ 124,949$ 131,997$ 139,443$ 147,309$
CFAF ($99,023) ($94,114) ($89,058) ($83,850) ($78,485) ($72,960) ($67,269) ($61,407) (55,369)$ (49,150)$
TAXES
Add: Amortization 89,897$ 94,968$ 100,325$ 105,984$ 111,962$ 118,278$ 124,949$ 131,997$ 139,443$ 147,309$
Add: Replacement Reserves 15,048$ 15,499$ 15,964$ 16,443$ 16,937$ 17,445$ 17,968$ 18,507$ 19,062$ 19,634$
Less: Depreciation 120,000$ 120,000$ 120,000$ 120,000$ 120,000$ 120,000$ 120,000$ 120,000$ 120,000$ 120,000$
Taxable Income (114,079)$ (103,647)$ (92,769)$ (81,423)$ (69,587)$ (57,238)$ (44,351)$ (30,902)$ (16,864)$ (2,207)$
Tax Payment (39,928)$ (36,276)$ (32,469)$ (28,498)$ (24,355)$ (20,033)$ (15,523)$ (10,816)$ (5,902)$ (773)$
CFAT ($59,096) ($57,838) ($56,589) ($55,352) ($54,130) ($52,927) ($51,746) ($50,591) ($49,467) (48,378)$
Equity (1,363,718)$ 820,404$
Cash Return -4.3% -4.2% -4.1% -4.1% -4.0% -3.9% -3.8% -3.7% -3.6%
(4,545,726)$ 163,640$ 168,549$ 173,606$ 178,814$ 184,178$ 189,704$ 195,395$ 201,257$ 207,294$ 3,198,123$
(1,363,718)$ (99,023)$ (94,114)$ (89,058)$ (83,850)$ (78,485)$ (72,960)$ (67,269)$ (61,407)$ (55,369)$ 771,254$
(1,363,718)$ (59,096)$ (57,838)$ (56,589)$ (55,352)$ (54,130)$ (52,927)$ (51,746)$ (50,591)$ (49,467)$ 772,026$
Unleveraged IRR 1%
Leveraged IRR (before tax) -12%
Leveraged IRR (after tax) -10%
(4,545,726)$ 163,640$ 168,549$ 173,606$ 178,814$ 2,758,729$
(1,363,718)$ (99,023)$ (94,114)$ (89,058)$ (83,850)$ (294,770)$
(1,363,718)$ (59,096)$ (57,838)$ (56,589)$ (55,352)$ (270,415)$
Unleveraged IRR -6%
Leveraged IRR (before tax) #NUM!
Leveraged IRR (after tax) #NUM!
SALE IN YR 10
SALE IN YR 5