Willingness to Pay - IPART · Willingness to Pay ... This data is believed to be current and...
25
Willingness to Pay WaterNSW Prices for NSW Rural Bulk Water Services from 1 July 2017: Willingness to Pay study Disclaimer: All description, figures analysis, forecasts and other details have been prepared in good faith from information furnished to the consultant. This data is believed to be current and correct as at the date of preparation of this document. However, it should be noted that projections, forecasts and calculations are subject to assumptions which may not turn out to be correct and Agripath expressly disclaim all and any liability to any person in respect of anything done or not done by any persons in reliance, in whole or in part, on the report in total or any part of its contents. This report must be taken into consideration with individual personal financial circumstances and client is encouraged to discuss any investment decision with their financial adviser before investing. All amounts referred to in this document are expressed in Australian Currency unless otherwise indicated.
Transcript of Willingness to Pay - IPART · Willingness to Pay ... This data is believed to be current and...

Willingness to Pay WaterNSW Prices for NSW Rural Bulk Water Services from 1 July 2017: Willingness to Pay study
Disclaimer: All description, figures analysis, forecasts and other details have been prepared in good faith from information furnished to
the consultant. This data is believed to be current and correct as at the date of preparation of this document. However, it should be
noted that projections, forecasts and calculations are subject to assumptions which may not turn out to be correct and Agripath
expressly disclaim all and any liability to any person in respect of anything done or not done by any persons in reliance, in whole or in
part, on the report in total or any part of its contents. This report must be taken into consideration with individual personal financial
circumstances and client is encouraged to discuss any investment decision with their financial adviser before investing.
All amounts referred to in this document are expressed in Australian Currency unless otherwise indicated.
investing.
All amounts referred to in this document are expressed in Australian Currency unless otherwise indicated.
Willingness to Pay for Rural Bulk Water Services January 2017
Agripath Pty Ltd 1
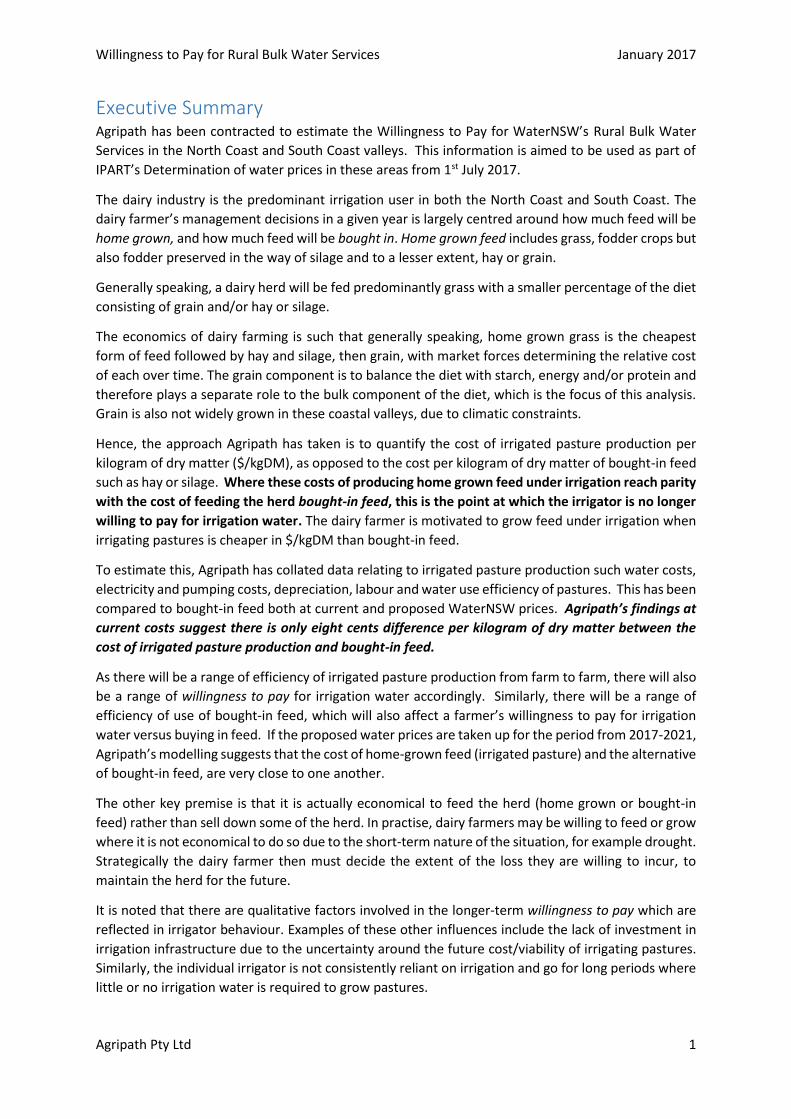
Executive Summary Agripath has been contracted to estimate the Willingness to Pay for WaterNSW’s Rural Bulk Water
Services in the North Coast and South Coast valleys. This information is aimed to be used as part of
IPART’s Determination of water prices in these areas from 1st July 2017.
The dairy industry is the predominant irrigation user in both the North Coast and South Coast. The
dairy farmer’s management decisions in a given year is largely centred around how much feed will be
home grown, and how much feed will be bought in. Home grown feed includes grass, fodder crops but
also fodder preserved in the way of silage and to a lesser extent, hay or grain.
Generally speaking, a dairy herd will be fed predominantly grass with a smaller percentage of the diet
consisting of grain and/or hay or silage.
The economics of dairy farming is such that generally speaking, home grown grass is the cheapest
form of feed followed by hay and silage, then grain, with market forces determining the relative cost
of each over time. The grain component is to balance the diet with starch, energy and/or protein and
therefore plays a separate role to the bulk component of the diet, which is the focus of this analysis.
Grain is also not widely grown in these coastal valleys, due to climatic constraints.
Hence, the approach Agripath has taken is to quantify the cost of irrigated pasture production per
kilogram of dry matter ($/kgDM), as opposed to the cost per kilogram of dry matter of bought-in feed
such as hay or silage. Where these costs of producing home grown feed under irrigation reach parity
with the cost of feeding the herd bought-in feed, this is the point at which the irrigator is no longer
willing to pay for irrigation water. The dairy farmer is motivated to grow feed under irrigation when
irrigating pastures is cheaper in $/kgDM than bought-in feed.
To estimate this, Agripath has collated data relating to irrigated pasture production such water costs,
electricity and pumping costs, depreciation, labour and water use efficiency of pastures. This has been
compared to bought-in feed both at current and proposed WaterNSW prices. Agripath’s findings at
current costs suggest there is only eight cents difference per kilogram of dry matter between the
cost of irrigated pasture production and bought-in feed.
As there will be a range of efficiency of irrigated pasture production from farm to farm, there will also
be a range of willingness to pay for irrigation water accordingly. Similarly, there will be a range of
efficiency of use of bought-in feed, which will also affect a farmer’s willingness to pay for irrigation
water versus buying in feed. If the proposed water prices are taken up for the period from 2017-2021,
Agripath’s modelling suggests that the cost of home-grown feed (irrigated pasture) and the alternative
of bought-in feed, are very close to one another.
The other key premise is that it is actually economical to feed the herd (home grown or bought-in
feed) rather than sell down some of the herd. In practise, dairy farmers may be willing to feed or grow
where it is not economical to do so due to the short-term nature of the situation, for example drought.
Strategically the dairy farmer then must decide the extent of the loss they are willing to incur, to
maintain the herd for the future.
It is noted that there are qualitative factors involved in the longer-term willingness to pay which are
reflected in irrigator behaviour. Examples of these other influences include the lack of investment in
irrigation infrastructure due to the uncertainty around the future cost/viability of irrigating pastures.
Similarly, the individual irrigator is not consistently reliant on irrigation and go for long periods where
little or no irrigation water is required to grow pastures.

Willingness to Pay for Rural Bulk Water Services January 2017
Agripath Pty Ltd 2
Overcoming such factors will require either:
1) incentivising higher usage by current licence-holders,
2) attracting new users, in order to decrease the per megalitre operating and capital costs of the
dams,
3) reviewing the cost of operating and maintaining the dam infrastructure,
4) and/or changing the pricing structure between the cost of holding licenses and usage charges.

Willingness to Pay for Rural Bulk Water Services January 2017
Agripath Pty Ltd 3
Table of Contents Executive Summary ................................................................................................................................. 1
List of Tables ........................................................................................................................................... 4
Glossary of Terms.................................................................................................................................... 5
Introduction ............................................................................................................................................ 6
Objectives ........................................................................................................................................... 6
Background ......................................................................................................................................... 6
Method ............................................................................................................................................... 6
Typical water users ................................................................................................................................. 8
North Coast ......................................................................................................................................... 8
South Coast ......................................................................................................................................... 8
Dairy Performance .............................................................................................................................. 9
Current water pricing ............................................................................................................................ 10
Marginal water value ............................................................................................................................ 11
Water ................................................................................................................................................ 11
Electricity & Pumping Costs .............................................................................................................. 11
Depreciation ...................................................................................................................................... 12
Labour ............................................................................................................................................... 12
Water Use Efficiency ............................................................................................................................. 13
Cost of irrigation ................................................................................................................................... 14
At current water prices (2016-17) .................................................................................................... 14
Proposed water prices (2017-2021) ................................................................................................. 17
Cost of bought-in feed .......................................................................................................................... 18
Willingness to Pay ................................................................................................................................. 20
Comment on other systems .............................................................................................................. 20
Other considerations ........................................................................................................................ 21
The range of willingness to pay ........................................................................................................ 22
Conclusion ............................................................................................................................................. 24

Willingness to Pay for Rural Bulk Water Services January 2017
Agripath Pty Ltd 4
List of Tables Table 1: Richmond Regulated Water Source Water Access Licences (WAL), megalitres (ML) and use,
as listed on the NSW Water Register website for 2015-16. ................................................................... 8
Table 2: Bega & Brogo Regulated Water Source Water Access Licences (WAL), megalitres (ML) and
use, as listed on the NSW Water Register website for 2015-16. ............................................................ 8
Table 3: NSW Dairy Farm Monitor Project farm performance.* ............................................................ 9
Table 4: Current and proposed operational and capital expenditure for North Coast and South Coast
irrigation valleys. ................................................................................................................................... 10
Table 5: WaterNSW Regulated River prices for High Security (HS) & General Security (GS) licences,
and usage fees per ML. ......................................................................................................................... 10
Table 6: Origin Energy supply from Essential Energy in NSW, Time of Use (TOU) prices. .................... 11
Table 7: Estimates of electricity use for pumping 1ML of water from different sources, and with
current electricity prices.4,5 ................................................................................................................... 12
Table 8: Summary of estimated water use efficiencies of irrigated pastures. ..................................... 13
Table 9: Cost of producing pasture at WUE of 2tDM/ML, at 2016-17 water prices............................. 14
Table 10: Cost of producing pasture at WUE of 1tDM/ML, at 2016-17 water prices........................... 16
Table 11: WaterNSW's pricing proposal to IPART for 2017-2021, for the North and South Coasts
respectively. .......................................................................................................................................... 17
Table 12: Changes in cost of irrigated production of dry matter from 2016-17 to 2020-21. ............... 17
Table 13: Cost per kgDM for selected hay and silage. .......................................................................... 18
Table 14: WaterNSW proposed user share of dam costs for 2017-21, split on current pricing formula.
.............................................................................................................................................................. 20
Table 15: Summary of cost comparison of willingness to pay, based on home-grown versus bought-in
feed costs. ............................................................................................................................................. 24
Willingness to Pay for Rural Bulk Water Services January 2017
Agripath Pty Ltd 5
Glossary of Terms
c Cents
CP Crude protein
CSO Community Service Obligation
DM Dry matter
EBIT Earnings before interest and tax
GS General Security
Ha Hectare
HS High Security
IPART Independent Pricing and Regulatory Tribunal
kgDM Kilograms of dry matter
kgMS Kilograms of milk solids
kW Kilowatt
kWh Kilowatt hours
ME Metabolisable energy
MJME Megajoules of metabolisable energy
ML Megalitres
mm Millimetre
tDM Tonnes of dry matter
TOU Time of Use
WAL Water Access Licence
WTP Willingness to pay
Willingness to Pay for Rural Bulk Water Services January 2017
Agripath Pty Ltd 6
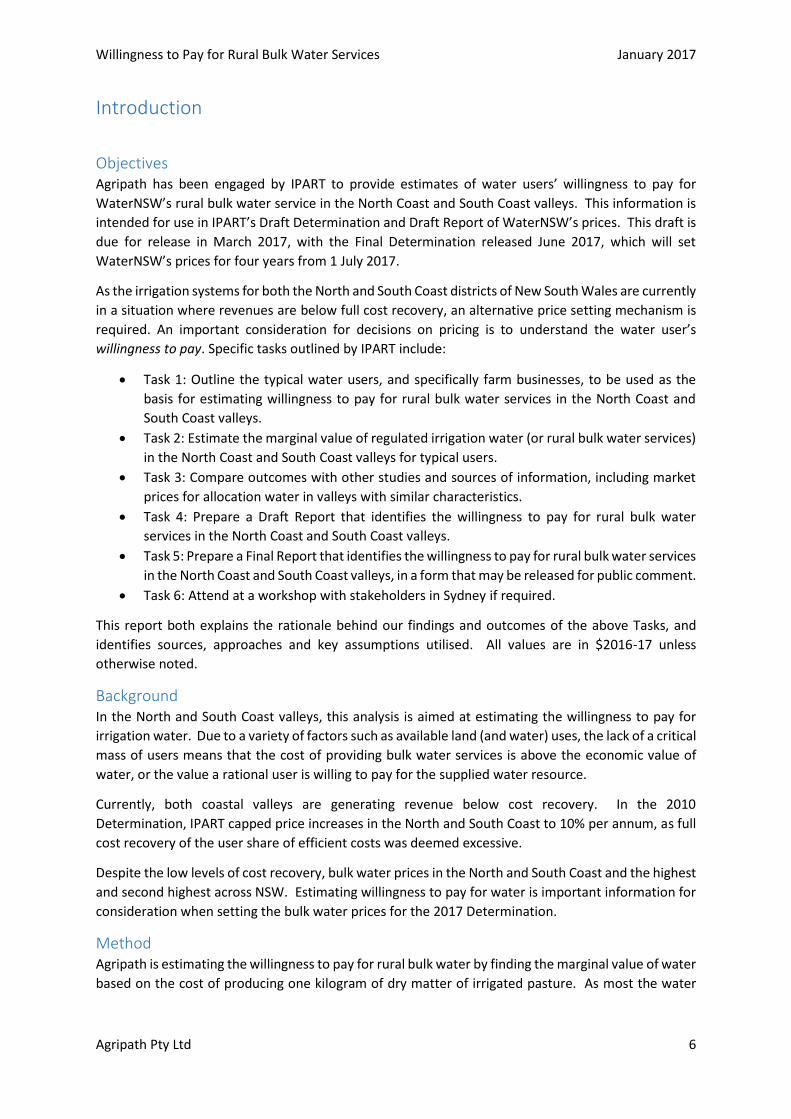
Introduction
Objectives Agripath has been engaged by IPART to provide estimates of water users’ willingness to pay for
WaterNSW’s rural bulk water service in the North Coast and South Coast valleys. This information is
intended for use in IPART’s Draft Determination and Draft Report of WaterNSW’s prices. This draft is
due for release in March 2017, with the Final Determination released June 2017, which will set
WaterNSW’s prices for four years from 1 July 2017.
As the irrigation systems for both the North and South Coast districts of New South Wales are currently
in a situation where revenues are below full cost recovery, an alternative price setting mechanism is
required. An important consideration for decisions on pricing is to understand the water user’s
willingness to pay. Specific tasks outlined by IPART include:
Task 1: Outline the typical water users, and specifically farm businesses, to be used as the
basis for estimating willingness to pay for rural bulk water services in the North Coast and
South Coast valleys.
Task 2: Estimate the marginal value of regulated irrigation water (or rural bulk water services)
in the North Coast and South Coast valleys for typical users.
Task 3: Compare outcomes with other studies and sources of information, including market
prices for allocation water in valleys with similar characteristics.
Task 4: Prepare a Draft Report that identifies the willingness to pay for rural bulk water
services in the North Coast and South Coast valleys.
Task 5: Prepare a Final Report that identifies the willingness to pay for rural bulk water services
in the North Coast and South Coast valleys, in a form that may be released for public comment.
Task 6: Attend at a workshop with stakeholders in Sydney if required.
This report both explains the rationale behind our findings and outcomes of the above Tasks, and
identifies sources, approaches and key assumptions utilised. All values are in $2016-17 unless
otherwise noted.
Background In the North and South Coast valleys, this analysis is aimed at estimating the willingness to pay for
irrigation water. Due to a variety of factors such as available land (and water) uses, the lack of a critical
mass of users means that the cost of providing bulk water services is above the economic value of
water, or the value a rational user is willing to pay for the supplied water resource.
Currently, both coastal valleys are generating revenue below cost recovery. In the 2010
Determination, IPART capped price increases in the North and South Coast to 10% per annum, as full
cost recovery of the user share of efficient costs was deemed excessive.
Despite the low levels of cost recovery, bulk water prices in the North and South Coast and the highest
and second highest across NSW. Estimating willingness to pay for water is important information for
consideration when setting the bulk water prices for the 2017 Determination.
Method Agripath is estimating the willingness to pay for rural bulk water by finding the marginal value of water
based on the cost of producing one kilogram of dry matter of irrigated pasture. As most the water

Willingness to Pay for Rural Bulk Water Services January 2017
Agripath Pty Ltd 7
users in the North Coast and South Coast valleys are dairies, Agripath has modelled the willingness to
pay on a dairy system.
Comparing this to the cost per kgDM for bought-in feed, as would be supplemented in dairies in times
of home-grown feed shortages, aims to find the balance where irrigation becomes equal in cost to
bought-in feed. Past this point, the willingness to pay for such irrigational water could be considered
very low, due to there being a cheaper, alternative feed source which would be utilised to fill feed
gaps.
Willingness to Pay for Rural Bulk Water Services January 2017
Agripath Pty Ltd 8
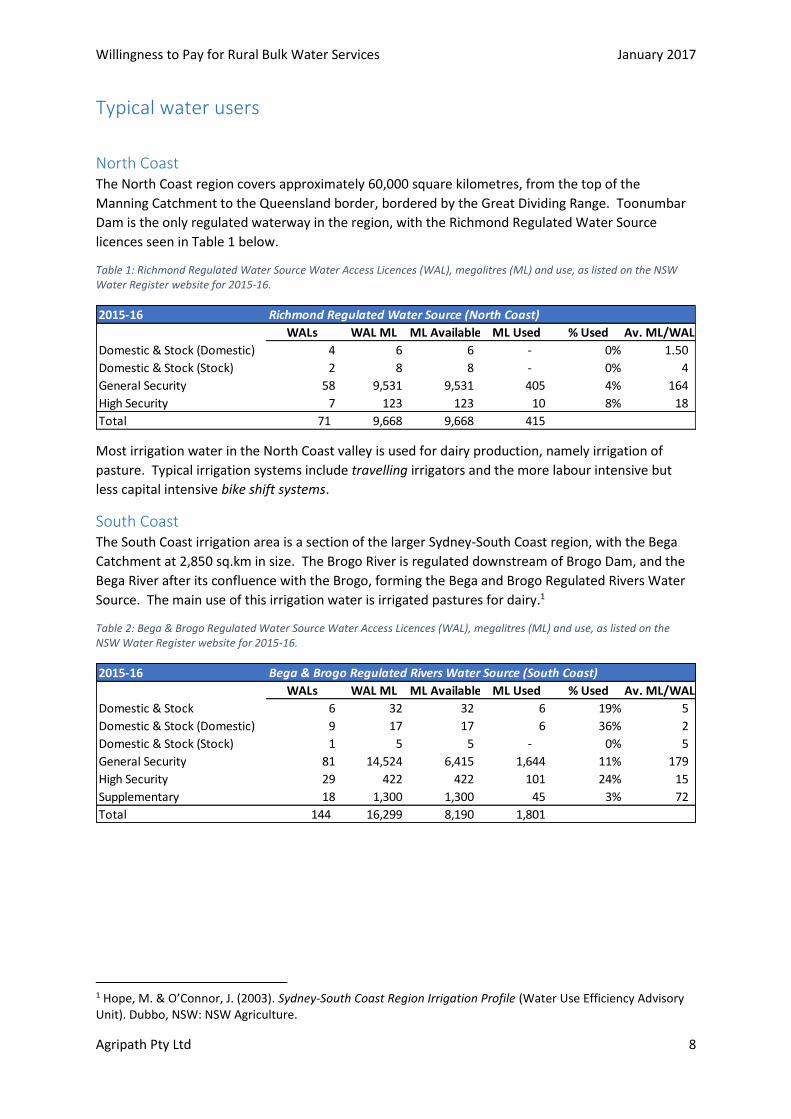
Typical water users
North Coast The North Coast region covers approximately 60,000 square kilometres, from the top of the
Manning Catchment to the Queensland border, bordered by the Great Dividing Range. Toonumbar
Dam is the only regulated waterway in the region, with the Richmond Regulated Water Source
licences seen in Table 1 below.
Table 1: Richmond Regulated Water Source Water Access Licences (WAL), megalitres (ML) and use, as listed on the NSW Water Register website for 2015-16.
Most irrigation water in the North Coast valley is used for dairy production, namely irrigation of
pasture. Typical irrigation systems include travelling irrigators and the more labour intensive but
less capital intensive bike shift systems.
South Coast The South Coast irrigation area is a section of the larger Sydney-South Coast region, with the Bega
Catchment at 2,850 sq.km in size. The Brogo River is regulated downstream of Brogo Dam, and the
Bega River after its confluence with the Brogo, forming the Bega and Brogo Regulated Rivers Water
Source. The main use of this irrigation water is irrigated pastures for dairy.1
Table 2: Bega & Brogo Regulated Water Source Water Access Licences (WAL), megalitres (ML) and use, as listed on the NSW Water Register website for 2015-16.
1 Hope, M. & O’Connor, J. (2003). Sydney-South Coast Region Irrigation Profile (Water Use Efficiency Advisory Unit). Dubbo, NSW: NSW Agriculture.
2015-16 Richmond Regulated Water Source (North Coast)
WALs WAL ML ML Available ML Used % Used Av. ML/WAL
Domestic & Stock (Domestic) 4 6 6 - 0% 1.50
Domestic & Stock (Stock) 2 8 8 - 0% 4
General Security 58 9,531 9,531 405 4% 164
High Security 7 123 123 10 8% 18
Total 71 9,668 9,668 415
2015-16 Bega & Brogo Regulated Rivers Water Source (South Coast)
WALs WAL ML ML Available ML Used % Used Av. ML/WAL
Domestic & Stock 6 32 32 6 19% 5
Domestic & Stock (Domestic) 9 17 17 6 36% 2
Domestic & Stock (Stock) 1 5 5 - 0% 5
General Security 81 14,524 6,415 1,644 11% 179
High Security 29 422 422 101 24% 15
Supplementary 18 1,300 1,300 45 3% 72
Total 144 16,299 8,190 1,801
Willingness to Pay for Rural Bulk Water Services January 2017
Agripath Pty Ltd 9
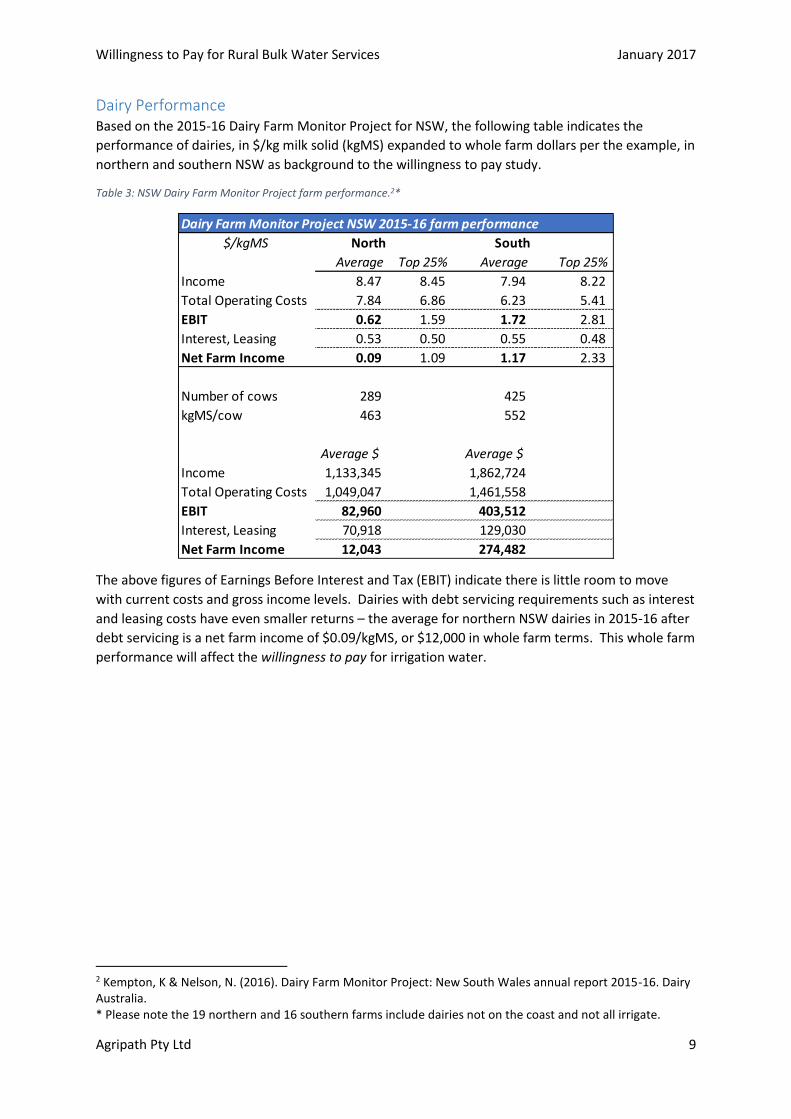
Dairy Performance Based on the 2015-16 Dairy Farm Monitor Project for NSW, the following table indicates the
performance of dairies, in $/kg milk solid (kgMS) expanded to whole farm dollars per the example, in
northern and southern NSW as background to the willingness to pay study.
Table 3: NSW Dairy Farm Monitor Project farm performance.2*
The above figures of Earnings Before Interest and Tax (EBIT) indicate there is little room to move
with current costs and gross income levels. Dairies with debt servicing requirements such as interest
and leasing costs have even smaller returns – the average for northern NSW dairies in 2015-16 after
debt servicing is a net farm income of $0.09/kgMS, or $12,000 in whole farm terms. This whole farm
performance will affect the willingness to pay for irrigation water.
2 Kempton, K & Nelson, N. (2016). Dairy Farm Monitor Project: New South Wales annual report 2015-16. Dairy Australia. * Please note the 19 northern and 16 southern farms include dairies not on the coast and not all irrigate.
Dairy Farm Monitor Project NSW 2015-16 farm performance
$/kgMS North South
Average Top 25% Average Top 25%
Income 8.47 8.45 7.94 8.22
Total Operating Costs 7.84 6.86 6.23 5.41
EBIT 0.62 1.59 1.72 2.81
Interest, Leasing 0.53 0.50 0.55 0.48
Net Farm Income 0.09 1.09 1.17 2.33
Number of cows 289 425
kgMS/cow 463 552
Average $ Average $
Income 1,133,345 1,862,724
Total Operating Costs 1,049,047 1,461,558
EBIT 82,960 403,512
Interest, Leasing 70,918 129,030
Net Farm Income 12,043 274,482

Willingness to Pay for Rural Bulk Water Services January 2017
Agripath Pty Ltd 10
Current water pricing
At a state-wide level, recent pricing of water has aimed at achieving cost recovery, or in the case of
the North Coast and South Coast, at least moving towards cost recovery of the operational and
capital expenditure of the storage dam (i.e. Toonumbar and Brogo Dams). Table 4 below indicates
the operating and capital expenses of these dams.
Table 4: Current and proposed operational and capital expenditure for North Coast and South Coast irrigation valleys.3
The North Coast is currently on a 60% fixed: 40% usage pricing formula. The South Coast is on 40%
fixed: 60% usage pricing. Each valley’s water pricing per megalitre for 2016-17 is show in Table 5
below.
Table 5: WaterNSW Regulated River prices for High Security (HS) & General Security (GS) licences, and usage fees per ML.
Water Administration Ministerial Council (WAMC) fees collected by WaterNSW for DPI Water.4
3 IPART (2016). Review of prices for WaterNSW: Rural bulk water services from 1 July 2017 (Issues Paper). Retrieved from Independent Pricing and Regulatory Tribunal website: www.ipart.nsw.gov.au/Home/Industries/Water/Reviews/Rural-Water/Prices-for-WaterNSW%E2%80%99s-Rural-Bulk-Water-Services-from-1-July-2017-formerly-State-Water-Corporation?qDh=2 4 WaterNSW Regulated River prices for 1 July 2016 to 30 June 2017. Retrieved from WaterNSW: www.waternsw.com.au/customer-service/pricing/rural/regulated-charges
Current and proposed expenditure from 1 July 2017 (WaterNSW)
Operating Expenditure ($) North Coast South Coast
Current 2016-17 517,000 550,000
Proposed 2020-21 610,000 625,000
Capital Expenditure ($)
Current 2016-17 12,000 41,000
Proposed 2020-21 41,000 366,000
HS GS Usage H & GS Usage
North Coast $9.54 $7.25 $45.04 $3.76 $5.80
South Coast $21.12 $10.09 $40.38 $3.17 $5.04
WaterNSW WAMC
WaterNSW Regulated River prices for 1 July 2016 to 30 June 2017

Willingness to Pay for Rural Bulk Water Services January 2017
Agripath Pty Ltd 11
Marginal water value
Marginal water value to users is on face value, the cost of the licence itself and the cost of usage. This
study considers the end user’s value in terms of the cost of producing the end product, which for a
dairy farmer is a unit (kg) of dry matter of feed grown. Agripath has researched published papers and
liaised with water users to calculate the cost of producing irrigated pasture, per kilogram of dry matter
(kgDM).
Costs have been determined as follows:
Water Water costs for 2016-17, as above (Table 5).
Electricity & Pumping Costs Table 6 lists Origin Energy’s pricing for electricity (from Essential Energy), which is a provider on both
the North Coast and South Coast. Time of Use (TOU) fees are listed as a commonly used contract,
though it is noted that not all irrigators are solely paying this tariff.
Table 6: Origin Energy supply from Essential Energy in NSW, Time of Use (TOU) prices.5
To determine the cost of pumping, collation of data on kW used to pump one megalitre of water was
made from irrigators and published sources. This was adjusted for current electricity price (as above)
to estimate power costs per ML pumped.
5 Origin Energy (2016). Multi-site pricing booklet. Retrieved from Origin website: www.originenergy.com.au/for-home/electricity-and-gas.html
Origin Supply - Electricty Tariffs, New South Wales
Zone Tariff Description Price List Units Rate (GST ex.)
Domestic TOU Supply Charge c/day 130.82
Shoulder Usage (9am-5pm & 8pm-10pm weekdays) c/kWh 26.85
Peak Usage (7am-9am & 5pm -8pm weekdays) c/kWh 26.85
Off-Peak Usage (all other times) c/kWh 14.51
Essential
Energy

Willingness to Pay for Rural Bulk Water Services January 2017
Agripath Pty Ltd 12
Table 7: Estimates of electricity use for pumping 1ML of water from different sources, and with current electricity prices.4,5
Depreciation Assumptions around depreciation of irrigation infrastructure have been made to account for this non-
cash item. For example:
- A capital investment in irrigation infrastructure of $60,000 is made
- It fully depreciated over 10 years, using straight line depreciation = $6,000/year
- This depreciation is shared over say 200ML of water used per year = $30/ML
Labour Following discussion with various users, an allowance for labour has been made on the assumption it
takes 18 to 20 hours for a traveller irrigator to pump 1.5 ML of water, which then takes one hour to
move.
Therefore, at $24/hour, $24/1.5ML = $16/ML.
Estimates of electricity use for pumping 1 ML water
Type kW hours kWh $/kWh Supply Cost $/ML
Pivots 123 0.20 24.60
Side-rolls 329 0.20 65.80
Traveller 1 405 0.20 81.00
Hand-shift 429 0.20 85.80
Average power use 260 0.20 52.00 Ernst, C. (2014). Irrigate or supplement? Parmalat Milk News.
Traveller 2 30.19 18.52 559 0.14 0.12 80.47 Tonge, F. (2016). Unpublished, irrigation costs spreadsheet.
Using each as above, with current prices.
Pivots 123 0.15 1.31 19.16
Side-rolls 329 0.15 1.31 49.05
Traveller 1 405 0.15 1.31 60.07
Hand-shift 429 0.15 1.31 63.56
Average power use 260 0.15 1.31 39.03
Traveller 2 30.19 18.52 559 0.15 1.31 82.43
Min $/ML: 19.16
Max $/ML: 82.43
Willingness to Pay for Rural Bulk Water Services January 2017
Agripath Pty Ltd 13
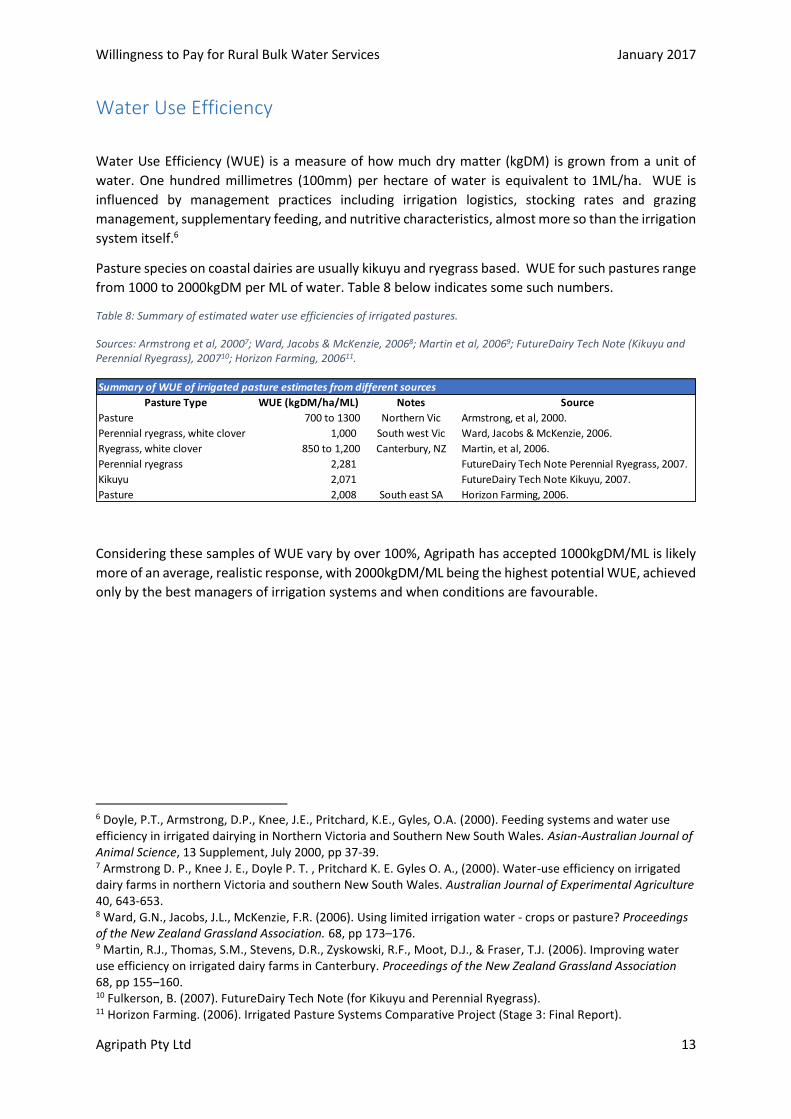
Water Use Efficiency
Water Use Efficiency (WUE) is a measure of how much dry matter (kgDM) is grown from a unit of
water. One hundred millimetres (100mm) per hectare of water is equivalent to 1ML/ha. WUE is
influenced by management practices including irrigation logistics, stocking rates and grazing
management, supplementary feeding, and nutritive characteristics, almost more so than the irrigation
system itself.6
Pasture species on coastal dairies are usually kikuyu and ryegrass based. WUE for such pastures range
from 1000 to 2000kgDM per ML of water. Table 8 below indicates some such numbers.
Table 8: Summary of estimated water use efficiencies of irrigated pastures.
Sources: Armstrong et al, 20007; Ward, Jacobs & McKenzie, 20068; Martin et al, 20069; FutureDairy Tech Note (Kikuyu and Perennial Ryegrass), 200710; Horizon Farming, 200611.
Considering these samples of WUE vary by over 100%, Agripath has accepted 1000kgDM/ML is likely
more of an average, realistic response, with 2000kgDM/ML being the highest potential WUE, achieved
only by the best managers of irrigation systems and when conditions are favourable.
6 Doyle, P.T., Armstrong, D.P., Knee, J.E., Pritchard, K.E., Gyles, O.A. (2000). Feeding systems and water use efficiency in irrigated dairying in Northern Victoria and Southern New South Wales. Asian-Australian Journal of Animal Science, 13 Supplement, July 2000, pp 37-39. 7 Armstrong D. P., Knee J. E., Doyle P. T. , Pritchard K. E. Gyles O. A., (2000). Water-use efficiency on irrigated dairy farms in northern Victoria and southern New South Wales. Australian Journal of Experimental Agriculture 40, 643-653. 8 Ward, G.N., Jacobs, J.L., McKenzie, F.R. (2006). Using limited irrigation water - crops or pasture? Proceedings of the New Zealand Grassland Association. 68, pp 173–176. 9 Martin, R.J., Thomas, S.M., Stevens, D.R., Zyskowski, R.F., Moot, D.J., & Fraser, T.J. (2006). Improving water use efficiency on irrigated dairy farms in Canterbury. Proceedings of the New Zealand Grassland Association 68, pp 155–160. 10 Fulkerson, B. (2007). FutureDairy Tech Note (for Kikuyu and Perennial Ryegrass). 11 Horizon Farming. (2006). Irrigated Pasture Systems Comparative Project (Stage 3: Final Report).
Summary of WUE of irrigated pasture estimates from different sources
Pasture Type WUE (kgDM/ha/ML) Notes Source
Pasture 700 to 1300 Northern Vic Armstrong, et al, 2000.
Perennial ryegrass, white clover 1,000 South west Vic Ward, Jacobs & McKenzie, 2006.
Ryegrass, white clover 850 to 1,200 Canterbury, NZ Martin, et al, 2006.
Perennial ryegrass 2,281 FutureDairy Tech Note Perennial Ryegrass, 2007.
Kikuyu 2,071 FutureDairy Tech Note Kikuyu, 2007.
Pasture 2,008 South east SA Horizon Farming, 2006.

Willingness to Pay for Rural Bulk Water Services January 2017
Agripath Pty Ltd 14
Cost of irrigation
At current water prices (2016-17) With current water prices and the above inputs (water licence and usage, electricity/pumping,
depreciation and labour), a cost of producing irrigated pasture from 1ML water can be calculated as
follows, using WUE of 2000kgDM/ML and 1000kgDM/ML. Based on the research undertaken, while
2000kgDM/ML is the potential water use efficiency, 1000kgDM/ML is a more achievable and realistic
WUE in a practical situation, given the influence of older on farm irrigation infrastructure and
technology and the influence of logistics and other factors in a commercial environment. Refer to
Table 8 above for further information.
In the following tables, calculations for cost of production using both High Security (HS) and General
Security (GS) are made. Note usage is assumed at 100% of allocation.
Table 9: Cost of producing pasture at WUE of 2tDM/ML, at 2016-17 water prices.
Pasture Production & Utilisation @ WUE of 2tDM/ML, at 2016-17 water prices
WUE 2000 kgDM/ 1 ML
Irrigation Costs NORTH COAST SOUTH COAST
Fixed HS $/ML 9.54 21.12
Fixed GS $/ML 7.25 10.09
Usage $/ML 45.04 40.38
WAMC (fix) $/ML 3.76 3.17
WAMC (use) $/ML 5.80 5.04
Electricity kW/ML 560 560
$/kW 0.15 0.15
Supply $/day 1.31 1.31
$/ML 82.56 82.56
Depreciation Capex $ 60,000 60,000
Years 10 10
ML/yr 200 200
$/ML 30 30
Labour $/ML 16 16
Total Costs HS $/ML 192.70 198.27
GS $/ML 190.41 187.24
HS $/kgDM 0.10 0.10
GS $/kgDM 0.10 0.09
GS Utilisation @ 65% $/kgDM 0.15 0.14
GS Utilisation @ 70% $/kgDM 0.14 0.13
GS Utilisation @ 75% $/kgDM 0.13 0.12
Italicised numbers are subject to change with irrigation system.
Willingness to Pay for Rural Bulk Water Services January 2017
Agripath Pty Ltd 15
These costs will change with the efficiency of the irrigation system and its management. For example,
a centre pivot uses less power to run and requires much less labour; pumping more each year will
decrease the depreciation per ML.
The ‘Utilisation’ number at the bottom of the table is an indication of the percentage of pasture that
is ‘harvested’ or utilised by the animal, relative to the pasture grown. Generally, pasture utilisation
figures of 65% to 70% are achieved in dairy production systems, dependent on factors including
grazing management and pasture species.12
At a conversion of 2tDM/ML as seen in Table 9, and with the scenario as assumed above for a travelling
irrigator, irrigated pasture production is costing approximately 10c/kgDM. This is a highly efficient
system and the literature (mentioned in Table 8) indicates this potential is not commonly achieved by
the typical irrigator.
12 Meat & Livestock Australia (2013). More Beef from Pasture: Pasture Utilisation. Retrieved on 13 January, 2017 from: mbfp.mla.com.au/Pasture-utilisation
Willingness to Pay for Rural Bulk Water Services January 2017
Agripath Pty Ltd 16
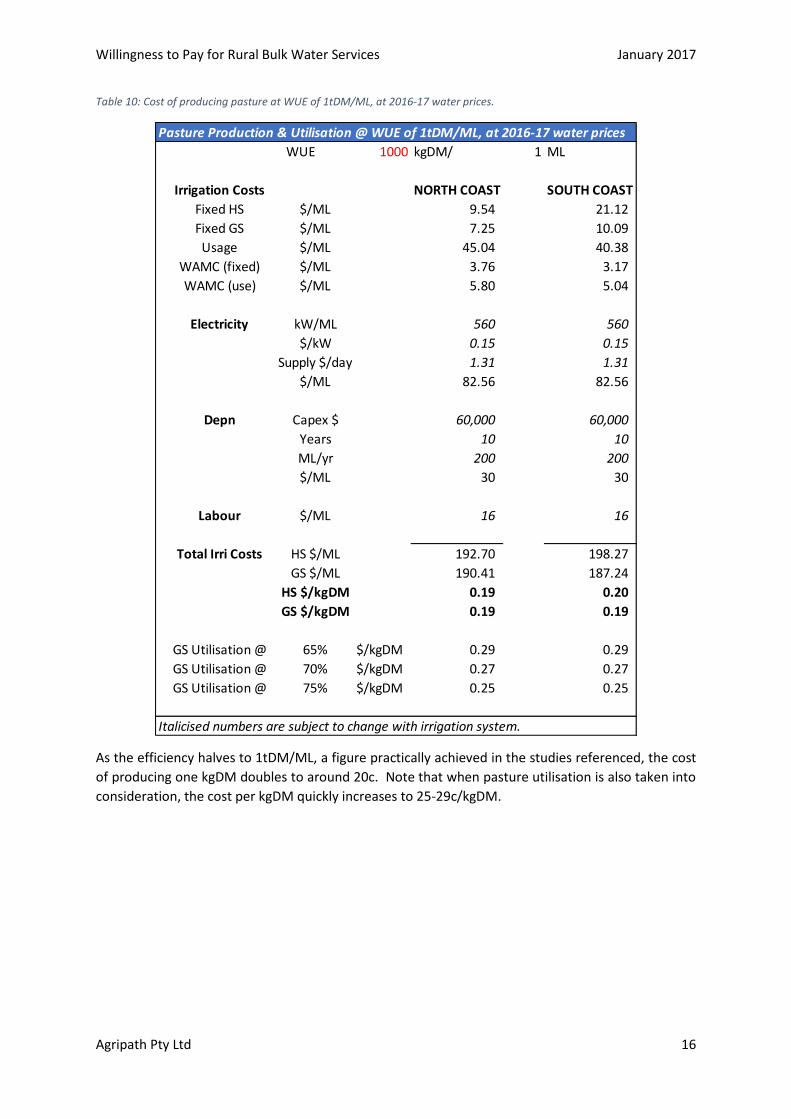
Table 10: Cost of producing pasture at WUE of 1tDM/ML, at 2016-17 water prices.
As the efficiency halves to 1tDM/ML, a figure practically achieved in the studies referenced, the cost
of producing one kgDM doubles to around 20c. Note that when pasture utilisation is also taken into
consideration, the cost per kgDM quickly increases to 25-29c/kgDM.
Pasture Production & Utilisation @ WUE of 1tDM/ML, at 2016-17 water prices
WUE 1000 kgDM/ 1 ML
Irrigation Costs NORTH COAST SOUTH COAST
Fixed HS $/ML 9.54 21.12
Fixed GS $/ML 7.25 10.09
Usage $/ML 45.04 40.38
WAMC (fixed) $/ML 3.76 3.17
WAMC (use) $/ML 5.80 5.04
Electricity kW/ML 560 560
$/kW 0.15 0.15
Supply $/day 1.31 1.31
$/ML 82.56 82.56
Depn Capex $ 60,000 60,000
Years 10 10
ML/yr 200 200
$/ML 30 30
Labour $/ML 16 16
Total Irri Costs HS $/ML 192.70 198.27
GS $/ML 190.41 187.24
HS $/kgDM 0.19 0.20
GS $/kgDM 0.19 0.19
GS Utilisation @ 65% $/kgDM 0.29 0.29
GS Utilisation @ 70% $/kgDM 0.27 0.27
GS Utilisation @ 75% $/kgDM 0.25 0.25
Italicised numbers are subject to change with irrigation system.
Willingness to Pay for Rural Bulk Water Services January 2017
Agripath Pty Ltd 17
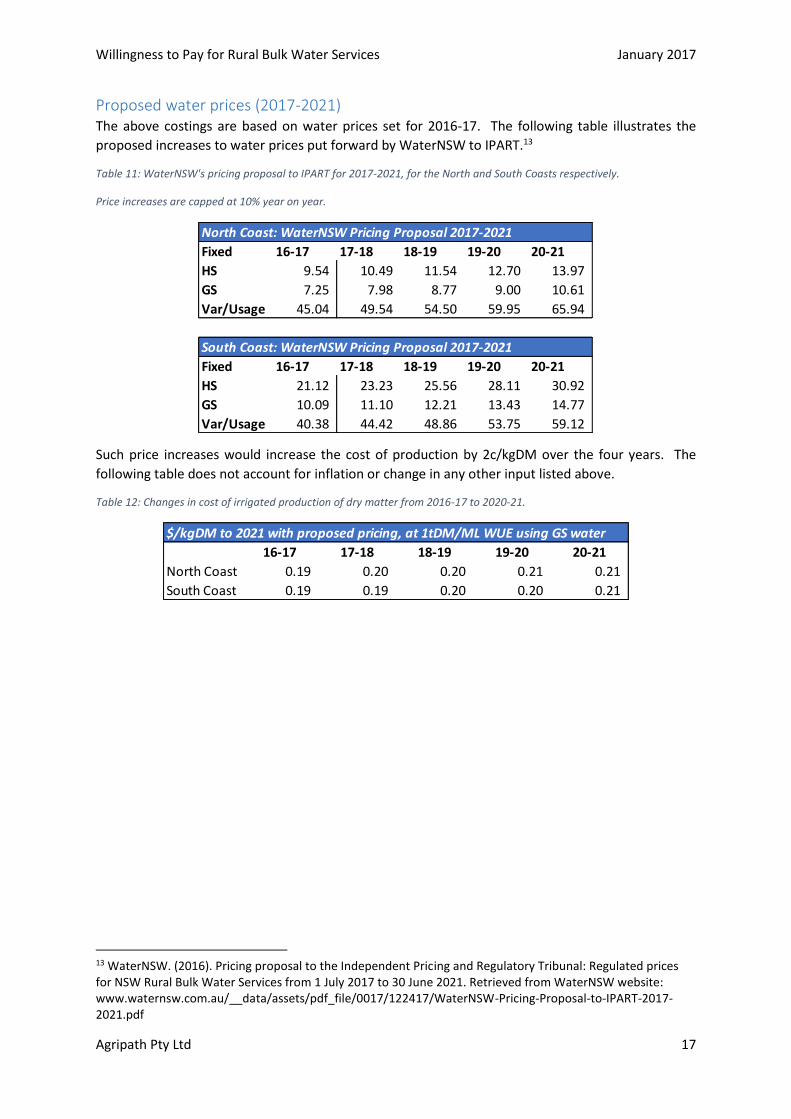
Proposed water prices (2017-2021) The above costings are based on water prices set for 2016-17. The following table illustrates the
proposed increases to water prices put forward by WaterNSW to IPART.13
Table 11: WaterNSW's pricing proposal to IPART for 2017-2021, for the North and South Coasts respectively.
Price increases are capped at 10% year on year.
Such price increases would increase the cost of production by 2c/kgDM over the four years. The
following table does not account for inflation or change in any other input listed above.
Table 12: Changes in cost of irrigated production of dry matter from 2016-17 to 2020-21.
13 WaterNSW. (2016). Pricing proposal to the Independent Pricing and Regulatory Tribunal: Regulated prices for NSW Rural Bulk Water Services from 1 July 2017 to 30 June 2021. Retrieved from WaterNSW website: www.waternsw.com.au/__data/assets/pdf_file/0017/122417/WaterNSW-Pricing-Proposal-to-IPART-2017-2021.pdf
North Coast: WaterNSW Pricing Proposal 2017-2021
Fixed 16-17 17-18 18-19 19-20 20-21
HS 9.54 10.49 11.54 12.70 13.97
GS 7.25 7.98 8.77 9.00 10.61
Var/Usage 45.04 49.54 54.50 59.95 65.94
South Coast: WaterNSW Pricing Proposal 2017-2021
Fixed 16-17 17-18 18-19 19-20 20-21
HS 21.12 23.23 25.56 28.11 30.92
GS 10.09 11.10 12.21 13.43 14.77
Var/Usage 40.38 44.42 48.86 53.75 59.12
$/kgDM to 2021 with proposed pricing, at 1tDM/ML WUE using GS water
16-17 17-18 18-19 19-20 20-21
North Coast 0.19 0.20 0.20 0.21 0.21
South Coast 0.19 0.19 0.20 0.20 0.21

Willingness to Pay for Rural Bulk Water Services January 2017
Agripath Pty Ltd 18
Cost of bought-in feed
Measuring the cost of each kgDM in a bought-in feed source is a way of comparing different feedstuffs.
Common pasture supplements fed to dairy cows in times of pasture or nutritional shortfalls include
cereal grains, lucerne hay and/or silage, pasture hay and/or silage and maize silage.
All options have been treated as purchased at market price, to avoid ambiguous data associated with
conserving home-grown feed (i.e. making own hay or silage).
Table 13 outlines some characteristics of common pasture supplements. Note these figures are on
farm (no freight included) and do not include any costs related to feeding out (labour, machinery use).
Leaving out these items is due to the range of costs for such items. Freight is dependent on the
distance to suppliers, and most dairies will source as locally as possible to keep freight costs down.
Feeding out methods can also vary, which affects both the labour required and wastage occurring as
part of feeding. Accounting for such items would increase the cost of dry matter.
As this study is focused on pasture growth under irrigation versus the alternative of buying in feed,
the focus is on the price per kgDM of each alternative.
The farmer’s decision is complicated by which dietary component is required (e.g. fibre, energy
and/or protein). Nutritional demands also play an important part in the decision to purchase
bought-in feed and the type of feed purchased. Nutritional levels of different feeds vary, so what
might be cheaper per kgDM can be more expensive per megajoule of metabolisable energy (MJME)
based on the constitution of the feed. Depending on what is limiting in the animal’s diet on any
given farm or time of year, a dairy farmer may change the supplement source or mix of sources to
better lift the limitation. For example, current grain prices are historically very low, so any deficiency
(such as energy) in the diet is likely to be filled first with grain. As fibre becomes limiting, as in the
case of pasture shortages, hay or silage is likely to be utilised.
Table 13: Cost per kgDM for selected hay and silage.
Magner, C. (2017)14; NSW DPI (n.d.)15. Barley is not included in the Average $/kgDM as it is not a substitute for pasture, though a common supplement to a point.
DairyNZ Supplementary Feed Calculator allows for feed wastage of 10% if feeding on a feed pad. This
increases the $/kgDM by an average of 4c/kgDM. Paddock feeding can have 20% wastage.16
The Dairy Farm Monitor Project NSW for 2015-16 indicate northern dairy farms spent an average of
$0.36/kgDM on silage and $0.32/kgDM of hay, which includes freight. Southern dairy farms spent
14 Magner, C. (2017). Personal communication, January 3, 2017. 15 NSW DPI (n.d.) Feed cost calculator. Retrieved from NSW DPI website: www.dpi.nsw.gov.au/animals-and-livestock/nutrition/costs-and-nutritive-value/feed-cost-calculator 16 Roche, J. (2015) To feed or not to feed: the science behind the DairyNZ Supplementary Feed Calculator. DairyNZ Technical Series Online. 27, pp 2.
Cost per kgDM of different feedstuffs (GST exclusive, on farm)
Source: Magner, C. (2017)
$/bale kg/bale % DM ME/kgDM CP kgDM/bale $/kgDM 10% 20%
Ryegrass Hay 90 300 88 8.3 6 264 0.34 0.38 0.41
Silage 90 600 45 10 17 270 0.33 0.37 0.40
Maize Silage 60 600 33 10.4 7 198 0.30 0.33 0.36
Barley Grain $/t 200 1000 90 13 11 900 0.22 0.24 0.27
Average $/kgDM 0.33 0.36 0.39
Source: NSW DPI (n.d.) kgDM calculations incl. Feed Wastage

Willingness to Pay for Rural Bulk Water Services January 2017
Agripath Pty Ltd 19
$0.17/kgDM and $0.29/kgDM on silage and hay respectively. Interestingly, the Top 25% dairies of
both northern and southern dairies, as ranked by Return on Assets, had lower home grown feed costs
(pasture and/or fodder crops), and excepting those in the northern group feeding hay, no silage or
hay was fed by the Top 25% in either group. The lower cost production in these systems for home-
grown feed may be outweighing the option of buying in feed.17
The willingness to pay for water would shift to less willing/more likely to buy in feed when the cost of
producing irrigated pasture reaches parity with the above feed costs, upward of 25 to 30c/kgDM. In
times of severe drought, the market for bought-in feed will appreciate dramatically as supply contracts
and demand increases.
17 Kempton, K & Nelson, N. (2016). Dairy Farm Monitor Project: New South Wales annual report 2015-16. Dairy Australia. * Please note the 19 northern and 16 southern farms include dairies not on the coast and not all irrigate.

Willingness to Pay for Rural Bulk Water Services January 2017
Agripath Pty Ltd 20
Willingness to Pay
Using current prices as the basis for costing irrigated pasture production in the scenarios as above,
there is already only a small margin (approximately 8c/kgDM) of difference between irrigated pasture
DM and the cost per kgDM of bought-in feed.
It should be noted, while pivot irrigation is one of the most efficient irrigation systems in terms of
water use, electricity/pumping and labour requirements, it is a large capital outlay to invest in such
infrastructure. Agripath was informed of current irrigator concern about the feasibility of irrigating,
and uncertainty about future irrigation leading to minimal reinvestment in irrigation infrastructure at
this point.
Agripath’s research also came across discussion on the ‘signals’ current pricing sends regarding
whether to irrigate or not. The fixed to usage split of cost recovery means 60% of revenue in the North
should be collected from licences (fixed costs) and the remaining 40% from usage. The opposite
(40%:60%) is true in the South Coast.18
Table 14: WaterNSW proposed user share of dam costs for 2017-21, split on current pricing formula.
With current usage/variable costs relatively high (currently at $45/ML and $40/ML respectively in the
North Coast and South Coast valleys), and licence (fixed) costs relatively low ($7/ML and $10/ML
respectively), some licence holders are willing to pay the fixed cost for their licence and not irrigate
(known as a sleeper licence). This leaves those who do irrigate to generate the same usage cost (in
the above example, $408,600 for the South Coast) across fewer ML of water. The shortfall between
revenue from usage costs and full cost recovery then becomes the subject of debate on who is
responsible to cover it.
Comment on other systems As the findings indicate irrigators are already very close to their willingness to pay, there appears a
need to look elsewhere, such as similar valleys, for ideas. Incentivising irrigation by changing the
pricing structure is something that has been achieved in the Hunter valley irrigation system. Like the
North Coast and South Coast, the Hunter had not been achieving full cost recovery until the pricing
structure of the water allocation was adjusted. Market water prices in the Hunter now sit at $14/ML
usage and $8/ML fixed. This decrease in price has maintained irrigation, which along with reduction
in operational costs around the level of service offered, has meant the Hunter is now achieving cost
recovery.
18 WaterNSW. (2016). Pricing proposal to the Independent Pricing and Regulatory Tribunal: Regulated prices for NSW Rural Bulk Water Services from 1 July 2017 to 30 June 2021. Retrieved from WaterNSW website: www.waternsw.com.au/__data/assets/pdf_file/0017/122417/WaterNSW-Pricing-Proposal-to-IPART-2017-2021.pdf
Proposed User Share split of costs for 2017-2021
North Coast South Coast
Total User Share 668,000 681,000
Fixed % 60% 40%
Fixed $ 400,800 272,400
Usage % 40% 60%
Usage $ 267,200 408,600

Willingness to Pay for Rural Bulk Water Services January 2017
Agripath Pty Ltd 21
Looking to other valleys, for example the Lachlan and Victorian Murray-Goulburn areas have a
temporary water trade market that is currently around $55 and $70/ML respectively.19,20 While this
is close to the proposed water price for the North Coast and South Coast for 2019-2020, the Lachlan’s
water costs, at fixed $3.28/ML and usage at $21.12/ML, are half what the coastal valleys pay.
Additionally, there is a market demand for irrigation water in the Lachlan and Murray-Goulburn, as
examples, that doesn’t exist currently in the North Coast and South Coast valleys. There may also be
higher competition in the inland valleys due to more varied irrigation users such as for vegetables,
cotton, rice. Further work would be necessary to determine dairy-only trade water market trends and
the relationship between their price of water and willingness to pay.
Other considerations There are other considerations to be had along with the cost comparison of irrigated pasture and
bought-in feed.
Based on conversations with the contacts provided by IPART, there may already be losses in efficiency
and hence cost-effectiveness of irrigation due to hesitancy to upgrade older irrigation infrastructure.
While some systems such as centre pivots are efficient both in irrigation, power usage, and labour
requirements, many systems are still older hand-shift type systems, requiring more labour and
electricity. South Coast irrigators, for example, indicate most systems are bike shift or travelling
irrigators, with 3 or 4 centre pivots in use (pers. comm. Steve Guthrey, December 22, 2016). For
infrastructure not used regularly throughout the year, there is little confidence to invest in upgrading
infrastructure. While more efficient producers might have a slightly higher willingness to pay, those
with less efficient systems will have a lower willingness to pay.
In short, producers need enough confidence that they will recoup their investment in an upgrade to
irrigation infrastructure. This lack of confidence in the long-term pricing of water needs to be
considered in any future pricing strategy.
If future pricing strategies are to stabilise or lower cost, then changes would need to consider:
- Increasing the amount of water used, to increase revenue. This could be either by
incentivising higher usage from current irrigators, or by attracting other industries to irrigation
use.
- Changing the running costs of the dam, to decrease costs
- Changing of the pricing structure, to incentivise irrigation
It was raised that current irrigated pasture production $/kgDM versus the $/kgDM of bought-in feed
in dairies is secondary or party to the view that the signals for users to irrigate are not very strong, so
irrigators are using their licences as little as possible, mainly as a supplementary input in dry seasons.
There is a Pricing Calculator in existence that is being developed by members of the Customer Service
Committee of WaterNSW. This concept has the potential to model changes in the current pricing
structure and the effects of such. Some possible scenarios include:
- A reduction in the CSO
- An increase in the revenue
19 Rawlinson & Brown (2017). National Water Exchange: water markets. Retrieved from Rawlinson & Brown website on Jan 10 2017: www.rawbrown.com.au/water-trading.php 20 Wilks Water (2017). Temporary water. Retrieved from Wilks Water website on Jan 11 2017: www.wilkswater.com.au/temporary-water#LachlanValley
Willingness to Pay for Rural Bulk Water Services January 2017
Agripath Pty Ltd 22
- Changes to fixed and usage prices, the potential effect of a minimum licence charge
Further exploration of this tool could be beneficial as another facet for consideration in the decision
making on pricing going forward.
The range of willingness to pay It is difficult to nominate a maximum water price that irrigators will be willing to pay for irrigation
water.
This point would be defined by the price at which the cost of production of irrigated pasture
($/kgDM) will be exactly equal with the cost of bought-in feed ($/kgDM), i.e. the specific price at
which supplementary feed is chosen over home-grown irrigated pasture.
This is due to the variation in:
- Individual farm irrigation efficiency (in infrastructure, labour, electricity, technology)
- Individual farm feeding efficiency (in infrastructure, labour, technology)
Consider Table 10 above, with the typical irrigator’s cost of production for the given set of
assumptions. There will be a range of costs of production of irrigated pasture around these figures,
as each farm will have a different efficiency of irrigation and different costs for other inputs such as
labour and electricity.
As an example, compare Famer A with Farmer B, remembering the typical irrigator based on
Agripath’s assumptions is faced with the following alternatives of supplementing the diet:
- Cost of irrigated pasture $0.27/kgDM
- Cost of bought-in feed $0.36/kgDM
Farmer A (an efficient irrigator) may have already invested heavily in the latest irrigation
infrastructure, resulting in increased water use efficiency, decreased electricity use and labour
requirements, and overall a cheaper cost of production. This farmer may only have modest
infrastructure and machinery for dealing with bought-in feed. Such a farmer may have a higher
willingness to pay threshold for irrigation water, because it is more efficient for this farmer to
irrigate than it is to buy in feed.
Farmer A may be therefore faced with the following alternatives:
- Cost of irrigated pasture $0.20/kgDM
- Cost of bought-in feed $0.36/kgDM
Farmer B (an efficient feeder and typical irrigator) may have older irrigation equipment that has a
higher electricity demand, higher labour inputs, and is not as efficient in its conversion of water into
pasture or utilisation of that pasture. This farmer may also have invested in infrastructure,
machinery and technology such as a feed pad or feeding system as part of the dairy shed, resulting
in lower wastage and lower labour requirements. For such a farmer, the willingness to pay for
irrigation water may have a lower threshold, as it is more efficient to feed than it is to irrigate in such
a scenario.
Farmer B may be therefore faced with the following alternatives:
- Cost of irrigated pasture $0.27/kgDM
- Cost of bought-in feed $0.30/kgDM
Willingness to Pay for Rural Bulk Water Services January 2017
Agripath Pty Ltd 23
For our example farmers, Farmer A is well below their maximum willingness to pay. The point where
the cost of irrigated pasture production is equal to $0.36/kgDM, i.e. the theoretical willingness to
pay, is $166/ML. However, unless this producer was one of the very top farms, the average dairy
farm will be constrained by whole farm economics not the price of water alone (see Table 3), and is
not irrigating year-round.
Farmer B is not quite at the maximum willingness to pay for irrigation water, but would likely chose
to feed barley as a short-term supplement at $0.22/kgDM. For the irrigated pasture production to be
on par with barley per kgDM, the theoretical willingness to pay is $17/ML.
Based on the above scenarios, the theoretical willingness to pay ranges from $17/ML to $166/ML.
This indicates the willingness to pay threshold is being approached, and in some cases, will have
already been reached at current prices.

Willingness to Pay for Rural Bulk Water Services January 2017
Agripath Pty Ltd 24
Conclusion
Current water prices mean the cost of producing irrigated pastures is approximately eight cents
cheaper per kilogram of dry matter than buying in feed, based on the scenario modelled. If the
proposed water pricing from WaterNSW goes ahead, by the end of the four years (2021), the cost of
irrigated pasture DM versus bought-in feed DM will be within five cents. Note this assumes no change
in other costs associated with irrigating, or bought-in feed, and acknowledges there is a range of
production efficiency in any industry. This means while some more efficient water users may be
willing to pay more, those with less efficient irrigation may already be at parity for their production
system, as discussed above.
Using the proposed prices as below, the cost of production of irrigated pasture is within 5c of the cost
of bought-in feed. There are likely already producers who have reached the point at which their
willingness to pay for irrigation water has been surpassed.
Table 15: Summary of cost comparison of willingness to pay, based on home-grown versus bought-in feed costs.
On this basis, Agripath finds the perception of irrigators on the North Coast and South Coast being
‘priced out’ of irrigating to be a relevant concern, as irrigated pasture production is realistically already
close to the cost of bought-in feed to be of importance. This study indicates that any future increase
in water prices from current levels would be expected to lead to changes in overall usage.
Qualitative factors such as confidence to upgrade irrigation infrastructure needs to be considered.
Future pricing strategies should also consider incentivising current customers to increase usage,
attracting new industries to using the Rural Bulk Water Service, and looking at dam operational and
capital expenses. The option of adjusting the current pricing structure (fixed and usage prices), as has
been done in the Hunter Valley, requires further investigation.
For methods and formulas behind the tables in this report, please see the accompanying Excel file.
Summary of cost comparison of home-grown & bought-in feed, at GS prices
Bought-in
$/kgDM $/ML $/kgDM $/ML $/kgDM
2016-17 0.27 52.29 0.27 50.47 0.36
2017-18 0.28 57.52 0.27 55.52 0.36
2018-19 0.29 63.27 0.28 61.07 0.36
2019-20 0.30 68.95 0.29 67.18 0.36
2020-21 0.31 76.55 0.30 73.89 0.36
Note:
North Coast South Coast
Home-grown feed at 1kgDM/ML @ 70% utilisation. $/ML is GS + Usage,
excluding WAMC fees. Bought-in feed $/kgDM includes 10% wastage.
Home-grown