
Willing but Unable: Short-Term Experimental Evidence … · Willing but Unable: Short-Term...
63
Willing but Unable: Short-Term Experimental Evidence on Parent Empowerment and School Quality * Elizabeth Beasley † and Elise Huillery ‡ January 19, 2015 Abstract Giving communities power over school management and spending decisions has been a favored strategy to increase school quality, but its effectiveness may be limited by weak capacity and low authority. We examine the short-term responses of a grant to school committees in a context of low authority and capacity, and find that overall, parents increased participation and responsibility, but these efforts did not improve quality. Enrollment at the lowest grades increased and school resources improved, but teacher absenteeism increased, and there was no impact on test scores. We examine heterogeneous impacts, and provide a model of school quality explaining the results and other results in the literature. The findings of this paper imply that strategies to improve quality by empowering parents should take levels of community authority and capacity into account: even when communities are willing to work to improve their schools, they may not be able to do so. 1 Introduction The dramatic expansion of access to schools in the last two decades is the result of an unprecedented effort to increase education in poor countries. However, the quality of education is often low, and in some cases getting worse as enrollment increases. One common strategy to improve quality * This work was supported by the World Bank and the donor partners of the Education for All Fast Track Initiative through the Education Program Development Fund. Cornelia Jesse led the implementation of this project and contributed substantially to its design, and we are deeply indebted to her for her leadership. We thank Yann Algan, Bruno Cr´ epon, Esther Duflo, Pascaline Dupas, Pierre de Galbert, Emeric Henry, Cornelia Jesse, Florian Mayn´ eris, Miguel Urquiola and the seminar participants at J-PAL Europe, Sciences Po, Columbia University, Oxford University, UCL, Paris I and the Journ´ ees d’Economie Publique Louis-Andr´ e G´ erard-Varet for helpful comments and discussions. We also thank several anonymous referees for thoughtful and detailed suggestions. We thank the Government of Niger and the staff of the Ministry of Education for their collaboration. Much of the project was carried out when Elizabeth Beasley was at J-PAL Europe and she thanks J-PAL for their support. We thank Adama Ouedraogo for his support throughout the project, and are grateful to Pierre de Galbert for excellent project management and Gabriel Lawin for data collection and management, and also Elizabeth Linos, Andrea Lepine and Hadrien Lanvin for excellent research assistance. Finally, and most importantly, we gratefully acknowledge the parents, staff and pupils of the schools for the time and information they shared with us. All errors remain our own, and the opinions expressed in this paper are ours alone and should not be attributed to the institutions with which we are associated, the World Bank or the Government of Niger. † Sciences Po, LIEPP ([email protected]) ‡ Sciences Po, Department of Economics and J-PAL ([email protected]) 1
Transcript of Willing but Unable: Short-Term Experimental Evidence … · Willing but Unable: Short-Term...

Willing but Unable: Short-Term Experimental Evidence on
Parent Empowerment and School Quality∗
Elizabeth Beasley†and Elise Huillery‡
January 19, 2015
Abstract
Giving communities power over school management and spending decisions has been a
favored strategy to increase school quality, but its effectiveness may be limited by weak capacity
and low authority. We examine the short-term responses of a grant to school committees in
a context of low authority and capacity, and find that overall, parents increased participation
and responsibility, but these efforts did not improve quality. Enrollment at the lowest grades
increased and school resources improved, but teacher absenteeism increased, and there was
no impact on test scores. We examine heterogeneous impacts, and provide a model of school
quality explaining the results and other results in the literature. The findings of this paper
imply that strategies to improve quality by empowering parents should take levels of community
authority and capacity into account: even when communities are willing to work to improve
their schools, they may not be able to do so.
1 Introduction
The dramatic expansion of access to schools in the last two decades is the result of an unprecedented
effort to increase education in poor countries. However, the quality of education is often low, and
in some cases getting worse as enrollment increases. One common strategy to improve quality
∗This work was supported by the World Bank and the donor partners of the Education for All Fast TrackInitiative through the Education Program Development Fund. Cornelia Jesse led the implementation of this projectand contributed substantially to its design, and we are deeply indebted to her for her leadership. We thank YannAlgan, Bruno Crepon, Esther Duflo, Pascaline Dupas, Pierre de Galbert, Emeric Henry, Cornelia Jesse, FlorianMayneris, Miguel Urquiola and the seminar participants at J-PAL Europe, Sciences Po, Columbia University, OxfordUniversity, UCL, Paris I and the Journees d’Economie Publique Louis-Andre Gerard-Varet for helpful commentsand discussions. We also thank several anonymous referees for thoughtful and detailed suggestions. We thankthe Government of Niger and the staff of the Ministry of Education for their collaboration. Much of the projectwas carried out when Elizabeth Beasley was at J-PAL Europe and she thanks J-PAL for their support. We thankAdama Ouedraogo for his support throughout the project, and are grateful to Pierre de Galbert for excellent projectmanagement and Gabriel Lawin for data collection and management, and also Elizabeth Linos, Andrea Lepine andHadrien Lanvin for excellent research assistance. Finally, and most importantly, we gratefully acknowledge theparents, staff and pupils of the schools for the time and information they shared with us. All errors remain our own,and the opinions expressed in this paper are ours alone and should not be attributed to the institutions with whichwe are associated, the World Bank or the Government of Niger.†Sciences Po, LIEPP ([email protected])‡Sciences Po, Department of Economics and J-PAL ([email protected])
1

is through improved management and oversight, and in particular by increasing involvement of
parents and the community (World Bank, 2004). Community-based management policies have
been widely adopted throughout the world over the past decade1 (see Barrera-Osorio et al, 2009
for an overview). Grants to school committees are one potential way to increase school quality by
increasing school resources and spurring parent participation. Such a strategy assumes that parents
have the time, energy, and capacity to undertake these tasks. Given the heavy investment in such
programs, it is important to understand whether, and under which circumstances, they can actually
work.
This paper provides evidence from a program to encourage parent participation in school man-
agement, in a context of low parent authority and capacity, through placing financial resources
directly under parent control. We show that parent contributions were not crowded out, and, on
the contrary, parents increased participation and responsibility over school management without
changing the amount of their financial contribution on average. We also observe more coopera-
tion between school stakeholders. However, this increased participation and cooperation did not
translate into increased quality: parents were willing, but unable, to increase quality through par-
ticipation. On average, teacher attendance declined slightly and there was no impact on test scores,
though there were improvements in school infrastructure and resources, and a small increase in stu-
dent participation at the lowest grades. We use detailed analysis of shifts in spending, as well as an
examination of heterogeneous impacts, to try to better understand the lack of impact on quality.
The analysis shows that authority and capacity are important prerequisites for parents to undertake
the more difficult aspects of management, that an alliance between parents and teachers may work
better than a confrontational relationship, and that it should not be taken for granted that parents
will always make optimal spending decisions to increase quality. We present a classical model of
school quality, with two new parameters, teachers’ preference for a centralized government and
parents’ real authority, and show that with this we can explain our results as well as the existing
evidence on the effects of participatory programs.
This study is related to two different strains of the literature: parent participation and school
resources. Previous evidence on the effectiveness of programs to increase quality via increased
1School-based management programs have been implemented in Argentina, Australia, Bangladesh, Canada,Guatemala, Honduras, Hong-Kong, India, Lebanon, Lesotho, Macedonia, Madagascar, Mexico, Nicaragua, thePhilippines, Senegal, Serbia, Sri Lanka, the Gambia, the United Kingdom, and the United States (Duflo et al,2012).
2

parent participation is mixed. Banerjee et al (2010) report that providing information to parents
about the school committee and training the community to measure educational performance in
India had no impact on the activity of school committees, and therefore no impact on education
outcomes. Duflo, Dupas and Kremer (2012) find that a training to empower the parents helped
mitigate the negative response of regular teachers to the addition of a contract teacher. Blimpo
and Evans (2011) find no impact of a training for school committees on learning except when the
school committee members were educated. In a paper that touches on the issues of authority
addressed here, Pradhan et al. (2014) find that an intervention to empower parents is effective
only when combined with an intervention fostering the ties between the school committee and a
local governing body. Other studies have argued that empowering the community to manage schools
improves school quality, though these papers generally do not include random variation in treatment
assignment and so the identification is weaker. Bryk et al. (1998) and Hess (1999) have argued
that student achievement improved in Chicago after the implementation of reform involving the
community in school management and Di Gropello (2006) overviews four school-based management
programs in Latin America and concludes that school-based management models have led generally
to greater community empowerment and teacher effort. The context of rural Niger is likely to be
substantially different from the context in Chicago or even some Latin American countries.
Previous studies on increasing school resources have found that such programs may have the
effect of crowding out the contributions of other actors. For example, parents in Romania decreased
time spent on homework when their child gained admittance to a better school (Pop-Eleches and
Urquiola, 2013). In Zambia and India, households decreased spending for education when they an-
ticipated an increase in school funding (Das et al., 2013). In Kenya, civil-servant teachers decreased
presence at school when school committee hired an extra-teacher (Duflo, Dupas and Kremer, 2012).
We present a model that helps to explain the different findings in the literature and to formalize
our argument that the extent to which communities can achieve the task set before them depends
on the willingness, ability and authority of parents: it may be costly and time-consuming, parents
may not have good information about how schools work and thus may not make optimal decisions,
and it may be very difficult in practice to put pressure on teachers to improve service quality. It
may be particularly difficult since capacity depends on parent power vis-a-vis teachers, or “real
authority” in the terms of Aghion and Tirole (1997), who underscore the fact that formal authority
3

(the right to make decisions) need not imply real authority (effective control over decisions)2.
The data we use is from an experiment in a low authority context. In Niger, levels of education
among adults are extremely low: 70% of the population age 15-44 in 2010 had no education3, and the
system for education is very hierarchical. In a controversial pilot program, the Ministry of Education
of Niger, in partnership with the World Bank, gave grants, explicitly under school committee control,
to schools with the aim of increase parent involvement and, consequently, the quality of education.
All school committees in this experiment had been trained on how to manage schools, and the grant
was randomly allocated to half of the school committees. We use detailed survey information and
administrative data to assess the impact of the grant on parent empowerment, school management,
and school quality. An important limitation of the study is that it provides only short-term evidence
on behavioral responses: the first grant arrived late 2007 and was meant to continue over years, but
a political coup occurred in 2009 and the evaluation ended. A survey took place in April-May 2008
and administrative data was collected at the beginning of the 2008-2009 school year. This paper
thus documents the short-term dynamics of an anticipated long-term program.
On average, we find that parents were willing to increase their participation in school manage-
ment, but educational quality did not improve in a meaningful way as a result of this participation.
There is an overall positive impact of the grant program on parents’ involvement and responsibility:
communities with the grant engaged in more participation actions (such as going to meetings and
managing school supplies) and took over more responsibilities, although the average community
did not engage in supervising teacher presence. Another finding related to parent response to the
grant is that parents did not reduce their own contributions in response to the grant.
The impact on school management is mixed: cooperation between school stakeholders improved,
but overall accountability did not change, and spending shows both expected and unexpected
changes: there was more spending in infrastructure, but also school festivals and playground equip-
ment, and, most unexpectedly, investment in agricultural projects which were, probably, non-
educational but intended to make a profit4.
2Policies of de jure autonomy do not always lead to de facto autonomy (King and Ozler, 2004), and so participationmay not be meaningful if communities have no actual power and even increase inequality by “leaving the poor behind”(Galiani et al, 2008)
3World Development Indicators, World Bank, source: International Institute for Applied Systems Analysis(IIASA)
4While such loans and investments were clearly not the intended or permitted use of the grants, more informationon whether the profits of these investments eventually benefited the schools is needed to conclude whether this wasa poor use of funds or not.
4

Finally, school quality did not improve with these changes, at least in the short term. There
were subsequent improvements in infrastructure and health resources, as well as an increase in
participation in the grade 1: fewer dropouts in 2007/2008 and increased enrollment in grade 2 in
2008/2009, but test scores were not changed. We also observe a small but significant decrease in
teacher effort in response to the grant, which we attribute to the fact that some teachers have
a preference for a centralized government and might be reluctant to collaborate with parents,
especially when parents do not invest the money to their advantage.
We examine heterogeneous effects along several different dimensions, and here we highlight
three interesting patterns. First, we find that in situations where the school committee is educated
or has experience in another community organization - both of which we take as proxies for real
authority - parents increased monitoring teacher attendance in response to the grant (though this
did not mitigate the negative effect of the grants on teachers). Second, in one-teacher schools,
school committees increased the expenses which directly benefit the teacher, and teacher attendance
increased in response to the grant in these schools. These results together suggest that teachers’
response to parent participation depends on whether parents are acting in opposition to, or alliance
with, the teachers. Third, we find that rural schools used some of the grant to invest in agricultural
opportunities5, and urban schools did not but invested in school infrastructure instead.
This paper makes three contributions. First, it provides evidence on the short-term parent and
teacher behavioral responses to an increase in school resources under parental control in a context
where parent capacity and authority is low. Second, the very rich information we collected provides
evidence on different dimensions of spending, contributions, involvement and responsibility. Third,
the paper provides a theoretical framework that formalizes parent and teacher behavior in school
in order to clarify how a change in school resources (either under teacher or under parent control)
affects school quality directly and through behavioral responses, explaining both our results and
the existing results in the literature. This framework also provides some structure for the idea
that power relationships between teachers and communities changes how they respond to policy.
In addition, we show that empowering one actor may disempower another actor. Our paper is
a first attempt to formally take into account real authority as a necessary condition for parent
participation programs’ success.
5This difference may be related to severe credit constraints in rural areas, which are likely to be less severe inurban areas.
5

The remainder of the paper is as follows. Section 2 presents some background information on
education in Niger, and describes the school grant experiment. Section 3 presents the data and our
estimation strategy and Section 4 the empirical results. Section 5 presents a model of the dynamics
of school resources, parent and teacher effort in producing education that explains the existing
empirical evidence. Section 6 concludes.
2 Experimental Set-Up
2.1 Background on Education in Niger
Niger had made remarkable progress in education access in the decade prior to this evaluation:
the number of children enrolled in primary school had more than doubled from 656,000 in 2000 to
1,554,102 in 2008, and net enrollment had risen from 27% to 49% in the same period. However,
only 44% of children who begin primary school finished all grades, and only 43% of sixth graders
who took the national exam at the end of primary school passed it.6 Literacy rates are low, and
education may be able to substantially improve livelihoods: the World Bank estimates that being
able to read raises a Nigerien person’s income by 150% (World Bank, 2010).
The education system in Niger has traditionally been very hierarchical and rigid. Inherited
from French colonization, the system replicates the French education system : highly centralized,
with little, if any, room for local community participation. Unlike other systems, where the school
might be supervised by a local governmental bodies, there was no way for the local community
to determine school policy or practice. Schools depended entirely on the hierarchical chain that
originated in the Ministry of Education (except for some local fundraising or user fee collection,
but these efforts were undertaken only when needs were not provided for by the Ministry).
In 2006 the Ministry of Education in Niger introduced school committees in all primary public
schools in order to improve quality. These school committees (called the COGES) were designed to
implicate parents and community members in the school, improve accountability, improve manage-
ment, and thus enhance access to and quality of education.7 As discussed in the introduction, the
6The situation has continued to improve in terms of access to education: in 2011, net enrollment in primary schoolwas 62%, and primary completion rates had risen to 46%.
7These school committees consist of 6 representatives, including the school director, who serves as secretary,and parent representatives. The parents are supposed to elect the representatives, who may also be the leadersof the Parent Association (APE), which includes all parents, and the Mother’s Association (AME), which includesall mothers. In practice, the composition of the COGES varies by school. School committees are supposed to beresponsible for the management of personnel resources (e.g. monitoring of teacher attendance and performance),
6
establishment of local community groups for the purpose of improving public service provision via
community participation is a strategy that many country governments and civil society organiza-
tions advocate. In many respects, the circumstances of Niger make a strong case for school-based
management: low population density, vast distances and limited transportation and information
and communications infrastructure makes supervision of primary schools by the central govern-
ment (or its regional structures) very costly, and the transmission of timely, local information to
the central authorities for planning purposes is challenging.
In the districts where this program was carried out, the COGES were trained in financial
management, governance (elections) and project planning. The training was carried out by multiple
organizations. In 2006, a significant number of the newly created and trained school committees
were not very actively engaged in school matters, nor did they develop an school improvement
plan for the year. To spur school committee involvement and activity, the Ministry of Education
introduced school grants in order to give the committees an incentive to meet, plan and undertake
activities. The grants were expected to improve school management through increased parental
participation and accountability, to improve school infrastructure and the quality of education,
and to potentially increase enrollment rates. The pilot project was carried out as a randomized
evaluation in order to provide reliable information on impact prior to national scale-up.
2.2 Experimental Design
The evaluation design included 1,000 schools in two regions of Niger, Tahoua and Zinder, randomly
selected out of the 2,609 total public primary schools in those districts. Once these 1,000 schools
were determined to be representative of all the public primary schools in Zinder and Tahoua, half
of the 1,000 schools, i.e. 500 schools, were randomly assigned to receive the grants and became
the treatment group. The other 500 schools served as a control group. Both randomizations
were stratified on inspection (a geographical administrative unit), existing support for the school
committee (e.g. existing programs or sponsorship by NGOs), and whether the school was indicated
as being in a rural or urban area by ministry records. Strata were constructed by grouping the
schools into inspection, then within each inspection into whether or not the school had existing
financial resources (e.g. school meal funds) and material resources (e.g. purchase and management of textbooks,supplies etc.). One of the school committee’s central tasks is the drafting of an annual school improvement plan thatincludes its projects, activities, budget, and timelines to guide its work for the school year. The school committeeworks parallel to the APE and AME.
7

support, and then within each of those groups, whether the school was in an rural or urban area.
This gave 50 strata. Schools were assigned a random number between 0 and 1, and within each
strata they were sorted by this random number, with the first half being assigned to treatment
and the second to control. Data from the Administrative School Census in 2005-2006 (the school
census is described below) was used to confirm balance between control and treatment schools
along various observable characteristics (data from 2006-2007 was not yet available at the time of
sampling in August 2007). Table 1 shows p-values for the test of equality of means across control
and treatment, from which we cannot reject any equality of means.
The size of the grant was based on the size of the school (the number of classrooms), and the
average was $209 per school, or $1.83 per student. The grant was a relatively modest amount
that was determined by considerations of financial sustainability in view of a potential extension
of the program by the government. On average, the control schools raised a little over $0.60 per
year per student, and so the grant is relatively much larger than usual fund raising. For an idea
of scale, the amount of the grant was not, except in the very largest schools, sufficient to build
an additional classroom. This grant amount is smaller than grants provided to school committees
in the literature: Blimpo and Evans (2010) use a grant of $500 per school in Gambia. Gertler,
Patrinos, and Rodrıguez-Oreggia (2010) use grants of US$500 to US$700 per school in Mexico, and
Pradhan et al. (2014) evaluate a grant of US$326 (to be completed soon with another US$544) per
school in Indonesia. 8
About a month before the grant arrived, all 500 treatment schools (and school committees)
received a general letter informing them of the grant program and its objectives, and the grant
amount allocated to their school. It also included general guidelines on the use of the grants, but
the specific activity to be supported by the grants was decided on by the school committee.9 One
copy of this letter was distributed to the school director and a second copy to the president of the
school committee before the arrival of the grants. As to compliance and program execution, the
8The school committees selected for treatment received the grants in the last months of 2007 and first months of2008. Note that schools do not, in general, receive other financial transfers from the government. The governmentdoes provide material in kind, such as books and classrooms, and teacher salaries are paid by the government(though payment has been irregular in the past). Some schools receive support from other community organizationsor NGOs, but in general the amount of cash income available to schools is very small and is obtained through parentalcontributions. Since governmental contribution is in kind, we do not observe school budgets, but there is no doubtthat the grant was very small relative to school budgets.
9One randomly selected group of schools received a slightly more restrictive list of potential expenditures, andanother group received a warning that their projects might be audited. Analysis of spending patterns did not showany difference between these groups.
8

grants arrived in 498 schools of the 500 program schools, 492 in the exact amount allocated to them
and six in an different amount (see Section 3.1.4 for further details on compliance).
The school committees used the grants in a variety of ways. Eighty-five schools were randomly
selected for a detailed questionnaire on grant arrival and spending. The most common use was
material inputs such as construction and office supplies, and other uses included investment projects,
health and sanitation projects, and transportation. Overall, the largest share of spending of the
grant was in construction, representing 32% of the total amount spent (Figure 1). Construction
activities included building classrooms, but communities also constructed lodging for teachers,
latrines, school enclosures, and other buildings. Other projects including electrification or producing
copies of exams were also undertaken. Fourteen percent of schools surveyed used at least part of
the grant on some sort of agricultural investment project. It is unclear whether the loans or small
business projects have been profitable. In the result section below, we present the impact of the
grant on the composition and volumes of school committee spendings using the whole school sample.
The program was originally intended to last three years (with three cycles of grant disbursement).
Due to issues with the financial transfer mechanism at the central level and political disruptions in
2009, the evaluation was terminated after only one year.
3 Data and Empirical Strategy
3.1 Data
3.1.1 Sources
Data come from three sources: (i) administrative data on primary schools (the Ministry of Educa-
tion’s annual school census, also called administrative data), (ii) an evaluation survey administered
to school staff and two members of the school committee at treatment and control schools and (iii)
a financial survey administered to one member of the school committee on a subset of treatment
schools.
The Ministry of Education in Niger administers an annual census of all primary schools, in-
cluding community schools and medersas (Koranic schools), which provide data on enrollment,
teacher characteristics, school facilities and resources, and community characteristics. We use the
2006/2007, 2007/2008 and 2008/2009 censuses . Each census is collected in the fall of the school
9

year (for example, the 2008/2009 census contains the information reported by the schools in fall of
2008).
In addition to the administrative data, the Ministry and the World Bank worked with a local
NGO to prepare a detailed school survey to be administered to the 1,000 schools included in
the experiment in April/May 2008, five to six months after grant distribution, to understand the
immediate effects of the grant. This questionnaire included information on school infrastructure and
resources, pupil enrollment and attendance, school improvement plan, school committee functioning
and membership, and school activities. It also asked detailed questions about the level of education
and personal wealth of the school committee members. Three tests were also administered at this
time: a math test, a french test, and an oral exam. The oral exam was administered to the youngest
(grades 1 and 2) pupils. Teacher’s physical presence at that visit was also recorded. The visit was
on a day when the school was supposed to be open, but was not announced in advance.
Finally, a financial survey was administered to 85 randomly selected treatment schools in Jan-
uary/February 2009, asking detailed questions about the receipt and spending of the grants, any
problems with the administration of the grant, and use of the grants (including the existence of a
receipt for each expenditure).
3.1.2 Outcomes
To draw general conclusions about the experiment’s impact, simplify interpretation, and to guard
against cherry-picking of results, we present some findings for indices that aggregate information
over multiple outcome variables (following Kling et al, 2007). The aggregation also improves sta-
tistical power to detect effects that go in the same direction within a domain. The summary index
Y is defined to be the equally weighted average of z-scores of its components, with the sign of each
measure oriented so that more beneficial outcomes have higher scores. The z-scores are calculated
by subtracting the control group mean and dividing by the control group standard deviation. Thus,
each component of the index has mean 0 and standard deviation 1 for the control group. The index
is the average of the non-missing components, as long as the school has a valid response to at least
two components. If only one component is available (or if no components are available), the school
is dropped. We present three different types of outcomes: parent participation, school management,
and school quality, as well as enrollment and test scores.
10

Parent Participation in School
We construct four indices to describe the effect of the grant on parent participation in school: parent
contributions, involvement, responsibility, and teacher oversight. See the Appendix for details on
the construction of the indices.
Parent Contributions Parent contributions reflect the material resources that parents provide
to the school: the amount of fees, in-kind contributions and additional financial contributions
(fundraising). Since it is not possible to estimate the amount of in kind contributions as we do not
have information on the local market price of the items contributed, we use a dummy indicating
whether the community provided some in-kind contributions to the school or not. Fundraising is
measured through the question “How much money has the school raised since the beginning of
the school year?”. The answer to this question was divided by the number of pupils registered in
2007/2008. The variable we use is thus funds raised per pupil10. Finally, the amount of fees charged
per pupil is declared by the school director.
Parent Involvement Parent involvement measures the volume of parent participation in school
management. We use 11 variables to measure parent involvement, of which nine use information
from the April/May 2008 questionnaire: the number of school, communal, and parent committee
meetings, the time elapsed since the last school or parent committee meeting, the number of topics
which were discussed at the last school or parent committee meeting, and two measures of presence
at the last school or parent committee meeting. From the 2008/2009 administrative data, we
also use the number of school committee meetings and a dummy indicating whether the mother’s
association was active or not.
Parent Responsibility The parent responsibility index measures the extent to which parents
take some responsibility and exercise authority in making decisions. We use eight variables to
measure parent responsibility, all dummies for whether the school committee is in charge of moni-
toring pupil attendance, sanctioning pupils for poor attendance, collecting financial contributions,
10In the context of Niger, the funds are essentially provided by parents since there are very few NGOs. But itis important to note that our measure of financial contributions encompasses parental contributions and any otherpotential donors.
11

spending financial contributions, purchasing supplies, investing in infrastructure, and setting up
the action plan.
Teacher Oversight One possible consequence of more empowered parents would be that parents
engage in teacher oversight. We use six separate variables to measure teacher oversight: dummies
indicating whether the COGES is in charge of monitoring teacher attendance, whether the COGES
has taken remedial action against a teacher for repeated absence (remedial actions include talking to
the teacher, giving a warning, or complaining to the teacher’s supervisor). We also use dummies for
whether the school or parent committee discusses teacher behaviour in school or parent committee
meetings. Finally, we use dummies for whether the school committee spontaneously mentions being
active to reduce teacher absenteeism or improving education quality11.
School Management
We construct three indices to describe the effect of the grant on school management: accountability,
cooperation, and expenses.
Accountability The accountability index reflects the capacity to keep track of facts, decisions
and expenses, as well keeping receipts, although having receipts for everything is generally difficult
for the communities. While most schools claim to keep registers for fundraising and expenses, fewer
are usually able to produce registers to be seen by the interviewers. The same is true for the school
action plan, seen by many as the key activity of the school committees. The government encourages
schools to keep records on a number of subject matters: inspector visits, pupil attendance, teacher
attendance, weekly activities, supplies, fundraising, and expenses. School committees and parent
associations are also supposed to take minutes at each meeting. The accountability index is com-
posed of 10 dummies for the presentation to the interviewer of a written school action plan, registers
for pupil attendance, inspector visits, weekly activities, supplies, fund collection, fund expenditure,
and teacher attendance, and minutes for the last school or parent committee meeting. The data
for this index comes from the April/May 2008 survey.
11The school committee president was asked to list the domains in which the committee is active, without suggestingany particular domain in order to avoid prompting responses. We thus elicit activities that come naturally to thetop of school committee president’s mind.
12

Cooperation We use information about cooperation among school stakeholders, in particular
between the school committee and the other actors, to assess whether the grant affected the quality
of stakeholder relationships within schools. Our measures of cooperation are all self-reported by
school stakeholders (the school director or the school committee president), which implies that we
measure perceived cooperation which might differ from actual cooperation. The cooperation index
is composed of 11 components. First, three variables indicate teachers’ attitudes as reported by the
school director and the school committee president: teachers’ cooperation with COGES, with each
other, and with the community - these variables are coded from 1 (not cooperative at all) to 4 (very
cooperative). Second, seven dummies indicate whether the school committee president reports
good support from the community, local authorities, the school administration, teachers, parent
committee, and two different levels of the Ministry of Education hierarchy, the conseil pedagogique
(education advisors) and inspectors. Finally, we also use a dummy for whether the school committee
president reports that disagreements among school committee members are rare or inexistent (as
opposed to occasional or frequent disagreements).
Expenses and Investments The April/May 2008 questionnaire asked the COGES to list projects
included on the school action plan, as well as the amount budgeted for them. These data are ana-
lyzed as total amount spent rather than indices. We coded these items into eight categories:
• Infrastructure includes expenses related to classrooms, desks, chairs, blackboards, school en-
closure and security, and cleaning.
• Supplies and Textbooks includes expenses for notebooks, pens, and textbooks.
• Pupil Educational Support includes expenses like remedial courses, awareness campaigns to
increase enrollment, and academic rewards.
• Pupil Health includes expenses related to nutrition and health like drinkable water, meals,
latrines and drugs.
• Teacher Support includes expenses benefitting teachers such as teacher housing, furniture,
supplies, guide books, and salary.
• COGES Expenses includes expenses related to COGES meetings, contributions to and travel
13
expenses for the ”COGES communal” (a regional grouping of the COGES) and inspector
visits.
• Schools Festivals and Playground includes expenses such as graduation ceremonies, parties,
and soccer balls.
• Investments in Agriculture includes seeds, fields, crops and livestock, unrelated to education
activities. For example, some schools reported the purchase of a field of peanut plants, others
of a herd of goats, etc.
School Quality
Finally, we construct four indices to describe the effect of the grant on school quality: infrastructure,
materials, health resources, and teacher effort. We also use data on dropouts, enrollment and test
scores in order to examine the ultimate objective of increasing pupil participation and learning. Data
for infrastructure, materials and health resources come from the 2008/2009 annual administrative
database and so reflect changes between 8 and 10 months after receipt of the grants.
Infrastructure We create an index of infrastructure quality using data on the number of buildings
and their condition, the number of blackboards, the number of desks for children, the number of
teacher’s desks, the number of teacher’s chairs, the number of shelves, and whether or not the
school has an enclosure (this is a fence or wall around the school grounds that separates the school
from other public space). For the infrastructure index, the classroom, desks, blackboard and books
figures are changes from year to year.
Materials Materials include textbooks, dictionaries, geography materials (such as maps and at-
lases) and math materials (such as rulers, protractors, and compasses). Since there is only one
variable for textbooks but multiple variables for geography and math materials, if all variables are
included in the index in the same way, we would weight the importance of each type of math mate-
rial the same as the importance of textbooks, which seems to give too much weight to each kind of
math or geography material. To avoid this, we first construct an index of math materials and then
of geography materials and include those indices with the same weight as textbooks to construct
the overall material index. We use the change in the amount of material between 2007/2008 and
14

2008/2009.
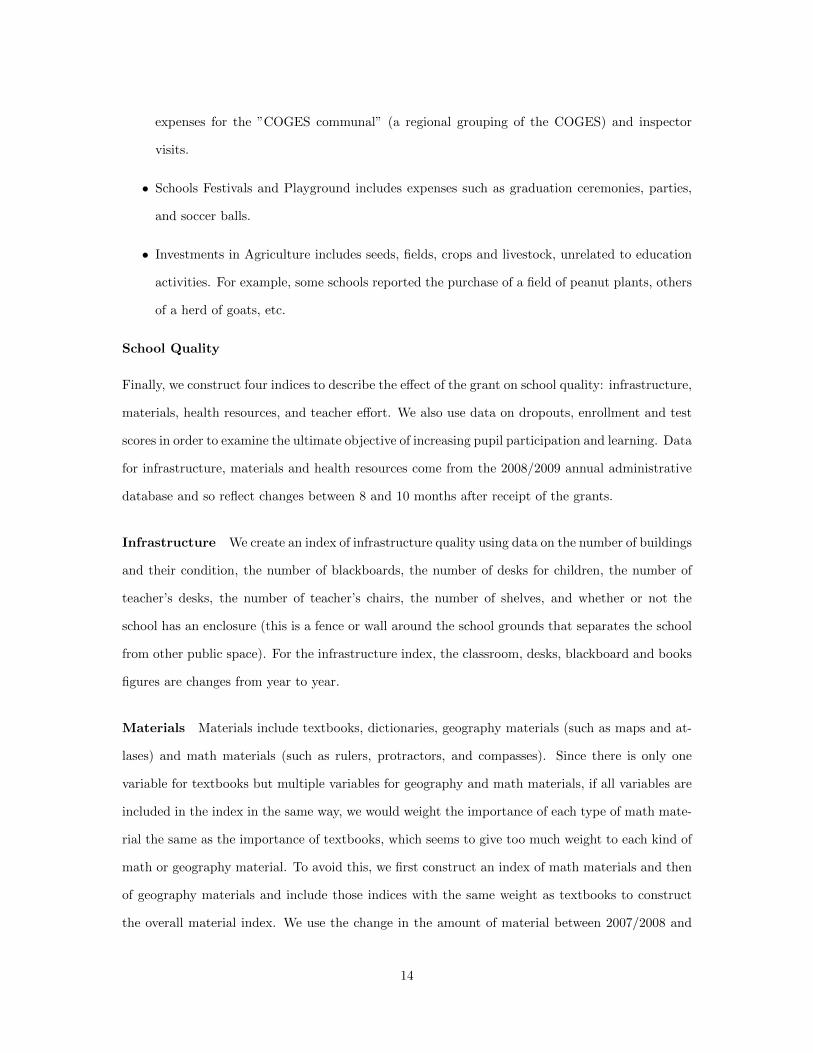
Health Health resources include vitamin or micronutrient supplementation, school deworming,
health information sessions (for example, on preventing malaria), availability of a first aid kit, trash
disposal, number of latrines and access to water.
Teacher Effort We use three variables to assess teacher effort. First, the unannounced school
visit in 2008 recorded how many teachers were present on the day of the visit, and the number
of teachers are employed at the school. We use a simple percentage of the number of teachers
who were physically present at the school. To accurately represent the loss of classroom time and
avoid reporting inconsistencies, this figure includes both excused and unexcused absences. If the
school was closed at the unannounced visit (which was on a day the schools were supposed to be
open) all teachers were counted as absent. Second, we use the number of days when class was
cancelled because teachers were on strike (this information was provided by the school director).
Finally, we use a variable reflecting the opinion of the school committee on teacher assiduousness
and punctuality, coded from 1 (not satisfactory at all) to 4 (very satisfactory).
Pupil Participation in Education We have two data points for participation in education.
We use the number of dropouts reported by the school to our surveyors at the April/May 2008
questionnaire, and the change in enrollment from fall 2007 to fall 2008 reported to the Ministry of
Education in the annual administrative censuses.
Test Scores We have two limited measures of actual learning. First, we use test scores from a
test administered to pupils during the April/May 2008 questionnaire. The test was administered
to three grades, 10 pupils per grade. The pupils were supposed to be sampled from those who
were enrolled at the beginning of the year, but in practice this does not seem to have happened,
and the 10 pupils appear to have been selected from the pupils present on that day. As discussed
below, this leads to concerns of attrition bias in the test scores since there is reduced dropout in
the treatment group. There are further quality problems with the test scores - including identical
copies submitted by some grades in some schools - that raise concerns about whether the scores
can be relied upon. However, there is no evidence that the problems are correlated with treatment,
15

and appear instead to be related to insufficient oversight of the examiners, so it is possible that the
quality problems only add noise rather than biasing the results. We therefore present the results
as second-order evidence.
The overall results are nonetheless informative about the general level of education in rural
Niger, and we present some examples here to help give the reader of the context. In general, pupils
got about 1/3 of questions correct. For example, the following questions were asked:
• Grade 1: The interviewer asked the pupils to pick up a red crayon and a blue crayon out of a
pile containing pieces of chalk of different colors: three white, one red, one blue, one yellow,
and one green. 45% of pupils were able to do this.
• Grade 4: Pupils were asked to place the following numbers in order, from smallest to largest:
807 ; 708 ; 788 ; 800. 24% of pupils were able to do this.
• Grade 6: Pupils were asked to change an adjective from the masculine to the feminine form
(Un nouveau maitre ==> Une maitresse). 29% of pupils were able to do this.
Second, annual administrative censuses report the number of candidates for the national end-of-
primary school exam and the number who passed. We use results reported on the 2008/09 census,
which were for the end of the 2007/08 school year. Note that the schools did not generally present
all of their 6th grade students to take this exam, but could chose who to present. There is no
evidence that schools were punished in any way for a low pass rate, however. On average, slightly
over half of the schools presented students for the end of 6th grade test (recall that most schools do
not have all grades). The average number of candidates presented was 27 12, and 61%, on average,
passed the exam.
3.1.3 Interaction Variables
The sample size was chosen to be large enough to allow for testing for heterogeneous treatment ef-
fects along community characteristics, one of the initial objectives with this the study13. Descriptive
statistics and balance information for the interaction variables is given in Table 2.
12The number of pupils present for the exam is larger than the average size of the grade 6 class in the previousyear. This is due to missing data for most of the small schools in the School Survey dataset. Most of the missingdata is likely to be zeros, but we do not replace missing values with zeros. Replacing missing values with zeros doesnot change the results, but reduces the average number presented to 15.
13Unfortunately, we did not register our analysis plan in a secure independent register in 2007 when the experimentwas designed, as is best practice today.
16

Education We define a community as “educated” if one or both of the two interviewed members
of the school committee completed primary school (excluding the director)14. Only 31% of school
committees from control schools contain at least one member who completed primary school, which
indicates an important heterogeneity across communities. These data come from the Spring 2008
Questionnaire. 15
Experience in other organizations Parents who have experience in other organizations may
be better able to engage in management of the school because they might have more experience
doing so. We use data from the April/May 2008 Questionnaire to construct a variable equal to 1 if
either of the COGES members interviewed belonged to another community organization that was
not engaged in the school (for example, religious communities, cooperatives, savings groups, and
so on). About one-fifth (21%) of the control school COGES fall into this category. The correlation
between education and experience is 0.15.
Wealth We assume that the wealthier a community is, the more real authority parents will
have because they will have a higher social status relative to the teachers (note that teachers are
relatively homogenous in terms of wealth). These data come from the Spring 2008 Questionnaire.
The wealth of school committee members is the first component of a principal component analysis of
durable goods possessed by the two interviewed school committee members and the school director.
Durable goods include means of transportation, animals and housing equipment. The wealth of
school committee is then the average of this wealth index for the two interviewed school committee
members. Note that the average wealth index does not have any material meaning in itself since the
scale is one that measures individual’s wealth relative to one another. The average wealth index is
negative since the two school committee members are poorer, on average, than the school directors,
14When information for one of the two interviewed members is missing, we impute the value of the member forwhom information is available, in order to avoid dropping observations. We thus assume that the observed memberis representative of the two sampled members. Results do not vary substantially when these schools are excludedbut the sample size is reduced.
15Wealth and education are measured in the April/May 2008 questionnaire, after the treatment was implemented.We note that it would have been better to measure these characteristics before the treatment was implemented,though this was not possible in the context of program implementation. However, these characteristics would bechanged by the treatment only if the grant induced a change in the composition of the school committee, with formermembers replaced by new ones with different characteristics. In the data, we observe a proportion of 20% of schoolcommittee members who took their position in 2008 both in the intervention and in the control group (so no morerenewal due to the grant - result not shown), and school committee members exhibit the same characteristics in bothgroups (Table 2). We are thus confident that the grant did not affect the composition of the school committee andthat observed community characteristics are not endogenous to the grant.
17

whose data was included in the construction of the wealth index. The standard deviation of this
wealth indicator is large (1.46), indicating an important heterogeneity of wealth across communities.
Urban or Rural Urban schools are more connected to the central government, and the students
are likely to live somewhat closer to the school. Rural schools are schools where there is no village
or settlement around. Urban schools are a marked minority: just over 10% of schools are located in
urban areas. We do not hypothesize about the relationship of authority to urban or rural location,
but we maintain this variable as an interaction term to help understand spending patterns and
because we believe it is of more general interest to policymakers and planners.
One-Teacher Schools Schools with only one teacher present a unique situation. One way that
teachers have power in negotiations with communities is that they can leave if they are unhappy
with conditions. When there is only one teacher, this threat may be even stronger (because there
is no possibility of absorbing his or her students into another class). Seen from a different point
of view, it may be easier for the parents to negotiate and work with a single teacher rather than a
group of teachers, especially because if there is only one teacher that teacher is de facto a member
of the COGES. In the fall of 2007, prior to the arrival of the grant, 12% of schools were one-teacher
schools.
3.1.4 Internal Validity of the Experiment
Compliance Two representatives from the COGES signed a document confirming effective re-
ceipt of the grant in the intended amount. These receipts were first collected at the regional level
and the information was then entered into a database at the Ministry of Education as a way to
verify the actual receipt of the grants at the school level. An additional survey was conducted in 85
randomly selected schools asking detailed questions about the receipt and spending of the grants,
and financial management. This questionnaire also included information about any problems with
the administration of the grant and qualitative feedback and suggestions from the COGES. The
use of the grants was recorded in detail, including the existence of a receipt for each expenditure.
Grants were distributed as follows: the Ministry of Education issued an order to the District
level, which allowed the district to withdraw cash from the Treasury to distribute to the schools.
The grants were distributed first to the inspectors, and then either directly to the COGES or to
18

other officials who brought the grants to the schools. The vast majority of schools do not have bank
accounts, and other mechanisms of distribution were infeasible.
The collection of grant receipts, financial questionnaires, and information from the Ministry
indicated that of the 498 of the 500 treatment schools received the grant. Of the two that did not
receive their grant, one school had closed, and so their grant was allocated to a school outside of the
1,000 school sample, and the other’s grant was mistakenly given to a control school. Of the schools
receiving the grant, our information indicates that four schools received less money than had been
allocated to them (in 3 cases the schools received 500 FCFA (1 USD) less than the assigned grant
amount of 73,500 FCFA (147 USD), and in one case 10,500 FCFA (21 USD) less than the assigned
grant amount of 120,500 FCFA (241 USD)), while two schools reported receiving more than had
been allocated (one school received 2,000 FCFA (4 USD) more than the assigned amount of 122,500
FCFA (245 USD), and the other received 27,000 FCFA (54 USD) more than the assigned amount
of 167,500 FCFA (335 USD)). All in all, the data indicate that 492 out of 500 schools received the
exact amount allocated to them, and six others received the grant but not in the correct amount.
This is a reasonably high compliance rate16.
Data from the qualitative questionnaire administered to the 85 randomly selected schools indi-
cate that the majority of those schools received the intended grant amount. Among the 85 schools,
one school that had been selected for the grant had been closed at the time that the grant arrived.
In another case, the grant was accidentally given to another school. In a third case, a school re-
ported receiving 500 FCFA (1 USD) less than the intended amount. Two schools reported paying
some money to cover transport costs to the person who delivered the grant.
Attrition There is some attrition in the datasets. Each year, a handful of schools do not return
the administrative data questionnaire or the questionnaires are improperly filled out, leading to
missing data for 3% of the schools for the infrastructure index and 1.4% of the schools for 2008/09
enrollment. The April/May 2008 survey was conducted on the basis of unannounced visits, which
meant that many schools were closed. In addition, some schools were not visited due to security
concerns, and still others closed early that year because the summer rainy season began early and so
16Note that this program was publicized within the administration and careful records were required at each stepof transfer of the money. In addition, the government of Niger had recently engaged in intensive public prosecutionof corrupt officials. This suggests that applications of this transfer mechanisms to other contexts might not be soeffective.
19

many children went to the fields with their parents to plant. As a result, data from the evaluation
questionnaire is available for only 814 schools (81.4%).
We test for differences by treatment group in the proportion of schools with missing outcome
variables as a whole and sub-divided by district, urban and rural, and whether the school had
external support (for example, NGO sponsorship) prior to the project. Results are reported in
Table 3. Eighty-four tests on treatment and interaction between treatment and sub-groups yield
one statistically significant differences (at the 10% level or higher), which is well within the amount
that would be expected with random attrition. The comparability between treatment and control
groups is thus intact. As to external validity, there are more schools missing in the region where
security was a concern (Tahoua, in the north).
3.2 Empirical Strategy
Average Treatment Effect We estimate intent-to-treat effects as measured by the differences in
the means of school outcomes between schools initially assigned to the treatment group and schools
initially assigned to the control group. Let T be an indicator for treatment group assignment and
let X be a matrix of stratification variables. Estimation of the intent-to-treat effect β is from the
following equation:
Yj = βTj +Xjγ + εj (1)
where Yj is the outcome of school j. The covariates (X) are included to improve estimation precision
and include whether the school is urban, the total proportion of girls in 2007/08, the total enrollment
in 2007/08, whether the school was supported by an outside NGO in 2006/07, and the inspection
(a geographic/administrative unit). All regressions use robust standard errors.17 The absolute
magnitudes of the outcomes are in units of outcome’s standard deviation, so the estimate shows
the treatment effect in terms of standard deviation units over the control group.
Heterogeneous Treatment Effects Along Community Characteristics In the second step,
we estimate intent-to-treat effects with an interaction term to determine whether the average treat-
17An alternative specification uses dummies for the strats used in random selection, which were defined using adummy for urban, the total enrollment in 2005/06, and support by an outside NGO in 2005/06. This specificationdoes not substantially change the results, but increases precision of some coefficient estimates and decreases precisionof others.
20

ment effect on parent and teacher behavior varies with real authority. We run regressions of the
form:
Yj = βTj + θ(CjTj) + σCj +Xjγ + εj (2)
where Cj denotes a proxy of parents’ real authority. In this case θ is the additional (or reduction
of) impact for schools with characteristic Cj . We include an indicator for urban schools and the
interaction of this indicator with the treatment assignment for each characteristic whose correlation
with being located in an urban area is above 0.1, to disentangle the effect of this characteristic from
the effect of being located in an urban area.
4 Results
4.1 Average treatment effects
On average, we observe that in response to the grant, parents did not reduce their own contributions
and increased their involvement in and responsibility over school management, although they could
not go so far as to enforce rules on teacher attendance. At the same time, school committees
increased investment in infrastructure (buildings and the school enclosure) and school festivals, and
invested in agricultural projects. Accountability was not changed, but cooperation with school
stakeholders improved. All these effects did not create a path to school quality improvement.
While infrastructure and health resources improved and pupil participation increased a bit among
the youngest, teacher attendance declined on average, perhaps because of resentment over parent
empowerment, and we find no impact on test scores.
4.1.1 Parent Participation
We find evidence that, overall, school committee grants can increase some types of parent partici-
pation in schools, but does not increase teacher oversight.
Parent Contributions Table 4 shows the impact of grants on parent contributions. The overall
effect of grants is that parents do not change their contributions to schools. The contribution index
mean of the treatment group is statistically and economically similar to the mean of the control
group. The analysis of the component variables (funds collected per pupil, in kind donations,
21

and official fees charged) shows that neither financial nor in-kind contributions were affected by the
grant. This result contrasts with previous studies showing that parents decreased their contributions
in response to an increase in school resources (Das et al., 2013; Pop-Eleches and Urquiola, 2013)18.
Note that in general the amount of cash income available to schools is obtained through parental
contributions. An important consequence of this is that, due to the increase in cash from the grant,
cash on hand for schools increased and thus so did the possibility for investment.
Parent Involvement Table 5 shows the impact of grants on the volume of parent involvement
in school management. We see that all indicators of parent involvement increased, although no
change in any individual component is significant: the number of meetings was higher, time elapsed
since the last meeting was smaller, the number of topics addressed in the meetings is larger, and
the presence at the last meeting is larger. Overall, the mean of the parent involvement index in the
treatment group is 0.06 standard deviations larger than the mean of the control group, and this
effect is significant at the 10% level.
Parent Responsibility The impact of grants on parent responsibility in school management is
reported in Table 6. The overall effect of the grants is positive: the mean of the index of the
treatment group is almost 0.06 standard deviations above the mean of the control group. The
analysis of detailed variables composing the index shows some small increases in the proportion
of school committees in charge of infrastructure, collecting financial contribution and spending
financial contributions, although none of these increases are statistically significant (although some
of p-values are close to conventional significance), while the effect on the index itself is significant
at the 10% level.
Teacher Oversight There is no overall impact on parent supervision of teachers (Table 7). We
see small and insignificant changes in the proportion of school committees which discuss teacher
behavior in school committee meetings, declare that they are active in increasing teacher attendance
and improving education quality, declare that they monitor teacher attendance, and take remedial
18An alternative interpretation would be that this result derives from the fact that we measure only the first yearof the grant, and so parents did not have time to change their own contribution of inputs (see Das et al, 2013, wherecrowding out was greater when a school grant was anticipated than when it was unanticipated). We think this isunlikely since the parents were notified in advance of the grants arrival.
22

actions against teachers. No trend emerges from these variables, and so there is no change in the
teacher oversight index.
4.1.2 School Management
Accountability There is no impact of the grant on school accountability (Table 8). The analysis
of the detailed components shows a 13% increase in the proportion of schools which could present
a register for fund collection for examination, and a 21% increase in the proportion of schools
which could present a register for fund expenses for examination, which might be simply the direct
consequence of the fact that schools in the treatment group received money from the government and
had something to record, rather than an overall change in accountability. However, the grant did
not change the use of other registers nor the frequency of minutes, which suggests that the increased
involvement and responsibility of parents did not lead to a higher demand for transparency and
record keeping.
Cooperation The impact of grants on cooperation between school stakeholders is reported in
Table 9. Overall, we see an improvement in the cooperation between the school committee and dif-
ferent actors: school committees are significantly more likely to report support from the community
(+5 percentage points), from the teachers (+3 percentage points), from the parent committee (+5
percentage points). The proportions of school committees reporting support from local authorities,
school administration, educational advisors and inspection are also consistently larger, although
these differences are not significant. As a result, mean of the the cooperation index for the treat-
ment group is almost 0.07 standard deviations above the mean of the control group, significant
at the 5% level. One explanation for the positive effect of grants on cooperation between school
stakeholders and school committees is that that giving resources under the control of the school
committee enhanced the sense of respect for its activities.
Expenses and Investments Figure 2 presents the absolute and percent differences in amounts
budgeted for a given type of project in treatment schools compared to comparison schools (signifi-
cant differences in dark grey, non-significant in light grey). The amount budgeted for a given type
of project was significantly larger for infrastructure, festivals and playground, as well as investments
in agriculture (Table 10): the amount budgeted for infrastructure was larger in the treatment group
23

(107,705 FCFA (215 USD) vs. 86,119 (172 USD), a difference of 20%, significant at the 5% level),
the amount budgeted for festivals and playground was sixfold greater than in the control group
(1031 FCFA (about 2 USD) vs. 166 FCFA (0.33 USD), significant at the 1% level), and the amount
budgeted for investments in agriculture was fourfold greater (2,416 FCFA (5 USD) vs. 583 FCFA
(about 1 USD), significant at the 1% level). Note that the difference, while large relative to the
amount spent in control schools on these activities, is small compared to the entire amount of
the grant, so the bulk of the grant was not used on school festivals, playground and agricultural
investments. The size of the increase in infrastructure spending in absolute terms (19,659 FCFA,
or 40 USD)) is much larger than the increases in agriculture and festivals and playground expenses
(1,833 FCFA (a bit less than 4 USD) and 865 FCFA (almost 2 USD), respectively).
The investments in agriculture do not seem to have been done in the interest of one person,
which might be considered a theft of resources, but rather as an investment on the part of the
school (since they were recorded in the school ledger). One interpretation of the investment in
agricultural projects is that credit in many areas of Niger is severely constrained. There may be
profit opportunities from investment in agriculture (either in terms of raising crops or arbitraging
prices for inputs or food products), but since isolated areas suffer from low levels of credit, these
profitable opportunities are unexploited. If the COGES is aware of these opportunities, and they
are patient, it may be most optimal for the long-term interest of the school to invest the windfall
cash grant rather than spend it on educational inputs immediately. However, we cannot be sure
that these investments were made for the profit of the school and have to consider the possibility
that it did not benefit to the pupils in any way19.
Finally, we see that school committees had spent just above a quarter of the grant at the time
of the April/May 2008 questionnaire: the average increase in the total spending amount is 28,512
FCFA (57 USD), while the average grant is 104,500 FCFA (209 USD). This finding indicates that
about 5 months after the grants arrived in treatment schools, the school committees have not yet
budgeted any use of the remaining three-quarter grant. Together with the types of spending induced
by the grant, our results suggest that the school budget constraint is not binding: a large part of
19We would urge that future researchers examining local school management and activities collect data on schoolfestivals, as well as school business investments, as potential targets of school spending. These expenditures werenot foreseen and so detailed questions on these expenditures (for example, the number and type of school festivals,or the anticipated return of investment projects) were not included in the questionnaire, nor were questions aboutthe local credit market.
24

the grant is still unemployed, and some money is spent on leisure and agricultural spendings which
seem non-essential for pure educational purposes. Also, the amount budget for teacher support is
unchanged (the average amount in the treatment schools is even lower than in the control schools,
although the difference is not significant), which is striking in a context where teachers suffer
from long delays in the payment of their salary. Similarly, it seems surprising that the grant did
not change the amount of money spent on supplies and textbooks, pupil educational support like
remedial courses, or pupil health expenses, in a context where school equipment is very poor and
pupils do not perform well at the primary school final exam. Overall, the impact of the grant on
school expenses suggest that in the context of Niger, parents might not have sufficient information
to make investments that are likely to improve school quality.
Another explanation, which may be simultaneously be true, is that parents were saving the
grant in the face of uncertain future cash flows (see Sabarwal, et al, 2014).
4.1.3 School Quality
Infrastructure In the slightly longer term (one year after the treatment) there is a small im-
provement in the infrastructure index of schools: a 0.04 standard deviation increase in the index for
infrastructure quality (Table 11), significant at the 10% level. This is largely driven by increases in
the number of classrooms and the construction of walls around the compound (columns 2 and 5 of
Table 11)20. The increase in the number of new classrooms amounts to 0.12 of a standard deviation,
representing an additional 0.08 new classrooms per school in the treatment group compared to 0.28
new classrooms per school in the control group (a 29% increase). The increase in the proportion of
schools with walls around the compound (enclosure) amounts to 0.18 of a standard deviation, with
9 percentage points more in the treatment group over 34% in the control group (a 26% increase).
Materials We find no overall impact on the materials available at the schools (books and class-
room materials such as rulers, protractors and maps) (Table 12).
Health Resources There is a small (0.05 standard deviations) increase in the index of health
resources (Table 13), significant at the 10% level. This increase is driven by increases in health
information sessions (34% vs. 30% of schools), first aid kits (12% vs. 9% of schools), micronutrient
20These items were also projects that were frequently reported by the schools as projects undertaken using thegrant money.
25

supplementation (25% vs. 22% of schools), and deworming (64% vs. 62% of schools), though none
of the individual components of the health index are significant alone.
Teacher Effort We find no effect of the grant of the number of days when class was cancelled
because teachers were on strike, nor the opinion of the school committee on teacher assiduousness
and punctuality, but we observe a decrease in teacher presence in the treatment group: around 4
percentage points less than the average of 76% presence in the control group, significant at the 10%
level (Table 14). Teachers thus responded to increased resources under the control of parents with
a reduction in their own inputs. Informal feedback from the field suggested that those teachers who
felt the central government should make education decisions disliked that the communities were in
charge of the grant, and they may have felt resentful that the grants undermined their authority
(as representatives of the central government). In addition, the decreased teacher presence might
also be related to the fact that the average school committee did not spend the grant on expenses
supporting the teachers (teacher housing, furniture, supplies, guide books, and salary), even though
school committees had not spent all of the grant at the time of the survey. As a consequence, teachers
might have had the impression that parents were not capable of wisely investing the money allocated
to them, and might have been resentful. Any such resentfulness might have been exacerbated by
the ongoing pay disputes between the teachers and the government at that time (in many cases,
teachers salaries had been substantially delayed or teachers had not been paid).
Dropout and Enrollment There is no change in enrollment or dropout overall (Table 15), but
there is a positive impact at the lowest grade levels. The grant program reduced dropouts from
grade 1 at the end of the 2007/2008 school year (2% vs. 3% in the control schools) (column 4 of
Table 15A), a finding which is matched by an increase in enrollment in grade 2 at the beginning of
the 2008/2009 school year (33 vs. 30 pupils in the controls schools) (column 5 of Table 15B).
The fact that participation increases for youngest pupils suggests that participation is more
elastic when the child is young, which might reflect the fact that the cost of education increases
when the child gets older, especially because of opportunity cost of time of elder children.21
21We also take the fact that only younger grades were impacted as evidence that the change in enrollment is notdue to intentional misreporting by grant schools. In addition, the finding is replicated across two different types ofdata collections and at two different periods.
26

Test Scores We find no impact on the number of candidates presented for the end of primary
school exam at the end of the 2007/2008 school year, the pass rate for the end of primary school
exam, or any of the math, french or oral tests administered during the April/May 2008 questionnaire
visit (Table 16).
4.2 Heterogeneous Treatment Effects
We now examine the different dimensions identified above to identify heterogeneous effects. Due
to space limitations, we do not present the detailed regression tables in the paper, but they are
available from the authors upon request.
Education of the COGES
Some measures of parent participation are higher in COGES with an educated member, though the
indices themselves are not significantly higher. Educated COGES increased in kind contributions
in response to the grant by 13% (significant at the 5% level) and did not reduce cash contributions
(and there is no change in in kind contributions for non-educated COGES).
Most importantly, communities where the school committees were educated increased their
supervision of teacher attendance. Educated school committees are 9 percentage points more likely
to supervise teacher presence if the school was treated, significant at the 10% level. However, the
increased monitoring did not attenuate the decrease in teacher attendance, suggesting that parents
were not able to put pressure on teachers.
We find that there is reduced accountability due to the grant in schools with educated COGES
on two of the component measures, but not on the overall accountability index. Following receipt
of the grant, COGES schools are 12% less likely to have a register for weekly activities, and 8% less
likely to have a register to monitor pupil attendance (both significant at the 10% level). Note that
the treatment coefficient in the interaction specification for the accountability measures is near zero
(e.g., for non-educated). This is a puzzling result which we cannot explain.
Educated COGES who got the grants focused their investments on infrastructure, perhaps to
the detriment of other types of spending. They budgeted more money for infrastructure (58,755
FCFA (117 USD), significant at the 5% level), but not uneducated COGES. However, the increases
in infrastructure in the following year were felt primarily in schools with non-educated COGES: the
27

coefficient on the interaction term of treatment and education is negative (-0.08 SD) and significant
at the 5% level. One possible reason, if the data on spending is accurate, is that the projects
undertaken by educated COGES in response to the grant might have been larger and taken more
time, so that they were not yet completed at the time that data on infrastructure was collected.
COGES without educated members, on the other hand, increased spending on Health Resources
and Pupil Educational Support. For Health Resources, the treatment coefficient for the non-
educated COGES is 0.06 SD, significant at the 10% level, while the coefficient for the interaction
term is -0.12, significant at the 10% level, suggesting zero or negative impact of the grants on health
resources in the educated COGES. For Pupil Educational Support, schools with non-educated
COGES increased spending (3,639 FCFA (7 USD), significant at the 5% level), but no impact (or
a possibly negative impact) for schools with educated COGES (the coefficient on the interaction
term is -8,215 FCFA (16 USD), significant at the 5% level). The negative impact of the grant on
money for Pupil Educational Support and the health resources index might reflect that educated
COGES increased expenses in infrastructure, which are generally lumpy investments, and might
have required the school to spend less on other items.
There is also a negative impact of the grant on math and french test scores in schools with
educated COGES (about one-third of a standard deviation, significant at the 5% level for math
and 10% level for french). This negative impact of the grant on learning in schools with educated
COGES, who focused spending on infrastructure, echoes the findings in the literature that pro-
viding more-of-the-same educational inputs typically has no impact on learning, whereas remedial
education and rewards are more effective at increasing learning (Kremer et al, 2013). Educated CO-
GES may not have made the optimal choice, because they decreased spending on pupil educational
support, perhaps to finance the lumpy infrastructure investments.
Wealth of the COGES
We find no differences for wealthy communities in terms most forms parent participation, school re-
sources and activities, or teacher and pupil outcomes. However, we do find that parent responsibility
increased more in wealthy communities (each standard deviation increase in wealth is associated
with an additional 0.05 standard deviation increase in the parent responsibility index in response
to the grant, significant at the 5% level).
28

We highlight this and note that the results for wealth are different from the results for educated
and experienced COGES, suggesting that the effects we find by education and experience are not
proxies for wealth.
One-Teacher Schools
One-teacher schools seem to have made a different choice than larger schools: they budgeted more
money for expenses related to Teacher Support (the coefficient on the interaction term is 8,985
FCFA (18 USD), significant at the 5% level). This may be because there was more threat from the
teachers: one teacher schools in the treatment group lost 1.3 days more to teacher strikes than one
teacher schools in the control schools (significant at the 10% level).
Perhaps as a result, even though these are small absolute amounts, one-teacher schools are the
only schools to not suffer from the negative impact of the grants on teacher attendance on the day of
the visit (the coefficient on the interaction term is 0.17, significant at the 5% level, and the coefficient
on the treatment term is -0.06, significant at the 5% level). In fact, the size of the coefficient on the
interaction term suggests that teacher attendance actually increased in one-teacher schools. This
suggests that by transferring some of the grant to teachers - or at least to investments that benefit
teachers - the one teacher schools limited the reduced teacher attendance associated with the grant
in other schools.
At the same time, infrastructure in one-teacher schools did not improve, in contrast to other
schools (and may have even degraded - the coefficient on the interaction term is -0.17, significant
at the 1% level, while coefficient on the treatment variable is 0.06, significant at the 5% level). 22
Urban vs Rural Schools
Increases in in kind contributions came from parents in urban schools, which were 17% more
likely to have made in kind contributions, significant at the 10% level. The increase in the parent
responsibility index is also driven by increases in urban rather than rural schools - the coefficient
on the interaction term is almost 0.3 standard deviations, significant at the 1% level, whereas the
coefficient on treatment alone in the interaction specification is near zero.
22Note that since the grant was based on the size of the school, one-teacher schools received smaller grants. Theymay then have been pushed away from investment in infrastructure since the lump sum was not enough to start aproject.
29

Only schools located in rural areas increased their spending on agricultural investments (2,046
FCFA (4 USD), significant at the 1% level). Urban schools did not increase spending on agricultural
investments (the coefficient on the interaction term is -1,755 FCFA (3.5 USD), significant at the
5% level). We speculate that this is because credit constraints may be less severe in urban areas,
but we have no data to confirm this.
Experienced COGES
Schools where the COGES has at least one member who is also a member in another community
organization increased monitoring of teacher attendance in response to the grant (the interaction
term is 0.11, significant at the 5% level). These schools are also those that enjoyed the increases in
the cooperation index: 0.07 standard deviations, significant at the 10% level, whereas schools with
no member that is also a member of another community organization had no increases.
5 The Model
Our results demonstrate, first, that complete crowding out is not inevitable: parents responded
to grants to the COGES by increasing participation did not immediately change their financial
contribution (with some evidence that some schools increased in kind contributions). This contrasts
with the results in Das et al. (2013) and Pop-Eleches and Urquiola (2013) where additional resources
to the school (not under parent control) decreased parental effort. We also find that only schools
where parents are educated or are members in other community organizations respond to the grant
by increasing teacher monitoring - the type of parent participation that is arguably the most difficult
to do. Note, however, that there was no positive impact on teacher presence due to this increased
monitoring. Pupil participation, at the lowest grades, increased. However, the ultimate impact
on education quality, at least in the short run, is unclear: teachers were absent more frequently
(which echoes the result in Duflo, Dupas and Kremer (2012) in Kenya where giving parents the
responsibility over an extra-teacher led to a reduction in effort from civil-service teachers), except in
the smaller schools where the grant was at least partly spent in a way that benefited them directly.
Taking into account that Niger is, in general, an environment where parents have little authority,
our results contribute to the literature from many other countries, and supplement the existing
results with new data. There are several experiments showing that the effectiveness of participatory
30

programs to improve school quality is related to the level of authority or empowerment of the
parents: as King and Ozler (2004) demonstrate, policies of de jure autonomy do not always lead to
de facto autonomy, and so participation may not be meaningful if communities have no actual power.
Empowerment might be through education (Blimpo and Evans, 2011), ties with local government
(Pradhan et al, 2014), training (Duflo, Dupas and Kremer, 2012), human capital (Gunnarsson et al,
2009), school-community relations and community organizational capacity (Gershberg and Shatkin,
2007), and pre-existing levels of poverty (Galiani et al, 2008).
In this section, we consider a model that formalizes the behavioral responses of parents and
teachers to a change in school resources and the resulting effect on school quality. The motivation
for this model is two-fold. First, the model helps to clarify how the grant program studied in this
paper can affect parent participation, teacher effort and school quality. Second, we want to show
that reasonable assumptions on school dynamics are able to produce predictions consistent with
the evidence found in the literature.
Albornoz et al (2011) model the interaction between student, parent and teacher investments and
school resources, to explain the ambiguous effect of resources on parent involvement at home. This
model suggests that under some circumstances, an increase in school resources generate a decline
in parent investment in education at home. Das and al (2013) also provide a model to explain the
decrease in parental effort at home in response to an increase in school resources. But none of these
theoretical frameworks take into account parental participation in school. The model proposed in
this paper enriches our understanding of school dynamics by taking into account parents’ effort
both at home and at school, and the difference between giving more resources to school staff versus
parents. It enlarges the set of interventions of interest and adds to our understanding of the effects
of educational policies. It is an ex post exercise designed to make sense of existing evidence with
the hope it can be tested in subsequent analyses.
5.1 Set-Up
The model involves three participants: parents, teachers and the government. Teachers decide
how much time they put in teaching tt. Parents decide how much time they invest for education
at home th, as well as how much time they participate in school management tp. Finally, the
government chooses the level of governmental resources for the school, which decompose in two
31

parts, Gt + Gp, where Gt is resources in the hands of school staff (principals and teachers), while
Gp is governmental resources for the school under the control of parents (typically, resources handled
by the school committee).
Here, “participation” in school management refers to the many different kinds of participation
that policy makers envision, where beneficiaries might be organized into committees, undertake
projects themselves, such as construction or sanitation, raise funds, provide personal contributions,
supervise, hire, and even fire teachers, engage in awareness campaigns, provide advice to staff, and
so on. Participation is expressed in time units (financial participation is converted in time through
hourly wage).
Children’s Learning
Children’s learning E is the addition of learning produced at home and learning produced at school.
Learning produced at home Learning produced at home is assumed proportional to the num-
ber of hours parents devote to education at home, th (making sure kids get up on time and go
to school or investing in private lessons, for instance). How much each hour spent on education
translates into learning depends on parent’s productivity at producing learning, denoted e, reflect-
ing for instance parents’ level of education (more educated parents produce more learning for each
hour spent on helping with homework) or parents’ hourly wage (a higher wage can pay for a higher
amount of private lessons for each working hour invested in education). Learning produced at home
is thus eth.
Learning produced at school Learning produced at school is proportional to the time teachers
spend at school, tt. How much each hour spent at school translates into learning depends on teach-
ers’ productivity, which results from school resources. Indeed, school resources encompass salaries
(which should reflect both class size and teachers’ quality) and school materials (infrastructure,
textbooks, flip charts, blackboard, etc.) that allow teachers for producing more learning for the
same amount of time spent with the children. So we assume that the level of resources is a factor
of teachers’ productivity.
Furthermore, we assume that parents’ participation in school management interfere with school
resources in the determination of teachers’ productivity. Indeed, parents’ participation is additional
32

resources: parents raise funds from the community, and do administrative tasks that allow teachers
for focusing on teaching and producing more learning for the same amount of time spent at school.
Moreover, parents’ participation should increase the allocative efficiency of school resources by
preventing rent capture and making expenses closer to educational needs and common interest
(Barrera-Osorio et al, 2009). We thus assume that parents’ time spent on school management, ts,
is a factor that increase the effect of resources on teachers’ productivity23. This factor apply to
resources under parental control, Gp, but not on Gt in which parents do not have a say.
We thus assume that learning produced at school is given by (Gt + tpGp)tt and total learning
is given by E = eth + (Gt + tpGp)tt.
Parents’ Utility
Parents’ utility is the difference between the benefit they derive from children’ learning E, and the
opportunity cost of the time they spend on producing learning, th + tp. The benefit from children’
learning is assumed concave in E (for instance ln(1 + E)), so that learning produced at home and
learning produced at school are substitutes.24 The cost of time is assumed linear (for instance
th + tp), so parents’ utility is given by:
Up = ln(1 + eth + (Gt + tpGp)tt) − th − tp (3)
Teachers’ Utility
Similarly, teachers’ utility is the difference between the benefit they derive from children’ learning
and the opportunity cost of their time25. We assume that teachers’ benefit and cost take the
same form as parents’ ones, except that their welfare is also influenced by parents’ participation in
school management: teachers derive a benefit from parents’ satisfaction towards their production of
learning when parents can observe this production. This benefit takes the form of a social reward26
23A richer model could take into account the idea that parents’ participation might not translate into greaterteachers’ productivity because “pushy” parents might be disruptive to teachers. For the simplicity of the model, wemake the assumption that parents are not aware of this fact and would not participate if they would know that theirparticipation would decrease teachers’ productivity. This assumption is equivalent to the idea that parents do notget utility from participating per se (for example, due to reputation effect or some sort of hedonic payoff).
24To the extent that parent participation is a contribution to a public good, free-riding may be a problem. Forsimplicity we do not include this in the model, but a more complete model might address this issue.
25In this model, teachers are intrinsically motivated. A richer model could incorporate a broader view which wouldincorporate both intrinsic and extrinsic motives. We do not incorporate extrinsic motives here since it would notadd to the ability of the model to explain what we seek to explain.
26An equivalent way to put it is that teachers incur a social sanction from the community if they shirk and ifparents can observe it.
33

that is proportional to the time teachers devote to school, with a factor of parents’ participation:
the more parents participate, the more they observe and reward each unit of time teachers devote
to education.
However, teachers who have a preference for a centralized government might resent being mon-
itored by parents because of the resulting loss of autonomy and leadership in school decisions. In
this case, the effect of parents’ participation on teachers’ welfare can be negative, teachers’ loss
of welfare being also proportional to the time they devote to education, with a factor of parents’
participation (the more devoted they are and the more parents participate, the more teachers are
resentful). We denote δ teachers’ taste for community participation in school management. A
negative δ reflects a preference for a centralized government, whereas a positive δ reflects openness
to collaborate with parents (a δ close to zero would reflect teachers’ indifference).
As a result, teachers’ utility is given by:
Ut = ln(1 + eth + (Gt + tpGp)tt) − tt + δtptt (4)
5.2 Parents’ and Teachers’ Choices
The first-order condition for the teachers’ problem is sufficient (Ut is infinitively differentiable and
U ′′t (tt) < 0) and gives the optimal choice of teachers:
tt = max
{1
1 − δtp− eth + 1
Gt + tpGp, 0
}(5)
For the parents, the first-order conditions are also sufficient and give the optimal choices:
th = max
{1 − 1 + (Gt + tpGp)tt
e, 0
}(6)
tp = max
{1 − Gt
Gp− eth + 1
ttGp, 0
}(7)
From the expression of tp, we see that parents invest more time in school management when
resources under their control increase and when teachers make more effort. In contrast, parents
invest less time in school management when resources in the hands of teachers increase, when they
spend more time for education at home and when their efficiency with education at home increase.
34

Symmetrically, parents devote more effort for education at home when their efficiency at home
increases, whereas they reduce effort at home when school resources increase, or when teachers’ or
their own effort at school increase.
Finally, teachers increase time they spend at school when school resources increase, whereas they
reduce it when parents’ effort or efficiency at home increase. However, the response of teachers to an
increase in parents’ participation in school management is ambiguous: if δ is positive, the response
is clearly positive too: teachers spend more time at school. But in the region where δ is negative,
for large absolute value of δ, the response is negative, meaning that teachers who have a strong
preference for a centralized government reduce time at school when parents’ participation in school
management increases.
5.3 Heterogenous Best-Responses
For the best clarity and simplicity, the model above just includes the main dynamics in the school
system. In this paper, we also explore the possibility that power imbalances are likely to induce
different choices. This section explicit how parental real authority influences parents’ and teachers’
decision.
In our model, real authority of parents over the school would be captured by a parameter θ
multiplying parents’ time spent in school management: learning produced at school is given by
(Gt + θtpGp)tt, reflecting the fact that more powerful parents make better use of resources under
their control, therefore extracting more learning from teachers for each hour invested in school than
weak parents. Also, it should be noticed that real authority of parents θ is unlikely to be orthogonal
to teachers’ preference for a centralized government δ. On the one hand, teachers are more likely
to resent being monitored by parents when teachers enjoy a high social status relative to parents,
for instance when parents have a low if not no education, which is likely to coincide with parents’
lack of real authority. On the other hand, teachers’ preference for a centralized government largely
determines the extent to which parents entitled to participate in school (have formal authority) are
involved in decision making (have real authority). We thus posit that δ = δ(θ) with δ′ > 0. The
best-responses with a parameter θ reflecting real authority are: th = max{
1 − 1+(Gt+θtpGp)tte , 0
},
tp = max{
1 − Gt
θGp− eth+1
θttGp, 0}
and tt = max{
11−δ(θ)tp − eth+1
Gt+θtpGp, 0}
.
35

Effect of real authority on parents’ and teachers’ decisions Since their participation at
school is more productive, parents with higher θ invest more time in school management and less
time at home than parents with low θ. Teachers also invest more time at school because their
productivity is fostered by parents’ real authority. Moreover, the likelihood of δ being negative is
lower when parents’ real authority is larger, which adds to the general positive effect of parents’
real authority on teachers’ effort.
Effect of real authority on parents’ and teachers’ responses Parents’ response to an
increase in teachers’ effort or in resources under their control is amplified by real authority, just as
teachers’ response to an increase in resources under parental control. Moreover, teachers’ response
to an increase in parent’s participation in school management is reduced in the negative region and
amplified in the positive region by real authority. These predictions are consistent with the evidence
presented in section 4.1 that the benefits of community-based interventions are larger when parents
are more powerful.
5.4 The Effect of an Increase in School Resources
In the light of this model, what is the effect of an increase in governmental resources to schools? In
the short run, parents won’t take into account the fact that teachers will also react to the changing
conditions (and reciprocally). We thus consider that parents take the teachers’ actions as given
(fixed at their past value) and vice-versa, and we determine the comparative statics and discuss the
predicted behavioral trajectories. Our focus on short-term responses that do not take account of
others’ responses comes, first, because most empirical framework in the literature addresses such
responses, and, second, because real-life behavioral adjustments to others’ responses seem slow.
Pop-Eleches and Urquiola (2013) show that responses after one year are different from responses
in the longer run, reflecting the fact that it takes quite a long time for parents to adjust their
behavior to others’ responses. There are multiple reasons for slow adjustment to others’ response.
For instance, parents may not realize that teachers incur a loss of welfare from collaborating with
them (formally, they have a imperfect perception of teachers’ δ) because teachers do not disclose
their reluctance to collaborate with parents in front of them ( it would be rude). Even if teachers
do give signals that they do not want parents to participate, it is also possible that parents do not
36

take what they observe in the short run into account because they expect continuous collaboration
to make δ become positive in the future.
Effect in the absence of parents’ participation in school
In the short run, an increase in school resources increase teachers’ time at school and decrease
parents’ time for education at home. The fact that parents devote less time for education at home
tends to reinforce teachers’ response, which comfort parents with investing less time at home, etc.
The long-term effect of an increase in school resources is thus clear-cut: teachers respond positively
while parents respond negatively. The final impact on school quality is a mixed bag: the increase in
school resources and teachers’ response tend to improve education outcomes, while parents’ response
tend to reduce this effect. Pop-Eleches and Urquiola (2013) and Das et al. (2013) confirm that
an increase in school resources reduced parents’ effort (they do not observe teachers’ response). In
our framework, this policy is appropriate in contexts where (i) teachers actually use resources for
educational purpose, and (ii) the effect of additional resources on teachers’ productivity is large.
The conditions of success of this policy are thus a sound institutional environment preventing rent
capture and an initial level of school resources at which marginal gains of productivity are steep27.
Effect in contexts where parents participate in school
Teachers’ and parents’ responses to an increase in school resources are the same as above, but now
parents’ re-optimize their level of participation in school management too.
Increase in Gt If the additional resources fall in the hands of teachers, parents decrease their
participation at school. This in turn affects teachers’ effort in a way which depends on teachers’
preference for a centralized government: if teachers prefer a centralized government, the decrease in
parents’ participation in school management amplifies teachers’ positive response to the increase in
school resources, so teachers make unambiguously more effort. In contrast, if teachers are motivated
by the collaboration with parents, the decrease in parents’ participation reduces their incentive to
work hard and the policy brings a smaller benefit. The conditions of success of this policy are thus
27This analysis would benefit from evidence on the shape of teachers’ productivity as a function of school resourcesto know which kind of regions would experience the larger gains in teachers’ productivity. If this function is concave(resp. convex, S-shaped), gains in teachers’ productivity are larger at the bottom (resp. top, middle) part of schoolresource distribution.
37

(i), (ii), plus the condition that (iii) teachers prefer a centralized government. France is an example
of countries where this policy is likely to work well.
Increase in Gp If the additional resources fall in the hands of parents, parents increase their
participation at school, which leads to the opposite situation in which teachers invest unambiguously
more effort when teachers are motivated by the collaboration with parents through three positive
effects: the effects of additional resources and of parents’ participation in the management of the
resources on their productivity, and the incentive produced by the social reward. When teachers
prefer a centralized government, parents’ participation creates a burden for teachers which reduces
teachers’ effort in a way that might be strong enough to offset teachers’ positive response to school
resources and to parents’ management of the resources. In the long-run, this should eventually
discourage parents to participate at school and encourage investment for education at home back
up, but in the short-run concurrent increase in parents’ participation in school management and
decrease in teachers’ effort can be observed, as Duflo, Dupas and Kremer (2012) find in Kenya. Our
empirical results are also consistent with the situation where teachers’ preference for a centralized
government is strong and parents’ real authority is weak, resulting in a negative short-term impact
of parents’ participation in school on teachers’ effort. The impact on school quality can be at risk
since the positive effects of school resources and parents’ management of the resources are mitigated
by a double decrease in parents’ effort at home and teachers’ effort at school.
When parents have a large real authority θ, the positive effect of parents’ management of the
resources is larger so parents’ response is larger too, which is consistent with our empirical findings
that parents contribute more and participate more in school management when they have more
authority. The larger effect on parents’ participation combined with the smaller likelihood of a
preference for a centralized government leads to a more favorable teachers’ response. Our data
do not confirm this prediction, but Duflo, Dupas and Kremer (2012) do since they observe that
parents’ empowerment through school committee training reduced the negative response of civil-
servant teachers.
According to this framework, the conditions of success of this policy are thus (i), (ii), plus
the conditions that (iii) teachers are keen to collaborate with parents, and (iv) parents have real
authority on teachers. These conditions are more likely to hold in countries where the social gap
38

between parents and teachers is small and where the education system is decentralized. The USA
is an example of countries where this policy is likely to work well, whereas Niger and Kenya are not
the ideal contexts for encouraging parental control over school management since (iii) and (iv) do
not hold. However, one might argue that the short-term negative impact on teachers’ effort is the
price to pay for potential longer-term positive effect -which our results cannot exclude.
The general picture supported by existing empirical evidence and explained by our model is
three-fold: first, an increase in school resources out of parental control tends to decrease parental
effort. Second, an increase in school resources under parental control tends to increase parental
effort. Finally, the size of the increase in parental effort and of the resulting effect on teachers’
effort depends on power imbalances in school: the higher parents’ real authority, the larger their
response and the resulting increase in teacher’s effort, with a risk of adverse effects in contexts
where parents are weak. This paper is a first step that uses both formal tests and intuition to build
a narrative about community participation in resource management. Our hope is that future work
might build on this model to provide additional insights and rigorous empirical tests.
6 Conclusion
In Niger, parents responded to increased financial resources under their control by increasing par-
ticipation on several dimensions, and did not decrease their own financial contributions. The impli-
cation of this finding is that the crowding out due to increased inputs found in other experiments
may not be inevitable if parents are involved in the management of the funds. We also find that
increased parent participation came with a small increase in young pupil participation. However,
more pessimistically, while the parents were willing to try to improve quality by participating, they
were not able to do so. One possible reason for this is that in this context, parents (the majority
of whom did not go to school) do not have sufficient information to make investments that are
likely to improve quality. In particular, most investments focused on buildings, rather than extra
lessons or materials, and these investments did not translate into improved learning (at least in the
short run). We also find that on average teachers decreased their effort in response to the grant to
the COGES. This finding reinforces other evidence in the literature of negative teacher reactions to
participatory programs, and highlights the importance of taking this potential reaction into account
in policy planning.
39

The heterogeneous impact analysis, while second-order, yields potentially helpful suggestions
for understanding the impact of the program. The most difficult type of participation - monitoring
teachers - was attempted only by educated or experienced school committees. The implication of
this finding is that participation initiatives need to take the capacity and authority of the intended
participators into account. In addition, we find that one-teacher schools, which invested in the
teacher’s working conditions and/or made some type of transfer to the teacher, actually increased
teacher attendance. We take this as evidence that teachers’ negative reaction to parent participation
might be reversed when parents behave like allies. Finally, we find that rural school committees
as well as non-educated school committees invested a small part of the grant in agriculture, which
might reflect that they did not give priority to education or that they invested the money in order
to get more funds for the school in the future. We highlight it so that future programs might be
aware of it and collect more data to understand what schools might do with grants and the role
education preferences and credit constraints play in those decisions.
A model with a few assumptions about parents’ and teachers’ roles in producing education
helps interpret these empirical findings along with the evidence found in the literature. Adding two
key ingredients, teachers’ preference for a centralized government and parents’ real authority, to a
classical model of school quality can reproduce the existing evidence on the effects of participatory
programs.
There are four key policy implications of our findings. First, the degree to which outside inputs
are treated as substitutes to a community’s own contributions and efforts may depend on the degree
to which the community has power over the inputs: when parents are involved in input management,
inputs do not necessarily crowd out their contributions and efforts. Second, parent participation
can reduce teacher effort when parents have low authority and are not “on the same side” as the
teachers, and some attention should be given to designing programs with this possible response in
mind. Third, programs that encourage community participation to increase school quality should
take into account the ability of the community to make the good decisions (for example, the degree
to which they have information about how schools work): we find in this experiment that parents
used the grant in ways that were unlikely to increase school quality. Finally, behavioral responses
to programs may cancel each other out: in the case of this grant, an increase in the effort of the
parents and in the quality of the infrastructure was met with a decrease in the effort (presence) of
40

the teachers.
41

References
[1] Aghion, Philippe and Jean Tirole. 1997. “Formal and Real Authority in Organizations”, Jour-
nal of Political Economy, 105(1): 1-29
[2] Albornoz, Facundo, Samuel Berlinski and Antonia Cabrales. 2011. “Motivation, resources and
the organization of the school system,” Working paper.
[3] Alesina, Roberto, and Eliana La Ferrarra. 2000. “Participation in Heterogenous Communities”,
Journal of Public Economics, pp.. 847-904.
[4] Banerjee, Abhijit, Rukmini Banerji, Esther Duflo, Rachel Glennerster, and Stuti Khemani.
2010. “Pitfalls of Participatory Programs: Evidence from a Randomized Evaluation in Educa-
tion in India”, American Economic Journal: Economic Policy, 2(1): 1–30.
[5] Banerjee, Abhijit, Suraj Jacob, Michael Kremer, Jenny Lanjouw, and Peter Lanjouw. 2002.
“Promoting School Participation in Rural Rajasthan: Results from Some Prospective Trials”,
Unpublished.
[6] Bardhan, Pranab. 2002. “Decentralization of Governance and Development”, Journal of Eco-
nomic Perspectives, 16(Fall): 185-205.
[7] Barrera-Osorio, Felipe, Tazeen Fasih, Harry Anthony Patrinos and Lucrecia Santibanez. 2009.
Decentralized Decision-Making in Schools, The Theory and Evidence on School-Based Man-
agement. Washington D.C.: The World Bank.
[8] Blimpo, Moussa and David Evans. 2011. “School-Based Management, Local Capacity, and
Educational Outcomes: Lessons from a Randomized Field Experiment”, Unpublished.
[9] Bryk, Anthony, Yeow Meng Thum, John Easton, and Stuart Luppescu. 1998. “Academic
Productivity of Chicago Public Elementary Schools: A Technical Report Sponsored by the
Consortium on Chicago School Research”, Mimeo University of Chicago.
[10] Chaudhury, Nazmul, Jeffrey Hammer, Michael Kremer, Karthik Muralidharan, and F. Halsey
Rogers. 2006. “Missing in Action: Teacher and Health Worker Absence in Developing Coun-
tries”, Journal of Economic Perspectives, 20(1): 91–116.
42

[11] Das, Jishnu, Stefan Dercon, James Habyarimana, Pramila Krishnan, Karthik Muralidharan,
and Venkatesh Sundararaman. 2013. “School Inputs, Household Substitution, and Test Scores”,
American Economic Journal: Applied Economics, 5(2), 29-57.
[12] Di Gropello Emanuela. 2006. “A Comparative Analysis of School-based Management in Central
America”, World Bank Working Paper, 72.
[13] Duflo, Esther, Pascaline Dupas and Michael Kremer. 2012. “School Governance, Teacher In-
centives, and Pupil-Teacher Ratios: Experimental Evidence from Kenyan Primary Schools”,
Unpublished.
[14] Galiani, Sebastian, Paul Gertler and Ernesto Schargrodsky. 2008. “School Decentralization:
Helping the good get better, but leaving the poor behind”. Journal of Public Economics,
92(2008): 2106-2120.
[15] Gershberg Alec and Gavin Shatkin. 2007. “Empowering Parents and Building Communities:
the Role of School-Based Councils in Educational Governance and Accountability”, Urban
Education, 42:582-615.
[16] Glewwe, Paul, Michael Kremer, and Sylvie Moulin. 2009. “Many Children Left Behind? Text-
books and Test Scores in Kenya”, American Economic Journal - Applied, 1(1): 112-135.
[17] Glewwe, Paul, Michael Kremer, Sylvie Moulin, and Eric Zitzewitz. 2004. “Retrospective vs.
Prospective Analyses of School Inputs: The Case of Flip Charts in Kenya”, Journal of Devel-
opment Economics, 74(1): 251–68.
[18] Glewwe, Paul and Michael Kremer. 2006. “Schools, Teachers, and Education Outcomes in
Developing Countries”, Handbook on the Economics of Education, edited by Erik Hanushek
and F. Welch, Elsevier.
[19] Gunnarsson,Victoria, Peter F. Orazem, Mario A. Sanchez and Aimee Verdisco. 2009. “Does
Local School Control Raise Student Outcomes? Evidence on the Roles of School Autonomy and
Parental Participation”, Economic Development and Cultural Change, Vol. 58, No. 1 (October
2009), pp.. 25-52
43

[20] Hanushek, Eric. 2003. “The Failure of Input-Based Schooling Policies”, The Economic Journal,
Vol. 113, No. 485, Features (Feb 2003), pp.. F64-F98.
[21] Hess, Alfred. 1999. “Expectations, Opportunities, Capacity and Will: The Four Essential
Components of Chicago School Reform”, Educational Policy, 13(4): 494-517.
[22] King, Elizabeth, and Berk Ozler. 2005. “What’s Decentralization Got to Do With Learning?
School Autonomy and Student Performance,” Discussion Paper No. 054, Interfaces for Ad-
vanced Economic Analysis, Kyoto University, January 2005.
[23] Kling, Jeffrey R., Jeffrey B. Liebman, and Lawrence F. Katz, 2007. “Experimental Analysis of
Neighborhood Effects”, Econometrica, 75(1): pp. 83-119.
[24] Kremer, Michael, Conner Brannen and Rachel Glennester. 2013. “The Challenge of Education
and Learning in the Developing World”, Science, 340: pp. 297-300.
[25] Kremer, Michael, and Christel Vermeersch. 2005. “School Committee Empowerment: Prelim-
inary Notes”, Unpublished.
[26] Lassibille, Gerard, Jee-Peng Tan, Cornelia Jesse, and Trang Van Nguyen. 2010. “Managing
Results in Primary Education in Madagascar: Evaluating the Impact of Selected Workflow
Interventions”, The World Bank Economic Review, 24(2): 303-329
[27] Martinez-Bravo, Monica, Gerard Padro i Miguel, Nancy Qian, and Yang Yao. 2013. “Political
Reform in China: Elections, Public Goods and Income Distribution.” NBER Working Paper
18101
[28] Pop-Eleches, Christian and Miguel Urquiola. 2013. “Going to a Better School: Effects and
Behavioral Responses”. The American Economic Review, 103(4): 1289-1324.
[29] Pradhan, Menno, Daniel Suryadarma, Amanda Beatty, Maisy Wong, Armida Alishjabana,
Arya Gaduh and Rima Prama Artha. 2014. “Improving Educational Quality through Enhanc-
ing Community Participation: Results from a Randomized Field Experiment in Indonesia”,
American Economic Journal: Applied Economics, 6(2): 105–126.
44

[30] Sabarwal, Shwetlena, David Evans, and Anastasia Marshak. 2014 ”The permanent input hy-
pothesis: the case of textbooks and (no) student learning in Sierra Leone.” World Bank Policy
Research Working Paper 7021.
[31] World Bank. 2003. World Development Report 2004: Making Services Work for Poor People.
New York, NY: Oxford University Press.
[32] World Bank. 2010. “Improving Education and Developing Skills for Economic Growth in
Niger.” Report of the Africa Region Human Development Department.
45

Figure 1: Reported Use of Grant Money, by Total Amount Spent
Source: Financial Control over 85 randomly selected schools
46

Figure 2: Differences in spending between treatment and control groups
Amounts, coefficients are from regressions with controlsControl Mean Treatment amount (control mean - coeff)Difference Difference USD Difference as %
Infrastructure 93113 112,772 19,659 $39 21%School Supplies 11631 14,853 3,222 $6 28%Pupil Education 6058 7,442 1,384 $3 23%Pupil Health 10031 10,006 -25.41 $0 0%Teacher Support 4352 3,260 -1,092 -$2 -25%COGES Expenses 1805 1,538 -267.4 -$1 -15%Festivals/Playgrounds 165.8 1,031 864.8 $2 522%Investment Projects 582.9 2,402 1,819 $4 312%
-100%
0%
100%
200%
300%
400%
500%
600%
Percent differences
-$5
$0
$5
$10
$15
$20
$25
$30
$35
$40
$45
Absolute differences
47

Table 1: Pre-program School Characteristics, by Treatment Group
(1) (2) (3) (4) (5) (6)
N mean N mean T-C pvalue
Pupil CharacteristicsEnrollment 07/08 500 149.6 500 141.72 -7.88 0.28% Girls in 07/08 500 0.38 500 0.38 -0.01 0.26% Passed Exam in 07/08 262 0.45 224 0.42 -0.03 0.28
Teacher CharacteristicsNumber of Teachers 490 3.87 494 3.55 -0.32 0.13% of teachers civil servants 490 0.2 494 0.2 0 0.91
Physical InfrastructureNumber of Buildings in 07/08 490 3.91 494 3.68 -0.23 0.17Number of Latrines in 07/06 500 0.89 500 0.82 -0.08 0.55Water Access in 06/07 500 0.09 500 0.11 0.01 0.53Electricity in 06/07 500 0.01 500 0.02 0.01 0.22
COGES CharacteristicsCOGES sponsored in 07/08 500 0.57 500 0.55 -0.01 0.70COGES Exists in 06/07 500 0.88 500 0.9 0.02 0.32
LocationTahoua 500 0.52 500 0.51 -0.01 0.85Distance to Inspection 500 41.1 500 38.59 -2.5 0.17Distance to Health Center 476 8.24 461 8.95 0.7 0.61
Control Treatment Difference
Data come from Ministry of Education Administrative Data. The data from 07/08 are reported inNovember (prior to the intervention) and are used when available, otherwise data from 06/07 isused. "Sponsored" COGES are those that have some sort of official sponsor or support group (suchas an NGO).
48

Table 2: Community Characteristics used for Heterogeneous Treatment Effect Analysis
Control Obs.
Treatment Obs
p-value of difference in attrition
Control Mean
Treatment Mean
Difference in means (T-C)
p-value of difference in means
Educated COGES member 369 370 0.94 0.317 0.305 -0.01 0.73Experienced COGES member 369 370 0.94 0.209 0.227 0.02 0.55Average wealth of school committee (PCA) 329 320 0.89 1.146 1.154 0.01 0.42One-Teacher School 499 497 0.34 0.122 0.145 0.02 0.24Urban School 500 500 0.108 0.110 0.00 0.92Source: School survey conducted April-May 2008, except % of girls in 2007/08: 2007/08 administrative data.Observations at school level. P-values are for tests of equality of the means across Treatment and Control.
The p-value of difference in attrition is calculated by creating a dummy variable equal to 1 if the data is missing for a particular school, and then calculating the p-value of the difference in this variable between groups.
Educated COGES member =1 if at least one member completed primary school. Experienced COGES member=1 if at least one member is also the member of another community organization.
49

Table 3: Attrition, by Treatment Group and Pre-Program School Characteristics
(1) (2) (3) (4) (5) (6)
COGES education COGES wealth
COGES experience
Teacher effort index
Parent contrib index
Parent responsib
index
Treatment -0.101 -0.128 -0.101 -0.104 -0.0225 -0.0984(0.133) (0.135) (0.133) (0.126) (0.126) (0.127)
Treat*Enroll 0.0395 0.0524 0.0395 0.0591 0.0625 0.0522(0.0519) (0.0527) (0.0519) (0.0490) (0.0481) (0.0523)
Treat*% girls 0.0334 0.0356 0.0334 0.0305 0.0107 0.0257(0.0320) (0.0324) (0.0320) (0.0308) (0.0308) (0.0306)
Treat*Urban 0.00436 -0.109 0.00436 -0.0933 -0.107 -0.0604(0.0956) (0.105) (0.0956) (0.0812) (0.0816) (0.0815)
Treat*Sponsor -0.0121 -0.0180 -0.0121 -0.00630 -0.0227 -0.0266(0.0258) (0.0261) (0.0258) (0.0245) (0.0244) (0.0249)
Treat*Num Teach -0.0457 -0.0322 -0.0457 -0.0348 -0.0290 -0.0142(0.0551) (0.0573) (0.0551) (0.0523) (0.0525) (0.0542)
Treat*Tahoua -0.00777 0.00526 -0.00777 -0.0186 -0.0342 -0.0136(0.0284) (0.0286) (0.0284) (0.0274) (0.0272) (0.0280)
Observations 1,000 1,000 1,000 1,000 1,000 1,000R-squared 0.163 0.183 0.163 0.140 0.168 0.130Control Group Mean 0.262 0.28 0.262 0.214 0.222 0.224
(7) (8) (9) (10) (11) (12)
Parent involv index
Teacher oversight index
Cooperation Index
Accountability index Enrollment Test scores
Treatment 0.00109 -0.0978 -0.0810 -0.0360 -0.00933 -0.147(0.0772) (0.127) (0.127) (0.123) (0.0312) (0.124)
Treat*Enroll 0.00542 0.0411 0.0429 0.0633 0.00882 0.00727(0.0323) (0.0500) (0.0500) (0.0447) (0.0103) (0.0461)
Treat*% girls 0.000701 0.0272 0.0229 0.00859 0.00543 0.0318(0.0193) (0.0311) (0.0311) (0.0304) (0.00689) (0.0302)
Treat*Urban 0.00163 -0.0714 -0.0695 -0.0674 0.0171 0.0675(0.0590) (0.0819) (0.0820) (0.0718) (0.0274) (0.0991)
Treat*Sponsor 0.00475 -0.00133 -0.00339 -0.0152 -0.00213 0.0354(0.0164) (0.0248) (0.0248) (0.0234) (0.00697) (0.0272)
Treat*Num Teach 0.00146 -0.0284 -0.0284 -0.0297 -0.0170 -0.0120(0.0404) (0.0528) (0.0530) (0.0452) (0.0137) (0.0478)
Treat*Tahoua -0.0317* -0.00607 -0.00977 -0.0277 -0.00577 -0.00675(0.0189) (0.0276) (0.0277) (0.0263) (0.00714) (0.0283)
Observations 1,000 1,000 1,000 1,000 1,000 1,000R-squared 0.062 0.132 0.134 0.149 0.009 0.133Control Group Mean 0.084 0.22 0.222 0.198 0.014 0.278Robust standard errors in parentheses, *** p<0.01, ** p<0.05, * p<0.1. Dependent variable in each column is adummy variable equal to one when the value is missing for a given school. All regressions include the levelvariables from the interaction terms.
50

Table 4: Grant Impact on Parent Contribution
(1) (2) (3) (4)Amount of User Fees Charged by
schoolAny Inkind
contributions
Parent Money contributed (per
pupil)
Parent Contribution
Index
Treatment 35.48 0.0223 -72.86 -0.0117235.3 0.0252 54.23 0.0490
Constant 1,856** 0.634*** 486.5** -0.141772.3 0.102 194.7 0.167
Observations 745 758 719 782R-squared 0.038 0.077 0.066 0.056Control Group Mean 631.6 0.836 500.2 -0.00709Robust standard errors in parentheses. *** p<0.01, ** p<0.05, *p<0.10. Regressions control forwhether the school is in a rural or urban area, total enrollment in 07/08, proportion of girls in 07/08,whether the school had NGO support prior to the grant and inspection fixed effects. Any in kindcontributions includes food, building supplies, wood, and so on. The Parent Contribution Index is theaverage of the z-scores in columns (1) to (3).
51

Table 5. Impact on Parent Involvement
(1) (2) (3) (4) (5) (6) (7) (8) (9) (10) (11) (12)
Number of
COGES meetings
Time elapsed
since last COGES meeting
Number of APE
meetings
Time elapsed
since last APE
meeting
Number of
COGES meetings
08/09
AME is Active, 08/09
Number of Topics
in COGES meeting
Number of Topics in APE meeting
Number of COGES
Communal meetings
Presence at APE meeting
Presence at COGES
meeting
Parent Involv Index
Treatment 0.151 -0.135 0.101 -0.182 0.256 0.0492 0.0614 0.0530 0.0709 0.0800 0.00652 0.0600*0.182 0.124 0.147 0.200 0.176 0.0299 0.104 0.104 0.116 0.0830 0.0881 0.0321
Constant 4.421*** 3.955*** 2.890*** 4.776*** 4.786*** 0.113 2.838*** 2.035*** 2.519*** 1.607*** 1.643*** -0.007560.612 0.526 0.479 0.782 0.868 0.119 0.455 0.454 0.419 0.359 0.375 0.117
Observations 747 549 727 465 803 888 739 649 714 743 746 922R-squared 0.043 0.137 0.029 0.051 0.056 0.066 0.085 0.074 0.071 0.074 0.066 0.059Control Group Mean 3.758 2.653 2.470 3.691 4.601 0.272 2.363 1.918 2.518 2.057 1.757 -0.0355Robust standard errors in parentheses. *** p<0.01, ** p<0.05, *p<0.10. Regressions control for whether the school is in a rural or urban area, totalenrollment in 07/08, proportion of girls in 07/08, whether the school had NGO support prior to the grant and inspection fixed effects. APE is the ParentAssociation of the school. The Parent Action Index is the average of the z-scores of the variables in columns (1) to (11).
52

Table 6. Impact on Parent Responsibility
(1) (2) (3) (4) (5) (6) (7) (8) (9)
COGES responsible for
monitoring pupil
attendance
COGES has taken remedial action on pupil
attendance
COGES is responsible for supplies
COGES is responsible
for infrastructure
Number of COGES
tasks
COGES is responsible
for fee collection
COGES is responsible
for fee expenses
Parents are responsible for
drafting the Action Plan
Parent Responsib.
Index
Treatment -0.0100 -0.00289 -0.0106 0.0451 0.0914 0.0767 0.0615 0.0308 0.0586*0.0222 0.0375 0.0353 0.0307 0.120 0.0476 0.0481 0.0204 0.0353
Constant 0.807*** 0.643*** 0.593*** 0.571*** 3.835*** 0.213 0.131 0.873*** -0.08890.0866 0.141 0.125 0.109 0.491 0.169 0.179 0.0868 0.129
Observations 754 581 752 749 735 401 401 732 780R-squared 0.063 0.062 0.063 0.064 0.070 0.065 0.074 0.029 0.051Control Group Mean 0.769 0.713 0.603 0.739 3.441 0.301 0.335 0.900 -0.0191Robust standard errors in parentheses. *** p<0.01, ** p<0.05, *p<0.10. Regressions control for whether the school is in a rural or urban area, totalenrollment in 07/08, proportion of girls in 07/08, whether the school had NGO support prior to the grant and inspection fixed effects. Parent ResponsibilityIndex is the average of the z-scores of the variables in columns (1) to (8).
53

Table 7. Impact on Teacher Oversight
(1) (2) (3) (4) (5) (6) (7)
COGES discusses teacher
behavior
APE discusses teacher
behavior
COGES monitors teacher
attendance
COGES takes remedial action
on teacher
COGES works to reduce
teacher absence
COGES works to improve education
qualityTeacher
Oversight Index
Treatment 0.0371 -0.00646 -0.0126 -0.0120 0.0319 0.0166 0.02660.0255 0.0276 0.0219 0.0337 0.0293 0.0303 0.0389
Constant 0.343*** 0.259* 0.844*** 0.378*** 0.372*** 0.814*** 0.335**0.124 0.133 0.0820 0.128 0.117 0.111 0.159
Observations 649 573 758 758 720 731 778R-squared 0.070 0.045 0.064 0.049 0.099 0.088 0.110Control Group Mean 0.103 0.121 0.766 0.329 0.271 0.621 0.00229Robust standard errors in parentheses. *** p<0.01, ** p<0.05, *p<0.10. Regressions control for whether the school is in a rural or urban area,total enrollment in 07/08, proportion of girls in 07/08, whether the school had NGO support prior to the grant and inspection fixed effects. APE isthe Parent Association of the school. The Teacher Oversight Index is the average of the z-scores of the variables in columns (1) to (6).
54

Table 8. Impact on Accountability
(1) (2) (3) (4) (5) (6) (7) (8) (9) (10) (11)Book for Visitor Exists
Weekly Planning
Seen
Supply Register
Seen
PV last COGES meeting
PV last APE
meeting
Teacher Register
Seen
Pupil Register
Seen
Funds Register
Seen
Expenses Register
SeenAction
Plan SeenAccount.
Index
Treatment -0.0123 -0.0185 0.0413 -0.0278 -0.0493 -0.0151 -0.0221 0.0619* 0.101*** -0.00642 0.01270.0356 0.0279 0.0341 0.0344 0.0354 0.0214 0.0222 0.0353 0.0355 0.0292 0.0351
Constant 0.380*** -0.0764 0.369*** 0.351*** 0.473*** 0.126 0.111 0.506*** 0.447*** 0.490*** -0.219*0.136 0.103 0.122 0.126 0.131 0.0869 0.0791 0.128 0.130 0.121 0.124
Observations 784 784 777 743 735 705 692 651 648 937 806R-squared 0.043 0.095 0.124 0.130 0.113 0.032 0.021 0.218 0.213 0.223 0.124Control Group Mean 0.519 0.224 0.509 0.594 0.520 0.0986 0.103 0.494 0.476 0.484 0.00325Robust standard errors in parentheses. *** p<0.01, ** p<0.05, *p<0.10. Regressions control for whether the school is in a rural or urban area, total enrollment in07/08, proportion of girls in 07/08, whether the school had NGO support prior to the grant and inspection fixed effects. PV is proces verbal (minutes) taken in themeetings. The APE is the Parent Association of the School. The Accountability Index is the average of the z-scores of the variables in columns (1) to (10).
55

Table 9. Impact on Cooperation
(1) (2) (3) (4) (5) (6) (7) (8) (9) (10) (11) (12)
Teachers' coop with COGES
Teachers' coop with each other
Teachers' coop with
comm.
COGES has support
from the comm.
COGES has support
from local auth.
COGES has support
from the school admin.
COGES has support
from teachers
COGES has support from APE
COGES has support
from CP
COGES has support
from Inspect.
Rare or no fights within
COGES Coop Index
Treatment 0.0234 -0.00037 0.00870 0.0482* 0.0312 0.0394 0.0315* 0.0509** 0.00846 0.0250 -0.0210 0.0661**0.0341 0.0329 0.0331 0.0271 0.0288 0.0240 0.0178 0.0203 0.0284 0.0297 0.0350 0.0306
Constant 3.517*** 3.596*** 3.400*** 0.586*** 0.656*** 0.739*** 0.842*** 0.786*** 0.652*** 0.610*** 0.473*** -0.220**0.130 0.121 0.127 0.113 0.114 0.0884 0.0665 0.0742 0.0965 0.0985 0.136 0.103
Observations 737 735 736 757 755 755 757 754 755 754 752 777R-squared 0.048 0.109 0.112 0.084 0.070 0.077 0.084 0.057 0.113 0.071 0.065 0.078Control Group Mean 3.329 3.485 3.329 0.797 0.776 0.854 0.918 0.889 0.792 0.770 0.610 -0.00756Robust standard errors in parentheses. *** p<0.01, ** p<0.05, *p<0.10. Regressions control for whether the school is in a rural or urban area, total enrollment in07/08, proportion of girls in 07/08, whether the school had NGO support prior to the grant and inspection fixed effects. APE is the Parent Association of the school.Columns (8) and (9) refer to support from representatives of the Ministry of Education: CP is Conseiller Pedagogique (Education Advisor) and is from the hierarchicallevel just above the school, the Inspection refers to the level above the CP. The Cooperation Index is the average of the z-scores of the variables in columns (1) to (11).
56

Table 10. Impact on Spending Decisions
(1) (2) (3) (4) (5) (6) (7) (8) (9)Infrastructure
and Equipment
Supplies and Textbooks
Pupil Educational
SupportPupil
HealthTeacher Support
COGES Expenses
School Festivals and Playground
Investments in
AgricultureTotal
Amount
Treatment 21,586** 3,222 1,435 1,253 -1,086 32.14 864.8*** 1,833*** 28,512***9,121 1,981 1,369 2,154 1,331 300.6 285.5 658.5 9,993
Constant -24,197 836.7 -763.1 -13,404* 1,489 524.5 -1,599** -861.4 -34,99438,103 8,622 4,031 8,062 4,576 1,046 765.0 1,098 41,928
Observations 726 733 734 734 734 738 736 731 698R-squared 0.127 0.156 0.087 0.051 0.019 0.039 0.039 0.047 0.157Control Group Mean 86119 11631 6058 8711 4352 782.7 165.8 582.9 115898
Dependent Variable: Amount of money Spent on….
Robust standard errors in parentheses. *** p<0.01, ** p<0.05, *p<0.10. Regressions control for whether the school is in a rural or urban area, totalenrollment in 07/08, proportion of girls in 07/08, whether the school had NGO support prior to the grant, and inspection fixed effects. Dependent variable isthe amount in FCFA spent by COGES in the corresponding category of activities, as declared by the president of COGES in the April/May 2008 survey.Infrastructure and Equipement includes expenses related to classrooms, desks, chairs, blackboards, school enclosure and security, and cleaning. Suppliesand Texbooks includes expenses for notebooks, pens, and textbooks. Pupil Educational Support includes expenses like additional courses, awarenesscampaigns to increase enrollment, and academic rewards. Pupil Health includes expenses related to nutrition and health like drinkable water, meals,latrines and drugs. Teacher support includes expenses benefitting to teachers like teacher housing, furniture, supplies, guide books, and salary. COGESExpenses includes expenses related to COGES meetings, contributions to "COGES communal" and inspector visits. Schools festivals and Playgroundincludes expenses like graduation ceremonies, parties, and soccer balls. Investments in Agriculture includes fields, crops and livestock, unrelated toeducation activities.
57

Table 11. Impact on Infrastructure
(1) (2) (3) (4) (5) (6) (7) (8) (10)Change in the
number of buildings
Change in the condition of
buildings
Change in the number of
blackboards
Change in the number of
desks
Wall around school
grounds
Number of teacher's
desks
Number of teacher's
chairsNumber of bookcases
Infrastructure Index
Treatment 0.0766* -0.0155 0.138 0.187 0.0866*** 0.0123 0.00454 -0.0106 0.0414*0.0452 0.0207 0.117 0.678 0.0316 0.0590 0.0332 0.0395 0.0236
Constant 0.187 0.480*** -0.352 -0.0640 -0.135 -0.0798 -0.104 -0.161 -0.454***0.183 0.0796 0.550 2.934 0.114 0.239 0.145 0.170 0.0936
Observations 947 988 905 597 847 896 891 894 978R-squared 0.046 0.057 0.038 0.054 0.132 0.032 0.026 0.029 0.164Control Group Mean 0.274 0.670 0.654 -0.724 0.343 0.0316 0.0618 0.0461 -2.98e-09Robust standard errors in parentheses. *** p<0.01, ** p<0.05, *p<0.10. Regressions control for whether the school is in a rural or urban area, totalenrollment in 07/08, proportion of girls in 07/08, whether the school had NGO support prior to the grant and inspection fixed effects. Columns (1) to (4) usechange in the variable between 2007/2008 and 2008/2009. Columns (5) to (8) use the variable from 2008/2009 because of missing data in the earlier year. TheInfrastructure Index is the average of the z-scores of the variables in columns (1) to (8).
58

Table 12. Impact on Materials
(1) (2) (3) (4) (5)Change in number of
books DictionaryGeography Tool
IndexMath Tool
Index Materials Index
Treatment 1.267 -0.0162 -0.0422 -0.0705 -0.04393.266 0.0281 0.0486 0.0470 0.0350
Constant -0.438 -0.176 -0.365 -0.413** -0.402**13.52 0.121 0.249 0.192 0.171
Observations 749 858 735 841 826R-squared 0.086 0.108 0.037 0.256 0.174Control Group Mean -10.75 0.0472 -0.0165 -3.26e-05 -0.00411Robust standard errors in parentheses. *** p<0.01, ** p<0.05, *p<0.10. Regressions control for whether theschool is in a rural or urban area, total enrollment in 07/08, proportion of girls in 07/08, whether the school hadNGO support prior to the grant and inspection fixed effects. Data are administrative data from the 2008/2009school questionnaire. Change in the number of books is in comparison to the previous years administrative data.Dictionary is whether or not the school has a dictionary. Geography tool index is composed of whether theschool has an atlas, map, or globe. Math tool index is whether the school has a protractor, ruler, or compass.Materials index is the average of the z-scores of the variables in columns (1)-(4).
59
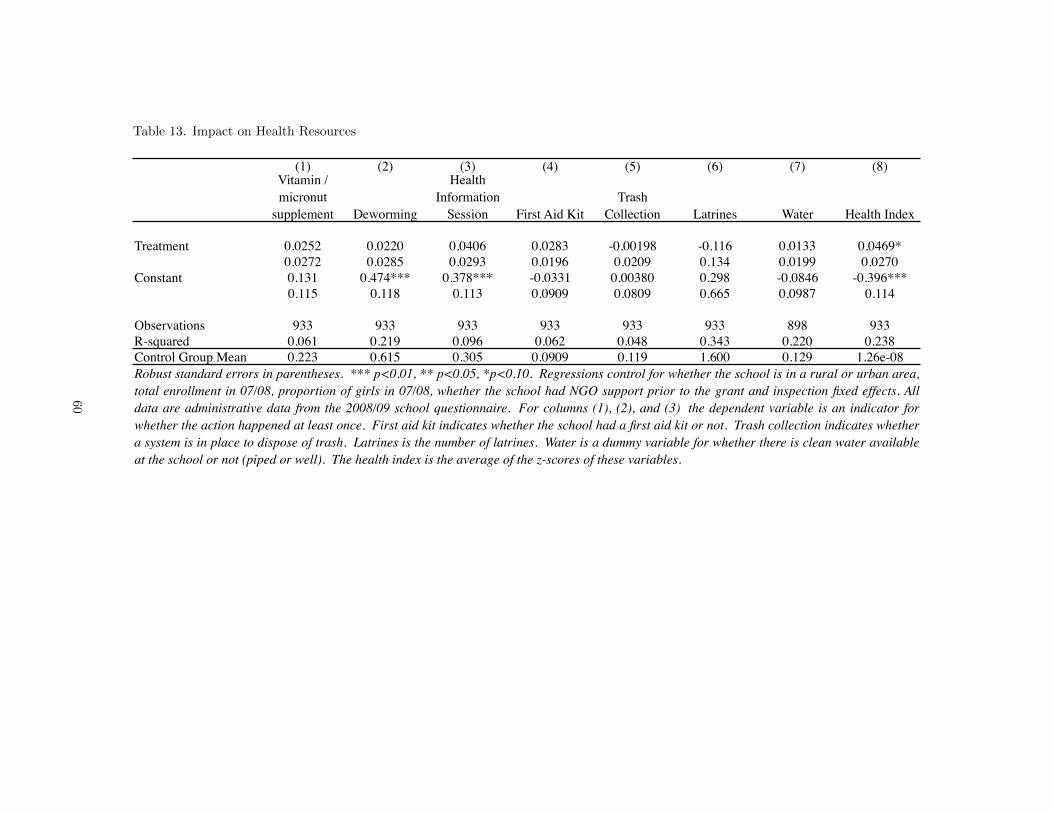
Table 13. Impact on Health Resources
(1) (2) (3) (4) (5) (6) (7) (8)Vitamin / micronut
supplement Deworming
Health Information
Session First Aid KitTrash
Collection Latrines Water Health Index
Treatment 0.0252 0.0220 0.0406 0.0283 -0.00198 -0.116 0.0133 0.0469*0.0272 0.0285 0.0293 0.0196 0.0209 0.134 0.0199 0.0270
Constant 0.131 0.474*** 0.378*** -0.0331 0.00380 0.298 -0.0846 -0.396***0.115 0.118 0.113 0.0909 0.0809 0.665 0.0987 0.114
Observations 933 933 933 933 933 933 898 933R-squared 0.061 0.219 0.096 0.062 0.048 0.343 0.220 0.238Control Group Mean 0.223 0.615 0.305 0.0909 0.119 1.600 0.129 1.26e-08Robust standard errors in parentheses. *** p<0.01, ** p<0.05, *p<0.10. Regressions control for whether the school is in a rural or urban area,total enrollment in 07/08, proportion of girls in 07/08, whether the school had NGO support prior to the grant and inspection fixed effects. Alldata are administrative data from the 2008/09 school questionnaire. For columns (1), (2), and (3) the dependent variable is an indicator forwhether the action happened at least once. First aid kit indicates whether the school had a first aid kit or not. Trash collection indicates whethera system is in place to dispose of trash. Latrines is the number of latrines. Water is a dummy variable for whether there is clean water availableat the school or not (piped or well). The health index is the average of the z-scores of these variables.
60

Table 14. Impact on Teacher Effort
(1) (2) (3) (4)
Days on strikeTeacher is
Present
COGES opinion of
Teacher EffortTeacher Effort
Index
Treatment -0.541 -0.0382* -0.0220 -0.02370.490 0.0227 0.0253 0.0435
Constant -2.071 0.937*** 3.656*** 0.484***2.292 0.0738 0.0932 0.158
Observations 706 799 734 784R-squared 0.127 0.248 0.134 0.213Control Group Mean 4.592 0.760 3.617 -0.00712Robust standard errors in parentheses. *** p<0.01, ** p<0.05, *p<0.10. Regressions control forwhether the school is in a rural or urban area, total enrollment in 07/08, proportion of girls in07/08, whether the school had NGO support prior to the grant and inspection fixed effects. Dayson strike is the number of days that the school was closed due to teachers striking in 2007/2008.Teacher is present is the school average of the dummy variable indicating 1 if a teacher isphysically present at the day of visit (on a day when the school was supposed to be open). If theschool was closed, all teachers were counted as absent. The Teacher Effort Index is the average ofthe z-scores of the variables in columns (1) to (3).
61

Table 15. Impact on Dropout and Enrollment
(1) (2) (3) (4) (5) (6) (7) (8) (9)Total Total Girls Total Boys Grade 1 Grade 2 Grade 3 Grade 4 Grade 5 Grade 6
Treatment -0.00559 -0.206 -0.00469 -0.0136* -0.00646 -0.00791 -0.00778 0.00264 0.001390.00520 0.212 0.00609 0.00758 0.0107 0.00582 0.0100 0.00849 0.00987
Constant 0.0723*** 0.775 0.0908*** 0.0366** 0.0613** 0.0678*** 0.143** 0.115** 0.0891**0.0165 0.662 0.0224 0.0183 0.0291 0.0240 0.0570 0.0455 0.0384
Observations 748 754 753 531 434 525 454 381 466R-squared 0.059 0.036 0.055 0.038 0.042 0.046 0.090 0.068 0.104Control Group Mean 0.0359 0.366 0.0379 0.0296 0.0328 0.0295 0.0364 0.0313 0.0508
(1) (2) (3) (4) (5) (6) (7) (8) (9)Total Total Girls Total Boys Grade 1 Grade 2 Grade 3 Grade 4 Grade 5 Grade 6
Treatment 1.366 0.505 0.862 -0.604 3.256** -0.471 -0.541 0.366 -0.6392.445 1.254 1.654 1.502 1.376 1.174 1.190 1.019 0.962
Constant 37.56** -21.01*** 58.57*** 34.47*** -1.052 5.214 1.546 -1.388 -1.22515.14 7.562 9.652 6.267 6.441 4.881 4.534 3.911 3.925
Observations 988 988 988 988 988 988 988 988 988R-squared 0.901 0.880 0.866 0.470 0.545 0.546 0.484 0.520 0.540Control Group Mean 160.3 65.70 94.63 40.09 29.95 23.87 26.22 20.98 19.22
B: Dependent Variable: Enrollment as reported in 2008/09 Administrative Data
A: Dependent Variable: Dropout as reported at school visit in Spring 2008
Robust standard errors in parentheses. *** p<0.01, ** p<0.05, *p<0.10. Regressions control for whether the school is in a rural or urban area,total enrollment in 07/08, proportion of girls in 07/08, whether the school had NGO support prior to the grant and inspection fixed effects. Table15A gives the impact of the treatment on dropout rates in the spring of 2008. Schools that do not have a particular grade level are missing. Notethat some schools did not provide breakdowns by sex. Table 15B gives the impact of treatment on enrollment in the fall of 2008 (the academic yearfollowing the treatment). Schools that have zero enrollment at a given grade level (because they are missing a particular level) are counted aszeros.
62

Table 16. Impact on Test Scores
(1) (2) (3) (4)
Oral Math FrenchEnd Primary
Pass Rate
Treatment -0.101 -0.0351 -0.0338 -0.02440.0749 0.0588 0.0586 0.0227
Constant -0.0252 -0.159 0.0648 0.525***0.261 0.209 0.221 0.0706
Observations 499 763 739 557R-squared 0.200 0.200 0.251 0.177Control Group Mean 0.00828 0.00545 0.0145 0.614Robust standard errors in parentheses. *** p<0.01, ** p<0.05, *p<0.10. Regressions control forwhether the school is in a rural or urban area, total enrollment in 07/08, proportion of girls in07/08, whether the school had NGO support prior to the grant and inspection fixed effects. Oral,Math and French test scores come from normalized test scores from the World Bank administeredexam in the spring of 2008. Oral test scores were given only to pupils in grades 1 and 2. The EndPrimary Pass Rate is the percent of students from the school who passed the exam at the end ofgrade 6 at the end of 2008 (administrative data).
63


