WILLIAMSON COUNTY - Round Rock ISD - 2002 Texas School Survey of Drug and Alcohol Use
Upload
texas-school-survey-of-drug-and-alcohol-useCategory
view
216download
0
8/14/2019 WILLIAMSON COUNTY - Round Rock ISD - 1998 Texas School Survey of Drug and Alcohol Use
http://slidepdf.com/reader/full/williamson-county-round-rock-isd-1998-texas-school-survey-of-drug-and-alcohol 1/213

8/14/2019 WILLIAMSON COUNTY - Round Rock ISD - 1998 Texas School Survey of Drug and Alcohol Use
http://slidepdf.com/reader/full/williamson-county-round-rock-isd-1998-texas-school-survey-of-drug-and-alcohol 2/213
Round Rock
Spring 1998
──────────────────────────────────────────────────────────────────────────────────────────────
Table T-1: How recently, if ever, have you used...
Past School Ever Never
Month Year Used Used
─────────────────────────────────────────────────────────────────────────────────────
Any tobacco product All 26.3% 35.7% 52.2% 47.8%
Grade 7 12.9% 21.2% 36.3% 63.7%
Grade 8 22.3% 30.2% 45.1% 54.9%
Grade 9 26.8% 37.9% 57.3% 42.7%
Grade 10 29.4% 41.6% 56.1% 43.9%
Grade 11 36.4% 44.4% 60.5% 39.5%
Grade 12 35.8% 44.7% 64.0% 36.0%
─────────────────────────────────────────────────────────────────────────────────────
Cigarettes All 25.1% 34.6% 51.1% 48.9%Grade 7 12.8% 21.0% 35.6% 64.4%
Grade 8 21.2% 28.9% 44.2% 55.8%
Grade 9 25.4% 36.7% 56.6% 43.4%
Grade 10 27.9% 40.1% 55.7% 44.3%
Grade 11 34.9% 43.4% 58.1% 41.9%
Grade 12 34.3% 42.7% 61.5% 38.5%
─────────────────────────────────────────────────────────────────────────────────────
Smokeless tobacco All 5.3% 9.4% 16.3% 83.7%
Grade 7 1.0% 2.6% 6.6% 93.4%
Grade 8 5.7% 9.6% 16.4% 83.6%
Grade 9 5.1% 8.5% 14.8% 85.2%
Grade 10 7.2% 12.9% 20.0% 80.0%
Grade 11 7.0% 13.6% 21.9% 78.1%
Grade 12 7.1% 11.1% 21.6% 78.4%
──────────────────────────────────────────────────────────────────────────────────────────────
Table T-2: How often do you normally use...
Any tobacco product?
Several Several About About Less Than
Never Every Times Times Once a Once a Once aUsed Day a Week a Month Month Year Year

8/14/2019 WILLIAMSON COUNTY - Round Rock ISD - 1998 Texas School Survey of Drug and Alcohol Use
http://slidepdf.com/reader/full/williamson-county-round-rock-isd-1998-texas-school-survey-of-drug-and-alcohol 3/213

8/14/2019 WILLIAMSON COUNTY - Round Rock ISD - 1998 Texas School Survey of Drug and Alcohol Use
http://slidepdf.com/reader/full/williamson-county-round-rock-isd-1998-texas-school-survey-of-drug-and-alcohol 4/213
Round Rock
Spring 1998
──────────────────────────────────────────────────────────────────────────────────────────────
Smokeless tobacco?
Several Several About About Less Than
Never Every Times Times Once a Once a Once a
Used Day a Week a Month Month Year Year
All 84.1% 1.0% 1.2% 1.4% 2.6% 4.0% 5.8%
Grade 7 93.8% * % 0.4% 0.6% 0.7% 2.4% 2.1%
Grade 8 83.4% 0.9% 1.7% 1.4% 3.5% 4.8% 4.3%
Grade 9 85.5% 0.5% 0.7% 0.9% 2.5% 5.0% 5.0%
Grade 10 80.4% 0.9% 1.8% 1.6% 4.0% 2.7% 8.5%
Grade 11 78.4% 0.8% 1.4% 2.8% 2.2% 5.8% 8.6%
Grade 12 80.2% 3.4% 1.7% 1.5% 2.4% 3.2% 7.6%
──────────────────────────────────────────────────────────────────────────────────────────────
Table T-3: In the past 30 days, how many cigarettes have you smoked?
>1 But >10 But >1 Pack
<1 Per <10 Per <1 Pack But <2 >2 Packs
None Day Day Per Day Packs/Day Per Day
All 72.0% 13.6% 9.7% 2.8% 1.7% 0.2%
Grade 7 82.3% 9.9% 5.9% 1.0% 0.9% * %
Grade 8 76.7% 12.9% 7.8% 1.1% 1.1% 0.3%
Grade 9 71.4% 14.4% 9.7% 2.8% 1.3% 0.4%
Grade 10 70.1% 14.1% 11.5% 2.8% 1.3% 0.2%
Grade 11 63.1% 16.5% 12.6% 4.4% 3.4% * %
Grade 12 63.5% 15.1% 12.2% 6.1% 3.1% * %
──────────────────────────────────────────────────────────────────────────────────────────────
Table T-4: Average age of first use of:
Grade 7 Grade 8 Grade 9 Grade 10 Grade 11 Grade 12
Tobacco 10.7 11.3 11.9 12.5 13.0 13.5

8/14/2019 WILLIAMSON COUNTY - Round Rock ISD - 1998 Texas School Survey of Drug and Alcohol Use
http://slidepdf.com/reader/full/williamson-county-round-rock-isd-1998-texas-school-survey-of-drug-and-alcohol 5/213
──────────────────────────────────────────────────────────────────────────────────────────────
Table T-5: If you wanted some, how difficult would it be to get...
Cigarettes?
Never Very Somewhat Somewhat Very
Heard Of Impossible Difficult Difficult Easy Easy
All 2.5% 8.2% 4.7% 7.4% 19.9% 57.4%
Grade 7 4.7% 20.8% 11.3% 11.8% 22.0% 29.3%
Grade 8 3.0% 12.3% 6.2% 11.6% 23.3% 43.6%
Grade 9 1.9% 4.9% 3.4% 5.7% 24.9% 59.2%
Grade 10 2.0% 4.2% 2.4% 6.4% 22.0% 63.1%
Grade 11 1.6% 1.8% 1.3% 4.7% 16.3% 74.4%
Grade 12 1.2% 1.4% 1.4% 1.9% 4.9% 89.3%
Smokeless Tobacco?
Never Very Somewhat Somewhat Very
Heard Of Impossible Difficult Difficult Easy Easy
All 9.2% 13.4% 7.9% 11.3% 18.7% 39.5%
Grade 7 14.2% 35.6% 13.7% 11.5% 12.4% 12.6%
Grade 8 11.5% 16.6% 11.5% 15.2% 20.1% 25.2%
Grade 9 10.4% 8.1% 8.4% 11.7% 24.0% 37.4%
Grade 10 6.9% 7.8% 5.3% 13.1% 22.2% 44.7%
Grade 11 5.0% 3.7% 4.2% 10.0% 23.4% 53.7%
Grade 12 4.6% 2.9% 1.2% 3.6% 7.5% 80.2%

8/14/2019 WILLIAMSON COUNTY - Round Rock ISD - 1998 Texas School Survey of Drug and Alcohol Use
http://slidepdf.com/reader/full/williamson-county-round-rock-isd-1998-texas-school-survey-of-drug-and-alcohol 6/213
Round Rock
Spring 1998
──────────────────────────────────────────────────────────────────────────────────────────────
Table T-6: About how many of your close friends...
Use any tobacco product?
Never heard
None A Few Some Most All
All 26.5% 29.4% 20.5% 19.9% 3.7%
Grade 7 49.4% 29.5% 10.6% 9.0% 1.6%
Grade 8 33.8% 30.8% 15.6% 16.1% 3.7%
Grade 9 23.2% 26.4% 23.0% 22.3% 5.1%
Grade 10 18.3% 32.7% 23.5% 20.9% 4.6%
Grade 11 11.1% 30.8% 27.7% 27.2% 3.1%
Grade 12 14.8% 26.4% 26.1% 28.5% 4.2%
Smoke cigarettes?
Never heard
None A Few Some Most All
All 27.8% 29.6% 20.2% 18.9% 3.5%
Grade 7 50.3% 29.4% 10.8% 8.0% 1.6%
Grade 8 34.8% 31.0% 16.1% 15.0% 3.1%
Grade 9 24.7% 27.3% 21.9% 21.0% 5.2%
Grade 10 19.3% 33.0% 22.4% 20.9% 4.4%
Grade 11 12.2% 30.8% 28.0% 25.9% 3.1%
Grade 12 17.7% 25.8% 26.2% 26.7% 3.5%
Use a smokeless tobacco product?
Never heard
None A Few Some Most All
All 63.9% 20.9% 10.4% 4.0% 0.7%
Grade 7 85.2% 9.1% 3.4% 2.0% 0.4%
Grade 8 67.4% 18.5% 8.8% 4.0% 1.3%
Grade 9 60.0% 21.3% 14.1% 4.1% 0.4%Grade 10 57.3% 27.9% 11.1% 3.3% 0.4%

8/14/2019 WILLIAMSON COUNTY - Round Rock ISD - 1998 Texas School Survey of Drug and Alcohol Use
http://slidepdf.com/reader/full/williamson-county-round-rock-isd-1998-texas-school-survey-of-drug-and-alcohol 7/213
Grade 11 57.3% 24.3% 11.8% 6.3% 0.3%
Grade 12 50.2% 27.9% 14.8% 5.5% 1.7%
──────────────────────────────────────────────────────────────────────────────────────────────
Table T-7: How do your parents feel about kids your age smoking cigarettes?
Strongly Mildly Mildly Strongly Don't
Disapprove Disapprove Neither Approve Approve Know
All 69.6% 15.7% 9.0% 1.4% 0.8% 3.5%
Grade 7 80.0% 8.2% 4.3% 0.2% 1.4% 5.9%
Grade 8 77.4% 9.5% 5.3% 1.8% 1.0% 5.0%
Grade 9 70.3% 15.9% 10.1% 1.7% * % 1.9%
Grade 10 69.2% 18.1% 8.8% 1.3% 1.3% 1.3%
Grade 11 60.9% 22.3% 10.9% 1.3% 0.8% 3.9%
Grade 12 52.5% 24.9% 17.8% 1.9% * % 2.9%

8/14/2019 WILLIAMSON COUNTY - Round Rock ISD - 1998 Texas School Survey of Drug and Alcohol Use
http://slidepdf.com/reader/full/williamson-county-round-rock-isd-1998-texas-school-survey-of-drug-and-alcohol 8/213

8/14/2019 WILLIAMSON COUNTY - Round Rock ISD - 1998 Texas School Survey of Drug and Alcohol Use
http://slidepdf.com/reader/full/williamson-county-round-rock-isd-1998-texas-school-survey-of-drug-and-alcohol 9/213
Round Rock
Spring 1998
──────────────────────────────────────────────────────────────────────────────────────────────
Table A-1: How recently, if ever, have you used...
Past School Ever Never
Month Year Used Used
─────────────────────────────────────────────────────────────────────────────────────
Any alcohol product All 36.7% 51.1% 69.7% 30.3%
Grade 7 19.1% 28.1% 50.1% 49.9%
Grade 8 28.7% 38.5% 57.8% 42.2%
Grade 9 38.4% 55.3% 73.7% 26.3%
Grade 10 42.2% 59.7% 77.7% 22.3%
Grade 11 46.3% 65.8% 83.5% 16.5%
Grade 12 54.1% 69.0% 84.1% 15.9%
─────────────────────────────────────────────────────────────────────────────────────
Beer All 27.1% 38.8% 55.8% 44.2%Grade 7 10.3% 16.7% 34.3% 65.7%
Grade 8 19.9% 28.5% 45.0% 55.0%
Grade 9 27.6% 39.5% 58.6% 41.4%
Grade 10 32.6% 48.0% 63.0% 37.0%
Grade 11 35.4% 51.0% 70.3% 29.7%
Grade 12 45.3% 59.4% 73.5% 26.5%
─────────────────────────────────────────────────────────────────────────────────────
Wine coolers All 21.7% 36.8% 54.7% 45.3%
Grade 7 11.7% 18.1% 33.0% 67.0%
Grade 8 16.9% 27.2% 44.4% 55.6%
Grade 9 21.7% 37.6% 56.9% 43.1%
Grade 10 25.9% 45.0% 62.0% 38.0%
Grade 11 24.9% 48.4% 68.3% 31.7%
Grade 12 34.2% 53.5% 73.6% 26.4%
─────────────────────────────────────────────────────────────────────────────────────
Wine All 18.4% 34.8% 55.5% 44.5%
Grade 7 9.2% 17.0% 33.7% 66.3%
Grade 8 15.7% 27.0% 44.8% 55.2%
Grade 9 21.5% 40.7% 61.6% 38.4%
Grade 10 21.1% 40.8% 63.4% 36.6%
Grade 11 21.3% 40.9% 66.4% 33.6%
Grade 12 24.3% 48.1% 71.0% 29.0%
─────────────────────────────────────────────────────────────────────────────────────Liquor All 25.4% 38.9% 51.9% 48.1%

8/14/2019 WILLIAMSON COUNTY - Round Rock ISD - 1998 Texas School Survey of Drug and Alcohol Use
http://slidepdf.com/reader/full/williamson-county-round-rock-isd-1998-texas-school-survey-of-drug-and-alcohol 10/213
Grade 7 10.7% 16.2% 25.7% 74.3%
Grade 8 18.2% 26.7% 39.2% 60.8%
Grade 9 25.4% 43.6% 56.0% 44.0%
Grade 10 28.3% 45.0% 58.5% 41.5%
Grade 11 35.2% 52.8% 68.4% 31.6%
Grade 12 42.2% 57.8% 74.2% 25.8%
──────────────────────────────────────────────────────────────────────────────────────────────
Table A-2: How often do you normally use...
Any alcohol product?
Several Several About About Less Than
Never Every Times Times Once a Once a Once a
Used Day a Week a Month Month Year Year
All 34.1% 0.8% 5.3% 16.0% 18.9% 14.9% 10.0%
Grade 7 58.2% 1.1% 2.5% 5.2% 12.1% 11.0% 10.0%
Grade 8 43.7% 0.5% 6.3% 12.1% 14.4% 12.7% 10.3%
Grade 9 30.0% 0.6% 4.1% 17.9% 20.5% 15.5% 11.4%Grade 10 25.4% 1.3% 6.1% 16.8% 23.6% 17.7% 9.0%
Grade 11 19.3% 0.5% 6.9% 21.7% 23.5% 18.3% 9.8%
Grade 12 19.4% 0.9% 7.3% 27.2% 21.0% 15.1% 9.0%

8/14/2019 WILLIAMSON COUNTY - Round Rock ISD - 1998 Texas School Survey of Drug and Alcohol Use
http://slidepdf.com/reader/full/williamson-county-round-rock-isd-1998-texas-school-survey-of-drug-and-alcohol 11/213
Round Rock
Spring 1998
──────────────────────────────────────────────────────────────────────────────────────────────
Beer?
Several Several About About Less Than
Never Every Times Times Once a Once a Once a
Used Day a Week a Month Month Year Year
All 43.9% 0.5% 4.4% 13.0% 16.2% 12.2% 9.9%
Grade 7 68.6% 0.6% 1.8% 4.1% 7.8% 7.9% 9.2%
Grade 8 53.7% 0.2% 4.1% 9.5% 13.9% 10.2% 8.4%
Grade 9 40.7% 0.4% 2.9% 12.2% 19.1% 11.8% 12.9%
Grade 10 36.5% 0.2% 6.0% 14.3% 19.8% 14.7% 8.5%
Grade 11 28.8% 0.5% 5.7% 18.9% 18.6% 17.8% 9.7%
Grade 12 25.8% 1.0% 7.5% 23.6% 19.7% 12.2% 10.2%
Wine coolers?
Several Several About About Less Than
Never Every Times Times Once a Once a Once a
Used Day a Week a Month Month Year Year
All 44.3% 0.3% 2.3% 9.9% 18.2% 15.0% 9.9%
Grade 7 68.4% 0.6% 1.3% 3.9% 10.4% 8.7% 6.7%
Grade 8 53.8% * % 3.0% 8.2% 12.3% 13.1% 9.6%
Grade 9 42.0% * % 2.0% 11.8% 17.7% 15.9% 10.7%
Grade 10 38.7% 0.9% 3.2% 9.6% 22.6% 16.2% 8.9%
Grade 11 29.6% 0.3% 1.9% 11.6% 24.0% 19.1% 13.5%
Grade 12 24.4% * % 2.0% 16.7% 26.4% 19.2% 11.3%
Wine?
Several Several About About Less Than
Never Every Times Times Once a Once a Once a
Used Day a Week a Month Month Year Year
All 45.0% 0.3% 1.9% 6.9% 14.8% 20.2% 10.8%
Grade 7 69.1% 0.4% 1.1% 2.2% 8.7% 10.4% 8.1%
Grade 8 54.0% * % 2.2% 5.5% 13.6% 14.3% 10.3%Grade 9 38.1% 0.5% 1.6% 8.9% 17.6% 22.4% 11.0%

8/14/2019 WILLIAMSON COUNTY - Round Rock ISD - 1998 Texas School Survey of Drug and Alcohol Use
http://slidepdf.com/reader/full/williamson-county-round-rock-isd-1998-texas-school-survey-of-drug-and-alcohol 12/213
Grade 10 38.2% 0.7% 2.7% 6.8% 15.7% 25.2% 10.7%
Grade 11 33.4% 0.3% 2.2% 9.0% 15.6% 25.2% 14.2%
Grade 12 29.8% 0.2% 1.2% 10.7% 18.6% 27.6% 11.9%
Liquor?
Several Several About About Less Than
Never Every Times Times Once a Once a Once a
Used Day a Week a Month Month Year Year
All 48.6% 0.3% 3.0% 11.4% 16.2% 12.8% 7.6%
Grade 7 77.7% 0.6% 1.7% 2.5% 6.2% 6.3% 5.0%
Grade 8 59.1% 0.5% 2.8% 10.0% 11.1% 9.5% 7.0%
Grade 9 44.2% * % 3.0% 13.0% 16.9% 14.1% 8.8%
Grade 10 41.6% 0.7% 3.9% 12.2% 19.2% 14.3% 8.1%
Grade 11 32.1% * % 3.7% 14.3% 22.6% 18.9% 8.3%
Grade 12 26.5% * % 3.0% 19.3% 26.0% 16.3% 8.9%

8/14/2019 WILLIAMSON COUNTY - Round Rock ISD - 1998 Texas School Survey of Drug and Alcohol Use
http://slidepdf.com/reader/full/williamson-county-round-rock-isd-1998-texas-school-survey-of-drug-and-alcohol 13/213
Round Rock
Spring 1998
──────────────────────────────────────────────────────────────────────────────────────────────
Table A-3: When you drink the following alcoholic beverages, how many drinks do you usually
have at one time, on average?
Beer
Never Ever 5 or More 1 to 4 Less Than 1
All 44.5% 55.5% 14.1% 28.6% 12.8%
Grade 7 64.7% 35.3% 3.1% 17.8% 14.3%
Grade 8 52.1% 47.9% 10.7% 22.9% 14.3%
Grade 9 41.5% 58.5% 9.6% 35.0% 13.9%
Grade 10 37.6% 62.4% 18.6% 33.3% 10.5%
Grade 11 33.1% 66.9% 24.0% 31.3% 11.7%
Grade 12 29.9% 70.1% 25.4% 33.5% 11.2%
Wine Coolers
Never Ever 5 or More 1 to 4 Less Than 1
All 44.1% 55.9% 11.4% 35.3% 9.3%
Grade 7 66.2% 33.8% 4.5% 20.1% 9.2%
Grade 8 50.5% 49.5% 11.2% 27.3% 11.0%
Grade 9 41.3% 58.7% 10.5% 38.4% 9.8%
Grade 10 39.2% 60.8% 14.9% 38.3% 7.6%
Grade 11 30.6% 69.4% 17.2% 43.0% 9.1%
Grade 12 28.0% 72.0% 11.8% 51.7% 8.5%
Wine
Never Ever 5 or More 1 to 4 Less Than 1
All 45.0% 55.0% 5.6% 33.1% 16.3%
Grade 7 64.6% 35.4% 3.2% 16.3% 15.8%
Grade 8 52.1% 47.9% 5.5% 28.3% 14.1%
Grade 9 38.7% 61.3% 7.7% 37.6% 16.0%
Grade 10 39.2% 60.8% 6.2% 38.7% 15.9%
Grade 11 37.1% 62.9% 5.5% 39.5% 17.9%Grade 12 32.6% 67.4% 5.1% 43.2% 19.1%

8/14/2019 WILLIAMSON COUNTY - Round Rock ISD - 1998 Texas School Survey of Drug and Alcohol Use
http://slidepdf.com/reader/full/williamson-county-round-rock-isd-1998-texas-school-survey-of-drug-and-alcohol 14/213
Liquor
Never Ever 5 or More 1 to 4 Less Than 1
All 48.2% 51.8% 12.4% 29.4% 10.0%
Grade 7 75.2% 24.8% 3.8% 12.1% 8.9%
Grade 8 58.6% 41.4% 9.7% 20.8% 10.9%
Grade 9 43.1% 56.9% 11.2% 34.6% 11.2%Grade 10 42.6% 57.4% 15.7% 32.7% 9.0%
Grade 11 30.9% 69.1% 19.3% 41.7% 8.2%
Grade 12 28.4% 71.6% 18.7% 41.3% 11.7%
──────────────────────────────────────────────────────────────────────────────────────────────
Table A-4: During the past twelve months, how often have you had five or more drinks at one
time?
Beer
Several Several Less Than
Never Ever Times/Week Times/Month Once/Month
All 66.4% 33.6% 2.5% 16.3% 14.7%
Grade 7 83.2% 16.8% 1.1% 5.8% 9.9%
Grade 8 74.9% 25.1% 1.7% 11.1% 12.3%
Grade 9 67.2% 32.8% 2.2% 16.4% 14.2%
Grade 10 60.6% 39.4% 3.1% 18.7% 17.6%
Grade 11 53.6% 46.4% 3.8% 24.4% 18.2%
Grade 12 49.9% 50.1% 4.5% 27.1% 18.5%

8/14/2019 WILLIAMSON COUNTY - Round Rock ISD - 1998 Texas School Survey of Drug and Alcohol Use
http://slidepdf.com/reader/full/williamson-county-round-rock-isd-1998-texas-school-survey-of-drug-and-alcohol 15/213

8/14/2019 WILLIAMSON COUNTY - Round Rock ISD - 1998 Texas School Survey of Drug and Alcohol Use
http://slidepdf.com/reader/full/williamson-county-round-rock-isd-1998-texas-school-survey-of-drug-and-alcohol 16/213
Table A-5: Average age of first use of:
Grade 7 Grade 8 Grade 9 Grade 10 Grade 11 Grade 12
Alcohol 10.3 10.9 11.5 12.4 13.1 13.6
Beer 10.4 11.0 11.8 12.6 13.3 13.8
Wine Coolers 10.8 11.4 12.1 12.9 13.6 14.2
Wine 10.8 11.3 11.9 12.8 13.3 14.1
Liquor 11.2 11.8 12.7 13.4 14.1 14.8
──────────────────────────────────────────────────────────────────────────────────────────────
Table A-6: If you wanted some, how difficult would it be to get...
Beer?
Never Very Somewhat Somewhat Very
Heard Of Impossible Difficult Difficult Easy Easy
All 2.1% 7.4% 5.0% 12.2% 24.7% 48.7%
Grade 7 4.3% 18.8% 12.0% 16.3% 18.5% 30.1%Grade 8 2.5% 8.4% 7.3% 13.3% 21.1% 47.4%
Grade 9 1.3% 5.1% 3.5% 10.6% 27.5% 52.0%
Grade 10 1.6% 5.2% 2.0% 11.4% 26.5% 53.4%
Grade 11 1.1% 2.1% 1.3% 10.6% 27.7% 57.2%
Grade 12 1.2% 1.7% 1.7% 9.6% 28.5% 57.3%
8/14/2019 WILLIAMSON COUNTY - Round Rock ISD - 1998 Texas School Survey of Drug and Alcohol Use
http://slidepdf.com/reader/full/williamson-county-round-rock-isd-1998-texas-school-survey-of-drug-and-alcohol 17/213
Round Rock
Spring 1998
──────────────────────────────────────────────────────────────────────────────────────────────
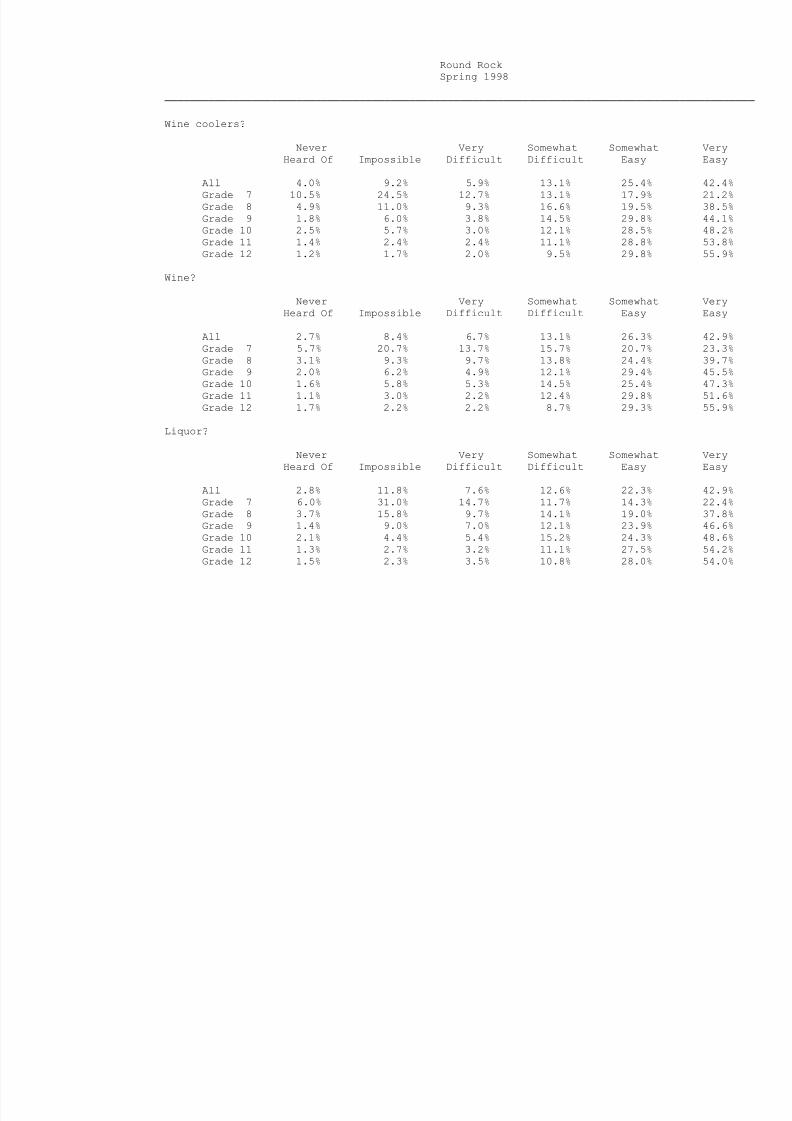
Wine coolers?
Never Very Somewhat Somewhat Very
Heard Of Impossible Difficult Difficult Easy Easy
All 4.0% 9.2% 5.9% 13.1% 25.4% 42.4%
Grade 7 10.5% 24.5% 12.7% 13.1% 17.9% 21.2%
Grade 8 4.9% 11.0% 9.3% 16.6% 19.5% 38.5%
Grade 9 1.8% 6.0% 3.8% 14.5% 29.8% 44.1%
Grade 10 2.5% 5.7% 3.0% 12.1% 28.5% 48.2%
Grade 11 1.4% 2.4% 2.4% 11.1% 28.8% 53.8%
Grade 12 1.2% 1.7% 2.0% 9.5% 29.8% 55.9%
Wine?
Never Very Somewhat Somewhat Very
Heard Of Impossible Difficult Difficult Easy Easy
All 2.7% 8.4% 6.7% 13.1% 26.3% 42.9%
Grade 7 5.7% 20.7% 13.7% 15.7% 20.7% 23.3%
Grade 8 3.1% 9.3% 9.7% 13.8% 24.4% 39.7%
Grade 9 2.0% 6.2% 4.9% 12.1% 29.4% 45.5%
Grade 10 1.6% 5.8% 5.3% 14.5% 25.4% 47.3%
Grade 11 1.1% 3.0% 2.2% 12.4% 29.8% 51.6%
Grade 12 1.7% 2.2% 2.2% 8.7% 29.3% 55.9%
Liquor?
Never Very Somewhat Somewhat Very
Heard Of Impossible Difficult Difficult Easy Easy
All 2.8% 11.8% 7.6% 12.6% 22.3% 42.9%
Grade 7 6.0% 31.0% 14.7% 11.7% 14.3% 22.4%
Grade 8 3.7% 15.8% 9.7% 14.1% 19.0% 37.8%
Grade 9 1.4% 9.0% 7.0% 12.1% 23.9% 46.6%
Grade 10 2.1% 4.4% 5.4% 15.2% 24.3% 48.6%
Grade 11 1.3% 2.7% 3.2% 11.1% 27.5% 54.2%
Grade 12 1.5% 2.3% 3.5% 10.8% 28.0% 54.0%

8/14/2019 WILLIAMSON COUNTY - Round Rock ISD - 1998 Texas School Survey of Drug and Alcohol Use
http://slidepdf.com/reader/full/williamson-county-round-rock-isd-1998-texas-school-survey-of-drug-and-alcohol 18/213
──────────────────────────────────────────────────────────────────────────────────────────────
Table A-7: Since school began in the fall, on how many days (if any) have you...
Attended class while drunk on alcohol?
None 1-3 Days 4-9 Days 10+ Days
All 90.8% 7.0% 1.2% 1.0%
Grade 7 94.2% 3.5% 1.4% 0.9%
Grade 8 90.0% 8.3% 0.7% 1.0%
Grade 9 88.3% 9.1% 1.7% 0.9%
Grade 10 89.7% 7.9% 1.3% 1.1%
Grade 11 90.3% 6.8% 1.6% 1.3%
Grade 12 92.8% 5.7% 0.5% 1.0%
Gotten into trouble with teachers because of your drinking?
None 1-3 Days 4-9 Days 10+ Days
All 98.8% 0.9% 0.3% 0.1%
Grade 7 99.1% 0.9% * % * %
Grade 8 98.2% 1.5% 0.3% * %
Grade 9 98.9% 0.7% 0.2% 0.2%
Grade 10 98.2% 0.9% 0.9% * %
Grade 11 98.7% 0.8% * % 0.5%
Grade 12 99.8% 0.2% * % * %

8/14/2019 WILLIAMSON COUNTY - Round Rock ISD - 1998 Texas School Survey of Drug and Alcohol Use
http://slidepdf.com/reader/full/williamson-county-round-rock-isd-1998-texas-school-survey-of-drug-and-alcohol 19/213
Round Rock
Spring 1998
──────────────────────────────────────────────────────────────────────────────────────────────
Table A-8: School year use of alcohol by absences and conduct problems:
Average days absent due to illness or other reasons:
Alcohol Users: 4.8 days per student
Alcohol Non-users: 4.2 days per student
Average days conduct problems reported:
Alcohol Users: 3.7 days per student
Alcohol Non-users: 0.8 days per student
──────────────────────────────────────────────────────────────────────────────────────────────
Table A-9: During the past twelve months, how many times have you...
Driven a car when you've had a good bit to drink?
None 1-3 Times 4-9 Times 10+ Times
All 87.3% 9.0% 2.2% 1.6%
Grade 9 95.2% 3.5% 1.1% 0.2%
Grade 10 90.8% 7.2% 1.4% 0.7%
Grade 11 81.2% 13.9% 2.4% 2.4%
Grade 12 76.8% 14.8% 4.6% 3.9%
Gotten into trouble with the police because of drinking?
None 1-3 Times 4-9 Times 10+ Times
All 95.1% 4.2% 0.4% 0.3%
Grade 7 98.0% 1.5% 0.4% 0.2%
Grade 8 96.7% 2.6% 0.3% 0.3%
Grade 9 96.5% 2.9% 0.4% 0.2%
Grade 10 93.5% 5.4% 0.7% 0.4%
Grade 11 93.5% 5.7% 0.5% 0.3%
Grade 12 90.8% 9.0% 0.2% * %

8/14/2019 WILLIAMSON COUNTY - Round Rock ISD - 1998 Texas School Survey of Drug and Alcohol Use
http://slidepdf.com/reader/full/williamson-county-round-rock-isd-1998-texas-school-survey-of-drug-and-alcohol 20/213
──────────────────────────────────────────────────────────────────────────────────────────────
Table A-10: About how many of your close friends use...
Any alcohol product?
Never heard
None A Few Some Most All
All 23.6% 23.1% 18.0% 24.2% 11.1%
Grade 7 51.1% 25.7% 10.4% 8.9% 3.8%
Grade 8 33.9% 27.5% 14.9% 14.7% 9.0%
Grade 9 17.2% 23.8% 19.1% 28.7% 11.3%
Grade 10 13.4% 21.7% 22.1% 28.2% 14.5%
Grade 11 9.1% 17.1% 25.4% 35.2% 13.2%
Grade 12 8.0% 19.9% 18.0% 36.3% 17.8%
Beer?
Never heard
None A Few Some Most All
All 28.4% 22.4% 18.2% 21.9% 9.0%
Grade 7 61.0% 21.6% 8.7% 7.1% 1.8%
Grade 8 39.9% 26.5% 13.9% 13.4% 6.2%
Grade 9 23.2% 22.8% 20.0% 25.2% 8.8%
Grade 10 14.6% 23.9% 23.3% 25.7% 12.4%
Grade 11 10.9% 18.7% 26.2% 32.7% 11.4%
Grade 12 10.1% 19.2% 20.0% 33.8% 16.9%

8/14/2019 WILLIAMSON COUNTY - Round Rock ISD - 1998 Texas School Survey of Drug and Alcohol Use
http://slidepdf.com/reader/full/williamson-county-round-rock-isd-1998-texas-school-survey-of-drug-and-alcohol 21/213
Round Rock
Spring 1998
──────────────────────────────────────────────────────────────────────────────────────────────
Wine coolers?
Never heard
None A Few Some Most All
All 35.3% 22.2% 18.9% 16.5% 7.0%
Grade 7 64.9% 18.1% 8.0% 6.4% 2.6%
Grade 8 47.4% 21.7% 14.4% 10.9% 5.7%
Grade 9 30.1% 23.3% 20.2% 19.1% 7.3%
Grade 10 27.1% 22.9% 22.6% 17.7% 9.6%
Grade 11 16.4% 23.7% 26.6% 24.8% 8.4%
Grade 12 15.5% 24.6% 25.5% 24.6% 9.8%
Wine?
Never heard
None A Few Some Most All
All 44.2% 25.1% 15.5% 10.5% 4.7%
Grade 7 70.9% 17.5% 5.8% 4.4% 1.5%
Grade 8 52.6% 24.5% 12.4% 7.0% 3.5%
Grade 9 39.8% 24.9% 17.1% 12.8% 5.4%
Grade 10 37.2% 25.6% 18.8% 11.9% 6.5%
Grade 11 27.4% 31.1% 22.6% 13.7% 5.3%
Grade 12 28.3% 30.2% 19.1% 15.2% 7.2%
Liquor?
Never heard
None A Few Some Most All
All 37.2% 19.6% 16.7% 18.7% 7.8%
Grade 7 70.7% 14.9% 7.4% 4.6% 2.4%
Grade 8 51.9% 19.0% 12.3% 11.1% 5.7%
Grade 9 30.9% 20.0% 18.0% 22.4% 8.7%
Grade 10 24.7% 24.7% 18.2% 22.4% 10.1%
Grade 11 18.1% 19.2% 26.4% 26.4% 9.9%
Grade 12 15.9% 20.0% 21.7% 30.8% 11.6%

8/14/2019 WILLIAMSON COUNTY - Round Rock ISD - 1998 Texas School Survey of Drug and Alcohol Use
http://slidepdf.com/reader/full/williamson-county-round-rock-isd-1998-texas-school-survey-of-drug-and-alcohol 22/213
──────────────────────────────────────────────────────────────────────────────────────────────
Table A-11: During the past twelve months, how many times have you...
Had difficulties of any kind with your friends because of your drinking?
None 1-3 Times 4-9 Times 10+ Times
All 91.7% 6.9% 1.1% 0.3%
Grade 7 95.9% 3.7% 0.2% 0.2%
Grade 8 94.0% 4.5% 0.8% 0.7%
Grade 9 93.3% 5.4% 0.9% 0.4%
Grade 10 87.0% 12.3% 0.7% * %
Grade 11 88.6% 8.8% 2.7% * %
Grade 12 89.7% 7.7% 1.9% 0.7%
Been criticized by someone you were dating because of drinking?
None 1-3 Times 4-9 Times 10+ Times
All 93.4% 5.4% 0.8% 0.4%
Grade 7 97.5% 2.2% * % 0.4%
Grade 8 95.3% 3.4% 1.0% 0.3%
Grade 9 95.2% 4.2% 0.4% 0.2%
Grade 10 91.8% 6.0% 1.6% 0.7%
Grade 11 88.5% 9.6% 1.1% 0.8%
Grade 12 89.6% 9.2% 1.0% 0.2%

8/14/2019 WILLIAMSON COUNTY - Round Rock ISD - 1998 Texas School Survey of Drug and Alcohol Use
http://slidepdf.com/reader/full/williamson-county-round-rock-isd-1998-texas-school-survey-of-drug-and-alcohol 23/213
Round Rock
Spring 1998
──────────────────────────────────────────────────────────────────────────────────────────────
Table A-12: Thinking of parties you attended this school year, how often was alcohol used?
Half Most Of Don't Didn't
Never Seldom the Time the Time Always Know Attend
All 34.4% 12.9% 8.5% 15.0% 19.8% 1.7% 7.7%
Grade 7 62.1% 14.3% 5.1% 4.0% 3.5% 2.1% 8.9%
Grade 8 46.7% 18.1% 8.7% 12.2% 5.6% 1.2% 7.6%
Grade 9 28.8% 14.6% 10.1% 17.8% 17.6% 2.2% 8.8%
Grade 10 22.1% 11.2% 11.2% 18.4% 27.0% 1.8% 8.3%
Grade 11 17.1% 9.0% 9.8% 21.4% 35.1% 1.0% 6.5%
Grade 12 20.3% 7.3% 5.4% 18.9% 41.4% 1.7% 5.0%
──────────────────────────────────────────────────────────────────────────────────────────────
Table A-13: How often, if ever, do you get alcoholic beverages from...
At home
Do Not Most of
Drink Never Seldom the time Always
All 39.5% 21.4% 26.3% 9.5% 3.2%
Grade 7 56.8% 15.7% 17.8% 7.4% 2.3%
Grade 8 46.8% 15.2% 22.9% 11.0% 4.0%
Grade 9 35.4% 20.2% 26.4% 12.2% 5.8%Grade 10 33.4% 22.3% 34.1% 7.3% 2.9%
Grade 11 31.0% 25.6% 33.7% 8.4% 1.3%
Grade 12 28.1% 34.8% 25.2% 10.1% 1.9%
From friends
Do Not Most of
Drink Never Seldom the time Always
All 36.5% 11.8% 15.4% 24.8% 11.5%
Grade 7 57.4% 17.7% 11.4% 9.0% 4.4%
Grade 8 44.1% 16.0% 14.0% 18.8% 7.1%

8/14/2019 WILLIAMSON COUNTY - Round Rock ISD - 1998 Texas School Survey of Drug and Alcohol Use
http://slidepdf.com/reader/full/williamson-county-round-rock-isd-1998-texas-school-survey-of-drug-and-alcohol 24/213
Grade 9 34.8% 9.9% 19.6% 24.7% 11.0%
Grade 10 28.4% 10.6% 16.9% 32.4% 11.7%
Grade 11 24.7% 7.3% 15.8% 35.6% 16.6%
Grade 12 22.0% 6.4% 14.3% 34.3% 23.0%
From a store
Do Not Most of
Drink Never Seldom the time Always
All 38.3% 40.2% 11.3% 7.4% 2.9%
Grade 7 57.5% 38.0% 3.2% 1.3% * %
Grade 8 47.1% 38.4% 7.8% 4.8% 1.9%
Grade 9 36.9% 42.0% 13.5% 5.8% 1.8%
Grade 10 29.6% 41.9% 14.4% 11.2% 3.0%
Grade 11 26.4% 42.3% 16.2% 10.4% 4.7%
Grade 12 24.7% 38.6% 14.9% 13.7% 8.1%
At parties
Do Not Most ofDrink Never Seldom the time Always
All 35.4% 13.3% 13.1% 20.4% 17.9%
Grade 7 52.9% 19.4% 11.8% 9.3% 6.7%
Grade 8 44.2% 15.8% 14.8% 15.0% 10.3%
Grade 9 33.9% 13.5% 14.7% 20.1% 17.8%
Grade 10 26.1% 11.5% 12.5% 25.9% 24.0%
Grade 11 24.9% 8.3% 11.4% 27.7% 27.7%
Grade 12 24.0% 8.0% 12.8% 29.0% 26.3%
8/14/2019 WILLIAMSON COUNTY - Round Rock ISD - 1998 Texas School Survey of Drug and Alcohol Use
http://slidepdf.com/reader/full/williamson-county-round-rock-isd-1998-texas-school-survey-of-drug-and-alcohol 25/213
Round Rock
Spring 1998
──────────────────────────────────────────────────────────────────────────────────────────────
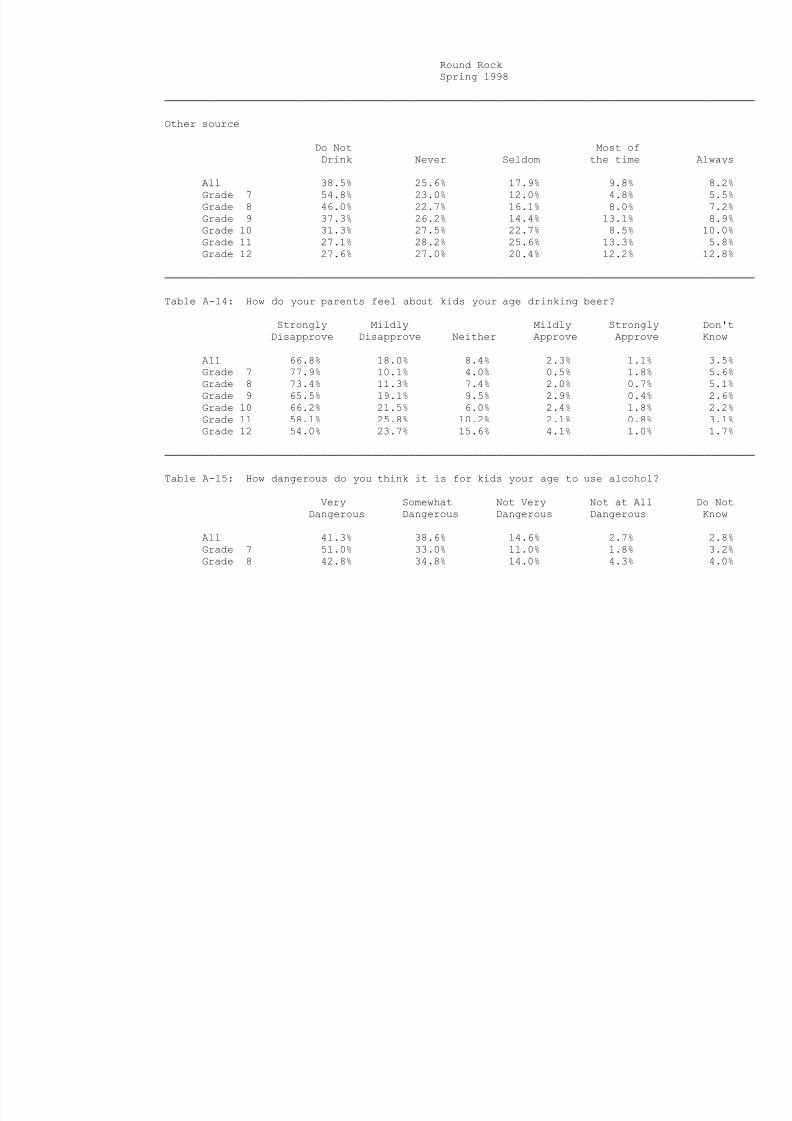
Other source
Do Not Most of
Drink Never Seldom the time Always
All 38.5% 25.6% 17.9% 9.8% 8.2%
Grade 7 54.8% 23.0% 12.0% 4.8% 5.5%
Grade 8 46.0% 22.7% 16.1% 8.0% 7.2%
Grade 9 37.3% 26.2% 14.4% 13.1% 8.9%
Grade 10 31.3% 27.5% 22.7% 8.5% 10.0%
Grade 11 27.1% 28.2% 25.6% 13.3% 5.8%
Grade 12 27.6% 27.0% 20.4% 12.2% 12.8%
──────────────────────────────────────────────────────────────────────────────────────────────
Table A-14: How do your parents feel about kids your age drinking beer?
Strongly Mildly Mildly Strongly Don't
Disapprove Disapprove Neither Approve Approve Know
All 66.8% 18.0% 8.4% 2.3% 1.1% 3.5%
Grade 7 77.9% 10.1% 4.0% 0.5% 1.8% 5.6%
Grade 8 73.4% 11.3% 7.4% 2.0% 0.7% 5.1%
Grade 9 65.5% 19.1% 9.5% 2.9% 0.4% 2.6%
Grade 10 66.2% 21.5% 6.0% 2.4% 1.8% 2.2%
Grade 11 58.1% 25.8% 10.2% 2.1% 0.8% 3.1%Grade 12 54.0% 23.7% 15.6% 4.1% 1.0% 1.7%
──────────────────────────────────────────────────────────────────────────────────────────────
Table A-15: How dangerous do you think it is for kids your age to use alcohol?
Very Somewhat Not Very Not at All Do Not
Dangerous Dangerous Dangerous Dangerous Know
All 41.3% 38.6% 14.6% 2.7% 2.8%
Grade 7 51.0% 33.0% 11.0% 1.8% 3.2%
Grade 8 42.8% 34.8% 14.0% 4.3% 4.0%

8/14/2019 WILLIAMSON COUNTY - Round Rock ISD - 1998 Texas School Survey of Drug and Alcohol Use
http://slidepdf.com/reader/full/williamson-county-round-rock-isd-1998-texas-school-survey-of-drug-and-alcohol 26/213
Grade 9 35.7% 39.8% 18.3% 3.7% 2.6%
Grade 10 41.9% 38.8% 14.9% 2.0% 2.4%
Grade 11 35.4% 46.2% 14.2% 2.4% 1.8%
Grade 12 39.5% 42.2% 14.7% 1.7% 1.9%

8/14/2019 WILLIAMSON COUNTY - Round Rock ISD - 1998 Texas School Survey of Drug and Alcohol Use
http://slidepdf.com/reader/full/williamson-county-round-rock-isd-1998-texas-school-survey-of-drug-and-alcohol 27/213
8/14/2019 WILLIAMSON COUNTY - Round Rock ISD - 1998 Texas School Survey of Drug and Alcohol Use
http://slidepdf.com/reader/full/williamson-county-round-rock-isd-1998-texas-school-survey-of-drug-and-alcohol 28/213
Round Rock
Spring 1998
──────────────────────────────────────────────────────────────────────────────────────────────
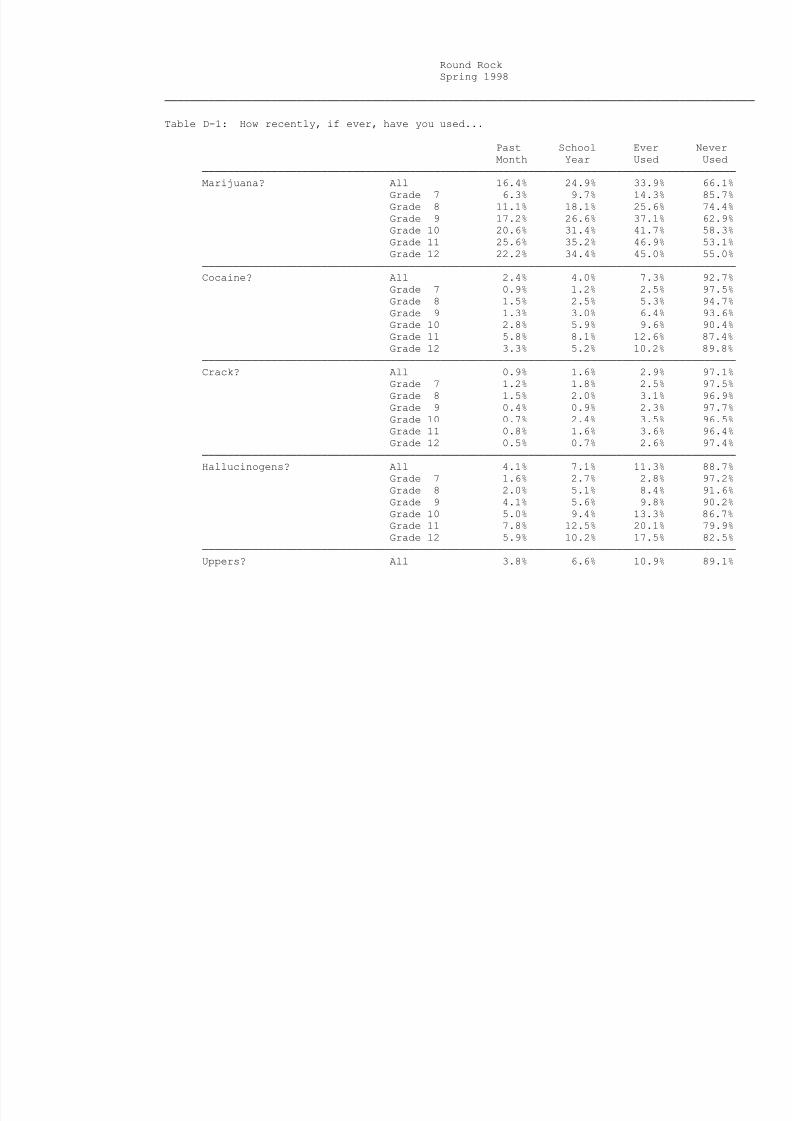
Table D-1: How recently, if ever, have you used...
Past School Ever Never
Month Year Used Used
─────────────────────────────────────────────────────────────────────────────────────
Marijuana? All 16.4% 24.9% 33.9% 66.1%
Grade 7 6.3% 9.7% 14.3% 85.7%
Grade 8 11.1% 18.1% 25.6% 74.4%
Grade 9 17.2% 26.6% 37.1% 62.9%
Grade 10 20.6% 31.4% 41.7% 58.3%
Grade 11 25.6% 35.2% 46.9% 53.1%
Grade 12 22.2% 34.4% 45.0% 55.0%
─────────────────────────────────────────────────────────────────────────────────────
Cocaine? All 2.4% 4.0% 7.3% 92.7%Grade 7 0.9% 1.2% 2.5% 97.5%
Grade 8 1.5% 2.5% 5.3% 94.7%
Grade 9 1.3% 3.0% 6.4% 93.6%
Grade 10 2.8% 5.9% 9.6% 90.4%
Grade 11 5.8% 8.1% 12.6% 87.4%
Grade 12 3.3% 5.2% 10.2% 89.8%
─────────────────────────────────────────────────────────────────────────────────────
Crack? All 0.9% 1.6% 2.9% 97.1%
Grade 7 1.2% 1.8% 2.5% 97.5%
Grade 8 1.5% 2.0% 3.1% 96.9%
Grade 9 0.4% 0.9% 2.3% 97.7%
Grade 10 0.7% 2.4% 3.5% 96.5%Grade 11 0.8% 1.6% 3.6% 96.4%
Grade 12 0.5% 0.7% 2.6% 97.4%
─────────────────────────────────────────────────────────────────────────────────────
Hallucinogens? All 4.1% 7.1% 11.3% 88.7%
Grade 7 1.6% 2.7% 2.8% 97.2%
Grade 8 2.0% 5.1% 8.4% 91.6%
Grade 9 4.1% 5.6% 9.8% 90.2%
Grade 10 5.0% 9.4% 13.3% 86.7%
Grade 11 7.8% 12.5% 20.1% 79.9%
Grade 12 5.9% 10.2% 17.5% 82.5%
─────────────────────────────────────────────────────────────────────────────────────
Uppers? All 3.8% 6.6% 10.9% 89.1%

8/14/2019 WILLIAMSON COUNTY - Round Rock ISD - 1998 Texas School Survey of Drug and Alcohol Use
http://slidepdf.com/reader/full/williamson-county-round-rock-isd-1998-texas-school-survey-of-drug-and-alcohol 29/213
Grade 7 1.5% 2.2% 3.3% 96.7%
Grade 8 3.2% 5.1% 7.4% 92.6%
Grade 9 4.4% 8.1% 13.1% 86.9%
Grade 10 4.4% 9.2% 15.1% 84.9%
Grade 11 6.3% 8.7% 15.8% 84.2%
Grade 12 3.8% 6.9% 12.0% 88.0%
─────────────────────────────────────────────────────────────────────────────────────
Downers? All 2.7% 5.1% 8.1% 91.9%
Grade 7 1.1% 2.0% 2.2% 97.8%
Grade 8 1.5% 3.7% 5.7% 94.3%
Grade 9 3.5% 5.9% 10.3% 89.7%
Grade 10 2.9% 7.1% 10.6% 89.4%
Grade 11 4.5% 6.7% 11.8% 88.2%
Grade 12 3.4% 5.8% 9.5% 90.5%
─────────────────────────────────────────────────────────────────────────────────────
Rohypnol? All 2.3% 3.3% 6.4% 93.6%
Grade 7 1.6% 1.6% 2.7% 97.3%
Grade 8 2.4% 3.9% 6.1% 93.9%
Grade 9 2.8% 3.9% 5.6% 94.4%
Grade 10 2.4% 4.0% 7.7% 92.3%
Grade 11 2.6% 3.7% 9.2% 90.8%Grade 12 1.9% 3.1% 8.6% 91.4%
─────────────────────────────────────────────────────────────────────────────────────
Steroids? All 0.7% 1.2% 2.3% 97.7%
Grade 7 1.1% 1.6% 2.9% 97.1%
Grade 8 0.7% 1.0% 2.5% 97.5%
Grade 9 0.2% 0.4% 1.3% 98.7%
Grade 10 0.2% 0.4% 1.6% 98.4%
Grade 11 1.6% 3.4% 3.7% 96.3%
Grade 12 0.5% 0.7% 1.9% 98.1%

8/14/2019 WILLIAMSON COUNTY - Round Rock ISD - 1998 Texas School Survey of Drug and Alcohol Use
http://slidepdf.com/reader/full/williamson-county-round-rock-isd-1998-texas-school-survey-of-drug-and-alcohol 30/213
Round Rock
Spring 1998
──────────────────────────────────────────────────────────────────────────────────────────────
Past School Ever Never
Month Year Used Used
─────────────────────────────────────────────────────────────────────────────────────
Ecstasy? All 2.1% 3.4% 5.8% 94.2%
Grade 7 0.4% 0.7% 1.1% 98.9%
Grade 8 1.0% 1.9% 3.3% 96.7%
Grade 9 1.7% 2.6% 5.0% 95.0%
Grade 10 2.2% 4.0% 6.9% 93.1%
Grade 11 4.8% 7.1% 11.1% 88.9%
Grade 12 3.4% 5.8% 9.8% 90.2%
─────────────────────────────────────────────────────────────────────────────────────
Heroin? All 0.5% 0.7% 1.9% 98.1%
Grade 7 0.5% 0.7% 1.8% 98.2%
Grade 8 0.7% 0.8% 1.3% 98.7%Grade 9 0.4% 0.7% 2.2% 97.8%
Grade 10 0.4% 0.4% 2.8% 97.2%
Grade 11 0.5% 1.1% 1.3% 98.7%
Grade 12 0.2% 0.2% 1.4% 98.6%
──────────────────────────────────────────────────────────────────────────────────────────────
Table D-2: How often do you normally use...
Marijuana?
Several Several About About Less ThanNever Every Times Times Once a Once a Once a
Used Day a Week a Month Month Year Year
All 67.3% 2.8% 4.6% 6.4% 7.6% 5.6% 5.9%
Grade 7 85.6% 1.5% 2.5% 2.5% 2.9% 2.5% 2.5%
Grade 8 75.0% 1.4% 4.1% 5.9% 5.9% 3.4% 4.3%
Grade 9 64.6% 2.6% 5.2% 7.1% 6.7% 6.9% 6.9%
Grade 10 59.8% 3.2% 6.2% 7.2% 10.4% 6.9% 6.2%
Grade 11 53.8% 5.3% 5.8% 8.4% 10.3% 6.7% 9.7%
Grade 12 59.0% 3.3% 3.6% 8.1% 11.2% 7.9% 6.9%
Cocaine?

8/14/2019 WILLIAMSON COUNTY - Round Rock ISD - 1998 Texas School Survey of Drug and Alcohol Use
http://slidepdf.com/reader/full/williamson-county-round-rock-isd-1998-texas-school-survey-of-drug-and-alcohol 31/213
Several Several About About Less Than
Never Every Times Times Once a Once a Once a
Used Day a Week a Month Month Year Year
All 92.9% 0.1% 0.4% 0.7% 1.3% 2.1% 2.5%
Grade 7 97.3% 0.2% 0.2% 0.6% 0.4% 0.6% 0.8%
Grade 8 95.5% * % 0.2% 0.5% 0.9% 1.3% 1.6%
Grade 9 93.7% * % 0.5% 0.2% 1.2% 1.6% 2.8%
Grade 10 91.1% * % 0.5% 1.2% 1.4% 4.0% 1.9%
Grade 11 87.4% * % 0.6% 1.1% 3.4% 3.4% 4.0%
Grade 12 90.2% 0.3% 0.5% 1.0% 0.8% 2.3% 4.9%
Crack?
Several Several About About Less Than
Never Every Times Times Once a Once a Once a
Used Day a Week a Month Month Year Year
All 97.5% 0.1% 0.1% 0.2% 0.3% 0.8% 1.1%
Grade 7 98.8% 0.2% 0.2% * % 0.2% 0.6% * %Grade 8 97.2% 0.2% 0.2% 0.4% 0.8% 0.9% 0.4%
Grade 9 98.0% * % * % 0.2% 0.2% 0.5% 1.0%
Grade 10 96.7% * % 0.2% 0.2% 0.2% 1.4% 1.2%
Grade 11 96.4% * % * % * % 0.3% 0.9% 2.4%
Grade 12 97.4% * % * % * % * % 0.5% 2.1%

8/14/2019 WILLIAMSON COUNTY - Round Rock ISD - 1998 Texas School Survey of Drug and Alcohol Use
http://slidepdf.com/reader/full/williamson-county-round-rock-isd-1998-texas-school-survey-of-drug-and-alcohol 32/213
Round Rock
Spring 1998
──────────────────────────────────────────────────────────────────────────────────────────────
Hallucinogens?
Several Several About About Less Than
Never Every Times Times Once a Once a Once a
Used Day a Week a Month Month Year Year
All 89.2% 0.1% 0.2% 1.7% 2.8% 2.9% 3.1%
Grade 7 97.6% * % 0.4% 0.4% 0.6% 0.2% 0.8%
Grade 8 91.9% 0.2% * % 1.1% 2.7% 2.2% 2.0%
Grade 9 90.4% * % 0.2% 1.4% 1.4% 3.3% 3.3%
Grade 10 86.6% 0.2% 0.2% 3.1% 4.0% 3.5% 2.3%
Grade 11 81.2% * % 0.6% 3.2% 5.3% 3.8% 5.9%
Grade 12 83.3% * % * % 1.8% 3.9% 5.2% 5.7%
Uppers?
Several Several About About Less Than
Never Every Times Times Once a Once a Once a
Used Day a Week a Month Month Year Year
All 89.3% 0.5% 0.7% 1.3% 2.5% 2.7% 3.0%
Grade 7 97.2% 0.2% 0.2% 0.6% 1.0% 0.4% 0.4%
Grade 8 92.1% 0.7% 0.7% 0.6% 1.7% 2.0% 2.2%
Grade 9 87.4% * % 1.4% 1.7% 2.9% 3.3% 3.3%
Grade 10 85.3% 1.4% 0.7% 1.4% 4.0% 2.6% 4.7%
Grade 11 82.8% 0.3% 0.6% 2.4% 4.2% 4.8% 4.8%Grade 12 89.1% * % 0.5% 1.9% 1.3% 4.0% 3.2%
Downers?
Several Several About About Less Than
Never Every Times Times Once a Once a Once a
Used Day a Week a Month Month Year Year
All 91.6% 0.2% 0.5% 1.0% 2.3% 2.1% 2.3%
Grade 7 97.8% 0.2% 0.2% 0.6% 1.0% * % 0.2%
Grade 8 92.7% 0.2% 0.4% 0.2% 1.3% 2.4% 2.8%
Grade 9 90.9% * % 0.7% 1.0% 2.9% 2.2% 2.2%

8/14/2019 WILLIAMSON COUNTY - Round Rock ISD - 1998 Texas School Survey of Drug and Alcohol Use
http://slidepdf.com/reader/full/williamson-county-round-rock-isd-1998-texas-school-survey-of-drug-and-alcohol 33/213
Grade 10 89.9% 0.5% 0.7% 1.7% 3.9% 1.0% 2.4%
Grade 11 85.6% 0.3% * % 1.8% 3.3% 4.8% 4.2%
Grade 12 90.7% * % 0.8% 1.3% 1.3% 2.9% 2.9%
Rohypnol?
Several Several About About Less Than
Never Every Times Times Once a Once a Once a
Used Day a Week a Month Month Year Year
All 93.5% 0.0% 0.4% 0.6% 1.4% 1.7% 2.3%
Grade 7 96.8% 0.2% 0.6% 0.2% 0.4% 1.2% 0.6%
Grade 8 93.7% * % 0.5% 0.5% 1.6% 1.3% 2.3%
Grade 9 93.8% * % 0.5% 1.2% 1.2% 1.4% 1.9%
Grade 10 92.7% * % 0.5% 0.9% 2.1% 1.9% 1.9%
Grade 11 90.7% * % * % 0.3% 1.5% 3.4% 4.0%
Grade 12 92.1% * % * % 0.3% 1.3% 1.8% 4.5%
Steroids?
Several Several About About Less ThanNever Every Times Times Once a Once a Once a
Used Day a Week a Month Month Year Year
All 98.0% 0.1% 0.3% 0.2% 0.3% 0.3% 0.8%
Grade 7 97.9% 0.6% 0.2% * % * % 0.6% 0.6%
Grade 8 97.6% * % 0.4% * % 0.4% 0.9% 0.7%
Grade 9 98.5% * % 0.2% 0.2% 0.2% 0.2% 0.5%
Grade 10 98.8% * % * % * % * % * % 1.2%
Grade 11 96.3% * % 0.9% 0.9% 1.2% * % 0.6%
Grade 12 98.4% 0.3% * % * % * % * % 1.3%

8/14/2019 WILLIAMSON COUNTY - Round Rock ISD - 1998 Texas School Survey of Drug and Alcohol Use
http://slidepdf.com/reader/full/williamson-county-round-rock-isd-1998-texas-school-survey-of-drug-and-alcohol 34/213
Round Rock
Spring 1998
──────────────────────────────────────────────────────────────────────────────────────────────
Ecstasy?
Several Several About About Less Than
Never Every Times Times Once a Once a Once a
Used Day a Week a Month Month Year Year
All 94.0% 0.0% 0.2% 0.6% 1.3% 1.9% 1.9%
Grade 7 98.8% * % 0.4% * % * % 0.2% 0.6%
Grade 8 96.8% * % 0.2% 0.6% 0.7% 0.7% 0.9%
Grade 9 94.2% * % * % 1.2% 0.7% 2.2% 1.7%
Grade 10 93.7% * % 0.5% 0.5% 1.5% 1.9% 1.9%
Grade 11 87.8% 0.3% 0.3% 0.6% 4.1% 3.4% 3.4%
Grade 12 90.1% * % * % 0.8% 1.8% 3.9% 3.4%
Heroin?
Several Several About About Less Than
Never Every Times Times Once a Once a Once a
Used Day a Week a Month Month Year Year
All 98.1% 0.1% 0.2% 0.3% 0.2% 0.2% 0.9%
Grade 7 98.1% 0.2% 0.8% 0.6% 0.2% * % * %
Grade 8 98.1% 0.2% * % * % 0.6% 0.2% 0.9%
Grade 9 98.0% * % * % 0.3% 0.3% 0.3% 1.3%
Grade 10 97.5% * % * % 0.5% 0.3% 0.5% 1.3%
Grade 11 98.7% * % 0.3% 0.3% * % 0.3% 0.3%Grade 12 98.6% * % * % * % * % * % 1.4%
──────────────────────────────────────────────────────────────────────────────────────────────
Table D-3: Average age of first use of:
Grade 7 Grade 8 Grade 9 Grade 10 Grade 11 Grade 12
Marijuana 11.7 12.2 12.9 13.6 14.4 14.9
Cocaine 12.0 12.8 13.8 14.4 15.6 16.1
Crack * 12.4 13.7 14.2 15.3 *
Hallucinogens 12.1 12.6 13.6 14.3 14.9 15.6

8/14/2019 WILLIAMSON COUNTY - Round Rock ISD - 1998 Texas School Survey of Drug and Alcohol Use
http://slidepdf.com/reader/full/williamson-county-round-rock-isd-1998-texas-school-survey-of-drug-and-alcohol 35/213
Uppers 11.6 12.4 13.5 13.9 14.7 15.4
Downers 11.3 12.8 13.3 13.8 14.6 15.2
Rohypnol 11.7 12.6 13.5 13.9 15.2 15.7
Steroids * 12.3 * * 14.5 *
Ecstasy * 12.4 13.6 14.3 15.3 16.3
Heroin * * * 14.2 * *
──────────────────────────────────────────────────────────────────────────────────────────────
Table D-4: Age of first use of marijuana by family situation:
Two parent family
Never 9 or Under 10-11 12-13 14-15 16-17 18 or Over
All 71.6% 0.5% 2.8% 9.0% 11.3% 4.6% 0.2%
Grade 7 89.7% 0.5% 3.3% 6.2% 0.3% * % * %
Grade 8 80.1% 0.5% 3.8% 12.0% 3.6% * % * %
Grade 9 68.3% 0.3% 3.5% 14.6% 13.3% * % * %
Grade 10 66.8% 0.6% 3.2% 8.0% 18.5% 2.9% * %
Grade 11 60.3% 0.4% 1.9% 6.1% 17.9% 13.4% * %Grade 12 58.4% 0.4% 0.4% 4.6% 17.4% 17.4% 1.4%

8/14/2019 WILLIAMSON COUNTY - Round Rock ISD - 1998 Texas School Survey of Drug and Alcohol Use
http://slidepdf.com/reader/full/williamson-county-round-rock-isd-1998-texas-school-survey-of-drug-and-alcohol 36/213
Round Rock
Spring 1998
──────────────────────────────────────────────────────────────────────────────────────────────
Other family situation
Never 9 or Under 10-11 12-13 14-15 16-17 18 or Over
All 53.6% 2.4% 4.9% 18.8% 15.5% 4.6% 0.1%
Grade 7 77.5% 2.1% 5.9% 13.9% 0.5% * % * %
Grade 8 61.3% 3.7% 8.4% 19.9% 6.8% * % * %
Grade 9 53.3% 1.5% 5.2% 25.2% 14.1% 0.7% * %
Grade 10 40.0% 2.9% 2.9% 22.9% 28.6% 2.9% * %
Grade 11 34.2% 2.6% 3.4% 18.8% 23.9% 17.1% * %
Grade 12 44.0% 1.6% 2.4% 9.6% 28.0% 13.6% 0.8%
──────────────────────────────────────────────────────────────────────────────────────────────
Table D-5: If you wanted some, how difficult would it be to get...
Marijuana?
Never Very Somewhat Somewhat Very
Heard Of Impossible Difficult Difficult Easy Easy
All 3.8% 20.3% 10.8% 12.7% 19.8% 32.5%
Grade 7 6.2% 48.5% 13.8% 8.6% 9.5% 13.4%
Grade 8 5.3% 26.5% 14.7% 14.2% 16.6% 22.6%
Grade 9 2.0% 16.0% 8.9% 13.3% 22.0% 37.8%Grade 10 3.9% 10.0% 10.9% 14.5% 22.7% 38.1%
Grade 11 1.6% 7.6% 6.5% 13.5% 26.5% 44.3%
Grade 12 3.6% 5.8% 8.3% 12.4% 24.8% 45.0%
Cocaine?
Never Very Somewhat Somewhat Very
Heard Of Impossible Difficult Difficult Easy Easy
All 6.2% 29.1% 22.2% 20.9% 12.8% 8.9%
Grade 7 9.4% 54.1% 18.8% 8.7% 5.0% 4.1%
Grade 8 7.6% 36.7% 22.0% 17.7% 10.2% 5.7%

8/14/2019 WILLIAMSON COUNTY - Round Rock ISD - 1998 Texas School Survey of Drug and Alcohol Use
http://slidepdf.com/reader/full/williamson-county-round-rock-isd-1998-texas-school-survey-of-drug-and-alcohol 37/213
Grade 9 5.4% 27.1% 21.3% 21.7% 16.1% 8.3%
Grade 10 5.9% 19.8% 23.0% 23.9% 15.7% 11.8%
Grade 11 3.2% 14.6% 23.4% 30.1% 16.5% 12.2%
Grade 12 4.7% 13.3% 26.4% 27.6% 14.3% 13.8%
Crack?
Never Very Somewhat Somewhat Very
Heard Of Impossible Difficult Difficult Easy Easy
All 6.7% 30.2% 23.9% 20.8% 10.4% 8.0%
Grade 7 8.3% 56.1% 17.1% 8.5% 5.5% 4.5%
Grade 8 7.9% 38.2% 22.9% 16.7% 9.0% 5.4%
Grade 9 5.9% 27.4% 22.2% 22.6% 13.6% 8.4%
Grade 10 7.0% 20.9% 26.2% 23.4% 12.8% 9.7%
Grade 11 4.3% 15.7% 28.4% 29.7% 12.2% 9.7%
Grade 12 6.3% 14.5% 30.0% 28.0% 9.8% 11.5%
Hallucinogens?
Never Very Somewhat Somewhat VeryHeard Of Impossible Difficult Difficult Easy Easy
All 16.8% 26.6% 18.1% 16.8% 10.3% 11.3%
Grade 7 34.0% 40.9% 13.4% 4.5% 3.4% 3.9%
Grade 8 25.4% 31.8% 15.2% 14.0% 6.9% 6.7%
Grade 9 11.0% 27.8% 17.4% 18.7% 11.5% 13.7%
Grade 10 9.9% 21.8% 22.5% 18.5% 13.3% 14.0%
Grade 11 5.6% 16.5% 18.9% 28.0% 15.2% 15.7%
Grade 12 11.0% 15.0% 23.3% 20.8% 14.0% 15.9%

8/14/2019 WILLIAMSON COUNTY - Round Rock ISD - 1998 Texas School Survey of Drug and Alcohol Use
http://slidepdf.com/reader/full/williamson-county-round-rock-isd-1998-texas-school-survey-of-drug-and-alcohol 38/213
Round Rock
Spring 1998
──────────────────────────────────────────────────────────────────────────────────────────────
Uppers?
Never Very Somewhat Somewhat Very
Heard Of Impossible Difficult Difficult Easy Easy
All 24.6% 19.6% 15.2% 16.3% 13.0% 11.3%
Grade 7 45.2% 29.3% 12.0% 4.4% 5.1% 4.0%
Grade 8 35.5% 24.6% 13.7% 13.0% 7.8% 5.3%
Grade 9 18.9% 20.0% 14.1% 17.0% 16.6% 13.4%
Grade 10 17.2% 15.2% 18.4% 17.9% 14.9% 16.3%
Grade 11 11.4% 12.8% 15.5% 27.7% 16.8% 15.8%
Grade 12 13.7% 12.0% 18.9% 21.6% 18.6% 15.2%
Downers?
Never Very Somewhat Somewhat Very
Heard Of Impossible Difficult Difficult Easy Easy
All 24.6% 19.8% 14.9% 16.6% 13.4% 10.7%
Grade 7 44.8% 29.7% 12.1% 5.3% 4.8% 3.4%
Grade 8 35.6% 25.5% 13.1% 12.7% 8.2% 4.9%
Grade 9 18.7% 19.4% 13.6% 17.8% 17.8% 12.6%
Grade 10 17.6% 15.9% 18.0% 17.6% 15.7% 15.2%
Grade 11 11.7% 12.8% 15.0% 27.9% 17.3% 15.3%
Grade 12 14.0% 11.7% 19.2% 22.2% 18.2% 14.7%
Rohypnol?
Never Very Somewhat Somewhat Very
Heard Of Impossible Difficult Difficult Easy Easy
All 34.0% 18.3% 14.6% 14.3% 9.6% 9.2%
Grade 7 45.6% 31.1% 9.5% 5.5% 3.6% 4.7%
Grade 8 41.2% 22.6% 13.9% 10.4% 6.0% 6.0%
Grade 9 32.1% 17.6% 15.2% 13.6% 12.0% 9.5%
Grade 10 31.3% 13.0% 16.4% 17.6% 11.0% 10.7%
Grade 11 25.1% 10.5% 15.4% 23.2% 14.0% 11.9%
Grade 12 23.9% 11.1% 18.5% 19.0% 12.8% 14.8%

8/14/2019 WILLIAMSON COUNTY - Round Rock ISD - 1998 Texas School Survey of Drug and Alcohol Use
http://slidepdf.com/reader/full/williamson-county-round-rock-isd-1998-texas-school-survey-of-drug-and-alcohol 39/213
Steroids?
Never Very Somewhat Somewhat Very
Heard Of Impossible Difficult Difficult Easy Easy
All 9.0% 29.7% 21.4% 18.8% 11.8% 9.3%
Grade 7 13.8% 51.5% 17.0% 6.3% 6.1% 5.3%
Grade 8 10.6% 40.0% 19.6% 17.0% 7.6% 5.1%
Grade 9 6.8% 28.2% 21.2% 20.8% 12.9% 10.2%Grade 10 8.0% 19.8% 23.5% 23.2% 14.4% 11.2%
Grade 11 6.3% 15.1% 23.6% 26.3% 15.9% 12.9%
Grade 12 7.5% 15.4% 24.9% 22.1% 16.7% 13.4%
Ecstasy?
Never Very Somewhat Somewhat Very
Heard Of Impossible Difficult Difficult Easy Easy
All 27.3% 21.3% 16.6% 13.8% 10.7% 10.2%
Grade 7 45.5% 32.7% 10.9% 3.3% 3.9% 3.7%Grade 8 36.6% 25.7% 16.5% 11.2% 4.7% 5.3%
Grade 9 25.2% 21.0% 16.1% 15.8% 11.4% 10.5%
Grade 10 20.5% 15.2% 20.2% 17.3% 13.0% 13.9%
Grade 11 16.5% 13.8% 17.0% 21.1% 16.8% 14.9%
Grade 12 12.2% 15.9% 20.5% 16.8% 18.3% 16.3%

8/14/2019 WILLIAMSON COUNTY - Round Rock ISD - 1998 Texas School Survey of Drug and Alcohol Use
http://slidepdf.com/reader/full/williamson-county-round-rock-isd-1998-texas-school-survey-of-drug-and-alcohol 40/213
Round Rock
Spring 1998
──────────────────────────────────────────────────────────────────────────────────────────────
Heroin?
Never Very Somewhat Somewhat VeryHeard Of Impossible Difficult Difficult Easy Easy
All 9.1% 35.8% 24.9% 15.2% 7.7% 7.3%
Grade 7 12.4% 57.3% 14.8% 5.9% 5.0% 4.5%
Grade 8 11.8% 43.6% 22.8% 12.5% 4.6% 4.7%
Grade 9 8.1% 34.7% 23.4% 15.5% 10.1% 8.1%
Grade 10 7.7% 26.9% 27.6% 19.5% 7.9% 10.4%
Grade 11 5.4% 22.6% 35.6% 19.7% 8.9% 7.8%
Grade 12 7.8% 21.8% 29.3% 21.5% 10.8% 8.8%
──────────────────────────────────────────────────────────────────────────────────────────────
Table D-6: Since school began in the fall, on how many days (if any) have you...
Attended class while high from marijuana use?
None 1-3 Days 4-9 Days 10+ Days
All 86.9% 6.4% 2.5% 4.2%
Grade 7 92.6% 4.2% 1.4% 1.8%
Grade 8 88.5% 6.8% 2.9% 1.9%
Grade 9 85.7% 7.0% 3.1% 4.3%
Grade 10 83.1% 6.9% 3.3% 6.7%Grade 11 82.4% 7.7% 2.1% 7.7%
Grade 12 88.3% 6.3% 1.5% 3.9%
Attended class while high from use of some other drug?
None 1-3 Days 4-9 Days 10+ Days
All 92.8% 4.7% 1.3% 1.2%
Grade 7 94.4% 4.2% 0.5% 0.9%
Grade 8 92.4% 4.9% 1.7% 1.0%
Grade 9 91.8% 5.5% 1.5% 1.1%
Grade 10 91.9% 4.7% 2.0% 1.3%
8/14/2019 WILLIAMSON COUNTY - Round Rock ISD - 1998 Texas School Survey of Drug and Alcohol Use
http://slidepdf.com/reader/full/williamson-county-round-rock-isd-1998-texas-school-survey-of-drug-and-alcohol 41/213
Grade 11 90.9% 6.4% 0.8% 1.9%
Grade 12 95.9% 2.2% 1.2% 0.7%
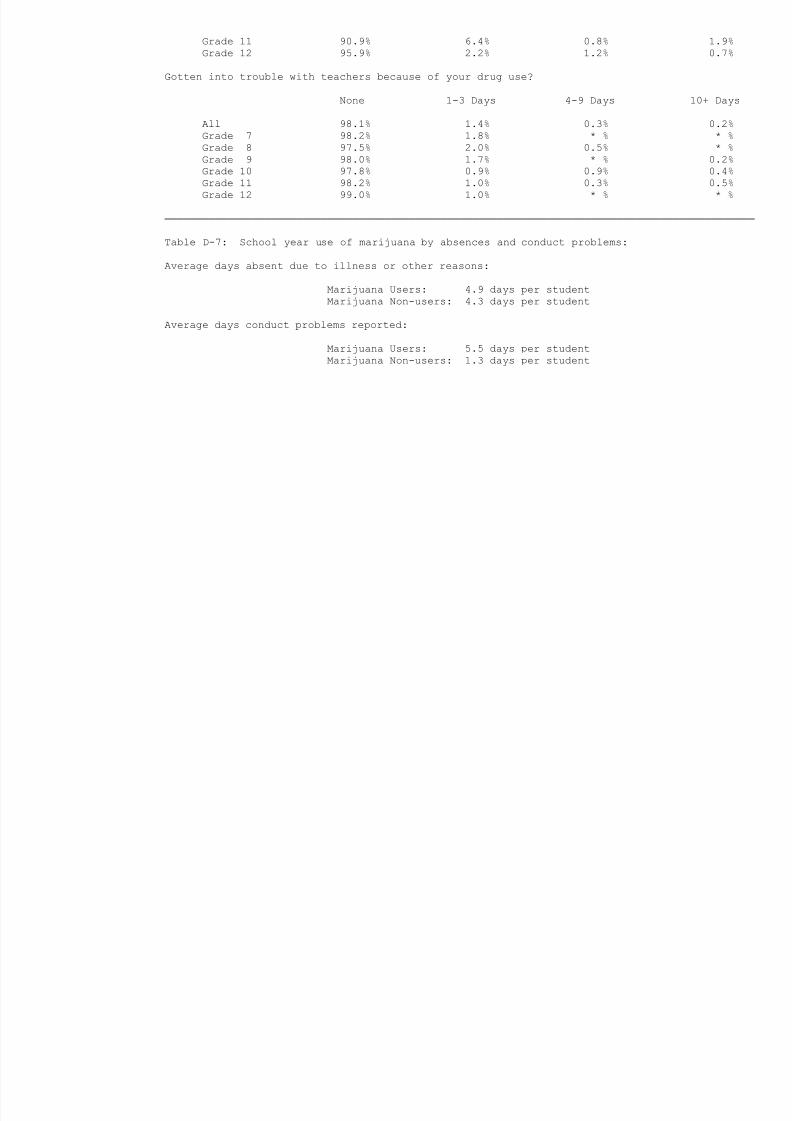
Gotten into trouble with teachers because of your drug use?
None 1-3 Days 4-9 Days 10+ Days
All 98.1% 1.4% 0.3% 0.2%
Grade 7 98.2% 1.8% * % * %
Grade 8 97.5% 2.0% 0.5% * %Grade 9 98.0% 1.7% * % 0.2%
Grade 10 97.8% 0.9% 0.9% 0.4%
Grade 11 98.2% 1.0% 0.3% 0.5%
Grade 12 99.0% 1.0% * % * %
──────────────────────────────────────────────────────────────────────────────────────────────
Table D-7: School year use of marijuana by absences and conduct problems:
Average days absent due to illness or other reasons:
Marijuana Users: 4.9 days per student
Marijuana Non-users: 4.3 days per student
Average days conduct problems reported:
Marijuana Users: 5.5 days per student
Marijuana Non-users: 1.3 days per student

8/14/2019 WILLIAMSON COUNTY - Round Rock ISD - 1998 Texas School Survey of Drug and Alcohol Use
http://slidepdf.com/reader/full/williamson-county-round-rock-isd-1998-texas-school-survey-of-drug-and-alcohol 42/213
Round Rock
Spring 1998
──────────────────────────────────────────────────────────────────────────────────────────────
Table D-8: During the past twelve months, how many times have you...
Driven a car when you've felt high from drugs?
None 1-3 Times 4-9 Times 10+ Times
All 86.9% 7.7% 2.1% 3.3%
Grade 9 93.7% 4.5% 0.9% 0.9%
Grade 10 90.1% 5.3% 1.4% 3.2%
Grade 11 79.6% 11.9% 3.6% 5.0%
Grade 12 79.8% 11.4% 3.3% 5.6%
Gotten into trouble with the police because of drug use?
None 1-3 Times 4-9 Times 10+ Times
All 96.7% 2.4% 0.6% 0.3%
Grade 7 97.6% 1.7% 0.4% 0.4%
Grade 8 96.5% 2.7% 0.7% 0.2%
Grade 9 96.2% 2.5% 0.7% 0.7%
Grade 10 95.2% 3.4% 1.1% 0.2%
Grade 11 97.3% 2.7% * % * %
Grade 12 97.8% 1.5% 0.2% 0.5%
──────────────────────────────────────────────────────────────────────────────────────────────
Table D-9: About how many of your close friends use marijuana?
Never heard
None A Few Some Most All
All 44.7% 19.0% 14.8% 15.5% 6.0%
Grade 7 72.6% 12.4% 5.9% 6.3% 2.7%
Grade 8 52.9% 19.1% 11.1% 11.6% 5.4%
Grade 9 38.6% 18.6% 15.7% 19.0% 8.1%
Grade 10 32.8% 19.6% 20.5% 18.9% 8.1%
Grade 11 28.4% 24.2% 20.6% 20.8% 6.0%
Grade 12 36.5% 22.4% 17.2% 18.4% 5.5%
8/14/2019 WILLIAMSON COUNTY - Round Rock ISD - 1998 Texas School Survey of Drug and Alcohol Use
http://slidepdf.com/reader/full/williamson-county-round-rock-isd-1998-texas-school-survey-of-drug-and-alcohol 43/213
──────────────────────────────────────────────────────────────────────────────────────────────
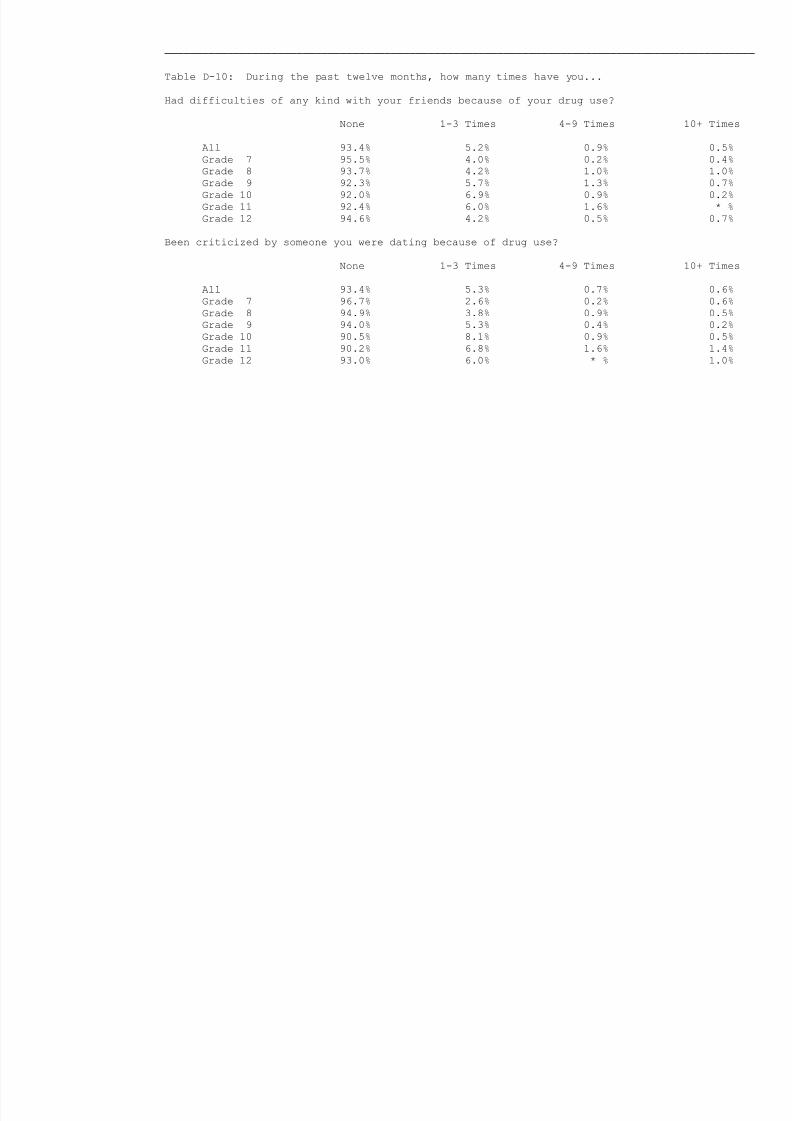
Table D-10: During the past twelve months, how many times have you...
Had difficulties of any kind with your friends because of your drug use?
None 1-3 Times 4-9 Times 10+ Times
All 93.4% 5.2% 0.9% 0.5%Grade 7 95.5% 4.0% 0.2% 0.4%
Grade 8 93.7% 4.2% 1.0% 1.0%
Grade 9 92.3% 5.7% 1.3% 0.7%
Grade 10 92.0% 6.9% 0.9% 0.2%
Grade 11 92.4% 6.0% 1.6% * %
Grade 12 94.6% 4.2% 0.5% 0.7%
Been criticized by someone you were dating because of drug use?
None 1-3 Times 4-9 Times 10+ Times
All 93.4% 5.3% 0.7% 0.6%
Grade 7 96.7% 2.6% 0.2% 0.6%
Grade 8 94.9% 3.8% 0.9% 0.5%
Grade 9 94.0% 5.3% 0.4% 0.2%
Grade 10 90.5% 8.1% 0.9% 0.5%
Grade 11 90.2% 6.8% 1.6% 1.4%
Grade 12 93.0% 6.0% * % 1.0%

8/14/2019 WILLIAMSON COUNTY - Round Rock ISD - 1998 Texas School Survey of Drug and Alcohol Use
http://slidepdf.com/reader/full/williamson-county-round-rock-isd-1998-texas-school-survey-of-drug-and-alcohol 44/213
Round Rock
Spring 1998
──────────────────────────────────────────────────────────────────────────────────────────────
Table D-11: Thinking of parties you attended this school year, how often was marijuana used?
Half Most Of Don't Didn'tNever Seldom the Time the Time Always Know Attend
All 44.9% 13.1% 9.8% 10.6% 11.6% 2.3% 7.7%
Grade 7 69.2% 9.7% 4.2% 3.5% 2.9% 1.7% 8.8%
Grade 8 57.0% 12.7% 7.1% 8.2% 5.8% 1.8% 7.4%
Grade 9 41.4% 12.2% 10.9% 10.9% 12.7% 3.0% 8.8%
Grade 10 34.3% 12.7% 11.6% 15.7% 15.7% 1.7% 8.3%
Grade 11 27.2% 18.0% 14.6% 12.8% 19.3% 1.8% 6.3%
Grade 12 30.8% 15.2% 12.3% 15.2% 17.5% 3.8% 5.2%
──────────────────────────────────────────────────────────────────────────────────────────────
Table D-12: How often, if ever, do you smoke marijuana in...
Joints?
Half the Most of Don't
Never Seldom Time the Time Always Know
All 69.0% 10.1% 8.5% 8.5% 3.0% 0.9%
Grade 7 85.6% 5.0% 3.4% 3.6% 2.2% 0.2%
Grade 8 75.7% 6.3% 6.5% 7.8% 2.7% 0.8%
Grade 9 66.2% 13.2% 9.2% 6.8% 3.5% 1.1%Grade 10 64.2% 11.7% 9.3% 11.2% 2.2% 1.4%
Grade 11 59.6% 10.7% 13.1% 11.6% 4.3% 0.6%
Grade 12 59.4% 14.0% 10.4% 11.2% 3.6% 1.4%
Blunts?
Half the Most of Don't
Never Seldom Time the Time Always Know
All 73.0% 11.3% 7.0% 5.3% 2.7% 0.8%
Grade 7 88.5% 5.0% 3.2% 1.5% 1.2% 0.5%
Grade 8 79.1% 7.5% 6.4% 3.7% 2.4% 0.9%

8/14/2019 WILLIAMSON COUNTY - Round Rock ISD - 1998 Texas School Survey of Drug and Alcohol Use
http://slidepdf.com/reader/full/williamson-county-round-rock-isd-1998-texas-school-survey-of-drug-and-alcohol 45/213
Grade 9 70.6% 12.7% 9.2% 4.3% 2.3% 0.9%
Grade 10 66.2% 13.5% 9.0% 8.7% 1.7% 0.8%
Grade 11 64.8% 16.7% 7.9% 6.0% 4.1% 0.6%
Grade 12 66.3% 13.5% 6.1% 8.4% 4.9% 0.9%
Bongs or water pipes?
Half the Most of Don't
Never Seldom Time the Time Always Know
All 75.2% 10.4% 6.1% 4.8% 2.6% 0.8%
Grade 7 91.4% 3.5% 2.5% 1.0% 1.2% 0.5%
Grade 8 81.3% 6.0% 6.0% 4.1% 1.7% 0.9%
Grade 9 74.9% 13.4% 5.4% 2.6% 2.9% 0.9%
Grade 10 69.6% 10.3% 7.5% 7.8% 3.6% 1.1%
Grade 11 64.9% 15.7% 7.5% 8.8% 2.5% 0.6%
Grade 12 66.2% 15.2% 8.5% 5.6% 3.7% 0.8%
Pipes?
Half the Most of Don't
Never Seldom Time the Time Always Know
All 73.7% 9.2% 7.4% 6.7% 2.4% 0.6%
Grade 7 89.2% 3.9% 2.6% 2.6% 1.3% 0.3%
Grade 8 79.0% 6.3% 4.8% 6.1% 3.0% 0.9%
Grade 9 72.7% 10.8% 7.6% 4.7% 3.8% 0.6%
Grade 10 69.7% 6.9% 10.3% 10.9% 1.7% 0.6%
Grade 11 63.8% 11.7% 11.1% 11.1% 1.6% 0.6%
Grade 12 65.4% 17.4% 8.6% 5.4% 2.6% 0.6%

8/14/2019 WILLIAMSON COUNTY - Round Rock ISD - 1998 Texas School Survey of Drug and Alcohol Use
http://slidepdf.com/reader/full/williamson-county-round-rock-isd-1998-texas-school-survey-of-drug-and-alcohol 46/213
Round Rock
Spring 1998
──────────────────────────────────────────────────────────────────────────────────────────────
Some other way?
Half the Most of Don'tNever Seldom Time the Time Always Know
All 83.6% 9.8% 1.8% 1.5% 1.0% 2.4%
Grade 7 92.8% 4.0% 0.7% 0.7% 1.0% 0.7%
Grade 8 86.6% 6.7% 1.7% 1.5% 0.9% 2.6%
Grade 9 81.9% 11.0% 2.5% 1.1% 0.6% 2.8%
Grade 10 81.1% 12.3% 2.0% 2.3% 0.6% 1.7%
Grade 11 75.9% 14.9% 1.9% 2.2% 1.6% 3.5%
Grade 12 81.6% 10.8% 1.5% 1.2% 1.7% 3.2%
──────────────────────────────────────────────────────────────────────────────────────────────
Table D-13: How do your parents feel about kids your age using marijuana?
Strongly Mildly Mildly Strongly Don't
Disapprove Disapprove Neither Approve Approve Know
All 84.6% 6.2% 3.5% 1.2% 1.0% 3.4%
Grade 7 87.8% 2.7% 1.8% 0.9% 1.4% 5.4%
Grade 8 84.8% 5.4% 2.8% 1.2% 1.2% 4.7%
Grade 9 85.3% 7.8% 2.9% 0.9% 0.9% 2.2%
Grade 10 84.9% 6.4% 3.1% 2.4% 1.1% 2.0%
Grade 11 80.9% 8.9% 5.2% 1.0% 1.0% 2.9%Grade 12 82.5% 7.2% 6.2% 1.0% 0.2% 2.9%
──────────────────────────────────────────────────────────────────────────────────────────────
Table D-14: How dangerous do you think it is for kids your age to use...
Marijuana?
Very Somewhat Not Very Not at All Do Not
Dangerous Dangerous Dangerous Dangerous Know
All 56.3% 20.4% 12.7% 7.6% 3.0%

8/14/2019 WILLIAMSON COUNTY - Round Rock ISD - 1998 Texas School Survey of Drug and Alcohol Use
http://slidepdf.com/reader/full/williamson-county-round-rock-isd-1998-texas-school-survey-of-drug-and-alcohol 47/213
Grade 7 78.3% 13.3% 3.3% 1.9% 3.1%
Grade 8 66.1% 16.3% 7.8% 5.0% 4.8%
Grade 9 51.7% 20.3% 15.7% 10.4% 2.0%
Grade 10 48.3% 24.9% 15.3% 8.3% 3.1%
Grade 11 39.8% 25.9% 20.3% 11.0% 2.9%
Grade 12 46.9% 24.6% 16.7% 10.1% 1.7%
Cocaine?
Very Somewhat Not Very Not at All Do NotDangerous Dangerous Dangerous Dangerous Know
All 86.9% 8.1% 0.9% 0.5% 3.6%
Grade 7 89.0% 6.4% 0.4% 0.4% 3.9%
Grade 8 82.7% 10.1% 1.2% 0.3% 5.6%
Grade 9 87.3% 6.6% 1.8% 0.9% 3.5%
Grade 10 86.5% 10.3% 0.2% * % 2.9%
Grade 11 86.2% 8.2% 1.6% 1.1% 2.9%
Grade 12 90.5% 6.6% 0.2% 0.5% 2.2%
Crack?
Very Somewhat Not Very Not at All Do Not
Dangerous Dangerous Dangerous Dangerous Know
All 89.0% 6.1% 0.7% 0.5% 3.7%
Grade 7 88.8% 5.5% 0.6% 0.8% 4.4%
Grade 8 83.9% 9.3% 1.1% 0.7% 5.1%
Grade 9 88.8% 5.8% 1.1% 0.4% 3.8%
Grade 10 89.9% 7.3% * % * % 2.8%
Grade 11 91.4% 4.1% 0.5% 0.8% 3.2%
Grade 12 93.0% 3.4% 0.5% 0.5% 2.7%

8/14/2019 WILLIAMSON COUNTY - Round Rock ISD - 1998 Texas School Survey of Drug and Alcohol Use
http://slidepdf.com/reader/full/williamson-county-round-rock-isd-1998-texas-school-survey-of-drug-and-alcohol 48/213
Round Rock
Spring 1998
──────────────────────────────────────────────────────────────────────────────────────────────
Ecstasy?
Very Somewhat Not Very Not at All Do NotDangerous Dangerous Dangerous Dangerous Know
All 70.1% 11.6% 4.1% 1.7% 12.7%
Grade 7 73.4% 6.2% 1.6% 0.7% 18.1%
Grade 8 70.5% 9.2% 2.8% 0.7% 16.8%
Grade 9 66.5% 12.6% 4.0% 1.8% 15.1%
Grade 10 72.5% 14.3% 3.3% 2.0% 7.8%
Grade 11 62.8% 16.7% 7.7% 3.3% 9.6%
Grade 12 74.6% 11.8% 6.5% 1.9% 5.1%
Steroids?
Very Somewhat Not Very Not at All Do Not
Dangerous Dangerous Dangerous Dangerous Know
All 71.0% 17.3% 3.8% 1.2% 6.7%
Grade 7 73.5% 15.3% 1.7% 1.5% 8.0%
Grade 8 69.2% 15.4% 4.2% 1.6% 9.6%
Grade 9 67.4% 18.2% 6.8% 0.9% 6.8%
Grade 10 70.9% 20.9% 2.3% * % 6.0%
Grade 11 69.6% 19.2% 3.8% 2.7% 4.7%
Grade 12 77.2% 15.0% 3.2% 0.7% 3.9%
Heroin?
Very Somewhat Not Very Not at All Do Not
Dangerous Dangerous Dangerous Dangerous Know
All 90.1% 4.2% 0.4% 0.6% 4.6%
Grade 7 87.5% 4.7% 0.4% 0.9% 6.5%
Grade 8 86.2% 5.8% 0.8% 0.5% 6.6%
Grade 9 90.3% 3.9% 0.9% 0.9% 4.1%
Grade 10 91.8% 4.7% * % * % 3.6%
Grade 11 92.5% 3.2% 0.3% 0.8% 3.2%
Grade 12 94.4% 2.2% * % 0.5% 2.9%

8/14/2019 WILLIAMSON COUNTY - Round Rock ISD - 1998 Texas School Survey of Drug and Alcohol Use
http://slidepdf.com/reader/full/williamson-county-round-rock-isd-1998-texas-school-survey-of-drug-and-alcohol 49/213

8/14/2019 WILLIAMSON COUNTY - Round Rock ISD - 1998 Texas School Survey of Drug and Alcohol Use
http://slidepdf.com/reader/full/williamson-county-round-rock-isd-1998-texas-school-survey-of-drug-and-alcohol 50/213

8/14/2019 WILLIAMSON COUNTY - Round Rock ISD - 1998 Texas School Survey of Drug and Alcohol Use
http://slidepdf.com/reader/full/williamson-county-round-rock-isd-1998-texas-school-survey-of-drug-and-alcohol 51/213
Round Rock
Spring 1998
──────────────────────────────────────────────────────────────────────────────────────────────
Table I-1: How recently, if ever, have you used...
Past School Ever NeverMonth Year Used Used
─────────────────────────────────────────────────────────────────────────────────────
Any inhalant? All 7.5% 11.2% 21.9% 78.1%
Grade 7 8.5% 12.9% 22.7% 77.3%
Grade 8 11.4% 16.3% 28.2% 71.8%
Grade 9 7.7% 11.1% 21.3% 78.7%
Grade 10 6.8% 10.3% 22.0% 78.0%
Grade 11 5.6% 8.2% 17.6% 82.4%
Grade 12 2.8% 6.1% 17.2% 82.8%
─────────────────────────────────────────────────────────────────────────────────────
Liquid or spray paint? All 1.9% 2.6% 7.5% 92.5%
Grade 7 2.4% 3.1% 8.7% 91.3%
Grade 8 3.9% 5.0% 11.8% 88.2%
Grade 9 1.9% 2.5% 8.6% 91.4%
Grade 10 1.9% 2.2% 6.0% 94.0%
Grade 11 0.5% 1.3% 4.9% 95.1%
Grade 12 * % 0.2% 2.8% 97.2%
─────────────────────────────────────────────────────────────────────────────────────
Whiteout, correction fluid? All 2.2% 4.2% 10.6% 89.4%
Grade 7 4.3% 6.8% 13.2% 86.8%
Grade 8 4.4% 8.1% 16.0% 84.0%
Grade 9 2.1% 3.6% 11.5% 88.5%
Grade 10 0.7% 3.1% 10.5% 89.5%Grade 11 0.8% 1.3% 5.4% 94.6%
Grade 12 * % 0.2% 3.5% 96.5%
─────────────────────────────────────────────────────────────────────────────────────
Gasoline? All 1.2% 2.0% 4.7% 95.3%
Grade 7 1.7% 3.1% 5.4% 94.6%
Grade 8 2.5% 3.8% 6.4% 93.6%
Grade 9 0.9% 1.3% 4.7% 95.3%
Grade 10 0.7% 1.3% 5.3% 94.7%
Grade 11 1.0% 1.3% 3.1% 96.9%
Grade 12 * % 0.2% 2.1% 97.9%
─────────────────────────────────────────────────────────────────────────────────────
Freon? All 0.3% 1.1% 2.8% 97.2%

8/14/2019 WILLIAMSON COUNTY - Round Rock ISD - 1998 Texas School Survey of Drug and Alcohol Use
http://slidepdf.com/reader/full/williamson-county-round-rock-isd-1998-texas-school-survey-of-drug-and-alcohol 52/213
Grade 7 * % 1.2% 2.5% 97.5%
Grade 8 0.7% 1.0% 3.0% 97.0%
Grade 9 0.2% 1.5% 3.9% 96.1%
Grade 10 0.4% 0.9% 2.9% 97.1%
Grade 11 0.5% 1.0% 2.1% 97.9%
Grade 12 * % 0.5% 2.4% 97.6%
─────────────────────────────────────────────────────────────────────────────────────
Poppers, Locker Room, etc.? All 0.8% 1.2% 2.5% 97.5%
Grade 7 0.7% 1.0% 1.9% 98.1%
Grade 8 1.5% 2.0% 3.6% 96.4%Grade 9 0.2% 0.6% 1.9% 98.1%
Grade 10 0.9% 1.3% 2.9% 97.1%
Grade 11 1.0% 1.3% 2.3% 97.7%
Grade 12 0.2% 0.9% 2.4% 97.6%
─────────────────────────────────────────────────────────────────────────────────────
Glue? All 0.8% 1.8% 5.9% 94.1%
Grade 7 1.4% 2.6% 7.7% 92.3%
Grade 8 1.7% 3.6% 9.4% 90.6%
Grade 9 0.4% 1.3% 4.1% 95.9%
Grade 10 * % 0.7% 5.0% 95.0%
Grade 11 0.8% 1.0% 4.2% 95.8%
Grade 12 0.2% 0.7% 3.8% 96.2%
─────────────────────────────────────────────────────────────────────────────────────
Paint, lacquer thinner, etc.? All 1.3% 2.0% 4.9% 95.1%
Grade 7 1.8% 2.6% 5.6% 94.4%
Grade 8 2.5% 3.6% 7.1% 92.9%
Grade 9 1.1% 1.5% 3.6% 96.4%
Grade 10 1.1% 2.4% 6.2% 93.8%
Grade 11 0.8% 1.0% 3.7% 96.3%
Grade 12 * % 0.2% 2.1% 97.9%

8/14/2019 WILLIAMSON COUNTY - Round Rock ISD - 1998 Texas School Survey of Drug and Alcohol Use
http://slidepdf.com/reader/full/williamson-county-round-rock-isd-1998-texas-school-survey-of-drug-and-alcohol 53/213
Round Rock
Spring 1998
──────────────────────────────────────────────────────────────────────────────────────────────
Past School Ever Never
Month Year Used Used
─────────────────────────────────────────────────────────────────────────────────────Nitrous oxide, laughing gas? All 2.1% 4.0% 8.5% 91.5%
Grade 7 1.1% 2.3% 3.7% 96.3%
Grade 8 2.3% 3.8% 8.2% 91.8%
Grade 9 1.3% 3.7% 8.2% 91.8%
Grade 10 2.6% 4.2% 10.3% 89.7%
Grade 11 3.9% 6.3% 10.0% 90.0%
Grade 12 1.9% 4.5% 12.0% 88.0%
─────────────────────────────────────────────────────────────────────────────────────
Octane booster? All 0.5% 0.8% 1.8% 98.2%
Grade 7 * % 0.7% 1.6% 98.4%
Grade 8 0.8% 1.5% 2.3% 97.7%
Grade 9 0.4% 0.4% 1.1% 98.9%
Grade 10 0.4% 0.7% 2.4% 97.6%
Grade 11 1.0% 1.0% 2.3% 97.7%
Grade 12 0.2% 0.2% 1.0% 99.0%
─────────────────────────────────────────────────────────────────────────────────────
Other sprays? All 1.1% 1.8% 3.8% 96.2%
Grade 7 1.8% 2.5% 5.5% 94.5%
Grade 8 2.0% 3.3% 6.6% 93.4%
Grade 9 1.1% 2.2% 4.3% 95.7%
Grade 10 0.4% 1.1% 3.1% 96.9%
Grade 11 0.5% 0.8% 1.6% 98.4%
Grade 12 * % * % * % 100.0%─────────────────────────────────────────────────────────────────────────────────────
Other inhalants? All 3.5% 5.2% 10.1% 89.9%
Grade 7 4.3% 6.2% 12.3% 87.7%
Grade 8 5.1% 8.0% 14.7% 85.3%
Grade 9 4.5% 5.8% 10.5% 89.5%
Grade 10 3.3% 4.6% 9.5% 90.5%
Grade 11 1.6% 3.1% 6.7% 93.3%
Grade 12 0.7% 1.9% 3.8% 96.2%
──────────────────────────────────────────────────────────────────────────────────────────────
Table I-2: How often do you normally use inhalants?

8/14/2019 WILLIAMSON COUNTY - Round Rock ISD - 1998 Texas School Survey of Drug and Alcohol Use
http://slidepdf.com/reader/full/williamson-county-round-rock-isd-1998-texas-school-survey-of-drug-and-alcohol 54/213
Several Several About About Less Than
Never Every Times Times Once a Once a Once a
Used Day a Week a Month Month Year Year
All 87.8% 0.3% 0.7% 1.2% 1.6% 2.9% 5.4%
Grade 7 86.4% 0.4% 1.1% 1.1% 3.7% 2.6% 4.6%
Grade 8 82.6% 0.9% 1.2% 2.6% 2.6% 4.3% 5.7%
Grade 9 87.1% 0.2% 0.7% 1.4% 1.1% 3.8% 5.7%
Grade 10 88.1% 0.2% 0.7% 1.1% 1.1% 2.9% 5.8%Grade 11 92.3% * % * % 0.6% 0.3% 1.7% 5.2%
Grade 12 93.1% * % 0.2% 0.2% 0.2% 0.7% 5.4%
──────────────────────────────────────────────────────────────────────────────────────────────
Table I-3: Number of different kinds of inhalants used:
0 1 2-3 4+
All 79.8% 7.7% 7.8% 4.7%
Grade 7 79.4% 7.1% 8.3% 5.2%
Grade 8 74.1% 8.3% 10.2% 7.3%
Grade 9 80.0% 6.9% 8.7% 4.4%
Grade 10 80.2% 6.4% 9.1% 4.3%
Grade 11 83.7% 9.2% 3.6% 3.6%
Grade 12 83.5% 9.3% 4.9% 2.3%

8/14/2019 WILLIAMSON COUNTY - Round Rock ISD - 1998 Texas School Survey of Drug and Alcohol Use
http://slidepdf.com/reader/full/williamson-county-round-rock-isd-1998-texas-school-survey-of-drug-and-alcohol 55/213
Round Rock
Spring 1998
──────────────────────────────────────────────────────────────────────────────────────────────
Table I-4: Average age of first use of:
Grade 7 Grade 8 Grade 9 Grade 10 Grade 11 Grade 12
Inhalants 10.8 11.7 11.9 12.4 12.7 13.7
──────────────────────────────────────────────────────────────────────────────────────────────
Table I-5: Since school began in the fall, on how many days (if any) have you attended
class while high from inhalant use?
None 1-3 Days 4-9 Days 10+ Days
All 96.8% 2.5% 0.2% 0.4%
Grade 7 95.0% 3.9% 0.4% 0.7%
Grade 8 94.8% 4.4% 0.5% 0.3%
Grade 9 97.1% 2.4% 0.2% 0.2%
Grade 10 96.9% 2.4% 0.2% 0.4%
Grade 11 98.7% 0.8% * % 0.5%
Grade 12 100.0% * % * % * %
──────────────────────────────────────────────────────────────────────────────────────────────
Table I-6: School year use of inhalants by absences and conduct problems:
Average days absent due to illness or other reasons:
Inhalants Users: 5.4 days per student
Inhalants Non-users: 4.3 days per student
Average days conduct problems reported:
Inhalants Users: 6.2 days per student
Inhalants Non-users: 1.8 days per student
──────────────────────────────────────────────────────────────────────────────────────────────
Table I-7: About how many of your close friends use inhalants?

8/14/2019 WILLIAMSON COUNTY - Round Rock ISD - 1998 Texas School Survey of Drug and Alcohol Use
http://slidepdf.com/reader/full/williamson-county-round-rock-isd-1998-texas-school-survey-of-drug-and-alcohol 56/213
Never heard
None A Few Some Most All
All 81.0% 13.7% 3.5% 1.3% 0.5%
Grade 7 79.4% 14.2% 3.8% 2.0% 0.5%
Grade 8 74.5% 15.6% 7.2% 2.2% 0.5%
Grade 9 77.9% 16.7% 3.7% 0.9% 0.9%
Grade 10 81.9% 14.3% 2.0% 1.1% 0.7%
Grade 11 85.8% 11.3% 2.6% 0.3% * %Grade 12 90.6% 7.8% 0.7% 0.7% 0.2%
──────────────────────────────────────────────────────────────────────────────────────────────
Table I-8: How dangerous do you think it is for kids your age to use inhalants?
Very Somewhat Not Very Not at All Do Not
Dangerous Dangerous Dangerous Dangerous Know
All 73.4% 18.6% 3.2% 0.9% 3.9%
Grade 7 74.2% 18.5% 3.2% 0.7% 3.4%
Grade 8 70.1% 19.3% 5.0% 1.0% 4.5%
Grade 9 69.6% 21.6% 3.4% 1.1% 4.3%
Grade 10 73.7% 19.1% 3.4% 0.2% 3.6%
Grade 11 76.7% 16.2% 2.1% 1.6% 3.4%
Grade 12 79.0% 15.0% 1.4% 0.7% 3.9%

8/14/2019 WILLIAMSON COUNTY - Round Rock ISD - 1998 Texas School Survey of Drug and Alcohol Use
http://slidepdf.com/reader/full/williamson-county-round-rock-isd-1998-texas-school-survey-of-drug-and-alcohol 57/213
8/14/2019 WILLIAMSON COUNTY - Round Rock ISD - 1998 Texas School Survey of Drug and Alcohol Use
http://slidepdf.com/reader/full/williamson-county-round-rock-isd-1998-texas-school-survey-of-drug-and-alcohol 58/213
Round Rock
Spring 1998
──────────────────────────────────────────────────────────────────────────────────────────────
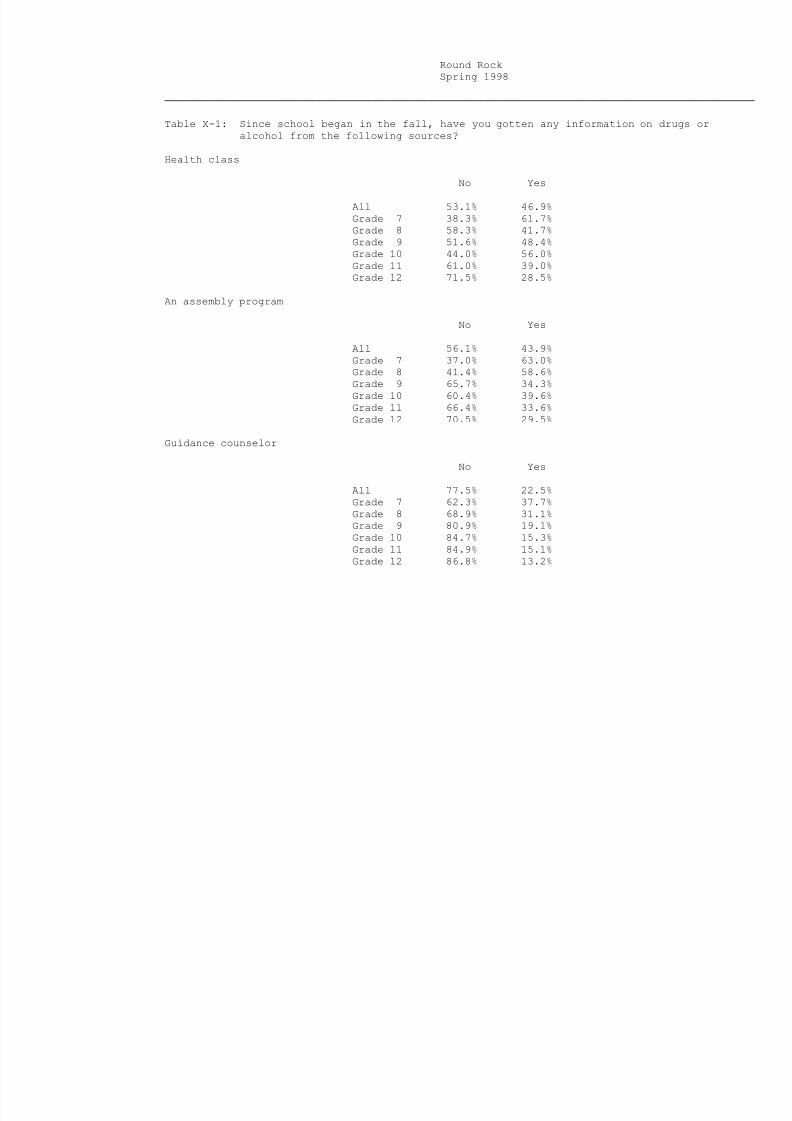
Table X-1: Since school began in the fall, have you gotten any information on drugs or
alcohol from the following sources?
Health class
No Yes
All 53.1% 46.9%
Grade 7 38.3% 61.7%
Grade 8 58.3% 41.7%
Grade 9 51.6% 48.4%
Grade 10 44.0% 56.0%
Grade 11 61.0% 39.0%
Grade 12 71.5% 28.5%
An assembly program
No Yes
All 56.1% 43.9%
Grade 7 37.0% 63.0%
Grade 8 41.4% 58.6%
Grade 9 65.7% 34.3%
Grade 10 60.4% 39.6%
Grade 11 66.4% 33.6%
Grade 12 70.5% 29.5%
Guidance counselor
No Yes
All 77.5% 22.5%
Grade 7 62.3% 37.7%
Grade 8 68.9% 31.1%
Grade 9 80.9% 19.1%
Grade 10 84.7% 15.3%
Grade 11 84.9% 15.1%
Grade 12 86.8% 13.2%

8/14/2019 WILLIAMSON COUNTY - Round Rock ISD - 1998 Texas School Survey of Drug and Alcohol Use
http://slidepdf.com/reader/full/williamson-county-round-rock-isd-1998-texas-school-survey-of-drug-and-alcohol 59/213
Science class
No Yes
All 69.6% 30.4%
Grade 7 31.3% 68.7%
Grade 8 70.1% 29.9%
Grade 9 70.2% 29.8%
Grade 10 80.8% 19.2%Grade 11 83.3% 16.7%
Grade 12 91.2% 8.8%
Social studies class
No Yes
All 87.8% 12.2%
Grade 7 87.7% 12.3%
Grade 8 89.4% 10.6%
Grade 9 84.8% 15.2%
Grade 10 89.3% 10.7%
Grade 11 87.3% 12.7%
Grade 12 88.7% 11.3%

8/14/2019 WILLIAMSON COUNTY - Round Rock ISD - 1998 Texas School Survey of Drug and Alcohol Use
http://slidepdf.com/reader/full/williamson-county-round-rock-isd-1998-texas-school-survey-of-drug-and-alcohol 60/213
Round Rock
Spring 1998
──────────────────────────────────────────────────────────────────────────────────────────────
Student group session
No Yes
All 88.4% 11.6%
Grade 7 84.1% 15.9%
Grade 8 81.7% 18.3%
Grade 9 89.2% 10.8%
Grade 10 93.1% 6.9%
Grade 11 92.7% 7.3%
Grade 12 91.3% 8.7%
An invited school guest
No Yes
All 66.4% 33.6%
Grade 7 59.6% 40.4%
Grade 8 50.0% 50.0%
Grade 9 71.5% 28.5%
Grade 10 69.3% 30.7%
Grade 11 73.4% 26.6%
Grade 12 78.0% 22.0%
Some other school source
No Yes
All 66.3% 33.7%
Grade 7 56.3% 43.7%
Grade 8 56.9% 43.1%
Grade 9 69.6% 30.4%
Grade 10 71.5% 28.5%
Grade 11 73.7% 26.3%
Grade 12 72.5% 27.5%
Any school source
No Yes

8/14/2019 WILLIAMSON COUNTY - Round Rock ISD - 1998 Texas School Survey of Drug and Alcohol Use
http://slidepdf.com/reader/full/williamson-county-round-rock-isd-1998-texas-school-survey-of-drug-and-alcohol 61/213
o es
All 32.9% 67.1%
Grade 7 23.6% 76.4%
Grade 8 30.8% 69.2%
Grade 9 31.0% 69.0%
Grade 10 32.1% 67.9%
Grade 11 39.8% 60.2%
Grade 12 46.6% 53.4%
──────────────────────────────────────────────────────────────────────────────────────────────
Table X-2: If you had a drug or alcohol problem and needed help, who would you go to?
A counselor or program in school
No Yes
All 66.6% 33.4%
Grade 7 56.0% 44.0%
Grade 8 62.6% 37.4%
Grade 9 63.8% 36.2%Grade 10 70.3% 29.7%
Grade 11 78.1% 21.9%
Grade 12 75.0% 25.0%

8/14/2019 WILLIAMSON COUNTY - Round Rock ISD - 1998 Texas School Survey of Drug and Alcohol Use
http://slidepdf.com/reader/full/williamson-county-round-rock-isd-1998-texas-school-survey-of-drug-and-alcohol 62/213
Round Rock
Spring 1998
──────────────────────────────────────────────────────────────────────────────────────────────
Another adult in school (such as a nurse or teacher)
No Yes
All 72.5% 27.5%
Grade 7 68.0% 32.0%
Grade 8 68.9% 31.1%
Grade 9 72.6% 27.4%
Grade 10 73.4% 26.6%
Grade 11 79.8% 20.2%
Grade 12 75.1% 24.9%
A counselor or program outside of school
No Yes
All 57.4% 42.6%
Grade 7 57.6% 42.4%
Grade 8 56.1% 43.9%
Grade 9 60.2% 39.8%
Grade 10 55.5% 44.5%
Grade 11 60.8% 39.2%
Grade 12 53.5% 46.5%
Your parents
No Yes
All 43.4% 56.6%
Grade 7 34.0% 66.0%
Grade 8 41.7% 58.3%
Grade 9 44.3% 55.7%
Grade 10 46.4% 53.6%
Grade 11 50.3% 49.7%
Grade 12 46.3% 53.7%
A medical doctor
No Yes

8/14/2019 WILLIAMSON COUNTY - Round Rock ISD - 1998 Texas School Survey of Drug and Alcohol Use
http://slidepdf.com/reader/full/williamson-county-round-rock-isd-1998-texas-school-survey-of-drug-and-alcohol 63/213
All 58.7% 41.3%
Grade 7 52.8% 47.2%
Grade 8 55.5% 44.5%
Grade 9 60.9% 39.1%
Grade 10 60.9% 39.1%
Grade 11 65.3% 34.7%
Grade 12 58.5% 41.5%
Your friends
No Yes
All 18.5% 81.5%
Grade 7 24.9% 75.1%
Grade 8 23.2% 76.8%
Grade 9 16.5% 83.5%
Grade 10 18.4% 81.6%
Grade 11 12.2% 87.8%
Grade 12 12.4% 87.6%
Another adult (a relative, clergyman, or other family friend)
No Yes
All 40.3% 59.7%
Grade 7 38.8% 61.2%
Grade 8 38.7% 61.3%
Grade 9 41.5% 58.5%
Grade 10 40.9% 59.1%
Grade 11 42.9% 57.1%
Grade 12 39.1% 60.9%

8/14/2019 WILLIAMSON COUNTY - Round Rock ISD - 1998 Texas School Survey of Drug and Alcohol Use
http://slidepdf.com/reader/full/williamson-county-round-rock-isd-1998-texas-school-survey-of-drug-and-alcohol 64/213
Round Rock
Spring 1998
──────────────────────────────────────────────────────────────────────────────────────────────
Table X-3: Since school began in the fall, have you sought help, other than from family or
friends, for problems in any way connected with your use of alcohol, marijuana,
or other drugs?
No Yes
All 94.9% 5.1%
Grade 7 93.3% 6.7%
Grade 8 94.1% 5.9%
Grade 9 95.2% 4.8%
Grade 10 96.6% 3.4%
Grade 11 95.1% 4.9%
Grade 12 95.1% 4.9%
──────────────────────────────────────────────────────────────────────────────────────────────
Table X-4: About how many of your friends:
Feel close to their parents?
None A Few Some Most All
All 3.3% 22.3% 26.5% 39.7% 8.2%
Grade 7 4.8% 19.3% 23.3% 40.7% 11.9%
Grade 8 3.5% 22.1% 21.6% 42.1% 10.6%
Grade 9 3.1% 24.8% 25.1% 38.8% 8.1%
Grade 10 4.5% 21.8% 31.5% 34.7% 7.5%
Grade 11 1.8% 25.6% 28.6% 39.6% 4.3%
Grade 12 1.4% 19.8% 31.4% 42.8% 4.7%
Sometimes carry weapons?
None A Few Some Most All
All 62.9% 23.4% 9.0% 3.7% 1.0%
Grade 7 74.1% 15.6% 6.7% 3.0% 0.7%
Grade 8 61.4% 23.5% 9.9% 4.1% 1.0%
Grade 9 55.0% 26.1% 12.5% 5.5% 0.8%
Grade 10 63.1% 24.2% 8.4% 3.3% 1.1%

8/14/2019 WILLIAMSON COUNTY - Round Rock ISD - 1998 Texas School Survey of Drug and Alcohol Use
http://slidepdf.com/reader/full/williamson-county-round-rock-isd-1998-texas-school-survey-of-drug-and-alcohol 65/213
Grade 11 57.3% 30.1% 7.9% 3.4% 1.3%
Grade 12 66.6% 22.0% 7.9% 2.1% 1.4%
Care about making good grades?
None A Few Some Most All
All 2.1% 12.0% 20.2% 47.7% 18.1%
Grade 7 2.7% 14.2% 18.9% 40.4% 23.9%Grade 8 2.5% 13.1% 20.7% 42.1% 21.7%
Grade 9 2.4% 14.8% 20.8% 46.0% 16.1%
Grade 10 1.8% 11.0% 20.4% 53.3% 13.6%
Grade 11 0.8% 8.4% 22.9% 52.4% 15.5%
Grade 12 1.9% 7.9% 17.5% 56.4% 16.3%
Belong/want to belong to a gang?
None A Few Some Most All
All 72.7% 17.5% 6.3% 2.2% 1.3%
Grade 7 74.4% 17.2% 5.2% 1.7% 1.5%Grade 8 67.0% 18.7% 8.9% 3.2% 2.1%
Grade 9 68.6% 19.7% 8.2% 2.1% 1.5%
Grade 10 72.5% 17.6% 5.6% 2.6% 1.7%
Grade 11 75.3% 17.5% 4.6% 2.1% 0.5%
Grade 12 82.7% 12.1% 4.0% 1.2% * %

8/14/2019 WILLIAMSON COUNTY - Round Rock ISD - 1998 Texas School Survey of Drug and Alcohol Use
http://slidepdf.com/reader/full/williamson-county-round-rock-isd-1998-texas-school-survey-of-drug-and-alcohol 66/213
Round Rock
Spring 1998
──────────────────────────────────────────────────────────────────────────────────────────────
Wish they could drop out of school?
None A Few Some Most All
All 56.8% 28.6% 8.6% 3.9% 2.1%
Grade 7 66.7% 22.0% 6.5% 2.2% 2.6%
Grade 8 58.8% 25.3% 7.5% 4.5% 3.9%
Grade 9 52.0% 30.4% 10.7% 5.0% 1.9%
Grade 10 52.7% 30.0% 10.9% 4.3% 2.1%
Grade 11 48.1% 38.1% 8.4% 4.3% 1.0%
Grade 12 62.1% 27.8% 6.8% 2.8% 0.5%

8/14/2019 WILLIAMSON COUNTY - Round Rock ISD - 1998 Texas School Survey of Drug and Alcohol Use
http://slidepdf.com/reader/full/williamson-county-round-rock-isd-1998-texas-school-survey-of-drug-and-alcohol 67/213
Round Rock
i 1998

8/14/2019 WILLIAMSON COUNTY - Round Rock ISD - 1998 Texas School Survey of Drug and Alcohol Use
http://slidepdf.com/reader/full/williamson-county-round-rock-isd-1998-texas-school-survey-of-drug-and-alcohol 68/213
Spring 1998
Table B1: Prevalence and recency of use of selected substances by grade
--> All students
Past School Ever Never
Month Year Used Used
─────────────────────────────────────────────────────────────────────────────────────
Tobacco All 26.3% 35.7% 52.2% 47.8%Grade 7 12.9% 21.2% 36.3% 63.7%
Grade 8 22.3% 30.2% 45.1% 54.9%
Grade 9 26.8% 37.9% 57.3% 42.7%
Grade 10 29.4% 41.6% 56.1% 43.9%
Grade 11 36.4% 44.4% 60.5% 39.5%
Grade 12 35.8% 44.7% 64.0% 36.0%
─────────────────────────────────────────────────────────────────────────────────────
Alcohol All 36.7% 51.1% 69.7% 30.3%
Grade 7 19.1% 28.1% 50.1% 49.9%
Grade 8 28.7% 38.5% 57.8% 42.2%
Grade 9 38.4% 55.3% 73.7% 26.3%
Grade 10 42.2% 59.7% 77.7% 22.3%Grade 11 46.3% 65.8% 83.5% 16.5%
Grade 12 54.1% 69.0% 84.1% 15.9%
─────────────────────────────────────────────────────────────────────────────────────
Inhalants All 7.5% 11.2% 21.9% 78.1%
Grade 7 8.5% 12.9% 22.7% 77.3%
Grade 8 11.4% 16.3% 28.2% 71.8%
Grade 9 7.7% 11.1% 21.3% 78.7%
Grade 10 6.8% 10.3% 22.0% 78.0%
Grade 11 5.6% 8.2% 17.6% 82.4%
Grade 12 2.8% 6.1% 17.2% 82.8%
─────────────────────────────────────────────────────────────────────────────────────
Any Illicit Drug All 18.5% 26.4% 35.6% 64.4%
Grade 7 7.6% 10.3% 15.6% 84.4%
Grade 8 13.6% 20.7% 28.0% 72.0%
Grade 9 19.5% 28.9% 40.2% 59.8%
Grade 10 22.7% 33.2% 42.8% 57.2%
Grade 11 27.5% 36.8% 49.1% 50.9%
Grade 12 24.5% 34.8% 45.3% 54.7%
─────────────────────────────────────────────────────────────────────────────────────
Marijuana All 16.4% 24.9% 33.9% 66.1%
Grade 7 6.3% 9.7% 14.3% 85.7%
Grade 8 11.1% 18.1% 25.6% 74.4%
Grade 9 17.2% 26.6% 37.1% 62.9%
Grade 10 20.6% 31.4% 41.7% 58.3%
G d 11 25 6% 35 2% 46 9% 53 1%

8/14/2019 WILLIAMSON COUNTY - Round Rock ISD - 1998 Texas School Survey of Drug and Alcohol Use
http://slidepdf.com/reader/full/williamson-county-round-rock-isd-1998-texas-school-survey-of-drug-and-alcohol 69/213
Grade 11 25.6% 35.2% 46.9% 53.1%
Grade 12 22.2% 34.4% 45.0% 55.0%
─────────────────────────────────────────────────────────────────────────────────────
Marijuana Only All 5.4% 10.0% 16.1% 83.9%
Grade 7 3.0% 5.1% 8.6% 91.4%
Grade 8 3.8% 7.0% 11.8% 88.2%
Grade 9 5.2% 10.8% 19.2% 80.8%
Grade 10 6.8% 13.4% 19.6% 80.4%
Grade 11 7.7% 12.2% 19.4% 80.6%Grade 12 7.2% 13.5% 20.6% 79.4%
─────────────────────────────────────────────────────────────────────────────────────
Cocaine or Crack All 2.8% 4.6% 7.9% 92.1%
Grade 7 1.4% 2.3% 3.5% 96.5%
Grade 8 2.1% 3.1% 5.9% 94.1%
Grade 9 1.5% 3.2% 6.8% 93.2%
Grade 10 3.0% 6.5% 10.2% 89.8%
Grade 11 6.2% 8.5% 13.5% 86.5%
Grade 12 3.5% 5.4% 10.4% 89.6%
─────────────────────────────────────────────────────────────────────────────────────
Cocaine All 2.4% 4.0% 7.3% 92.7%
Grade 7 0.9% 1.2% 2.5% 97.5%Grade 8 1.5% 2.5% 5.3% 94.7%
Grade 9 1.3% 3.0% 6.4% 93.6%
Grade 10 2.8% 5.9% 9.6% 90.4%
Grade 11 5.8% 8.1% 12.6% 87.4%
Grade 12 3.3% 5.2% 10.2% 89.8%
Round Rock
S i 1998

8/14/2019 WILLIAMSON COUNTY - Round Rock ISD - 1998 Texas School Survey of Drug and Alcohol Use
http://slidepdf.com/reader/full/williamson-county-round-rock-isd-1998-texas-school-survey-of-drug-and-alcohol 70/213
Spring 1998
Table B1 continued from previous page
Past School Ever Never
Month Year Used Used
─────────────────────────────────────────────────────────────────────────────────────
Crack All 0.9% 1.6% 2.9% 97.1%
Grade 7 1.2% 1.8% 2.5% 97.5%Grade 8 1.5% 2.0% 3.1% 96.9%
Grade 9 0.4% 0.9% 2.3% 97.7%
Grade 10 0.7% 2.4% 3.5% 96.5%
Grade 11 0.8% 1.6% 3.6% 96.4%
Grade 12 0.5% 0.7% 2.6% 97.4%
─────────────────────────────────────────────────────────────────────────────────────
Hallucinogens All 4.1% 7.1% 11.3% 88.7%
Grade 7 1.6% 2.7% 2.8% 97.2%
Grade 8 2.0% 5.1% 8.4% 91.6%
Grade 9 4.1% 5.6% 9.8% 90.2%
Grade 10 5.0% 9.4% 13.3% 86.7%
Grade 11 7.8% 12.5% 20.1% 79.9%Grade 12 5.9% 10.2% 17.5% 82.5%
─────────────────────────────────────────────────────────────────────────────────────
Uppers All 3.8% 6.6% 10.9% 89.1%
Grade 7 1.5% 2.2% 3.3% 96.7%
Grade 8 3.2% 5.1% 7.4% 92.6%
Grade 9 4.4% 8.1% 13.1% 86.9%
Grade 10 4.4% 9.2% 15.1% 84.9%
Grade 11 6.3% 8.7% 15.8% 84.2%
Grade 12 3.8% 6.9% 12.0% 88.0%
─────────────────────────────────────────────────────────────────────────────────────
Downers All 2.7% 5.1% 8.1% 91.9%
Grade 7 1.1% 2.0% 2.2% 97.8%
Grade 8 1.5% 3.7% 5.7% 94.3%
Grade 9 3.5% 5.9% 10.3% 89.7%
Grade 10 2.9% 7.1% 10.6% 89.4%
Grade 11 4.5% 6.7% 11.8% 88.2%
Grade 12 3.4% 5.8% 9.5% 90.5%
─────────────────────────────────────────────────────────────────────────────────────
Rohypnol All 2.3% 3.3% 6.4% 93.6%
Grade 7 1.6% 1.6% 2.7% 97.3%
Grade 8 2.4% 3.9% 6.1% 93.9%
Grade 9 2.8% 3.9% 5.6% 94.4%
Grade 10 2.4% 4.0% 7.7% 92.3%
Grade 11 2.6% 3.7% 9.2% 90.8%
Grade 12 1 9% 3 1% 8 6% 91 4%

8/14/2019 WILLIAMSON COUNTY - Round Rock ISD - 1998 Texas School Survey of Drug and Alcohol Use
http://slidepdf.com/reader/full/williamson-county-round-rock-isd-1998-texas-school-survey-of-drug-and-alcohol 71/213
Grade 12 1.9% 3.1% 8.6% 91.4%
─────────────────────────────────────────────────────────────────────────────────────
Steroids All 0.7% 1.2% 2.3% 97.7%
Grade 7 1.1% 1.6% 2.9% 97.1%
Grade 8 0.7% 1.0% 2.5% 97.5%
Grade 9 0.2% 0.4% 1.3% 98.7%
Grade 10 0.2% 0.4% 1.6% 98.4%
Grade 11 1.6% 3.4% 3.7% 96.3%
Grade 12 0.5% 0.7% 1.9% 98.1%─────────────────────────────────────────────────────────────────────────────────────
Ecstasy All 2.1% 3.4% 5.8% 94.2%
Grade 7 0.4% 0.7% 1.1% 98.9%
Grade 8 1.0% 1.9% 3.3% 96.7%
Grade 9 1.7% 2.6% 5.0% 95.0%
Grade 10 2.2% 4.0% 6.9% 93.1%
Grade 11 4.8% 7.1% 11.1% 88.9%
Grade 12 3.4% 5.8% 9.8% 90.2%
─────────────────────────────────────────────────────────────────────────────────────
Heroin All 0.5% 0.7% 1.9% 98.1%
Grade 7 0.5% 0.7% 1.8% 98.2%
Grade 8 0.7% 0.8% 1.3% 98.7%Grade 9 0.4% 0.7% 2.2% 97.8%
Grade 10 0.4% 0.4% 2.8% 97.2%
Grade 11 0.5% 1.1% 1.3% 98.7%
Grade 12 0.2% 0.2% 1.4% 98.6%
Round Rock
Spring 1998

8/14/2019 WILLIAMSON COUNTY - Round Rock ISD - 1998 Texas School Survey of Drug and Alcohol Use
http://slidepdf.com/reader/full/williamson-county-round-rock-isd-1998-texas-school-survey-of-drug-and-alcohol 72/213
Spring 1998
Table B2: Prevalence and recency of use of selected substances by grade
--> Male students
Past School Ever Never
Month Year Used Used
─────────────────────────────────────────────────────────────────────────────────────
Tobacco All 27.3% 37.6% 53.6% 46.4%Grade 7 12.1% 20.4% 36.7% 63.3%
Grade 8 25.2% 35.0% 50.5% 49.5%
Grade 9 23.4% 34.9% 55.7% 44.3%
Grade 10 31.8% 45.1% 56.2% 43.8%
Grade 11 42.2% 50.8% 65.4% 34.6%
Grade 12 37.1% 47.1% 63.8% 36.2%
─────────────────────────────────────────────────────────────────────────────────────
Alcohol All 36.3% 49.9% 68.7% 31.3%
Grade 7 19.4% 27.7% 53.6% 46.4%
Grade 8 31.6% 41.4% 61.2% 38.8%
Grade 9 33.8% 50.2% 67.5% 32.5%
Grade 10 41.6% 58.0% 74.5% 25.5%Grade 11 49.5% 66.7% 83.3% 16.7%
Grade 12 51.7% 66.5% 80.9% 19.1%
─────────────────────────────────────────────────────────────────────────────────────
Inhalants All 8.2% 11.8% 22.7% 77.3%
Grade 7 9.3% 12.4% 23.1% 76.9%
Grade 8 13.6% 18.2% 28.2% 71.8%
Grade 9 7.7% 9.8% 20.0% 80.0%
Grade 10 6.0% 10.3% 23.2% 76.8%
Grade 11 8.1% 10.8% 21.5% 78.5%
Grade 12 2.9% 7.6% 18.6% 81.4%
─────────────────────────────────────────────────────────────────────────────────────
Any Illicit Drug All 20.1% 28.9% 38.1% 61.9%
Grade 7 9.7% 12.4% 18.3% 81.7%
Grade 8 15.3% 24.4% 33.1% 66.9%
Grade 9 18.7% 26.0% 38.7% 61.3%
Grade 10 25.1% 39.0% 45.9% 54.1%
Grade 11 34.4% 45.7% 57.5% 42.5%
Grade 12 23.1% 33.7% 42.8% 57.2%
─────────────────────────────────────────────────────────────────────────────────────
Marijuana All 18.1% 27.4% 37.0% 63.0%
Grade 7 7.6% 11.5% 17.0% 83.0%
Grade 8 13.1% 21.9% 31.0% 69.0%
Grade 9 16.7% 24.8% 37.6% 62.4%
Grade 10 24.2% 37.2% 45.9% 54.1%
Grade 11 32 2% 43 7% 56 3% 43 7%
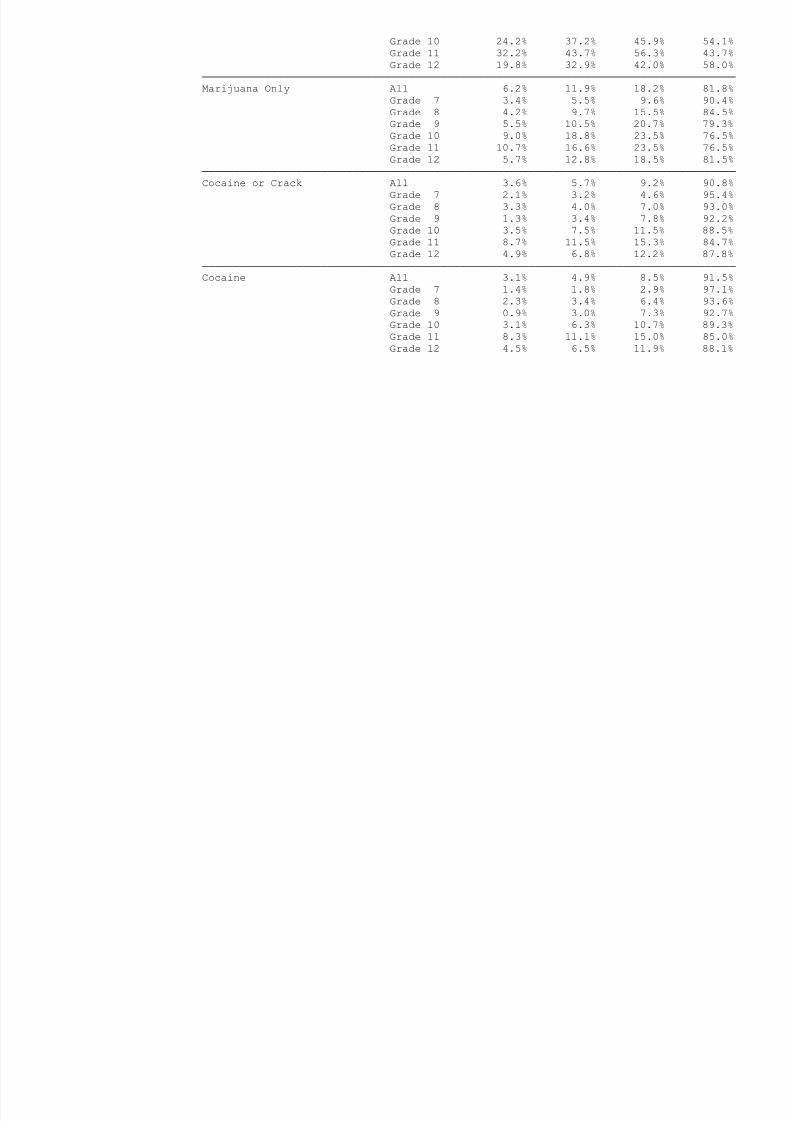
8/14/2019 WILLIAMSON COUNTY - Round Rock ISD - 1998 Texas School Survey of Drug and Alcohol Use
http://slidepdf.com/reader/full/williamson-county-round-rock-isd-1998-texas-school-survey-of-drug-and-alcohol 73/213
Grade 11 32.2% 43.7% 56.3% 43.7%
Grade 12 19.8% 32.9% 42.0% 58.0%
─────────────────────────────────────────────────────────────────────────────────────
Marijuana Only All 6.2% 11.9% 18.2% 81.8%
Grade 7 3.4% 5.5% 9.6% 90.4%
Grade 8 4.2% 9.7% 15.5% 84.5%
Grade 9 5.5% 10.5% 20.7% 79.3%
Grade 10 9.0% 18.8% 23.5% 76.5%
Grade 11 10.7% 16.6% 23.5% 76.5%Grade 12 5.7% 12.8% 18.5% 81.5%
─────────────────────────────────────────────────────────────────────────────────────
Cocaine or Crack All 3.6% 5.7% 9.2% 90.8%
Grade 7 2.1% 3.2% 4.6% 95.4%
Grade 8 3.3% 4.0% 7.0% 93.0%
Grade 9 1.3% 3.4% 7.8% 92.2%
Grade 10 3.5% 7.5% 11.5% 88.5%
Grade 11 8.7% 11.5% 15.3% 84.7%
Grade 12 4.9% 6.8% 12.2% 87.8%
─────────────────────────────────────────────────────────────────────────────────────
Cocaine All 3.1% 4.9% 8.5% 91.5%
Grade 7 1.4% 1.8% 2.9% 97.1%Grade 8 2.3% 3.4% 6.4% 93.6%
Grade 9 0.9% 3.0% 7.3% 92.7%
Grade 10 3.1% 6.3% 10.7% 89.3%
Grade 11 8.3% 11.1% 15.0% 85.0%
Grade 12 4.5% 6.5% 11.9% 88.1%

8/14/2019 WILLIAMSON COUNTY - Round Rock ISD - 1998 Texas School Survey of Drug and Alcohol Use
http://slidepdf.com/reader/full/williamson-county-round-rock-isd-1998-texas-school-survey-of-drug-and-alcohol 74/213
Grade 11 3.3% 5.0% 9.9% 90.1%
Grade 12 2.0% 3.0% 8.0% 92.0%

8/14/2019 WILLIAMSON COUNTY - Round Rock ISD - 1998 Texas School Survey of Drug and Alcohol Use
http://slidepdf.com/reader/full/williamson-county-round-rock-isd-1998-texas-school-survey-of-drug-and-alcohol 75/213
Grade 12 2.0% 3.0% 8.0% 92.0%
─────────────────────────────────────────────────────────────────────────────────────
Steroids All 1.0% 1.4% 2.9% 97.1%
Grade 7 1.5% 1.9% 3.8% 96.2%
Grade 8 1.0% 1.0% 3.4% 96.6%
Grade 9 0.4% 0.4% 1.3% 98.7%
Grade 10 * % 0.5% 1.8% 98.2%
Grade 11 2.8% 4.5% 5.0% 95.0%
Grade 12 0.5% 0.5% 2.5% 97.5%─────────────────────────────────────────────────────────────────────────────────────
Ecstasy All 2.7% 4.3% 6.6% 93.4%
Grade 7 0.4% 0.8% 0.8% 99.2%
Grade 8 1.1% 2.1% 3.9% 96.1%
Grade 9 1.8% 3.1% 4.0% 96.0%
Grade 10 3.7% 6.4% 9.1% 90.9%
Grade 11 6.7% 9.4% 15.0% 85.0%
Grade 12 4.0% 5.9% 10.4% 89.6%
─────────────────────────────────────────────────────────────────────────────────────
Heroin All 0.7% 0.9% 2.6% 97.4%
Grade 7 0.8% 1.1% 2.6% 97.4%
Grade 8 1.0% 1.4% 2.1% 97.9%Grade 9 0.4% 0.4% 2.7% 97.3%
Grade 10 0.4% 0.4% 4.0% 96.0%
Grade 11 1.1% 1.7% 1.7% 98.3%
Grade 12 0.5% 0.5% 2.0% 98.0%
Round Rock
Spring 1998

8/14/2019 WILLIAMSON COUNTY - Round Rock ISD - 1998 Texas School Survey of Drug and Alcohol Use
http://slidepdf.com/reader/full/williamson-county-round-rock-isd-1998-texas-school-survey-of-drug-and-alcohol 76/213
Spring 1998
Table B3: Prevalence and recency of use of selected substances by grade
--> Female students
Past School Ever Never
Month Year Used Used
─────────────────────────────────────────────────────────────────────────────────────
Tobacco All 25.2% 33.8% 50.7% 49.3%Grade 7 13.6% 21.9% 35.9% 64.1%
Grade 8 19.4% 25.5% 39.8% 60.2%
Grade 9 30.0% 40.7% 58.8% 41.2%
Grade 10 26.8% 37.9% 55.7% 44.3%
Grade 11 31.2% 38.6% 55.9% 44.1%
Grade 12 34.1% 41.9% 63.6% 36.4%
─────────────────────────────────────────────────────────────────────────────────────
Alcohol All 37.1% 52.1% 70.6% 29.4%
Grade 7 18.8% 28.5% 46.6% 53.4%
Grade 8 25.9% 35.8% 54.4% 45.6%
Grade 9 43.0% 60.3% 79.8% 20.2%
Grade 10 43.0% 61.3% 80.9% 19.1%Grade 11 43.3% 65.0% 83.7% 16.3%
Grade 12 56.7% 71.4% 87.1% 12.9%
─────────────────────────────────────────────────────────────────────────────────────
Inhalants All 6.8% 10.7% 21.3% 78.7%
Grade 7 7.6% 13.3% 22.3% 77.7%
Grade 8 9.2% 14.6% 28.2% 71.8%
Grade 9 7.8% 12.3% 22.6% 77.4%
Grade 10 7.7% 10.3% 20.9% 79.1%
Grade 11 3.4% 5.9% 14.1% 85.9%
Grade 12 2.8% 4.6% 16.2% 83.8%
─────────────────────────────────────────────────────────────────────────────────────
Any Illicit Drug All 16.9% 24.1% 33.3% 66.7%
Grade 7 5.6% 8.3% 13.0% 87.0%
Grade 8 12.0% 17.1% 23.1% 76.9%
Grade 9 20.2% 31.7% 41.6% 58.4%
Grade 10 20.4% 27.7% 40.0% 60.0%
Grade 11 21.2% 28.6% 41.4% 58.6%
Grade 12 26.3% 36.4% 47.9% 52.1%
─────────────────────────────────────────────────────────────────────────────────────
Marijuana All 14.9% 22.5% 30.9% 69.1%
Grade 7 5.0% 8.1% 11.7% 88.3%
Grade 8 9.2% 14.3% 20.4% 79.6%
Grade 9 17.7% 28.4% 36.6% 63.4%
Grade 10 17.2% 25.8% 37.8% 62.2%
Grade 11 19.7% 27.6% 38.4% 61.6%

8/14/2019 WILLIAMSON COUNTY - Round Rock ISD - 1998 Texas School Survey of Drug and Alcohol Use
http://slidepdf.com/reader/full/williamson-county-round-rock-isd-1998-texas-school-survey-of-drug-and-alcohol 77/213
Grade 12 24.9% 36.4% 47.9% 52.1%
─────────────────────────────────────────────────────────────────────────────────────
Marijuana Only All 4.7% 8.2% 14.1% 85.9%
Grade 7 2.7% 4.7% 7.6% 92.4%
Grade 8 3.5% 4.4% 8.2% 91.8%
Grade 9 4.9% 11.1% 17.7% 82.3%
Grade 10 4.7% 8.1% 15.7% 84.3%
Grade 11 4.9% 8.3% 15.6% 84.4%Grade 12 8.8% 14.3% 22.6% 77.4%
─────────────────────────────────────────────────────────────────────────────────────
Cocaine or Crack All 1.9% 3.5% 6.7% 93.3%
Grade 7 0.7% 1.4% 2.4% 97.6%
Grade 8 1.0% 2.2% 4.8% 95.2%
Grade 9 1.7% 2.9% 5.8% 94.2%
Grade 10 2.6% 5.6% 9.0% 91.0%
Grade 11 3.9% 5.9% 11.8% 88.2%
Grade 12 2.3% 4.1% 8.8% 91.2%
─────────────────────────────────────────────────────────────────────────────────────
Cocaine All 1.7% 3.2% 6.2% 93.8%
Grade 7 0.3% 0.7% 2.1% 97.9%Grade 8 0.6% 1.6% 4.2% 95.8%
Grade 9 1.7% 2.9% 5.4% 94.6%
Grade 10 2.6% 5.6% 8.6% 91.4%
Grade 11 3.5% 5.4% 10.4% 89.6%
Grade 12 2.3% 4.1% 8.8% 91.2%
Round Rock
Spring 1998

8/14/2019 WILLIAMSON COUNTY - Round Rock ISD - 1998 Texas School Survey of Drug and Alcohol Use
http://slidepdf.com/reader/full/williamson-county-round-rock-isd-1998-texas-school-survey-of-drug-and-alcohol 78/213
p g
Table B3 continued from previous page
Past School Ever Never
Month Year Used Used
─────────────────────────────────────────────────────────────────────────────────────
Crack All 0.5% 1.1% 2.6% 97.4%
Grade 7 0.7% 1.0% 1.7% 98.3%Grade 8 0.6% 1.6% 2.9% 97.1%
Grade 9 0.4% 0.4% 2.1% 97.9%
Grade 10 0.4% 2.2% 3.0% 97.0%
Grade 11 0.5% 1.0% 4.4% 95.6%
Grade 12 * % * % 1.9% 98.1%
─────────────────────────────────────────────────────────────────────────────────────
Hallucinogens All 3.3% 6.1% 9.5% 90.5%
Grade 7 1.0% 2.1% 2.1% 97.9%
Grade 8 1.3% 4.9% 6.5% 93.5%
Grade 9 4.2% 5.9% 9.7% 90.3%
Grade 10 4.3% 7.7% 10.7% 89.3%
Grade 11 4.5% 7.9% 13.9% 86.1%Grade 12 5.1% 9.7% 17.6% 82.4%
─────────────────────────────────────────────────────────────────────────────────────
Uppers All 3.7% 7.0% 11.9% 88.1%
Grade 7 0.7% 1.4% 2.9% 97.1%
Grade 8 2.6% 5.6% 7.9% 92.1%
Grade 9 5.6% 10.3% 15.9% 84.1%
Grade 10 4.7% 9.9% 16.8% 83.2%
Grade 11 5.6% 7.6% 15.2% 84.8%
Grade 12 3.3% 7.4% 13.5% 86.5%
─────────────────────────────────────────────────────────────────────────────────────
Downers All 2.7% 5.6% 8.7% 91.3%
Grade 7 0.7% 1.7% 2.1% 97.9%
Grade 8 1.3% 4.2% 6.5% 93.5%
Grade 9 5.2% 8.3% 12.2% 87.8%
Grade 10 2.2% 7.0% 10.5% 89.5%
Grade 11 3.5% 6.0% 11.6% 88.4%
Grade 12 3.3% 6.6% 10.8% 89.2%
─────────────────────────────────────────────────────────────────────────────────────
Rohypnol All 2.0% 3.3% 6.4% 93.6%
Grade 7 0.7% 0.7% 1.7% 98.3%
Grade 8 2.0% 4.2% 5.5% 94.5%
Grade 9 3.4% 5.5% 7.7% 92.3%
Grade 10 2.2% 3.5% 7.4% 92.6%
Grade 11 2.0% 2.5% 8.5% 91.5%
Grade 12 1.9% 3.3% 9.3% 90.7%

8/14/2019 WILLIAMSON COUNTY - Round Rock ISD - 1998 Texas School Survey of Drug and Alcohol Use
http://slidepdf.com/reader/full/williamson-county-round-rock-isd-1998-texas-school-survey-of-drug-and-alcohol 79/213
─────────────────────────────────────────────────────────────────────────────────────
Steroids All 0.3% 1.0% 1.6% 98.4%
Grade 7 0.7% 1.4% 2.1% 97.9%
Grade 8 0.3% 1.0% 1.7% 98.3%
Grade 9 * % 0.4% 1.3% 98.7%
Grade 10 0.4% 0.4% 1.3% 98.7%
Grade 11 0.5% 2.5% 2.5% 97.5%
Grade 12 * % 0.5% 0.9% 99.1%─────────────────────────────────────────────────────────────────────────────────────
Ecstasy All 1.5% 2.6% 5.0% 95.0%
Grade 7 0.4% 0.7% 1.4% 98.6%
Grade 8 1.0% 1.7% 2.7% 97.3%
Grade 9 1.7% 2.2% 6.0% 94.0%
Grade 10 0.9% 1.7% 4.8% 95.2%
Grade 11 3.0% 5.1% 7.6% 92.4%
Grade 12 2.8% 5.7% 9.4% 90.6%
─────────────────────────────────────────────────────────────────────────────────────
Heroin All 0.3% 0.4% 1.2% 98.8%
Grade 7 0.4% 0.4% 1.1% 98.9%
Grade 8 0.3% 0.3% 0.7% 99.3%Grade 9 0.4% 0.8% 1.7% 98.3%
Grade 10 0.4% 0.4% 1.7% 98.3%
Grade 11 * % 0.5% 1.0% 99.0%
Grade 12 * % * % 0.9% 99.1%
Round Rock
Spring 1998

8/14/2019 WILLIAMSON COUNTY - Round Rock ISD - 1998 Texas School Survey of Drug and Alcohol Use
http://slidepdf.com/reader/full/williamson-county-round-rock-isd-1998-texas-school-survey-of-drug-and-alcohol 80/213
Table B4: Prevalence and recency of use of selected substances by grade
--> White students
Past School Ever Never
Month Year Used Used
─────────────────────────────────────────────────────────────────────────────────────
Tobacco All 27.3% 36.4% 52.1% 47.9%Grade 7 11.9% 18.8% 32.5% 67.5%
Grade 8 21.2% 27.6% 43.1% 56.9%
Grade 9 27.5% 39.7% 56.4% 43.6%
Grade 10 30.4% 41.9% 56.0% 44.0%
Grade 11 39.5% 47.3% 64.4% 35.6%
Grade 12 38.9% 47.8% 65.8% 34.2%
─────────────────────────────────────────────────────────────────────────────────────
Alcohol All 36.9% 50.7% 69.5% 30.5%
Grade 7 16.6% 22.7% 44.9% 55.1%
Grade 8 25.8% 35.1% 54.9% 45.1%
Grade 9 38.5% 55.2% 73.4% 26.6%
Grade 10 42.3% 59.5% 78.7% 21.3%Grade 11 48.2% 68.8% 85.5% 14.5%
Grade 12 57.5% 71.7% 86.7% 13.3%
─────────────────────────────────────────────────────────────────────────────────────
Inhalants All 6.8% 10.1% 20.8% 79.2%
Grade 7 7.1% 11.4% 20.5% 79.5%
Grade 8 8.8% 13.1% 23.8% 76.2%
Grade 9 8.4% 11.0% 21.2% 78.8%
Grade 10 7.1% 9.7% 22.1% 77.9%
Grade 11 4.9% 7.4% 17.3% 82.7%
Grade 12 3.2% 6.3% 18.7% 81.3%
─────────────────────────────────────────────────────────────────────────────────────
Any Illicit Drug All 17.7% 25.7% 33.7% 66.3%
Grade 7 6.1% 8.4% 12.4% 87.6%
Grade 8 11.4% 17.6% 23.8% 76.2%
Grade 9 17.7% 27.8% 38.0% 62.0%
Grade 10 21.0% 31.7% 40.2% 59.8%
Grade 11 28.7% 38.3% 48.9% 51.1%
Grade 12 26.0% 35.6% 44.4% 55.6%
─────────────────────────────────────────────────────────────────────────────────────
Marijuana All 15.8% 24.0% 31.8% 68.2%
Grade 7 5.1% 7.6% 11.2% 88.8%
Grade 8 9.6% 14.6% 21.1% 78.9%
Grade 9 15.0% 25.2% 34.5% 65.5%
Grade 10 19.3% 29.7% 39.2% 60.8%
Grade 11 26.8% 37.1% 46.8% 53.2%

8/14/2019 WILLIAMSON COUNTY - Round Rock ISD - 1998 Texas School Survey of Drug and Alcohol Use
http://slidepdf.com/reader/full/williamson-county-round-rock-isd-1998-texas-school-survey-of-drug-and-alcohol 81/213
Grade 12 23.2% 35.0% 44.3% 55.7%
─────────────────────────────────────────────────────────────────────────────────────
Marijuana Only All 4.5% 8.7% 13.9% 86.1%
Grade 7 2.0% 3.8% 6.3% 93.7%
Grade 8 3.6% 5.5% 9.2% 90.8%
Grade 9 3.6% 8.9% 16.1% 83.9%
Grade 10 5.9% 12.1% 18.6% 81.4%
Grade 11 7.0% 11.9% 17.2% 82.8%Grade 12 6.3% 11.7% 17.7% 82.3%
─────────────────────────────────────────────────────────────────────────────────────
Cocaine or Crack All 2.5% 4.2% 7.4% 92.6%
Grade 7 1.0% 1.8% 2.8% 97.2%
Grade 8 1.0% 1.9% 4.1% 95.9%
Grade 9 1.2% 2.7% 6.6% 93.4%
Grade 10 2.1% 5.4% 8.4% 91.6%
Grade 11 7.5% 9.6% 14.6% 85.4%
Grade 12 3.8% 5.4% 9.9% 90.1%
─────────────────────────────────────────────────────────────────────────────────────
Cocaine All 2.3% 3.8% 6.8% 93.2%
Grade 7 0.8% 0.8% 1.6% 98.4%Grade 8 0.5% 1.2% 3.4% 96.6%
Grade 9 1.2% 2.7% 6.4% 93.6%
Grade 10 2.1% 5.4% 8.1% 91.9%
Grade 11 7.2% 9.4% 13.7% 86.3%
Grade 12 3.5% 5.1% 9.6% 90.4%
Round Rock
Spring 1998

8/14/2019 WILLIAMSON COUNTY - Round Rock ISD - 1998 Texas School Survey of Drug and Alcohol Use
http://slidepdf.com/reader/full/williamson-county-round-rock-isd-1998-texas-school-survey-of-drug-and-alcohol 82/213
Table B4 continued from previous page
Past School Ever Never
Month Year Used Used
─────────────────────────────────────────────────────────────────────────────────────
Crack All 0.6% 1.2% 2.6% 97.4%
Grade 7 1.0% 1.8% 2.6% 97.4%Grade 8 0.7% 1.0% 2.0% 98.0%
Grade 9 * % 0.3% 1.8% 98.2%
Grade 10 0.3% 1.5% 2.7% 97.3%
Grade 11 0.7% 1.8% 4.6% 95.4%
Grade 12 0.6% 1.0% 2.3% 97.7%
─────────────────────────────────────────────────────────────────────────────────────
Hallucinogens All 4.7% 8.0% 12.0% 88.0%
Grade 7 1.9% 2.7% 2.9% 97.1%
Grade 8 1.5% 4.6% 7.3% 92.7%
Grade 9 4.6% 6.1% 10.7% 89.3%
Grade 10 5.4% 9.9% 13.5% 86.5%
Grade 11 9.0% 14.3% 21.9% 78.1%Grade 12 7.1% 12.6% 19.0% 81.0%
─────────────────────────────────────────────────────────────────────────────────────
Uppers All 4.3% 7.4% 11.8% 88.2%
Grade 7 1.1% 2.2% 3.3% 96.7%
Grade 8 2.5% 5.0% 7.3% 92.7%
Grade 9 4.9% 8.9% 14.4% 85.6%
Grade 10 4.5% 9.3% 15.1% 84.9%
Grade 11 8.4% 11.3% 18.6% 81.4%
Grade 12 4.9% 8.4% 13.3% 86.7%
─────────────────────────────────────────────────────────────────────────────────────
Downers All 2.9% 5.5% 8.6% 91.4%
Grade 7 0.8% 1.9% 1.9% 98.1%Grade 8 1.0% 3.9% 5.9% 94.1%
Grade 9 4.0% 6.8% 11.5% 88.5%
Grade 10 2.7% 6.7% 10.1% 89.9%
Grade 11 5.5% 7.3% 12.8% 87.2%
Grade 12 3.9% 6.9% 10.2% 89.8%
─────────────────────────────────────────────────────────────────────────────────────
Rohypnol All 2.2% 3.3% 6.4% 93.6%
Grade 7 1.9% 1.9% 2.9% 97.1%
Grade 8 1.0% 3.0% 5.0% 95.0%
Grade 9 2.5% 3.1% 4.6% 95.4%
Grade 10 1.8% 3.6% 6.4% 93.6%
Grade 11 3.6% 5.1% 11.6% 88.4%
Grade 12 2.6% 3.9% 9.7% 90.3%

8/14/2019 WILLIAMSON COUNTY - Round Rock ISD - 1998 Texas School Survey of Drug and Alcohol Use
http://slidepdf.com/reader/full/williamson-county-round-rock-isd-1998-texas-school-survey-of-drug-and-alcohol 83/213
─────────────────────────────────────────────────────────────────────────────────────
Steroids All 0.5% 1.0% 2.2% 97.8%
Grade 7 0.8% 1.1% 2.5% 97.5%
Grade 8 0.7% 1.2% 2.7% 97.3%
Grade 9 * % 0.3% 1.2% 98.8%
Grade 10 * % * % 1.5% 98.5%
Grade 11 1.4% 3.6% 4.0% 96.0%
Grade 12 0.3% 0.3% 1.9% 98.1%─────────────────────────────────────────────────────────────────────────────────────
Ecstasy All 2.2% 3.8% 6.1% 93.9%
Grade 7 * % * % 0.3% 99.7%
Grade 8 0.8% 1.5% 2.5% 97.5%
Grade 9 1.9% 2.8% 5.2% 94.8%
Grade 10 2.1% 4.3% 6.7% 93.3%
Grade 11 5.5% 8.8% 12.4% 87.6%
Grade 12 3.6% 6.8% 11.4% 88.6%
─────────────────────────────────────────────────────────────────────────────────────
Heroin All 0.3% 0.4% 1.6% 98.4%
Grade 7 0.5% 0.5% 1.1% 98.9%
Grade 8 0.3% 0.3% 1.0% 99.0%Grade 9 0.3% 0.3% 2.2% 97.8%
Grade 10 * % * % 2.1% 97.9%
Grade 11 0.7% 1.4% 1.8% 98.2%
Grade 12 0.3% 0.3% 1.6% 98.4%
Round Rock
Spring 1998

8/14/2019 WILLIAMSON COUNTY - Round Rock ISD - 1998 Texas School Survey of Drug and Alcohol Use
http://slidepdf.com/reader/full/williamson-county-round-rock-isd-1998-texas-school-survey-of-drug-and-alcohol 84/213
Table B5: Prevalence and recency of use of selected substances by grade
--> Black students
Past School Ever Never
Month Year Used Used
─────────────────────────────────────────────────────────────────────────────────────
Tobacco All 12.5% 23.2% 40.3% 59.7%Grade 7 5.6% 16.7% 33.3% 66.7%
Grade 8 20.9% 30.2% 41.9% 58.1%
Grade 9 8.0% 16.0% 40.0% 60.0%
Grade 10 5.9% 23.5% 35.3% 64.7%
Grade 11 9.5% 19.0% 28.6% 71.4%
Grade 12 29.4% 41.2% 76.5% 23.5%
─────────────────────────────────────────────────────────────────────────────────────
Alcohol All 26.5% 42.6% 65.0% 35.0%
Grade 7 22.2% 41.7% 63.9% 36.1%
Grade 8 32.6% 39.5% 60.5% 39.5%
Grade 9 16.0% 36.0% 68.0% 32.0%
Grade 10 17.6% 41.2% 64.7% 35.3%Grade 11 27.3% 40.9% 59.1% 40.9%
Grade 12 52.9% 70.6% 82.4% 17.6%
─────────────────────────────────────────────────────────────────────────────────────
Inhalants All 9.1% 11.4% 15.8% 84.2%
Grade 7 11.1% 16.7% 22.2% 77.8%
Grade 8 16.3% 18.6% 23.3% 76.7%
Grade 9 4.2% 4.2% 12.5% 87.5%
Grade 10 11.8% 11.8% 11.8% 88.2%
Grade 11 4.5% 4.5% 4.5% 95.5%
Grade 12 * % 5.6% 11.1% 88.9%
─────────────────────────────────────────────────────────────────────────────────────
Any Illicit Drug All 11.4% 19.7% 35.6% 64.4%Grade 7 8.3% 8.3% 13.9% 86.1%
Grade 8 14.0% 25.6% 32.6% 67.4%
Grade 9 4.0% 4.0% 32.0% 68.0%
Grade 10 11.8% 35.3% 41.2% 58.8%
Grade 11 13.6% 18.2% 54.5% 45.5%
Grade 12 23.5% 47.1% 64.7% 35.3%
─────────────────────────────────────────────────────────────────────────────────────
Marijuana All 8.9% 17.2% 34.3% 65.7%
Grade 7 8.3% 8.3% 13.9% 86.1%
Grade 8 9.3% 20.9% 30.2% 69.8%
Grade 9 * % * % 28.0% 72.0%
Grade 10 11.8% 35.3% 41.2% 58.8%
Grade 11 9.1% 13.6% 54.5% 45.5%
G d 12 23 5% 47 1% 64 7% 35 3%

8/14/2019 WILLIAMSON COUNTY - Round Rock ISD - 1998 Texas School Survey of Drug and Alcohol Use
http://slidepdf.com/reader/full/williamson-county-round-rock-isd-1998-texas-school-survey-of-drug-and-alcohol 85/213
Grade 12 23.5% 47.1% 64.7% 35.3%
─────────────────────────────────────────────────────────────────────────────────────
Marijuana Only All 5.9% 12.5% 26.1% 73.9%
Grade 7 5.4% 5.4% 8.1% 91.9%
Grade 8 4.7% 11.6% 18.6% 81.4%
Grade 9 * % * % 20.0% 80.0%
Grade 10 5.9% 29.4% 35.3% 64.7%
Grade 11 9.1% 13.6% 50.0% 50.0%Grade 12 16.7% 33.3% 50.0% 50.0%
─────────────────────────────────────────────────────────────────────────────────────
Cocaine or Crack All 1.7% 3.0% 3.5% 96.5%
Grade 7 2.9% 2.9% 2.9% 97.1%
Grade 8 4.7% 4.7% 7.0% 93.0%
Grade 9 * % * % * % 100.0%
Grade 10 * % 5.9% 5.9% 94.1%
Grade 11 * % * % * % 100.0%
Grade 12 * % 5.9% 5.9% 94.1%
─────────────────────────────────────────────────────────────────────────────────────
Cocaine All 1.2% 1.8% 2.3% 97.7%
Grade 7 3.0% 3.0% 3.0% 97.0%Grade 8 2.4% 2.4% 4.8% 95.2%
Grade 9 * % * % * % 100.0%
Grade 10 * % * % * % 100.0%
Grade 11 * % * % * % 100.0%
Grade 12 * % 6.3% 6.3% 93.8%
Round Rock
Spring 1998

8/14/2019 WILLIAMSON COUNTY - Round Rock ISD - 1998 Texas School Survey of Drug and Alcohol Use
http://slidepdf.com/reader/full/williamson-county-round-rock-isd-1998-texas-school-survey-of-drug-and-alcohol 86/213
Table B5 continued from previous page
Past School Ever Never
Month Year Used Used
─────────────────────────────────────────────────────────────────────────────────────
Crack All 1.1% 1.8% 2.4% 97.6%
Grade 7 * % * % * % 100.0%Grade 8 4.7% 4.7% 7.0% 93.0%
Grade 9 * % * % * % 100.0%
Grade 10 * % 5.9% 5.9% 94.1%
Grade 11 * % * % * % 100.0%
Grade 12 * % * % * % 100.0%
─────────────────────────────────────────────────────────────────────────────────────
Hallucinogens All 0.7% 1.3% 2.0% 98.0%
Grade 7 * % * % * % 100.0%
Grade 8 * % 2.4% 2.4% 97.6%
Grade 9 * % * % 4.0% 96.0%
Grade 10 5.9% 5.9% 5.9% 94.1%
Grade 11 * % * % * % 100.0%Grade 12 * % * % * % 100.0%
─────────────────────────────────────────────────────────────────────────────────────
Uppers All 1.3% 2.1% 4.9% 95.1%
Grade 7 * % * % * % 100.0%
Grade 8 2.4% 2.4% 4.8% 95.2%
Grade 9 * % 4.2% 12.5% 87.5%
Grade 10 5.9% 5.9% 5.9% 94.1%
Grade 11 * % * % * % 100.0%
Grade 12 * % * % 6.7% 93.3%
─────────────────────────────────────────────────────────────────────────────────────
Downers All 1.3% 1.3% 1.9% 98.1%
Grade 7 * % * % * % 100.0%Grade 8 2.4% 2.4% 4.8% 95.2%
Grade 9 * % * % * % 100.0%
Grade 10 5.9% 5.9% 5.9% 94.1%
Grade 11 * % * % * % 100.0%
Grade 12 * % * % * % 100.0%
─────────────────────────────────────────────────────────────────────────────────────
Rohypnol All 0.7% 1.3% 1.3% 98.7%
Grade 7 * % * % * % 100.0%
Grade 8 * % 2.3% 2.3% 97.7%
Grade 9 * % * % * % 100.0%
Grade 10 5.9% 5.9% 5.9% 94.1%

8/14/2019 WILLIAMSON COUNTY - Round Rock ISD - 1998 Texas School Survey of Drug and Alcohol Use
http://slidepdf.com/reader/full/williamson-county-round-rock-isd-1998-texas-school-survey-of-drug-and-alcohol 87/213
Round Rock
Spring 1998

8/14/2019 WILLIAMSON COUNTY - Round Rock ISD - 1998 Texas School Survey of Drug and Alcohol Use
http://slidepdf.com/reader/full/williamson-county-round-rock-isd-1998-texas-school-survey-of-drug-and-alcohol 88/213
Table B6: Prevalence and recency of use of selected substances by grade
--> Mexican/American students
Past School Ever Never
Month Year Used Used
─────────────────────────────────────────────────────────────────────────────────────
Tobacco All 34.2% 47.6% 67.1% 32.9%
Grade 7 25.4% 43.7% 63.4% 36.6%
Grade 8 32.5% 46.3% 57.5% 42.5%
Grade 9 33.3% 42.1% 70.2% 29.8%
Grade 10 38.3% 53.3% 71.7% 28.3%
Grade 11 40.6% 50.0% 68.8% 31.3%
Grade 12 41.9% 55.8% 76.7% 23.3%
─────────────────────────────────────────────────────────────────────────────────────
Alcohol All 49.8% 66.8% 81.7% 18.3%
Grade 7 32.4% 52.1% 74.6% 25.4%
Grade 8 46.9% 61.7% 79.0% 21.0%
Grade 9 52.6% 70.2% 86.0% 14.0%
Grade 10 57.6% 76.3% 83.1% 16.9%Grade 11 65.6% 81.2% 90.6% 9.4%
Grade 12 53.5% 67.4% 81.4% 18.6%
─────────────────────────────────────────────────────────────────────────────────────
Inhalants All 12.2% 19.6% 35.3% 64.7%
Grade 7 12.9% 20.0% 35.7% 64.3%
Grade 8 23.5% 30.9% 54.3% 45.7%
Grade 9 7.0% 15.8% 28.1% 71.9%
Grade 10 10.2% 18.6% 30.5% 69.5%
Grade 11 12.5% 18.8% 37.5% 62.5%
Grade 12 2.3% 7.0% 18.6% 81.4%
─────────────────────────────────────────────────────────────────────────────────────
Any Illicit Drug All 30.9% 41.7% 56.2% 43.8%Grade 7 18.3% 22.5% 33.8% 66.2%
Grade 8 30.9% 38.3% 49.4% 50.6%
Grade 9 36.8% 52.6% 68.4% 31.6%
Grade 10 33.9% 49.2% 64.4% 35.6%
Grade 11 40.6% 46.9% 62.5% 37.5%
Grade 12 28.6% 45.2% 66.7% 33.3%
─────────────────────────────────────────────────────────────────────────────────────
Marijuana All 28.0% 40.6% 54.9% 45.1%
Grade 7 14.5% 21.7% 33.3% 66.7%
Grade 8 25.9% 35.8% 46.9% 53.1%
Grade 9 36.8% 50.9% 66.7% 33.3%
Grade 10 29.3% 48.3% 63.8% 36.2%
Grade 11 37.5% 46.9% 62.5% 37.5%
Grade 12 28 6% 45 2% 64 3% 35 7%

8/14/2019 WILLIAMSON COUNTY - Round Rock ISD - 1998 Texas School Survey of Drug and Alcohol Use
http://slidepdf.com/reader/full/williamson-county-round-rock-isd-1998-texas-school-survey-of-drug-and-alcohol 89/213
Grade 12 28.6% 45.2% 64.3% 35.7%
─────────────────────────────────────────────────────────────────────────────────────
Marijuana Only All 10.5% 18.6% 28.2% 71.8%
Grade 7 8.5% 11.3% 21.1% 78.9%
Grade 8 8.6% 13.6% 22.2% 77.8%
Grade 9 15.8% 29.8% 43.9% 56.1%
Grade 10 9.8% 19.7% 23.0% 77.0%
Grade 11 12.5% 15.6% 25.0% 75.0%
Grade 12 7.0% 20.9% 34.9% 65.1%
─────────────────────────────────────────────────────────────────────────────────────
Cocaine or Crack All 6.1% 9.5% 15.2% 84.8%
Grade 7 2.9% 5.8% 7.2% 92.8%
Grade 8 8.7% 10.0% 15.0% 85.0%
Grade 9 3.5% 8.8% 14.0% 86.0%
Grade 10 10.3% 13.8% 20.7% 79.3%
Grade 11 3.1% 9.4% 18.8% 81.3%
Grade 12 7.1% 9.5% 19.0% 81.0%
─────────────────────────────────────────────────────────────────────────────────────
Cocaine All 5.2% 8.9% 14.8% 85.2%
Grade 7 1.4% 4.3% 7.2% 92.8%Grade 8 7.6% 10.1% 15.2% 84.8%
Grade 9 1.8% 7.0% 12.3% 87.7%
Grade 10 10.3% 13.8% 20.7% 79.3%
Grade 11 3.1% 9.4% 18.8% 81.3%
Grade 12 7.1% 9.5% 19.0% 81.0%

8/14/2019 WILLIAMSON COUNTY - Round Rock ISD - 1998 Texas School Survey of Drug and Alcohol Use
http://slidepdf.com/reader/full/williamson-county-round-rock-isd-1998-texas-school-survey-of-drug-and-alcohol 90/213
Grade 11 * % * % 9.4% 90.6%
Grade 12 * % * % 4.9% 95.1%
─────────────────────────────────────────────────────────────────────────────────────
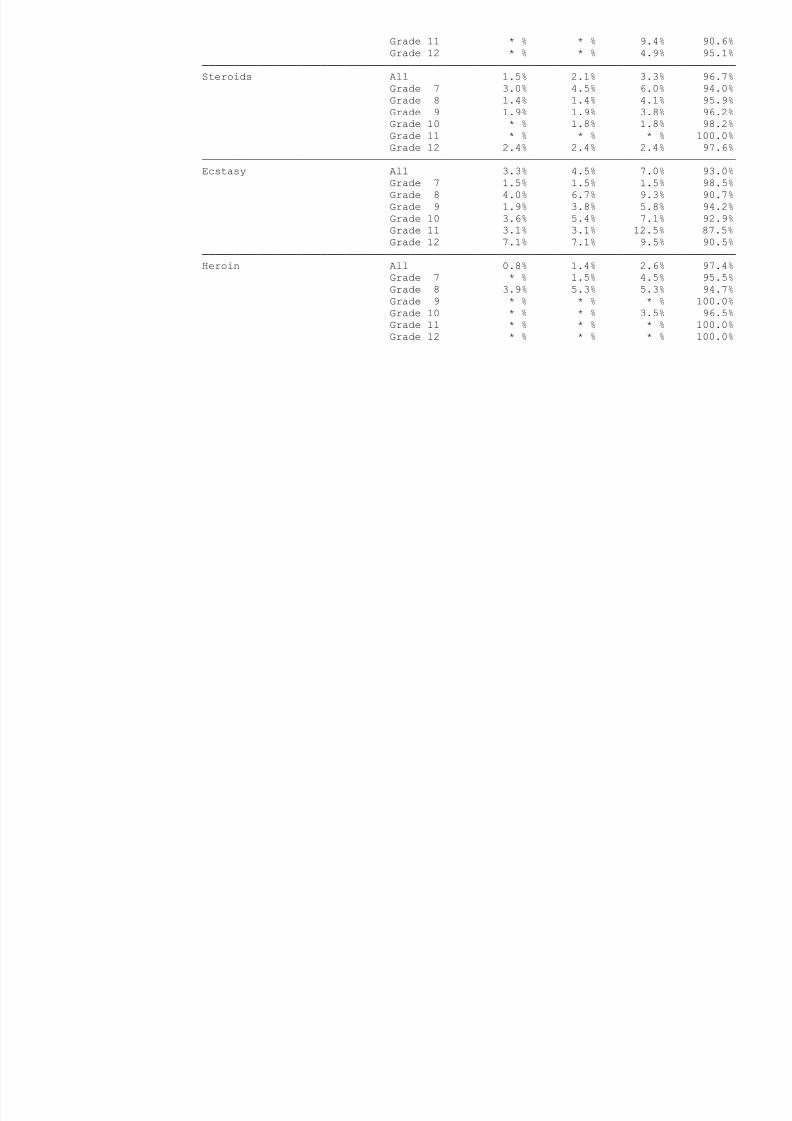
8/14/2019 WILLIAMSON COUNTY - Round Rock ISD - 1998 Texas School Survey of Drug and Alcohol Use
http://slidepdf.com/reader/full/williamson-county-round-rock-isd-1998-texas-school-survey-of-drug-and-alcohol 91/213
Steroids All 1.5% 2.1% 3.3% 96.7%
Grade 7 3.0% 4.5% 6.0% 94.0%
Grade 8 1.4% 1.4% 4.1% 95.9%
Grade 9 1.9% 1.9% 3.8% 96.2%
Grade 10 * % 1.8% 1.8% 98.2%
Grade 11 * % * % * % 100.0%
Grade 12 2.4% 2.4% 2.4% 97.6%
─────────────────────────────────────────────────────────────────────────────────────
Ecstasy All 3.3% 4.5% 7.0% 93.0%
Grade 7 1.5% 1.5% 1.5% 98.5%
Grade 8 4.0% 6.7% 9.3% 90.7%
Grade 9 1.9% 3.8% 5.8% 94.2%
Grade 10 3.6% 5.4% 7.1% 92.9%
Grade 11 3.1% 3.1% 12.5% 87.5%
Grade 12 7.1% 7.1% 9.5% 90.5%
─────────────────────────────────────────────────────────────────────────────────────
Heroin All 0.8% 1.4% 2.6% 97.4%
Grade 7 * % 1.5% 4.5% 95.5%
Grade 8 3.9% 5.3% 5.3% 94.7%Grade 9 * % * % * % 100.0%
Grade 10 * % * % 3.5% 96.5%
Grade 11 * % * % * % 100.0%
Grade 12 * % * % * % 100.0%
Round Rock
Spring 1998

8/14/2019 WILLIAMSON COUNTY - Round Rock ISD - 1998 Texas School Survey of Drug and Alcohol Use
http://slidepdf.com/reader/full/williamson-county-round-rock-isd-1998-texas-school-survey-of-drug-and-alcohol 92/213
Table B7: Prevalence and recency of use of selected substances by grade
--> Students reporting A and B grades
Past School Ever Never
Month Year Used Used
─────────────────────────────────────────────────────────────────────────────────────
Tobacco All 22.1% 31.3% 47.2% 52.8%
Grade 7 10.1% 18.0% 31.5% 68.5%
Grade 8 17.9% 24.6% 40.0% 60.0%
Grade 9 20.8% 31.6% 50.5% 49.5%
Grade 10 24.2% 36.5% 50.9% 49.1%
Grade 11 33.5% 42.1% 57.0% 43.0%
Grade 12 33.2% 41.6% 60.5% 39.5%
─────────────────────────────────────────────────────────────────────────────────────
Alcohol All 33.3% 47.4% 66.4% 33.6%
Grade 7 15.9% 24.4% 45.6% 54.4%
Grade 8 26.1% 34.7% 53.9% 46.1%
Grade 9 34.4% 50.7% 69.6% 30.4%
Grade 10 35.9% 55.0% 74.7% 25.3%Grade 11 45.0% 64.2% 82.4% 17.6%
Grade 12 52.1% 67.0% 82.7% 17.3%
─────────────────────────────────────────────────────────────────────────────────────
Inhalants All 5.6% 9.0% 18.6% 81.4%
Grade 7 6.5% 10.7% 20.2% 79.8%
Grade 8 8.8% 13.0% 23.9% 76.1%
Grade 9 5.5% 8.7% 16.8% 83.2%
Grade 10 4.6% 7.5% 17.5% 82.5%
Grade 11 4.4% 6.6% 15.0% 85.0%
Grade 12 2.4% 5.8% 16.2% 83.8%
─────────────────────────────────────────────────────────────────────────────────────
Any Illicit Drug All 15.2% 22.5% 30.8% 69.2%Grade 7 6.1% 8.3% 12.3% 87.7%
Grade 8 10.0% 15.4% 22.8% 77.2%
Grade 9 13.4% 21.8% 32.4% 67.6%
Grade 10 18.8% 28.9% 37.4% 62.6%
Grade 11 25.5% 35.2% 45.9% 54.1%
Grade 12 22.9% 32.7% 43.1% 56.9%
─────────────────────────────────────────────────────────────────────────────────────
Marijuana All 13.3% 21.0% 28.9% 71.1%
Grade 7 4.8% 7.8% 11.3% 88.7%
Grade 8 7.7% 12.9% 20.2% 79.8%
Grade 9 11.3% 19.7% 28.7% 71.3%

8/14/2019 WILLIAMSON COUNTY - Round Rock ISD - 1998 Texas School Survey of Drug and Alcohol Use
http://slidepdf.com/reader/full/williamson-county-round-rock-isd-1998-texas-school-survey-of-drug-and-alcohol 93/213
Round Rock
Spring 1998

8/14/2019 WILLIAMSON COUNTY - Round Rock ISD - 1998 Texas School Survey of Drug and Alcohol Use
http://slidepdf.com/reader/full/williamson-county-round-rock-isd-1998-texas-school-survey-of-drug-and-alcohol 94/213
Table B7 continued from previous page
Past School Ever Never
Month Year Used Used
─────────────────────────────────────────────────────────────────────────────────────
Crack All 0.6% 1.0% 2.0% 98.0%
Grade 7 0.8% 0.8% 1.6% 98.4%
Grade 8 0.6% 1.2% 1.8% 98.2%
Grade 9 0.3% 0.5% 1.6% 98.4%
Grade 10 0.8% 1.8% 2.4% 97.6%
Grade 11 0.6% 1.3% 3.5% 96.5%
Grade 12 0.3% 0.3% 1.6% 98.4%
─────────────────────────────────────────────────────────────────────────────────────
Hallucinogens All 3.1% 5.8% 9.3% 90.7%
Grade 7 1.0% 1.9% 2.1% 97.9%
Grade 8 1.2% 4.3% 7.1% 92.9%
Grade 9 2.1% 3.5% 7.0% 93.0%
Grade 10 3.4% 7.1% 10.5% 89.5%
Grade 11 6.3% 11.1% 17.5% 82.5%Grade 12 6.2% 10.0% 16.2% 83.8%
─────────────────────────────────────────────────────────────────────────────────────
Uppers All 3.0% 5.1% 8.6% 91.4%
Grade 7 1.1% 1.7% 2.8% 97.2%
Grade 8 1.8% 3.2% 5.0% 95.0%
Grade 9 3.3% 6.0% 9.8% 90.2%
Grade 10 3.9% 6.8% 12.0% 88.0%
Grade 11 5.8% 8.0% 13.5% 86.5%
Grade 12 2.7% 5.7% 10.7% 89.3%
─────────────────────────────────────────────────────────────────────────────────────
Downers All 2.1% 3.9% 6.4% 93.6%
Grade 7 1.0% 1.9% 1.9% 98.1%Grade 8 0.8% 2.4% 4.0% 96.0%
Grade 9 2.5% 4.4% 7.7% 92.3%
Grade 10 2.1% 4.5% 7.9% 92.1%
Grade 11 3.9% 6.2% 10.4% 89.6%
Grade 12 2.8% 5.2% 8.6% 91.4%
─────────────────────────────────────────────────────────────────────────────────────
Rohypnol All 1.3% 2.2% 4.9% 95.1%
Grade 7 1.2% 1.2% 2.1% 97.9%
Grade 8 1.2% 2.2% 3.8% 96.2%
Grade 9 1.6% 2.2% 3.8% 96.2%
Grade 10 1.1% 2.4% 5.8% 94.2%
Grade 11 1.6% 2.6% 8.0% 92.0%
Grade 12 1.4% 2.7% 7.3% 92.7%
─────────────────────────────────────────────────────────────────────────────────────

8/14/2019 WILLIAMSON COUNTY - Round Rock ISD - 1998 Texas School Survey of Drug and Alcohol Use
http://slidepdf.com/reader/full/williamson-county-round-rock-isd-1998-texas-school-survey-of-drug-and-alcohol 95/213
Steroids All 0.5% 0.9% 1.9% 98.1%
Grade 7 0.6% 1.1% 2.3% 97.7%
Grade 8 0.4% 0.6% 2.0% 98.0%
Grade 9 0.3% 0.5% 1.1% 98.9%
Grade 10 0.3% 0.3% 1.3% 98.7%
Grade 11 1.3% 2.9% 2.9% 97.1%
Grade 12 0.3% 0.5% 1.9% 98.1%
─────────────────────────────────────────────────────────────────────────────────────
Ecstasy All 1.1% 2.4% 4.3% 95.7%
Grade 7 0.2% 0.7% 0.9% 99.1%
Grade 8 0.6% 1.2% 2.5% 97.5%
Grade 9 0.8% 1.6% 3.0% 97.0%
Grade 10 1.1% 2.1% 4.3% 95.7%
Grade 11 2.9% 5.5% 9.0% 91.0%
Grade 12 1.9% 4.3% 8.7% 91.3%
─────────────────────────────────────────────────────────────────────────────────────
Heroin All 0.1% 0.3% 1.0% 99.0%
Grade 7 * % 0.2% 0.8% 99.2%
Grade 8 * % * % * % 100.0%Grade 9 * % 0.3% 0.8% 99.2%
Grade 10 0.5% 0.5% 2.1% 97.9%
Grade 11 0.3% 1.0% 1.0% 99.0%
Grade 12 * % * % 1.1% 98.9%
Round Rock
Spring 1998

8/14/2019 WILLIAMSON COUNTY - Round Rock ISD - 1998 Texas School Survey of Drug and Alcohol Use
http://slidepdf.com/reader/full/williamson-county-round-rock-isd-1998-texas-school-survey-of-drug-and-alcohol 96/213
Table B8: Prevalence and recency of use of selected substances by grade
--> Students reporting C, D, and F grades
Past School Ever Never
Month Year Used Used
─────────────────────────────────────────────────────────────────────────────────────
Tobacco All 48.0% 58.8% 78.7% 21.3%
Grade 7 29.6% 39.5% 65.4% 34.6%
Grade 8 48.4% 61.1% 73.7% 26.3%
Grade 9 50.0% 62.8% 85.1% 14.9%
Grade 10 57.3% 68.0% 84.0% 16.0%
Grade 11 50.0% 56.1% 75.8% 24.2%
Grade 12 53.8% 65.4% 88.5% 11.5%
─────────────────────────────────────────────────────────────────────────────────────
Alcohol All 54.4% 69.7% 86.9% 13.1%
Grade 7 37.5% 50.0% 77.5% 22.5%
Grade 8 43.2% 58.9% 77.9% 22.1%
Grade 9 55.3% 74.5% 91.5% 8.5%
Grade 10 73.3% 82.7% 93.3% 6.7%Grade 11 53.0% 72.7% 87.9% 12.1%
Grade 12 69.2% 82.7% 94.2% 5.8%
─────────────────────────────────────────────────────────────────────────────────────
Inhalants All 17.4% 23.1% 39.8% 60.2%
Grade 7 21.0% 27.2% 38.3% 61.7%
Grade 8 26.6% 36.2% 53.2% 46.8%
Grade 9 17.0% 21.3% 40.4% 59.6%
Grade 10 16.0% 22.7% 44.0% 56.0%
Grade 11 12.1% 16.7% 28.8% 71.2%
Grade 12 5.9% 7.8% 25.5% 74.5%
─────────────────────────────────────────────────────────────────────────────────────
Any Illicit Drug All 36.3% 48.4% 61.5% 38.5%Grade 7 17.3% 23.5% 37.0% 63.0%
Grade 8 34.7% 51.6% 57.9% 42.1%
Grade 9 44.7% 58.5% 72.3% 27.7%
Grade 10 43.2% 56.8% 71.6% 28.4%
Grade 11 36.4% 43.9% 63.6% 36.4%
Grade 12 37.3% 51.0% 60.8% 39.2%
─────────────────────────────────────────────────────────────────────────────────────
Marijuana All 33.4% 46.2% 60.1% 39.9%
Grade 7 16.3% 22.5% 33.8% 66.2%
Grade 8 31.2% 48.4% 57.0% 43.0%
Grade 9 41.9% 55.9% 72.0% 28.0%
Grade 10 41.9% 55.4% 70.3% 29.7%
Grade 11 33.3% 42.4% 60.6% 39.4%
Grade 12 29.4% 47.1% 60.8% 39.2%

8/14/2019 WILLIAMSON COUNTY - Round Rock ISD - 1998 Texas School Survey of Drug and Alcohol Use
http://slidepdf.com/reader/full/williamson-county-round-rock-isd-1998-texas-school-survey-of-drug-and-alcohol 97/213
─────────────────────────────────────────────────────────────────────────────────────
Marijuana Only All 7.6% 14.7% 23.0% 77.0%
Grade 7 6.2% 11.1% 19.8% 80.2%
Grade 8 7.4% 15.8% 18.9% 81.1%
Grade 9 10.6% 18.1% 28.7% 71.3%
Grade 10 9.2% 18.4% 27.6% 72.4%
Grade 11 6.1% 12.1% 21.2% 78.8%
Grade 12 1.9% 7.7% 15.4% 84.6%
─────────────────────────────────────────────────────────────────────────────────────
Cocaine or Crack All 8.8% 13.8% 21.0% 79.0%
Grade 7 3.9% 7.9% 10.5% 89.5%
Grade 8 9.5% 11.6% 17.9% 82.1%
Grade 9 6.5% 12.9% 21.5% 78.5%
Grade 10 9.9% 16.9% 28.2% 71.8%
Grade 11 13.6% 18.2% 22.7% 77.3%
Grade 12 11.8% 17.6% 27.5% 72.5%
─────────────────────────────────────────────────────────────────────────────────────
Cocaine All 7.7% 11.7% 19.1% 80.9%
Grade 7 2.7% 2.7% 5.3% 94.7%Grade 8 7.4% 9.6% 16.0% 84.0%
Grade 9 5.4% 11.8% 20.4% 79.6%
Grade 10 9.9% 14.1% 25.4% 74.6%
Grade 11 12.1% 16.7% 22.7% 77.3%
Grade 12 11.8% 17.6% 27.5% 72.5%
Round Rock
Spring 1998
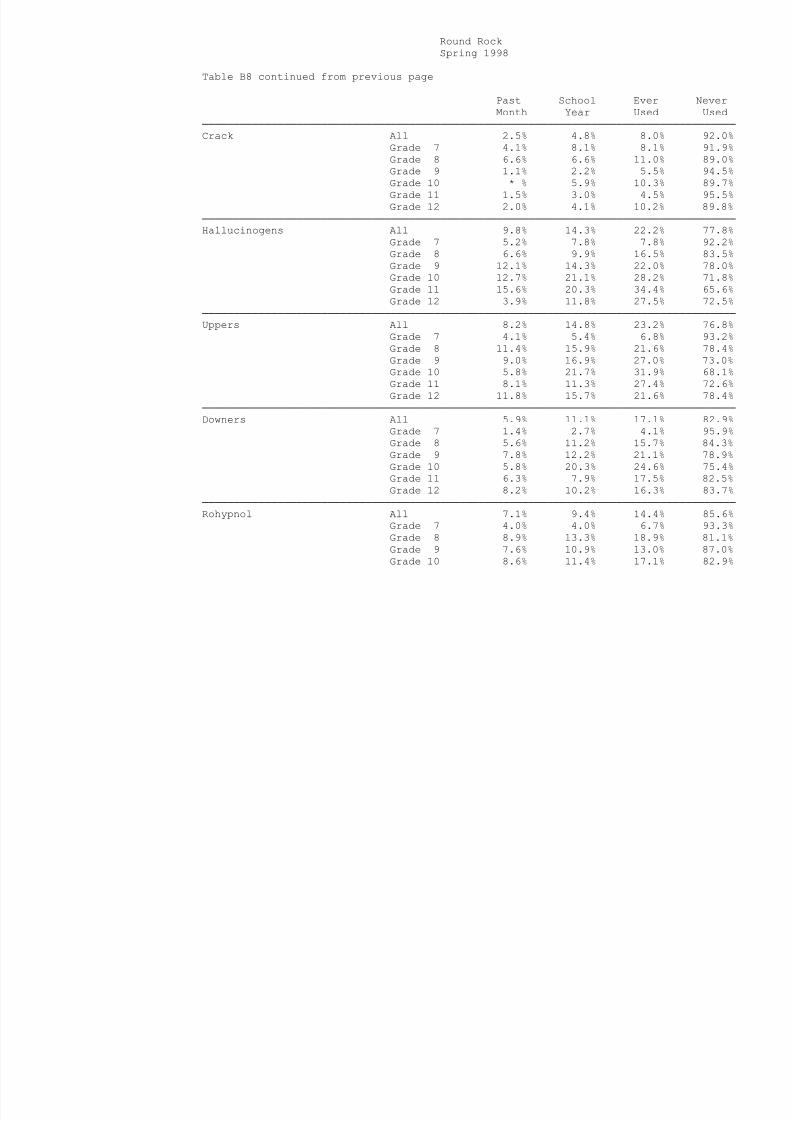
8/14/2019 WILLIAMSON COUNTY - Round Rock ISD - 1998 Texas School Survey of Drug and Alcohol Use
http://slidepdf.com/reader/full/williamson-county-round-rock-isd-1998-texas-school-survey-of-drug-and-alcohol 98/213
Table B8 continued from previous page
Past School Ever Never
Month Year Used Used
─────────────────────────────────────────────────────────────────────────────────────
Crack All 2.5% 4.8% 8.0% 92.0%
Grade 7 4.1% 8.1% 8.1% 91.9%
Grade 8 6.6% 6.6% 11.0% 89.0%
Grade 9 1.1% 2.2% 5.5% 94.5%
Grade 10 * % 5.9% 10.3% 89.7%
Grade 11 1.5% 3.0% 4.5% 95.5%
Grade 12 2.0% 4.1% 10.2% 89.8%
─────────────────────────────────────────────────────────────────────────────────────
Hallucinogens All 9.8% 14.3% 22.2% 77.8%
Grade 7 5.2% 7.8% 7.8% 92.2%
Grade 8 6.6% 9.9% 16.5% 83.5%
Grade 9 12.1% 14.3% 22.0% 78.0%
Grade 10 12.7% 21.1% 28.2% 71.8%
Grade 11 15.6% 20.3% 34.4% 65.6%Grade 12 3.9% 11.8% 27.5% 72.5%
─────────────────────────────────────────────────────────────────────────────────────
Uppers All 8.2% 14.8% 23.2% 76.8%
Grade 7 4.1% 5.4% 6.8% 93.2%
Grade 8 11.4% 15.9% 21.6% 78.4%
Grade 9 9.0% 16.9% 27.0% 73.0%
Grade 10 5.8% 21.7% 31.9% 68.1%
Grade 11 8.1% 11.3% 27.4% 72.6%
Grade 12 11.8% 15.7% 21.6% 78.4%
─────────────────────────────────────────────────────────────────────────────────────
Downers All 5.9% 11.1% 17.1% 82.9%
Grade 7 1.4% 2.7% 4.1% 95.9%Grade 8 5.6% 11.2% 15.7% 84.3%
Grade 9 7.8% 12.2% 21.1% 78.9%
Grade 10 5.8% 20.3% 24.6% 75.4%
Grade 11 6.3% 7.9% 17.5% 82.5%
Grade 12 8.2% 10.2% 16.3% 83.7%
─────────────────────────────────────────────────────────────────────────────────────
Rohypnol All 7.1% 9.4% 14.4% 85.6%
Grade 7 4.0% 4.0% 6.7% 93.3%
Grade 8 8.9% 13.3% 18.9% 81.1%
Grade 9 7.6% 10.9% 13.0% 87.0%
Grade 10 8.6% 11.4% 17.1% 82.9%
Grade 11 6.2% 7.8% 14.1% 85.9%
Grade 12 6.1% 6.1% 18.4% 81.6%
─────────────────────────────────────────────────────────────────────────────────────
S id ll 1 2% 2 4% 4 0% 96 0%
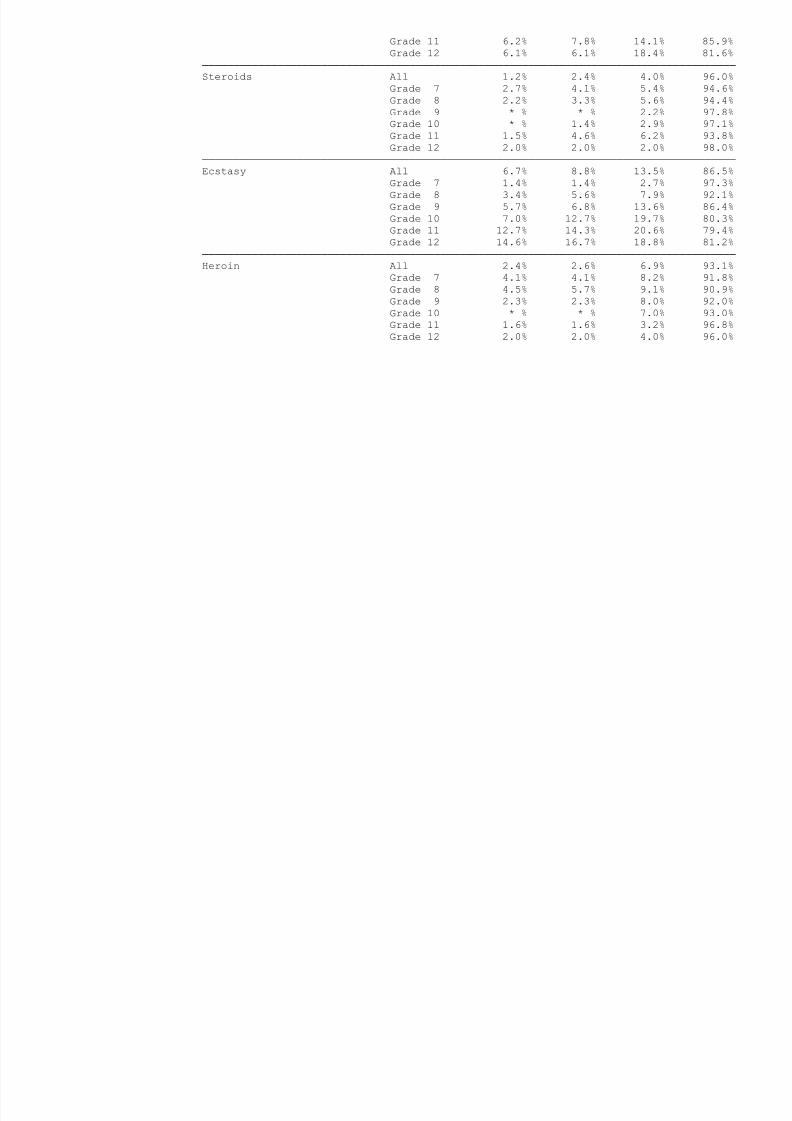
8/14/2019 WILLIAMSON COUNTY - Round Rock ISD - 1998 Texas School Survey of Drug and Alcohol Use
http://slidepdf.com/reader/full/williamson-county-round-rock-isd-1998-texas-school-survey-of-drug-and-alcohol 99/213
Steroids All 1.2% 2.4% 4.0% 96.0%
Grade 7 2.7% 4.1% 5.4% 94.6%
Grade 8 2.2% 3.3% 5.6% 94.4%
Grade 9 * % * % 2.2% 97.8%
Grade 10 * % 1.4% 2.9% 97.1%
Grade 11 1.5% 4.6% 6.2% 93.8%
Grade 12 2.0% 2.0% 2.0% 98.0%
─────────────────────────────────────────────────────────────────────────────────────
Ecstasy All 6.7% 8.8% 13.5% 86.5%
Grade 7 1.4% 1.4% 2.7% 97.3%
Grade 8 3.4% 5.6% 7.9% 92.1%
Grade 9 5.7% 6.8% 13.6% 86.4%
Grade 10 7.0% 12.7% 19.7% 80.3%
Grade 11 12.7% 14.3% 20.6% 79.4%
Grade 12 14.6% 16.7% 18.8% 81.2%
─────────────────────────────────────────────────────────────────────────────────────
Heroin All 2.4% 2.6% 6.9% 93.1%
Grade 7 4.1% 4.1% 8.2% 91.8%
Grade 8 4.5% 5.7% 9.1% 90.9%Grade 9 2.3% 2.3% 8.0% 92.0%
Grade 10 * % * % 7.0% 93.0%
Grade 11 1.6% 1.6% 3.2% 96.8%
Grade 12 2.0% 2.0% 4.0% 96.0%
Round Rock
Spring 1998
T bl B9 P l d f f l t d b t b d

8/14/2019 WILLIAMSON COUNTY - Round Rock ISD - 1998 Texas School Survey of Drug and Alcohol Use
http://slidepdf.com/reader/full/williamson-county-round-rock-isd-1998-texas-school-survey-of-drug-and-alcohol 100/213
Table B9: Prevalence and recency of use of selected substances by grade
--> Students living with two parents
Past School Ever Never
Month Year Used Used
─────────────────────────────────────────────────────────────────────────────────────
Tobacco All 22.7% 30.9% 46.4% 53.6%
Grade 7 9.1% 16.1% 28.8% 71.2%
Grade 8 16.9% 23.4% 37.7% 62.3%
Grade 9 24.7% 33.3% 52.4% 47.6%
Grade 10 26.9% 37.8% 50.8% 49.2%
Grade 11 29.2% 37.1% 54.9% 45.1%
Grade 12 34.5% 42.7% 59.4% 40.6%
─────────────────────────────────────────────────────────────────────────────────────
Alcohol All 32.8% 46.9% 66.1% 33.9%
Grade 7 17.2% 24.3% 44.9% 55.1%
Grade 8 23.0% 31.1% 50.7% 49.3%
Grade 9 32.8% 50.4% 69.9% 30.1%
Grade 10 38.0% 57.0% 76.0% 24.0%Grade 11 41.4% 60.5% 80.5% 19.5%
Grade 12 52.9% 66.9% 82.6% 17.4%
─────────────────────────────────────────────────────────────────────────────────────
Inhalants All 6.7% 9.8% 19.4% 80.6%
Grade 7 7.3% 11.9% 20.5% 79.5%
Grade 8 10.5% 15.0% 25.1% 74.9%
Grade 9 7.8% 9.9% 19.4% 80.6%
Grade 10 5.3% 7.8% 18.3% 81.7%
Grade 11 4.5% 6.3% 15.3% 84.7%
Grade 12 3.1% 6.2% 16.1% 83.9%
─────────────────────────────────────────────────────────────────────────────────────
Any Illicit Drug All 15.4% 22.3% 30.0% 70.0%Grade 7 6.5% 8.6% 11.7% 88.3%
Grade 8 10.5% 16.5% 22.0% 78.0%
Grade 9 16.4% 25.4% 34.6% 65.4%
Grade 10 19.6% 27.1% 34.3% 65.7%
Grade 11 21.1% 29.7% 41.7% 58.3%
Grade 12 21.8% 30.7% 41.3% 58.7%
─────────────────────────────────────────────────────────────────────────────────────
Marijuana All 13.3% 20.7% 28.1% 71.9%
Grade 7 5.0% 7.8% 10.2% 89.8%
Grade 8 7.7% 13.9% 19.2% 80.8%
Grade 9 13.8% 23.1% 32.3% 67.7%

8/14/2019 WILLIAMSON COUNTY - Round Rock ISD - 1998 Texas School Survey of Drug and Alcohol Use
http://slidepdf.com/reader/full/williamson-county-round-rock-isd-1998-texas-school-survey-of-drug-and-alcohol 101/213
Round Rock
Spring 1998
Table B9 continued from previous page

8/14/2019 WILLIAMSON COUNTY - Round Rock ISD - 1998 Texas School Survey of Drug and Alcohol Use
http://slidepdf.com/reader/full/williamson-county-round-rock-isd-1998-texas-school-survey-of-drug-and-alcohol 102/213
Table B9 continued from previous page
Past School Ever Never
Month Year Used Used
─────────────────────────────────────────────────────────────────────────────────────
Crack All 0.7% 1.4% 2.4% 97.6%
Grade 7 0.5% 1.3% 2.4% 97.6%
Grade 8 1.5% 1.5% 2.2% 97.8%
Grade 9 0.6% 0.9% 2.1% 97.9%
Grade 10 0.6% 2.9% 3.2% 96.8%
Grade 11 0.4% 1.1% 2.7% 97.3%
Grade 12 0.3% 0.3% 1.7% 98.3%
─────────────────────────────────────────────────────────────────────────────────────
Hallucinogens All 3.5% 5.9% 9.0% 91.0%
Grade 7 1.1% 2.2% 2.4% 97.6%
Grade 8 1.5% 3.2% 4.6% 95.4%
Grade 9 2.8% 4.0% 7.6% 92.4%
Grade 10 4.4% 7.6% 10.1% 89.9%
Grade 11 6.5% 11.1% 17.2% 82.8%Grade 12 6.6% 10.4% 16.3% 83.7%
─────────────────────────────────────────────────────────────────────────────────────
Uppers All 3.5% 5.9% 9.7% 90.3%
Grade 7 1.4% 2.3% 3.7% 96.3%
Grade 8 2.5% 3.5% 5.8% 94.2%
Grade 9 3.7% 6.5% 11.5% 88.5%
Grade 10 4.8% 9.0% 13.1% 86.9%
Grade 11 5.8% 7.3% 13.5% 86.5%
Grade 12 3.1% 7.0% 11.2% 88.8%
─────────────────────────────────────────────────────────────────────────────────────
Downers All 2.4% 4.3% 6.6% 93.4%
Grade 7 0.8% 1.9% 2.2% 97.8%Grade 8 1.3% 2.5% 4.3% 95.8%
Grade 9 2.5% 4.1% 8.2% 91.8%
Grade 10 3.5% 6.4% 9.2% 90.8%
Grade 11 4.3% 6.7% 8.6% 91.4%
Grade 12 2.5% 5.3% 7.8% 92.2%
─────────────────────────────────────────────────────────────────────────────────────
Rohypnol All 1.7% 2.3% 4.8% 95.2%
Grade 7 1.4% 1.4% 2.5% 97.5%
Grade 8 1.2% 2.2% 3.7% 96.3%
Grade 9 3.1% 3.4% 4.9% 95.1%
Grade 10 1.3% 1.9% 5.4% 94.6%
Grade 11 1.5% 2.3% 5.7% 94.3%
Grade 12 1.7% 2.8% 7.7% 92.3%
─────────────────────────────────────────────────────────────────────────────────────
Steroids All 0 7% 1 2% 2 2% 97 8%

8/14/2019 WILLIAMSON COUNTY - Round Rock ISD - 1998 Texas School Survey of Drug and Alcohol Use
http://slidepdf.com/reader/full/williamson-county-round-rock-isd-1998-texas-school-survey-of-drug-and-alcohol 103/213
Steroids All 0.7% 1.2% 2.2% 97.8%
Grade 7 1.4% 1.7% 3.6% 96.4%
Grade 8 0.2% 0.2% 1.7% 98.3%
Grade 9 0.3% 0.6% 1.5% 98.5%
Grade 10 * % 0.3% 1.3% 98.7%
Grade 11 1.9% 4.2% 4.2% 95.8%
Grade 12 0.3% 0.3% 0.7% 99.3%
─────────────────────────────────────────────────────────────────────────────────────
Ecstasy All 1.6% 2.7% 4.5% 95.5%
Grade 7 0.3% 0.6% 0.9% 99.1%
Grade 8 1.3% 1.5% 2.5% 97.5%
Grade 9 0.9% 1.9% 3.4% 96.6%
Grade 10 1.9% 3.2% 4.5% 95.5%
Grade 11 3.5% 5.8% 10.1% 89.9%
Grade 12 2.4% 4.5% 8.0% 92.0%
─────────────────────────────────────────────────────────────────────────────────────
Heroin All 0.4% 0.5% 1.4% 98.6%
Grade 7 0.6% 0.8% 1.4% 98.6%
Grade 8 0.5% 0.5% 1.0% 99.0%Grade 9 0.3% 0.6% 1.9% 98.1%
Grade 10 0.3% 0.3% 1.9% 98.1%
Grade 11 0.4% 0.8% 1.2% 98.8%
Grade 12 * % * % 1.0% 99.0%
Round Rock
Spring 1998
Table B10: Prevalence and recency of use of selected substances by grade

8/14/2019 WILLIAMSON COUNTY - Round Rock ISD - 1998 Texas School Survey of Drug and Alcohol Use
http://slidepdf.com/reader/full/williamson-county-round-rock-isd-1998-texas-school-survey-of-drug-and-alcohol 104/213
Table B10: Prevalence and recency of use of selected substances by grade
--> Students not living with two parents
Past School Ever Never
Month Year Used Used
─────────────────────────────────────────────────────────────────────────────────────
Tobacco All 33.9% 46.3% 64.8% 35.2%
Grade 7 20.7% 31.8% 51.5% 48.5%
Grade 8 33.2% 44.1% 60.4% 39.6%
Grade 9 32.4% 49.6% 69.8% 30.2%
Grade 10 34.5% 49.7% 67.6% 32.4%
Grade 11 51.6% 59.8% 72.1% 27.9%
Grade 12 38.5% 48.9% 73.3% 26.7%
─────────────────────────────────────────────────────────────────────────────────────
Alcohol All 45.3% 60.2% 77.8% 22.2%
Grade 7 23.4% 36.0% 60.9% 39.1%
Grade 8 40.4% 53.7% 72.4% 27.6%
Grade 9 52.5% 66.9% 82.7% 17.3%
Grade 10 51.0% 65.5% 81.4% 18.6%Grade 11 57.4% 77.0% 90.2% 9.8%
Grade 12 56.7% 73.1% 87.3% 12.7%
─────────────────────────────────────────────────────────────────────────────────────
Inhalants All 9.2% 14.3% 27.4% 72.6%
Grade 7 11.1% 15.2% 26.8% 73.2%
Grade 8 12.8% 18.7% 34.5% 65.5%
Grade 9 7.9% 14.4% 26.6% 73.4%
Grade 10 10.3% 15.9% 30.3% 69.7%
Grade 11 8.2% 12.3% 23.0% 77.0%
Grade 12 2.2% 5.9% 20.0% 80.0%
─────────────────────────────────────────────────────────────────────────────────────
Any Illicit Drug All 25.0% 35.5% 48.0% 52.0%Grade 7 10.1% 14.1% 23.6% 76.4%
Grade 8 19.7% 29.1% 40.4% 59.6%
Grade 9 27.3% 38.1% 54.0% 46.0%
Grade 10 29.0% 46.2% 61.4% 38.6%
Grade 11 41.0% 51.6% 64.8% 35.2%
Grade 12 30.8% 44.4% 54.1% 45.9%
─────────────────────────────────────────────────────────────────────────────────────
Marijuana All 23.1% 34.0% 46.4% 53.6%
Grade 7 9.2% 13.8% 23.0% 77.0%
Grade 8 17.8% 26.2% 38.6% 61.4%
Grade 9 25.9% 36.0% 48.9% 51.1%
Grade 10 26.9% 44.1% 60.7% 39.3%
Grade 11 39.3% 50.8% 63.9% 36.1%
Grade 12 26.3% 42.9% 53.4% 46.6%
─────────────────────────────────────────────────────────────────────────────────────

8/14/2019 WILLIAMSON COUNTY - Round Rock ISD - 1998 Texas School Survey of Drug and Alcohol Use
http://slidepdf.com/reader/full/williamson-county-round-rock-isd-1998-texas-school-survey-of-drug-and-alcohol 105/213
Marijuana Only All 7.2% 13.4% 21.9% 78.1%
Grade 7 5.0% 8.0% 15.6% 84.4%
Grade 8 5.9% 8.4% 16.3% 83.7%
Grade 9 6.5% 13.7% 25.2% 74.8%
Grade 10 7.5% 19.2% 28.1% 71.9%
Grade 11 10.6% 17.1% 25.2% 74.8%
Grade 12 9.6% 17.6% 23.5% 76.5%
─────────────────────────────────────────────────────────────────────────────────────
Cocaine or Crack All 3.7% 6.6% 11.8% 88.2%
Grade 7 2.6% 2.6% 2.6% 97.4%
Grade 8 2.5% 5.0% 10.6% 89.4%
Grade 9 2.2% 6.5% 11.5% 88.5%
Grade 10 2.8% 8.4% 16.1% 83.9%
Grade 11 9.0% 13.1% 21.3% 78.7%
Grade 12 4.5% 6.0% 12.0% 88.0%
─────────────────────────────────────────────────────────────────────────────────────
Cocaine All 3.2% 5.9% 11.1% 88.9%
Grade 7 1.1% 1.1% 1.6% 98.4%Grade 8 2.6% 4.6% 10.2% 89.8%
Grade 9 2.2% 6.5% 10.8% 89.2%
Grade 10 2.8% 7.7% 15.5% 84.5%
Grade 11 7.4% 11.6% 19.8% 80.2%
Grade 12 4.6% 6.2% 12.3% 87.7%
Round Rock
Spring 1998
Table B10 continued from previous page

8/14/2019 WILLIAMSON COUNTY - Round Rock ISD - 1998 Texas School Survey of Drug and Alcohol Use
http://slidepdf.com/reader/full/williamson-county-round-rock-isd-1998-texas-school-survey-of-drug-and-alcohol 106/213
Table B10 continued from previous page
Past School Ever Never
Month Year Used Used
─────────────────────────────────────────────────────────────────────────────────────
Crack All 1.2% 2.0% 4.1% 95.9%
Grade 7 2.6% 2.6% 2.6% 97.4%
Grade 8 1.5% 3.1% 5.1% 94.9%Grade 9 * % 0.7% 2.9% 97.1%
Grade 10 0.7% 1.4% 4.3% 95.7%
Grade 11 1.6% 2.5% 5.7% 94.3%
Grade 12 0.8% 1.5% 4.6% 95.4%
─────────────────────────────────────────────────────────────────────────────────────
Hallucinogens All 5.5% 9.7% 16.1% 83.9%
Grade 7 2.7% 3.8% 3.8% 96.2%
Grade 8 2.6% 8.7% 15.9% 84.1%
Grade 9 7.2% 9.4% 15.2% 84.8%
Grade 10 6.4% 12.8% 19.9% 80.1%
Grade 11 10.7% 15.7% 26.4% 73.6%Grade 12 4.6% 9.9% 20.6% 79.4%
─────────────────────────────────────────────────────────────────────────────────────
Uppers All 4.5% 8.2% 13.6% 86.4%
Grade 7 1.6% 2.2% 2.7% 97.3%
Grade 8 4.7% 8.3% 10.9% 89.1%
Grade 9 6.0% 11.9% 17.2% 82.8%
Grade 10 2.8% 9.1% 18.9% 81.1%
Grade 11 7.6% 11.8% 21.0% 79.0%
Grade 12 5.4% 6.9% 13.8% 86.2%
─────────────────────────────────────────────────────────────────────────────────────
Downers All 3.4% 6.8% 11.5% 88.5%
Grade 7 1.6% 2.2% 2.2% 97.8%Grade 8 2.0% 6.1% 8.7% 91.3%
Grade 9 5.9% 10.3% 15.4% 84.6%
Grade 10 1.5% 8.8% 13.9% 86.1%
Grade 11 5.1% 6.8% 18.6% 81.4%
Grade 12 5.5% 7.0% 13.3% 86.7%
─────────────────────────────────────────────────────────────────────────────────────
Rohypnol All 3.5% 5.6% 9.9% 90.1%
Grade 7 2.1% 2.1% 3.2% 96.8%
Grade 8 4.7% 7.3% 11.0% 89.0%
Grade 9 2.2% 5.2% 7.4% 92.6%
Grade 10 5.0% 8.5% 12.8% 87.2%
Grade 11 5.0% 6.7% 16.8% 83.2%
Grade 12 2.3% 3.9% 10.9% 89.1%
─────────────────────────────────────────────────────────────────────────────────────
Steroids All 0.7% 1.4% 2.5% 97.5%

8/14/2019 WILLIAMSON COUNTY - Round Rock ISD - 1998 Texas School Survey of Drug and Alcohol Use
http://slidepdf.com/reader/full/williamson-county-round-rock-isd-1998-texas-school-survey-of-drug-and-alcohol 107/213
Ste o ds 0. . .5 9 .5
Grade 7 0.6% 1.7% 1.7% 98.3%
Grade 8 1.6% 2.6% 4.2% 95.8%
Grade 9 * % * % 0.7% 99.3%
Grade 10 0.7% 0.7% 2.2% 97.8%
Grade 11 0.8% 1.7% 2.5% 97.5%
Grade 12 0.8% 1.6% 4.7% 95.3%
─────────────────────────────────────────────────────────────────────────────────────Ecstasy All 3.2% 4.9% 8.5% 91.5%
Grade 7 0.6% 1.1% 1.7% 98.3%
Grade 8 0.5% 2.7% 4.8% 95.2%
Grade 9 3.7% 4.4% 8.9% 91.1%
Grade 10 2.9% 5.1% 11.8% 88.2%
Grade 11 7.6% 10.1% 13.4% 86.6%
Grade 12 5.5% 8.7% 14.2% 85.8%
─────────────────────────────────────────────────────────────────────────────────────
Heroin All 0.8% 1.0% 2.8% 97.2%
Grade 7 0.5% 0.5% 2.7% 97.3%
Grade 8 1.1% 1.6% 2.1% 97.9%Grade 9 0.7% 0.7% 2.9% 97.1%
Grade 10 0.7% 0.7% 5.0% 95.0%
Grade 11 0.8% 1.7% 1.7% 98.3%
Grade 12 0.8% 0.8% 2.3% 97.7%
Round Rock
Spring 1998
Table B11: Prevalence and recency of use of selected substances by grade

8/14/2019 WILLIAMSON COUNTY - Round Rock ISD - 1998 Texas School Survey of Drug and Alcohol Use
http://slidepdf.com/reader/full/williamson-county-round-rock-isd-1998-texas-school-survey-of-drug-and-alcohol 108/213
y y g
--> Students who would seek help from adults for substance abuse problems
Past School Ever Never
Month Year Used Used
─────────────────────────────────────────────────────────────────────────────────────
Tobacco All 23.4% 32.3% 48.5% 51.5%
Grade 7 10.8% 17.8% 31.4% 68.6%Grade 8 18.7% 25.2% 40.5% 59.5%
Grade 9 23.7% 34.8% 53.3% 46.7%
Grade 10 25.2% 37.5% 52.5% 47.5%
Grade 11 33.9% 41.8% 57.9% 42.1%
Grade 12 34.5% 42.9% 63.0% 37.0%
─────────────────────────────────────────────────────────────────────────────────────
Alcohol All 32.8% 47.9% 67.2% 32.8%
Grade 7 15.5% 24.0% 45.1% 54.9%
Grade 8 24.4% 34.0% 54.4% 45.6%
Grade 9 33.7% 52.1% 71.1% 28.9%
Grade 10 37.1% 56.3% 75.8% 24.2%
Grade 11 42.8% 64.1% 82.6% 17.4%
Grade 12 53.1% 68.4% 85.0% 15.0%
─────────────────────────────────────────────────────────────────────────────────────
Inhalants All 6.0% 9.4% 19.1% 80.9%
Grade 7 7.0% 10.4% 18.9% 81.1%
Grade 8 9.3% 13.9% 25.5% 74.5%
Grade 9 5.8% 9.2% 17.9% 82.1%
Grade 10 5.0% 8.2% 18.9% 81.1%
Grade 11 4.9% 6.9% 15.4% 84.6%
Grade 12 2.5% 5.7% 15.6% 84.4%
─────────────────────────────────────────────────────────────────────────────────────
Any Illicit Drug All 16.3% 23.4% 32.2% 67.8%Grade 7 5.9% 8.7% 13.1% 86.9%
Grade 8 10.7% 16.2% 23.0% 77.0%
Grade 9 17.4% 26.3% 36.8% 63.2%
Grade 10 19.8% 29.3% 39.1% 60.9%
Grade 11 25.7% 33.2% 46.1% 53.9%
Grade 12 24.1% 33.1% 43.3% 56.7%
─────────────────────────────────────────────────────────────────────────────────────
Marijuana All 14.5% 22.0% 30.6% 69.4%
Grade 7 5.3% 8.5% 12.6% 87.4%
Grade 8 8.2% 13.8% 21.2% 78.8%
Grade 9 15.0% 23.7% 33.5% 66.5%
Grade 10 17.8% 28.1% 37.9% 62.1%
Grade 11 23.8% 32.1% 44.0% 56.0%
Grade 12 22.4% 33.0% 42.9% 57.1%
─────────────────────────────────────────────────────────────────────────────────────

8/14/2019 WILLIAMSON COUNTY - Round Rock ISD - 1998 Texas School Survey of Drug and Alcohol Use
http://slidepdf.com/reader/full/williamson-county-round-rock-isd-1998-texas-school-survey-of-drug-and-alcohol 109/213
Marijuana Only All 5.3% 9.6% 15.5% 84.5%
Grade 7 2.7% 4.9% 8.0% 92.0%
Grade 8 3.4% 5.9% 10.6% 89.4%
Grade 9 5.2% 10.5% 18.4% 81.6%
Grade 10 6.6% 13.1% 19.2% 80.8%
Grade 11 8.2% 12.4% 20.3% 79.7%
Grade 12 7.1% 13.0% 19.5% 80.5%─────────────────────────────────────────────────────────────────────────────────────
Cocaine or Crack All 2.1% 3.4% 6.0% 94.0%
Grade 7 1.1% 1.5% 1.9% 98.1%
Grade 8 1.7% 2.3% 4.8% 95.2%
Grade 9 1.1% 2.1% 5.0% 95.0%
Grade 10 2.4% 4.8% 8.0% 92.0%
Grade 11 5.3% 7.0% 9.9% 90.1%
Grade 12 2.0% 4.0% 8.5% 91.5%
─────────────────────────────────────────────────────────────────────────────────────
Cocaine All 1.8% 3.0% 5.5% 94.5%
Grade 7 0.7% 0.7% 1.3% 98.7%
Grade 8 1.4% 2.0% 4.5% 95.5%
Grade 9 0.8% 1.9% 4.5% 95.5%
Grade 10 2.1% 4.3% 7.5% 92.5%
Grade 11 5.0% 6.7% 9.1% 90.9%
Grade 12 1.7% 3.7% 8.3% 91.7%
Round Rock
Spring 1998
Table B11 continued from previous page
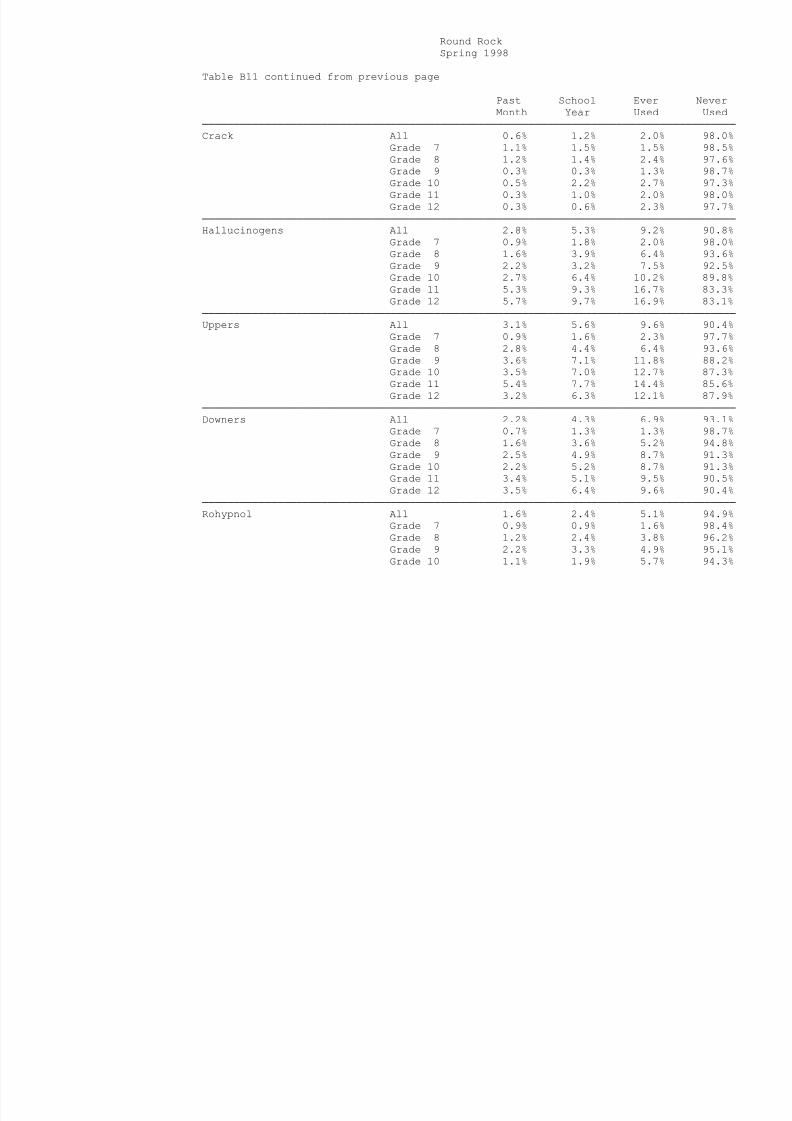
8/14/2019 WILLIAMSON COUNTY - Round Rock ISD - 1998 Texas School Survey of Drug and Alcohol Use
http://slidepdf.com/reader/full/williamson-county-round-rock-isd-1998-texas-school-survey-of-drug-and-alcohol 110/213
Past School Ever Never
Month Year Used Used
─────────────────────────────────────────────────────────────────────────────────────
Crack All 0.6% 1.2% 2.0% 98.0%
Grade 7 1.1% 1.5% 1.5% 98.5%
Grade 8 1.2% 1.4% 2.4% 97.6%Grade 9 0.3% 0.3% 1.3% 98.7%
Grade 10 0.5% 2.2% 2.7% 97.3%
Grade 11 0.3% 1.0% 2.0% 98.0%
Grade 12 0.3% 0.6% 2.3% 97.7%
─────────────────────────────────────────────────────────────────────────────────────
Hallucinogens All 2.8% 5.3% 9.2% 90.8%
Grade 7 0.9% 1.8% 2.0% 98.0%
Grade 8 1.6% 3.9% 6.4% 93.6%
Grade 9 2.2% 3.2% 7.5% 92.5%
Grade 10 2.7% 6.4% 10.2% 89.8%
Grade 11 5.3% 9.3% 16.7% 83.3%
Grade 12 5.7% 9.7% 16.9% 83.1%
─────────────────────────────────────────────────────────────────────────────────────
Uppers All 3.1% 5.6% 9.6% 90.4%
Grade 7 0.9% 1.6% 2.3% 97.7%
Grade 8 2.8% 4.4% 6.4% 93.6%
Grade 9 3.6% 7.1% 11.8% 88.2%
Grade 10 3.5% 7.0% 12.7% 87.3%
Grade 11 5.4% 7.7% 14.4% 85.6%
Grade 12 3.2% 6.3% 12.1% 87.9%
─────────────────────────────────────────────────────────────────────────────────────
Downers All 2.2% 4.3% 6.9% 93.1%
Grade 7 0.7% 1.3% 1.3% 98.7%Grade 8 1.6% 3.6% 5.2% 94.8%
Grade 9 2.5% 4.9% 8.7% 91.3%
Grade 10 2.2% 5.2% 8.7% 91.3%
Grade 11 3.4% 5.1% 9.5% 90.5%
Grade 12 3.5% 6.4% 9.6% 90.4%
─────────────────────────────────────────────────────────────────────────────────────
Rohypnol All 1.6% 2.4% 5.1% 94.9%
Grade 7 0.9% 0.9% 1.6% 98.4%
Grade 8 1.2% 2.4% 3.8% 96.2%
Grade 9 2.2% 3.3% 4.9% 95.1%
Grade 10 1.1% 1.9% 5.7% 94.3%
Grade 11 2.3% 3.0% 8.1% 91.9%
Grade 12 2.0% 3.4% 8.3% 91.7%
─────────────────────────────────────────────────────────────────────────────────────
Steroids All 0.5% 1.0% 1.9% 98.1%

8/14/2019 WILLIAMSON COUNTY - Round Rock ISD - 1998 Texas School Survey of Drug and Alcohol Use
http://slidepdf.com/reader/full/williamson-county-round-rock-isd-1998-texas-school-survey-of-drug-and-alcohol 111/213
Grade 7 1.1% 1.8% 2.7% 97.3%
Grade 8 0.2% 0.4% 1.2% 98.8%
Grade 9 * % 0.3% 1.4% 98.6%
Grade 10 * % 0.3% 1.6% 98.4%
Grade 11 1.3% 3.3% 3.7% 96.3%
Grade 12 0.3% 0.3% 1.1% 98.9%
─────────────────────────────────────────────────────────────────────────────────────Ecstasy All 1.3% 2.5% 4.6% 95.4%
Grade 7 0.5% 0.7% 0.9% 99.1%
Grade 8 0.8% 1.4% 2.4% 97.6%
Grade 9 1.4% 2.2% 4.4% 95.6%
Grade 10 0.5% 1.9% 4.1% 95.9%
Grade 11 3.4% 6.0% 9.1% 90.9%
Grade 12 1.7% 4.0% 8.9% 91.1%
─────────────────────────────────────────────────────────────────────────────────────
Heroin All 0.3% 0.4% 1.2% 98.8%
Grade 7 0.5% 0.7% 1.4% 98.6%
Grade 8 0.6% 0.6% 1.0% 99.0%
Grade 9 0.3% 0.3% 1.1% 98.9%
Grade 10 0.3% 0.3% 2.2% 97.8%
Grade 11 0.3% 0.7% 0.7% 99.3%
Grade 12 * % * % 0.9% 99.1%
Round Rock
Spring 1998
Table B12: Prevalence and recency of use of selected substances by grade

8/14/2019 WILLIAMSON COUNTY - Round Rock ISD - 1998 Texas School Survey of Drug and Alcohol Use
http://slidepdf.com/reader/full/williamson-county-round-rock-isd-1998-texas-school-survey-of-drug-and-alcohol 112/213
--> Students who wouldn't seek help from adults for substance abuse problems
Past School Ever Never
Month Year Used Used
─────────────────────────────────────────────────────────────────────────────────────
Tobacco All 39.7% 51.1% 69.0% 31.0%
Grade 7 22.9% 33.3% 55.2% 44.8%Grade 8 38.6% 54.2% 67.5% 32.5%
Grade 9 39.5% 50.6% 74.1% 25.9%
Grade 10 47.4% 60.3% 74.4% 25.6%
Grade 11 48.0% 56.0% 72.0% 28.0%
Grade 12 45.3% 56.2% 71.9% 28.1%
─────────────────────────────────────────────────────────────────────────────────────
Alcohol All 55.9% 66.4% 81.5% 18.5%
Grade 7 37.2% 45.7% 73.4% 26.6%
Grade 8 50.0% 62.2% 75.6% 24.4%
Grade 9 58.0% 66.7% 81.5% 18.5%
Grade 10 67.5% 77.9% 89.6% 10.4%
Grade 11 63.2% 75.0% 86.8% 13.2%
Grade 12 61.9% 74.6% 82.5% 17.5%
─────────────────────────────────────────────────────────────────────────────────────
Inhalants All 13.2% 18.9% 35.2% 64.8%
Grade 7 14.6% 24.0% 42.7% 57.3%
Grade 8 22.0% 28.0% 41.5% 58.5%
Grade 9 13.7% 17.5% 35.0% 65.0%
Grade 10 14.1% 19.2% 35.9% 64.1%
Grade 11 7.9% 13.2% 27.6% 72.4%
Grade 12 4.7% 9.4% 25.0% 75.0%
─────────────────────────────────────────────────────────────────────────────────────
Any Illicit Drug All 27.6% 39.8% 51.3% 48.7%Grade 7 14.6% 17.7% 27.1% 72.9%
Grade 8 29.3% 41.5% 51.2% 48.8%
Grade 9 27.5% 38.7% 53.7% 46.3%
Grade 10 35.9% 50.0% 60.3% 39.7%
Grade 11 34.2% 51.3% 61.8% 38.2%
Grade 12 25.0% 43.8% 57.8% 42.2%
─────────────────────────────────────────────────────────────────────────────────────
Marijuana All 24.5% 37.1% 48.3% 51.7%
Grade 7 9.5% 14.7% 22.1% 77.9%
Grade 8 26.3% 38.8% 46.3% 53.8%
Grade 9 25.0% 37.5% 51.2% 48.8%
Grade 10 33.3% 44.9% 59.0% 41.0%
Grade 11 31.6% 47.4% 57.9% 42.1%
Grade 12 21.9% 43.8% 57.8% 42.2%
─────────────────────────────────────────────────────────────────────────────────────
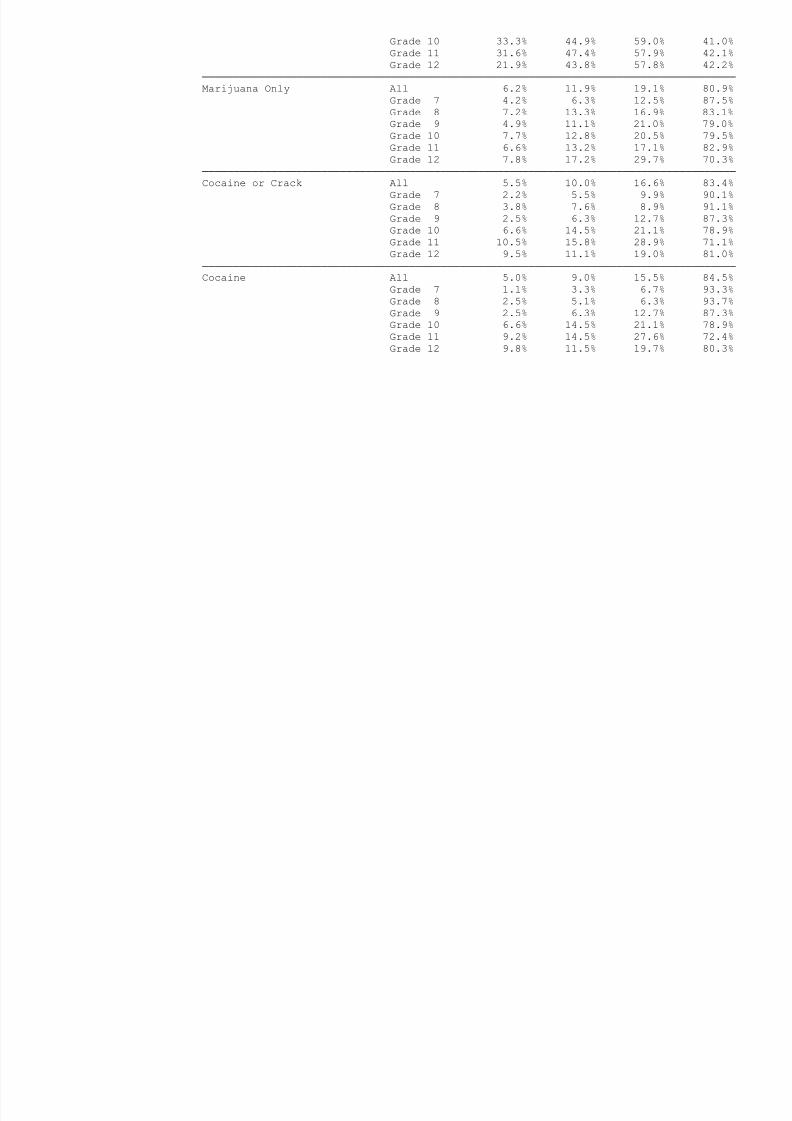
8/14/2019 WILLIAMSON COUNTY - Round Rock ISD - 1998 Texas School Survey of Drug and Alcohol Use
http://slidepdf.com/reader/full/williamson-county-round-rock-isd-1998-texas-school-survey-of-drug-and-alcohol 113/213
Marijuana Only All 6.2% 11.9% 19.1% 80.9%
Grade 7 4.2% 6.3% 12.5% 87.5%
Grade 8 7.2% 13.3% 16.9% 83.1%
Grade 9 4.9% 11.1% 21.0% 79.0%
Grade 10 7.7% 12.8% 20.5% 79.5%
Grade 11 6.6% 13.2% 17.1% 82.9%
Grade 12 7.8% 17.2% 29.7% 70.3%─────────────────────────────────────────────────────────────────────────────────────
Cocaine or Crack All 5.5% 10.0% 16.6% 83.4%
Grade 7 2.2% 5.5% 9.9% 90.1%
Grade 8 3.8% 7.6% 8.9% 91.1%
Grade 9 2.5% 6.3% 12.7% 87.3%
Grade 10 6.6% 14.5% 21.1% 78.9%
Grade 11 10.5% 15.8% 28.9% 71.1%
Grade 12 9.5% 11.1% 19.0% 81.0%
─────────────────────────────────────────────────────────────────────────────────────
Cocaine All 5.0% 9.0% 15.5% 84.5%
Grade 7 1.1% 3.3% 6.7% 93.3%
Grade 8 2.5% 5.1% 6.3% 93.7%
Grade 9 2.5% 6.3% 12.7% 87.3%
Grade 10 6.6% 14.5% 21.1% 78.9%
Grade 11 9.2% 14.5% 27.6% 72.4%
Grade 12 9.8% 11.5% 19.7% 80.3%
Round Rock
Spring 1998
Table B12 continued from previous page

8/14/2019 WILLIAMSON COUNTY - Round Rock ISD - 1998 Texas School Survey of Drug and Alcohol Use
http://slidepdf.com/reader/full/williamson-county-round-rock-isd-1998-texas-school-survey-of-drug-and-alcohol 114/213
Past School Ever Never
Month Year Used Used
─────────────────────────────────────────────────────────────────────────────────────
Crack All 1.5% 3.1% 6.9% 93.1%
Grade 7 2.2% 3.3% 6.7% 93.3%
Grade 8 2.5% 5.1% 6.3% 93.7%Grade 9 * % 2.6% 6.5% 93.5%
Grade 10 1.4% 2.7% 6.8% 93.2%
Grade 11 2.6% 3.9% 10.5% 89.5%
Grade 12 * % * % 3.3% 96.7%
─────────────────────────────────────────────────────────────────────────────────────
Hallucinogens All 10.0% 15.6% 20.8% 79.2%
Grade 7 5.5% 6.6% 6.6% 93.4%
Grade 8 3.8% 11.4% 16.5% 83.5%
Grade 9 12.5% 16.2% 21.2% 78.8%
Grade 10 14.7% 22.7% 28.0% 72.0%
Grade 11 14.7% 22.7% 32.0% 68.0%
Grade 12 6.6% 13.1% 21.3% 78.7%
─────────────────────────────────────────────────────────────────────────────────────
Uppers All 7.4% 11.9% 17.8% 82.2%
Grade 7 3.4% 4.6% 8.0% 92.0%
Grade 8 6.6% 7.9% 13.2% 86.8%
Grade 9 7.6% 12.7% 19.0% 81.0%
Grade 10 7.9% 19.7% 27.6% 72.4%
Grade 11 11.0% 13.7% 23.3% 76.7%
Grade 12 8.3% 11.7% 13.3% 86.7%
─────────────────────────────────────────────────────────────────────────────────────
Downers All 5.5% 9.7% 14.7% 85.3%
Grade 7 3.4% 5.7% 6.9% 93.1%Grade 8 1.3% 5.2% 9.1% 90.9%
Grade 9 8.1% 10.8% 17.6% 82.4%
Grade 10 5.4% 16.2% 20.3% 79.7%
Grade 11 9.6% 13.7% 21.9% 78.1%
Grade 12 3.4% 3.4% 10.2% 89.8%
─────────────────────────────────────────────────────────────────────────────────────
Rohypnol All 5.5% 7.3% 12.4% 87.6%
Grade 7 4.3% 4.3% 6.5% 93.5%
Grade 8 7.6% 10.1% 17.7% 82.3%
Grade 9 6.3% 6.3% 8.9% 91.1%
Grade 10 8.1% 13.5% 17.6% 82.4%
Grade 11 4.0% 6.7% 14.7% 85.3%
Grade 12 1.7% 1.7% 10.2% 89.8%
─────────────────────────────────────────────────────────────────────────────────────
Steroids All 1.9% 2.4% 3.7% 96.3%
G d 7 1 1% 1 1% 3 3% 96 7%

8/14/2019 WILLIAMSON COUNTY - Round Rock ISD - 1998 Texas School Survey of Drug and Alcohol Use
http://slidepdf.com/reader/full/williamson-county-round-rock-isd-1998-texas-school-survey-of-drug-and-alcohol 115/213
Grade 7 1.1% 1.1% 3.3% 96.7%
Grade 8 3.9% 3.9% 7.9% 92.1%
Grade 9 1.3% 1.3% 1.3% 98.7%
Grade 10 1.3% 1.3% 1.3% 98.7%
Grade 11 2.7% 4.1% 4.1% 95.9%
Grade 12 1.6% 3.3% 6.6% 93.4%
─────────────────────────────────────────────────────────────────────────────────────Ecstasy All 5.5% 7.1% 11.0% 89.0%
Grade 7 * % 1.1% 2.2% 97.8%
Grade 8 1.4% 1.4% 5.4% 94.6%
Grade 9 4.0% 5.3% 8.0% 92.0%
Grade 10 8.0% 12.0% 18.7% 81.3%
Grade 11 11.0% 12.3% 20.5% 79.5%
Grade 12 10.0% 11.7% 11.7% 88.3%
─────────────────────────────────────────────────────────────────────────────────────
Heroin All 1.1% 1.4% 4.2% 95.8%
Grade 7 1.1% 1.1% 4.5% 95.5%
Grade 8 1.3% 1.3% 1.3% 98.7%
Grade 9 1.4% 1.4% 6.8% 93.2%
Grade 10 1.3% 1.3% 5.3% 94.7%
Grade 11 1.4% 2.7% 2.7% 97.3%
Grade 12 * % * % 3.2% 96.8%
Round Rock
Spring 1998
Table B13: Prevalence and recency of use of selected substances by grade
> St d t li i i t th l
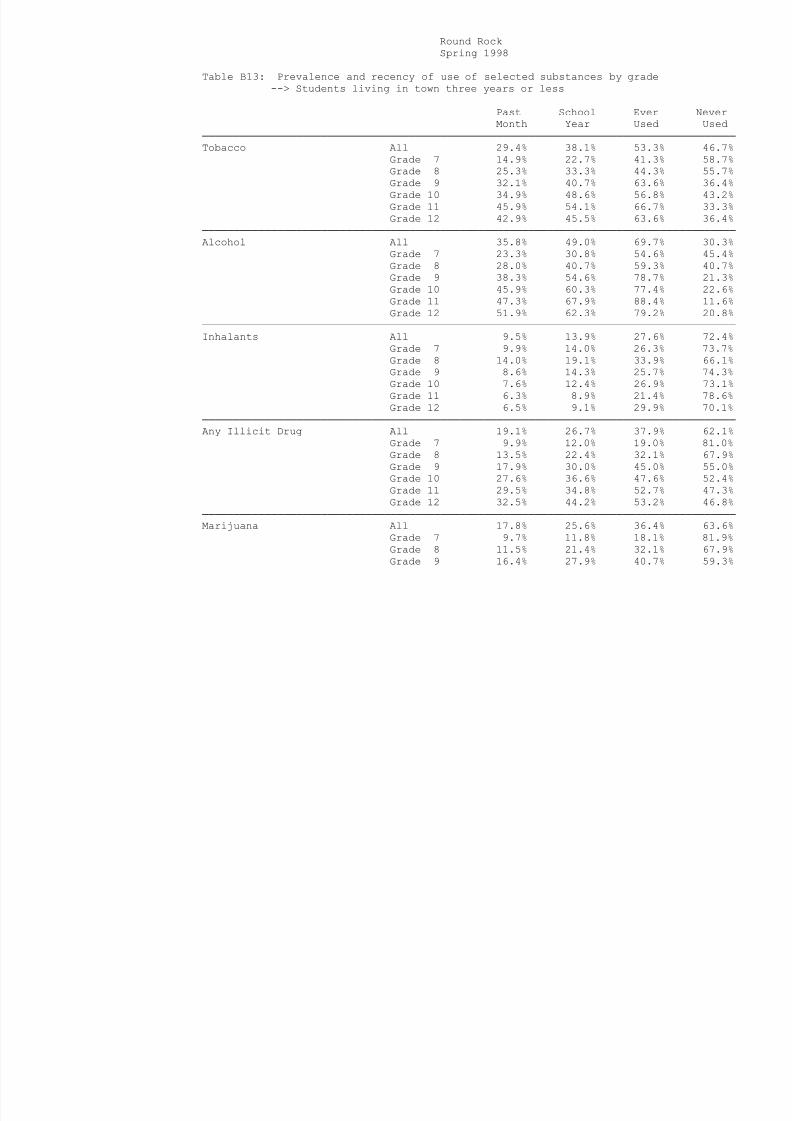
8/14/2019 WILLIAMSON COUNTY - Round Rock ISD - 1998 Texas School Survey of Drug and Alcohol Use
http://slidepdf.com/reader/full/williamson-county-round-rock-isd-1998-texas-school-survey-of-drug-and-alcohol 116/213
--> Students living in town three years or less
Past School Ever Never
Month Year Used Used
─────────────────────────────────────────────────────────────────────────────────────
Tobacco All 29.4% 38.1% 53.3% 46.7%
Grade 7 14.9% 22.7% 41.3% 58.7%Grade 8 25.3% 33.3% 44.3% 55.7%
Grade 9 32.1% 40.7% 63.6% 36.4%
Grade 10 34.9% 48.6% 56.8% 43.2%
Grade 11 45.9% 54.1% 66.7% 33.3%
Grade 12 42.9% 45.5% 63.6% 36.4%
─────────────────────────────────────────────────────────────────────────────────────
Alcohol All 35.8% 49.0% 69.7% 30.3%
Grade 7 23.3% 30.8% 54.6% 45.4%
Grade 8 28.0% 40.7% 59.3% 40.7%
Grade 9 38.3% 54.6% 78.7% 21.3%
Grade 10 45.9% 60.3% 77.4% 22.6%
Grade 11 47.3% 67.9% 88.4% 11.6%
Grade 12 51.9% 62.3% 79.2% 20.8%
─────────────────────────────────────────────────────────────────────────────────────
Inhalants All 9.5% 13.9% 27.6% 72.4%
Grade 7 9.9% 14.0% 26.3% 73.7%
Grade 8 14.0% 19.1% 33.9% 66.1%
Grade 9 8.6% 14.3% 25.7% 74.3%
Grade 10 7.6% 12.4% 26.9% 73.1%
Grade 11 6.3% 8.9% 21.4% 78.6%
Grade 12 6.5% 9.1% 29.9% 70.1%
─────────────────────────────────────────────────────────────────────────────────────
Any Illicit Drug All 19.1% 26.7% 37.9% 62.1%Grade 7 9.9% 12.0% 19.0% 81.0%
Grade 8 13.5% 22.4% 32.1% 67.9%
Grade 9 17.9% 30.0% 45.0% 55.0%
Grade 10 27.6% 36.6% 47.6% 52.4%
Grade 11 29.5% 34.8% 52.7% 47.3%
Grade 12 32.5% 44.2% 53.2% 46.8%
─────────────────────────────────────────────────────────────────────────────────────
Marijuana All 17.8% 25.6% 36.4% 63.6%
Grade 7 9.7% 11.8% 18.1% 81.9%
Grade 8 11.5% 21.4% 32.1% 67.9%
Grade 9 16.4% 27.9% 40.7% 59.3%
Grade 10 26.4% 34.7% 46.5% 53.5%
Grade 11 27.3% 33.6% 50.0% 50.0%
Grade 12 31.2% 44.2% 53.2% 46.8%
─────────────────────────────────────────────────────────────────────────────────────
Marijuana Only All 5 6% 9 4% 16 6% 83 4%

8/14/2019 WILLIAMSON COUNTY - Round Rock ISD - 1998 Texas School Survey of Drug and Alcohol Use
http://slidepdf.com/reader/full/williamson-county-round-rock-isd-1998-texas-school-survey-of-drug-and-alcohol 117/213
Marijuana Only All 5.6% 9.4% 16.6% 83.4%
Grade 7 3.7% 4.9% 9.8% 90.2%
Grade 8 3.8% 8.0% 15.1% 84.9%
Grade 9 4.3% 9.9% 20.6% 79.4%
Grade 10 8.8% 14.3% 20.4% 79.6%
Grade 11 9.7% 11.5% 19.5% 80.5%
Grade 12 6.4% 12.8% 20.5% 79.5%─────────────────────────────────────────────────────────────────────────────────────
Cocaine or Crack All 3.7% 6.1% 10.5% 89.5%
Grade 7 2.1% 3.4% 4.7% 95.3%
Grade 8 3.0% 4.7% 8.6% 91.4%
Grade 9 3.6% 5.8% 10.1% 89.9%
Grade 10 2.8% 6.3% 11.9% 88.1%
Grade 11 7.3% 11.8% 20.0% 80.0%
Grade 12 6.5% 9.1% 16.9% 83.1%
─────────────────────────────────────────────────────────────────────────────────────
Cocaine All 2.9% 5.1% 9.4% 90.6%
Grade 7 1.3% 1.8% 3.5% 96.5%
Grade 8 2.2% 3.5% 7.4% 92.6%
Grade 9 2.9% 5.1% 8.8% 91.2%
Grade 10 2.8% 6.3% 12.0% 88.0%
Grade 11 5.5% 10.0% 17.3% 82.7%
Grade 12 6.8% 9.5% 17.6% 82.4%
Round Rock
Spring 1998
Table B13 continued from previous page

8/14/2019 WILLIAMSON COUNTY - Round Rock ISD - 1998 Texas School Survey of Drug and Alcohol Use
http://slidepdf.com/reader/full/williamson-county-round-rock-isd-1998-texas-school-survey-of-drug-and-alcohol 118/213
Past School Ever Never
Month Year Used Used
─────────────────────────────────────────────────────────────────────────────────────
Crack All 1.6% 2.6% 5.1% 94.9%
Grade 7 1.8% 2.6% 3.5% 96.5%
Grade 8 2.2% 3.5% 5.2% 94.8%Grade 9 1.4% 2.2% 5.0% 95.0%
Grade 10 0.7% 2.2% 3.6% 96.4%
Grade 11 2.7% 2.7% 8.2% 91.8%
Grade 12 * % 1.3% 7.8% 92.2%
─────────────────────────────────────────────────────────────────────────────────────
Hallucinogens All 3.7% 6.6% 11.9% 88.1%
Grade 7 2.2% 4.0% 4.0% 96.0%
Grade 8 1.3% 3.9% 8.7% 91.3%
Grade 9 3.6% 5.1% 11.6% 88.4%
Grade 10 5.0% 9.9% 12.8% 87.2%
Grade 11 8.2% 10.0% 24.5% 75.5%
Grade 12 5.2% 13.0% 23.4% 76.6%
─────────────────────────────────────────────────────────────────────────────────────
Uppers All 4.0% 6.7% 12.5% 87.5%
Grade 7 2.3% 3.2% 4.1% 95.9%
Grade 8 3.1% 4.4% 7.0% 93.0%
Grade 9 5.2% 9.6% 16.3% 83.7%
Grade 10 3.5% 8.5% 18.3% 81.7%
Grade 11 7.4% 8.3% 19.4% 80.6%
Grade 12 3.9% 10.5% 21.1% 78.9%
─────────────────────────────────────────────────────────────────────────────────────
Downers All 3.3% 6.1% 10.5% 89.5%
Grade 7 1.3% 2.7% 2.7% 97.3%Grade 8 2.6% 4.4% 6.6% 93.4%
Grade 9 4.4% 8.8% 15.4% 84.6%
Grade 10 2.2% 7.3% 13.9% 86.1%
Grade 11 5.7% 6.7% 14.3% 85.7%
Grade 12 6.7% 12.0% 21.3% 78.7%
─────────────────────────────────────────────────────────────────────────────────────
Rohypnol All 2.7% 3.6% 5.9% 94.1%
Grade 7 2.2% 2.2% 3.5% 96.5%
Grade 8 2.2% 3.1% 4.4% 95.6%
Grade 9 2.9% 5.1% 6.6% 93.4%
Grade 10 2.8% 3.5% 6.4% 93.6%

8/14/2019 WILLIAMSON COUNTY - Round Rock ISD - 1998 Texas School Survey of Drug and Alcohol Use
http://slidepdf.com/reader/full/williamson-county-round-rock-isd-1998-texas-school-survey-of-drug-and-alcohol 119/213
Round Rock
Spring 1998
Table B14: Prevalence and recency of use of selected substances by grade
--> Students living in town more than three years

8/14/2019 WILLIAMSON COUNTY - Round Rock ISD - 1998 Texas School Survey of Drug and Alcohol Use
http://slidepdf.com/reader/full/williamson-county-round-rock-isd-1998-texas-school-survey-of-drug-and-alcohol 120/213
> Students living in town more than three years
Past School Ever Never
Month Year Used Used
─────────────────────────────────────────────────────────────────────────────────────
Tobacco All 24.8% 34.7% 51.9% 48.1%
Grade 7 11.7% 20.2% 33.1% 66.9%Grade 8 20.5% 28.3% 45.9% 54.1%
Grade 9 24.6% 36.6% 55.0% 45.0%
Grade 10 26.7% 38.2% 55.6% 44.4%
Grade 11 32.8% 40.9% 58.4% 41.6%
Grade 12 34.1% 44.3% 63.9% 36.1%
─────────────────────────────────────────────────────────────────────────────────────
Alcohol All 37.1% 52.0% 69.8% 30.2%
Grade 7 16.2% 26.2% 47.4% 52.6%
Grade 8 29.1% 37.2% 56.8% 43.2%
Grade 9 38.0% 55.4% 71.7% 28.3%
Grade 10 40.3% 59.4% 77.8% 22.2%
Grade 11 45.8% 65.1% 81.5% 18.5%
Grade 12 54.7% 70.4% 85.2% 14.8%
─────────────────────────────────────────────────────────────────────────────────────
Inhalants All 6.4% 9.8% 19.2% 80.8%
Grade 7 7.3% 12.0% 20.2% 79.8%
Grade 8 9.4% 14.4% 24.3% 75.7%
Grade 9 7.2% 9.6% 19.5% 80.5%
Grade 10 6.2% 9.0% 19.6% 80.4%
Grade 11 5.4% 7.9% 16.2% 83.8%
Grade 12 2.0% 5.4% 14.5% 85.5%
─────────────────────────────────────────────────────────────────────────────────────
Any Illicit Drug All 18.2% 26.4% 34.6% 65.4%Grade 7 6.1% 9.4% 13.5% 86.5%
Grade 8 13.6% 19.6% 25.4% 74.6%
Grade 9 20.1% 28.5% 38.1% 61.9%
Grade 10 20.2% 31.5% 40.5% 59.5%
Grade 11 26.9% 37.5% 47.6% 52.4%
Grade 12 22.9% 32.9% 43.4% 56.6%
─────────────────────────────────────────────────────────────────────────────────────
Marijuana All 15.9% 24.6% 32.7% 67.3%
Grade 7 4.1% 8.5% 12.0% 88.0%
Grade 8 10.8% 16.0% 21.5% 78.5%
Grade 9 17.5% 26.2% 35.8% 64.2%

8/14/2019 WILLIAMSON COUNTY - Round Rock ISD - 1998 Texas School Survey of Drug and Alcohol Use
http://slidepdf.com/reader/full/williamson-county-round-rock-isd-1998-texas-school-survey-of-drug-and-alcohol 121/213
Round Rock
Spring 1998
Table B14 continued from previous page

8/14/2019 WILLIAMSON COUNTY - Round Rock ISD - 1998 Texas School Survey of Drug and Alcohol Use
http://slidepdf.com/reader/full/williamson-county-round-rock-isd-1998-texas-school-survey-of-drug-and-alcohol 122/213
Past School Ever Never
Month Year Used Used
─────────────────────────────────────────────────────────────────────────────────────
Crack All 0.5% 1.1% 1.9% 98.1%
Grade 7 0.9% 1.2% 1.8% 98.2%
Grade 8 1.1% 1.1% 1.6% 98.4%Grade 9 * % 0.3% 1.2% 98.8%
Grade 10 0.6% 2.5% 3.5% 96.5%
Grade 11 * % 1.1% 1.8% 98.2%
Grade 12 0.6% 0.6% 1.5% 98.5%
─────────────────────────────────────────────────────────────────────────────────────
Hallucinogens All 4.3% 7.4% 11.0% 89.0%
Grade 7 1.2% 1.8% 2.1% 97.9%
Grade 8 2.4% 5.6% 8.0% 92.0%
Grade 9 4.3% 5.8% 9.2% 90.8%
Grade 10 4.7% 8.9% 13.3% 86.7%
Grade 11 7.7% 13.6% 18.4% 81.6%
Grade 12 6.1% 9.6% 16.3% 83.7%
─────────────────────────────────────────────────────────────────────────────────────
Uppers All 3.7% 6.5% 10.0% 90.0%
Grade 7 0.9% 1.6% 2.8% 97.2%
Grade 8 3.0% 5.3% 7.2% 92.8%
Grade 9 4.1% 7.5% 11.6% 88.4%
Grade 10 4.5% 9.3% 13.4% 86.6%
Grade 11 5.9% 8.9% 14.5% 85.5%
Grade 12 3.8% 6.2% 10.0% 90.0%
─────────────────────────────────────────────────────────────────────────────────────
Downers All 2.4% 4.5% 7.0% 93.0%
Grade 7 0.9% 1.5% 1.8% 98.2%Grade 8 0.8% 3.0% 4.9% 95.1%
Grade 9 3.2% 4.8% 8.3% 91.7%
Grade 10 2.9% 6.7% 8.9% 91.1%
Grade 11 4.1% 6.7% 10.9% 89.1%
Grade 12 2.7% 4.5% 6.8% 93.2%
─────────────────────────────────────────────────────────────────────────────────────
Rohypnol All 2.1% 3.2% 6.6% 93.4%
Grade 7 1.2% 1.2% 2.1% 97.9%
Grade 8 2.5% 4.1% 6.8% 93.2%
Grade 9 2.8% 3.4% 5.3% 94.7%
Grade 10 1.9% 3.8% 8.0% 92.0%
Grade 11 2.2% 3.7% 10.3% 89.7%
Grade 12 1.5% 2.6% 7.4% 92.6%
─────────────────────────────────────────────────────────────────────────────────────
Steroids All 0.9% 1.3% 2.5% 97.5%
Grade 7 1.9% 2.2% 3.7% 96.3%

8/14/2019 WILLIAMSON COUNTY - Round Rock ISD - 1998 Texas School Survey of Drug and Alcohol Use
http://slidepdf.com/reader/full/williamson-county-round-rock-isd-1998-texas-school-survey-of-drug-and-alcohol 123/213
Grade 8 0.6% 0.8% 3.0% 97.0%
Grade 9 0.3% 0.6% 1.2% 98.8%
Grade 10 0.3% 0.3% 1.3% 98.7%
Grade 11 1.9% 4.1% 4.5% 95.5%
Grade 12 0.6% 0.6% 1.7% 98.3%
─────────────────────────────────────────────────────────────────────────────────────Ecstasy All 1.8% 3.0% 4.9% 95.1%
Grade 7 0.3% 0.3% 0.3% 99.7%
Grade 8 1.1% 1.7% 2.0% 98.0%
Grade 9 0.9% 1.9% 3.8% 96.2%
Grade 10 1.3% 2.3% 3.6% 96.4%
Grade 11 4.8% 7.7% 11.8% 88.2%
Grade 12 2.9% 5.0% 8.8% 91.2%
─────────────────────────────────────────────────────────────────────────────────────
Heroin All 0.5% 0.6% 1.4% 98.6%
Grade 7 0.3% 0.6% 1.9% 98.1%
Grade 8 0.5% 0.5% 0.8% 99.2%
Grade 9 0.6% 0.6% 1.6% 98.4%
Grade 10 0.6% 0.6% 1.6% 98.4%
Grade 11 0.4% 1.1% 1.5% 98.5%
Grade 12 0.3% 0.3% 1.2% 98.8%
Round Rock
Spring 1998
GENDER

8/14/2019 WILLIAMSON COUNTY - Round Rock ISD - 1998 Texas School Survey of Drug and Alcohol Use
http://slidepdf.com/reader/full/williamson-county-round-rock-isd-1998-texas-school-survey-of-drug-and-alcohol 124/213
Q1 Frequency Percent
────────────────────────────
Female 1517.293 50.8
Male 1471.017 49.2
Frequency Missing = 3.69018898
GRADE
Q2 Frequency Percent
─────────────────────────────────
Grade 7 561.9492 18.8
Grade 8 544.2301 18.2
Grade 9 592.3249 19.8
Grade 10 508.7919 17.0
Grade 11 410.0711 13.7
Grade 12 374.6328 12.5
LIVE WITH BOTH PARENTS
Q3 Frequency Percent
────────────────────────────────
No 941.525 31.7Yes 2032.066 68.3
Frequency Missing = 18.40934094
AGE
Q4 Frequency Percent
───────────────────────────────────
11 or younger 0.947638 0.0
12 143.1918 4.8
13 546.4882 18.3
14 533.2371 17.8
15 576.1873 19.3

8/14/2019 WILLIAMSON COUNTY - Round Rock ISD - 1998 Texas School Survey of Drug and Alcohol Use
http://slidepdf.com/reader/full/williamson-county-round-rock-isd-1998-texas-school-survey-of-drug-and-alcohol 125/213
16 499.8714 16.7
17 410.2374 13.7
18 250.3279 8.4
19 or older 29.19479 1.0
Frequency Missing = 2.31654606
ETHNICITY
Q5 Frequency Percent
──────────────────────────────────────
African/American 160.3593 5.5
Asian/American 164.8159 5.6
Mexican/American 344.9267 11.7
Native/American 16.78419 0.6
Other 152.794 5.2
White 2096.56 71.4
Frequency Missing = 55.75989919
The frequencies have been weighted so that the
analysis reflects the distribution of students by grade
level in the district
Round Rock
Spring 1998
ON AVERAGE WHAT GRADES
DO YOU GET

8/14/2019 WILLIAMSON COUNTY - Round Rock ISD - 1998 Texas School Survey of Drug and Alcohol Use
http://slidepdf.com/reader/full/williamson-county-round-rock-isd-1998-texas-school-survey-of-drug-and-alcohol 126/213
Q6 Frequency Percent
────────────────────────────────
Mostly A's 1269.869 42.8
Mostly B's 1223.076 41.3
Mostly C's 380.8456 12.8Mostly D's 74.5656 2.5
Mostly F's 16.44985 0.6
Frequency Missing = 27.19400494
LENGTH OF TIME IN THIS DISTRICT
Q7 Frequency Percent
───────────────────────────────
<1 year 329.0557 11.1
2-3 years 628.2161 21.2
>4 years 2012.3 67.8
Frequency Missing = 22.4283646
DO YOU HAVE A JOB
Q8 Frequency Percent
────────────────────────────────
No 1991.59 67.0
Yes 979.4256 33.0
Frequency Missing = 20.98466122
DO YOU GET AN ALLOWANCE
Q9 Frequency Percent
────────────────────────────────
No 1562.394 52.7
Yes 1399.693 47.3

8/14/2019 WILLIAMSON COUNTY - Round Rock ISD - 1998 Texas School Survey of Drug and Alcohol Use
http://slidepdf.com/reader/full/williamson-county-round-rock-isd-1998-texas-school-survey-of-drug-and-alcohol 127/213
Frequency Missing = 29.91272993
EITHER PARENT COLLEGE GRADUATE
Q10 Frequency Percent
────────────────────────────────
Don't Know 273.2268 9.2
No 645.2396 21.8
Yes 2048.024 69.0
Frequency Missing = 25.5095256
The frequencies have been weighted so that the
analysis reflects the distribution of students by grade
level in the district
Round Rock
Spring 1998
QUALIFY FOR FREE/REDUCED
PRICE LUNCH

8/14/2019 WILLIAMSON COUNTY - Round Rock ISD - 1998 Texas School Survey of Drug and Alcohol Use
http://slidepdf.com/reader/full/williamson-county-round-rock-isd-1998-texas-school-survey-of-drug-and-alcohol 128/213
Q11 Frequency Percent
────────────────────────────────
Don't Know 383.4456 12.9
No 2244.26 75.6
Yes 341.2211 11.5
Frequency Missing = 23.07305396
PARTICIPATE IN ATHLETICS
Q12A Frequency Percent
────────────────────────────────
No 1437.93 50.4
Yes 1413.885 49.6
Frequency Missing = 140.18519145
PARTICIPATE IN BAND/ORCHESTRA
Q12B Frequency Percent
────────────────────────────────
No 2063.798 77.9Yes 585.589 22.1
Frequency Missing = 342.6127268
PARTICIPATE IN CHOIR
Q12C Frequency Percent
────────────────────────────────
No 2271.585 86.9
Yes 342.7043 13.1
Frequency Missing = 377.71029304

8/14/2019 WILLIAMSON COUNTY - Round Rock ISD - 1998 Texas School Survey of Drug and Alcohol Use
http://slidepdf.com/reader/full/williamson-county-round-rock-isd-1998-texas-school-survey-of-drug-and-alcohol 129/213
PARTICIPATE IN DRAMA/SPEECH
Q12D Frequency Percent────────────────────────────────
No 2056.257 79.1
Yes 541.7192 20.9
Frequency Missing = 394.02429674
PARTICIPATE IN DRILL
TEAM/CHEERLEADING
Q12E Frequency Percent
────────────────────────────────
No 2291.829 88.1
Yes 309.6115 11.9
Frequency Missing = 390.55926467
The frequencies have been weighted so that the
analysis reflects the distribution of students by grade
level in the district
Round Rock
Spring 1998
PARTICIPATE IN STUDENT
GOVERNMENT

8/14/2019 WILLIAMSON COUNTY - Round Rock ISD - 1998 Texas School Survey of Drug and Alcohol Use
http://slidepdf.com/reader/full/williamson-county-round-rock-isd-1998-texas-school-survey-of-drug-and-alcohol 130/213
Q12F Frequency Percent
────────────────────────────────
No 2351.641 91.4
Yes 219.8726 8.6
Frequency Missing = 420.48668619
PARTICIPATE IN SCHOOL
NEWSPAPER/YEARBOOK
Q12G Frequency Percent
────────────────────────────────
No 2405.71 94.1
Yes 151.5839 5.9
Frequency Missing = 434.70658063
PARTICIPATE IN ACADEMIC
CLUBS/SOCIETIES
Q12H Frequency Percent
────────────────────────────────
No 1731.709 66.2
Yes 884.8616 33.8
Frequency Missing = 375.42947939
PARTICIPATE IN SERVICE CLUBS
Q12I Frequency Percent

8/14/2019 WILLIAMSON COUNTY - Round Rock ISD - 1998 Texas School Survey of Drug and Alcohol Use
http://slidepdf.com/reader/full/williamson-county-round-rock-isd-1998-texas-school-survey-of-drug-and-alcohol 131/213
Round Rock
Spring 1998
DO YOU FEEL SAFE IN YOUR HOME
Q13A Frequency Percent

8/14/2019 WILLIAMSON COUNTY - Round Rock ISD - 1998 Texas School Survey of Drug and Alcohol Use
http://slidepdf.com/reader/full/williamson-county-round-rock-isd-1998-texas-school-survey-of-drug-and-alcohol 132/213
Q13A Frequency Percent
─────────────────────────────────────
Very Safe 2391.115 80.2
Somewhat Safe 536.6545 18.0
Not Very Safe 22.7447 0.8
Not Safe At All 14.24799 0.5Don't Know 15.91464 0.5
Frequency Missing = 11.32288203
DO YOU FEEL SAFE IN YOUR NEIGHBORHOOD
Q13B Frequency Percent
─────────────────────────────────────
Very Safe 1545.451 52.0Somewhat Safe 1247.012 42.0
Not Very Safe 107.6453 3.6
Not Safe At All 37.22667 1.3
Don't Know 33.093 1.1
Frequency Missing = 21.57255368
DO YOU FEEL SAFE AT SCHOOL
Q13C Frequency Percent
─────────────────────────────────────
Very Safe 1226.603 41.4
Somewhat Safe 1449.614 48.9
Not Very Safe 185.3515 6.3
Not Safe At All 67.34739 2.3
Don't Know 35.79388 1.2
Frequency Missing = 27.2896104
FRIENDS FEELING CLOSE
TO THEIR PARENTS

8/14/2019 WILLIAMSON COUNTY - Round Rock ISD - 1998 Texas School Survey of Drug and Alcohol Use
http://slidepdf.com/reader/full/williamson-county-round-rock-isd-1998-texas-school-survey-of-drug-and-alcohol 133/213
Q14A Frequency Percent
───────────────────────────
None 99.44157 3.3
A Few 661.9471 22.3
Some 788.0445 26.5Most 1180.371 39.7
All 244.8967 8.2
Frequency Missing = 17.29902535
The frequencies have been weighted so that the
analysis reflects the distribution of students by grade
level in the district
Round Rock
Spring 1998
HOW MANY FRIENDS
CARRY WEAPONS
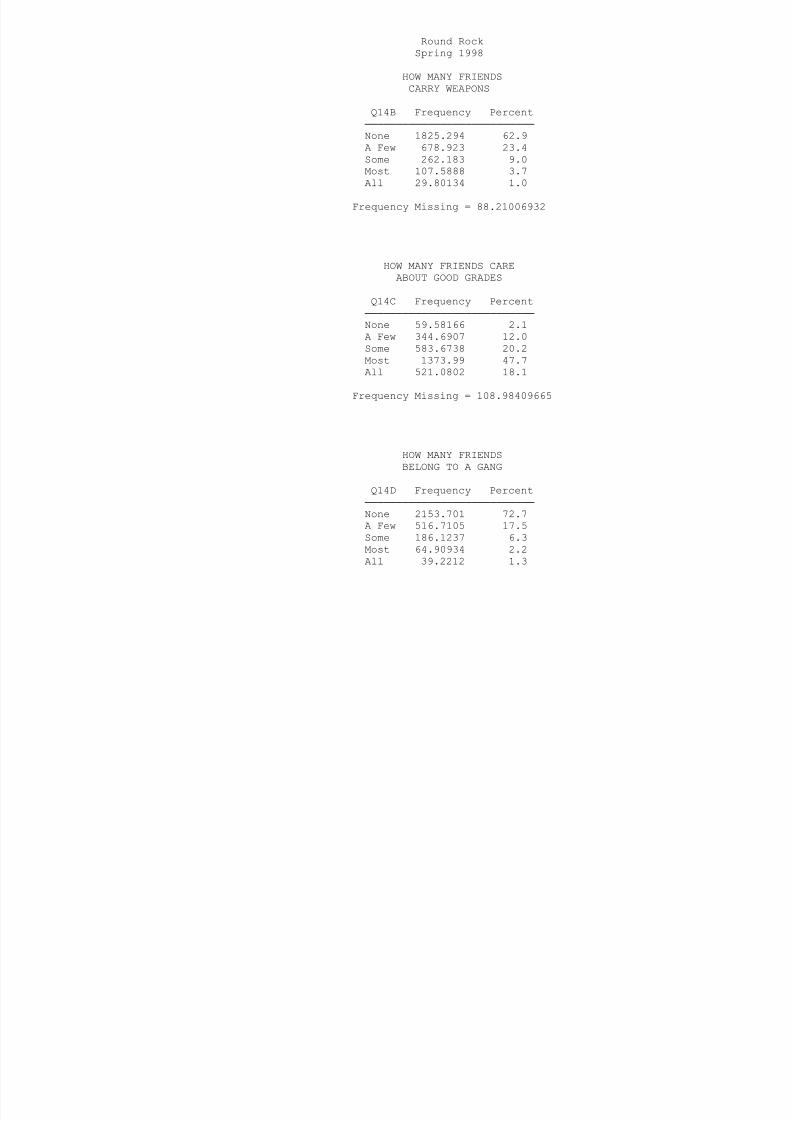
8/14/2019 WILLIAMSON COUNTY - Round Rock ISD - 1998 Texas School Survey of Drug and Alcohol Use
http://slidepdf.com/reader/full/williamson-county-round-rock-isd-1998-texas-school-survey-of-drug-and-alcohol 134/213
Q14B Frequency Percent
───────────────────────────
None 1825.294 62.9
A Few 678.923 23.4
Some 262.183 9.0Most 107.5888 3.7
All 29.80134 1.0
Frequency Missing = 88.21006932
HOW MANY FRIENDS CARE
ABOUT GOOD GRADES
Q14C Frequency Percent───────────────────────────
None 59.58166 2.1
A Few 344.6907 12.0
Some 583.6738 20.2
Most 1373.99 47.7
All 521.0802 18.1
Frequency Missing = 108.98409665
HOW MANY FRIENDS
BELONG TO A GANG
Q14D Frequency Percent
───────────────────────────
None 2153.701 72.7
A Few 516.7105 17.5
Some 186.1237 6.3
Most 64.90934 2.2
All 39.2212 1.3
Frequency Missing = 31.3338823
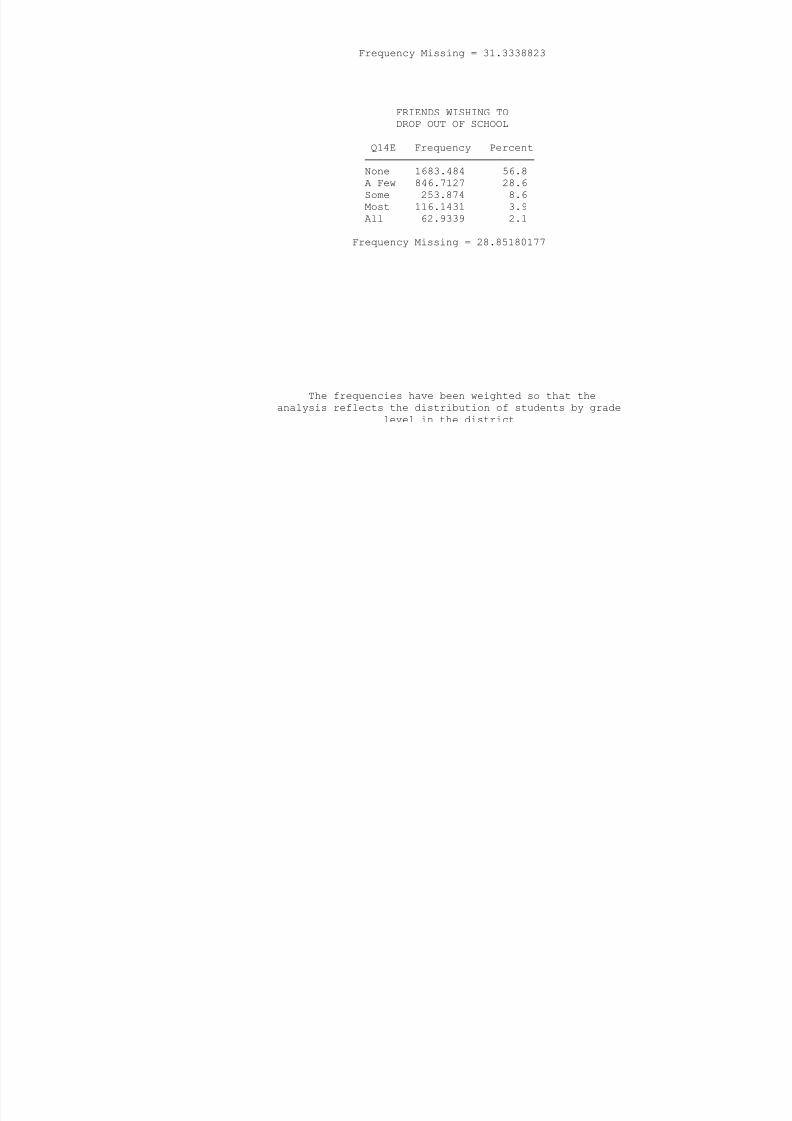
8/14/2019 WILLIAMSON COUNTY - Round Rock ISD - 1998 Texas School Survey of Drug and Alcohol Use
http://slidepdf.com/reader/full/williamson-county-round-rock-isd-1998-texas-school-survey-of-drug-and-alcohol 135/213
FRIENDS WISHING TO
DROP OUT OF SCHOOL
Q14E Frequency Percent
───────────────────────────None 1683.484 56.8
A Few 846.7127 28.6
Some 253.874 8.6
Most 116.1431 3.9
All 62.9339 2.1
Frequency Missing = 28.85180177
The frequencies have been weighted so that the
analysis reflects the distribution of students by grade
level in the district
Round Rock
Spring 1998
PARENTS ATTEND PTA/SCHOOL
OPEN HOUSES

8/14/2019 WILLIAMSON COUNTY - Round Rock ISD - 1998 Texas School Survey of Drug and Alcohol Use
http://slidepdf.com/reader/full/williamson-county-round-rock-isd-1998-texas-school-survey-of-drug-and-alcohol 136/213
Q15 Frequency Percent
────────────────────────────────
No 1435.631 51.7
Yes 1341.361 48.3
Frequency Missing = 215.008094
EVER INHALED SPRAY PAINT FOR KICKS
Q16A Frequency Percent
────────────────────────────────────────
Never Heard/Used 2734.404 92.5
In Your Lifetime 147.2646 5.0
Since School Began 18.66827 0.6In the Past Month 57.0731 1.9
Frequency Missing = 34.59034369
EVER INHALED WHITEOUT FOR KICKS
Q16B Frequency Percent
────────────────────────────────────────
Never Heard/Used 2617.738 89.4
In Your Lifetime 188.1639 6.4
Since School Began 56.76999 1.9
In the Past Month 65.89014 2.2
Frequency Missing = 63.43786005
EVER INHALED GASOLINE FOR KICKS
Q16C Frequency Percent
────────────────────────────────────────
Never Heard/Used 2778.636 95.3
In Your Lifetime 79.73557 2.7
Since School Began 22.16707 0.8

8/14/2019 WILLIAMSON COUNTY - Round Rock ISD - 1998 Texas School Survey of Drug and Alcohol Use
http://slidepdf.com/reader/full/williamson-county-round-rock-isd-1998-texas-school-survey-of-drug-and-alcohol 137/213
Since School Began 22.16707 0.8
In the Past Month 34.88508 1.2
Frequency Missing = 76.5764724
EVER INHALED FREON FOR KICKS
Q16D Frequency Percent
────────────────────────────────────────
Never Heard/Used 2809.085 97.2
In Your Lifetime 51.52107 1.8
Since School Began 21.77199 0.8
In the Past Month 8.96879 0.3
Frequency Missing = 100.65349583
The frequencies have been weighted so that the
analysis reflects the distribution of students by grade
level in the district
Round Rock
Spring 1998
EVER INHALED POPPERS, ETC. FOR KICKS
Q16E Frequency Percent

8/14/2019 WILLIAMSON COUNTY - Round Rock ISD - 1998 Texas School Survey of Drug and Alcohol Use
http://slidepdf.com/reader/full/williamson-county-round-rock-isd-1998-texas-school-survey-of-drug-and-alcohol 138/213
Q q y
────────────────────────────────────────
Never Heard/Used 2845.695 97.5
In Your Lifetime 37.81348 1.3
Since School Began 12.79025 0.4
In the Past Month 22.23272 0.8
Frequency Missing = 73.46882532
EVER INHALED GLUE FOR KICKS
Q16F Frequency Percent
────────────────────────────────────────
Never Heard/Used 2726.904 94.1
In Your Lifetime 119.4556 4.1Since School Began 28.03417 1.0
In the Past Month 22.75041 0.8
Frequency Missing = 94.85567207
EVER INHALED PAINT THINNERS FOR KICKS
Q16G Frequency Percent
────────────────────────────────────────
Never Heard/Used 2760.283 95.1
In Your Lifetime 82.52471 2.8
Since School Began 21.70238 0.7
In the Past Month 37.23807 1.3
Frequency Missing = 90.25208454

8/14/2019 WILLIAMSON COUNTY - Round Rock ISD - 1998 Texas School Survey of Drug and Alcohol Use
http://slidepdf.com/reader/full/williamson-county-round-rock-isd-1998-texas-school-survey-of-drug-and-alcohol 139/213
Round Rock
Spring 1998
EVER INHALED OTHER SPRAYS FOR KICKS
Q16J Frequency Percent

8/14/2019 WILLIAMSON COUNTY - Round Rock ISD - 1998 Texas School Survey of Drug and Alcohol Use
http://slidepdf.com/reader/full/williamson-county-round-rock-isd-1998-texas-school-survey-of-drug-and-alcohol 140/213
q y
────────────────────────────────────────
Never Heard/Used 2772.528 96.2
In Your Lifetime 58.71861 2.0
Since School Began 21.20933 0.7
In the Past Month 30.33623 1.1
Frequency Missing = 109.20760834
EVER INHALED OTHER INHALANTS FOR KICKS
Q16K Frequency Percent
────────────────────────────────────────
Never Heard/Used 2623.217 89.9
In Your Lifetime 141.3749 4.8Since School Began 50.59477 1.7
In the Past Month 101.6781 3.5
Frequency Missing = 75.13513437
RECENT CIGARETTE USE
Q17A Frequency Percent
────────────────────────────────────────
Never Heard/Used 1453.378 48.9
In Your Lifetime 490.3781 16.5
Since School Began 281.3709 9.5
In the Past Month 745.9565 25.1
Frequency Missing = 20.9168358
RECENT SMOKELESS TOBACCO USE
Q17B Frequency Percent
────────────────────────────────────────
Never Heard/Used 2450.277 83.7
In Your Lifetime 201.6917 6.9

8/14/2019 WILLIAMSON COUNTY - Round Rock ISD - 1998 Texas School Survey of Drug and Alcohol Use
http://slidepdf.com/reader/full/williamson-county-round-rock-isd-1998-texas-school-survey-of-drug-and-alcohol 141/213
Since School Began 118.2131 4.0
In the Past Month 155.7752 5.3
Frequency Missing = 66.04315667
RECENT BEER USE
Q17C Frequency Percent
────────────────────────────────────────
Never Heard/Used 1294.197 44.2
In Your Lifetime 498.8388 17.0
Since School Began 342.0232 11.7
In the Past Month 794.8049 27.1
Frequency Missing = 62.13634346
The frequencies have been weighted so that the
analysis reflects the distribution of students by grade
level in the district
Round Rock
Spring 1998
RECENT WINE COOLER USE
Q17D Frequency Percent
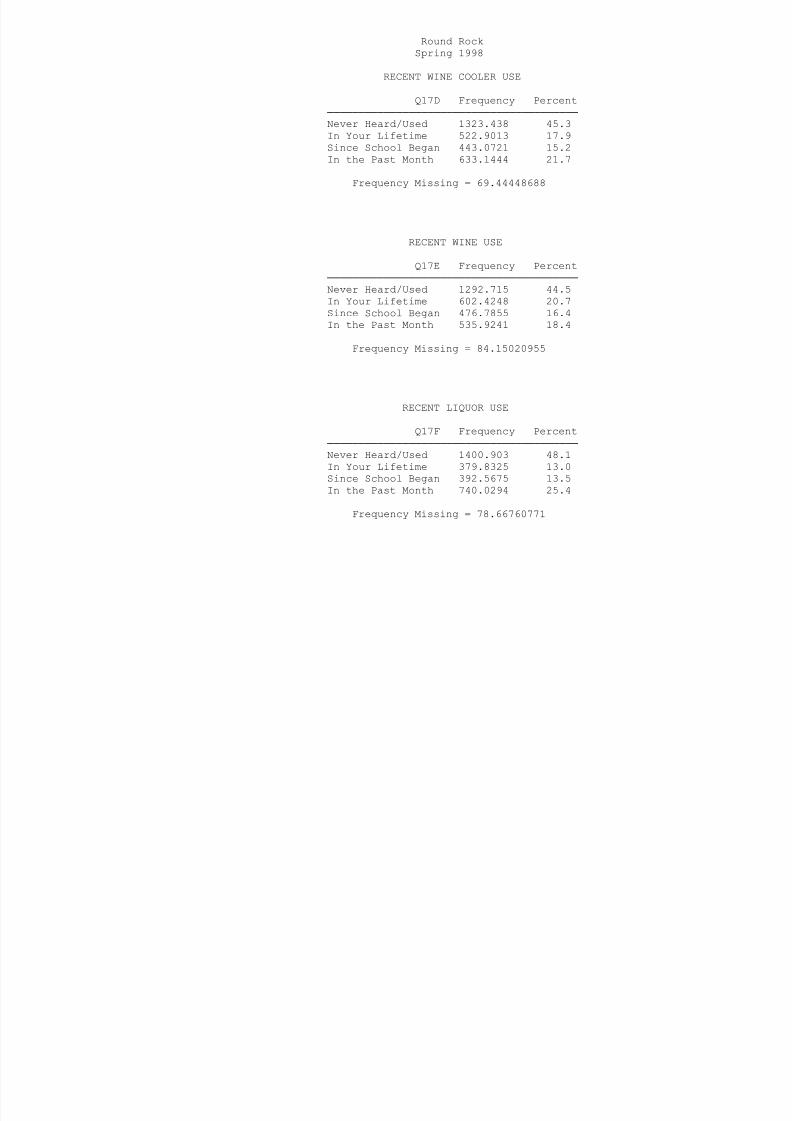
8/14/2019 WILLIAMSON COUNTY - Round Rock ISD - 1998 Texas School Survey of Drug and Alcohol Use
http://slidepdf.com/reader/full/williamson-county-round-rock-isd-1998-texas-school-survey-of-drug-and-alcohol 142/213
────────────────────────────────────────
Never Heard/Used 1323.438 45.3
In Your Lifetime 522.9013 17.9
Since School Began 443.0721 15.2
In the Past Month 633.1444 21.7
Frequency Missing = 69.44448688
RECENT WINE USE
Q17E Frequency Percent
────────────────────────────────────────
Never Heard/Used 1292.715 44.5
In Your Lifetime 602.4248 20.7Since School Began 476.7855 16.4
In the Past Month 535.9241 18.4
Frequency Missing = 84.15020955
RECENT LIQUOR USE
Q17F Frequency Percent
────────────────────────────────────────
Never Heard/Used 1400.903 48.1
In Your Lifetime 379.8325 13.0
Since School Began 392.5675 13.5
In the Past Month 740.0294 25.4
Frequency Missing = 78.66760771
RECENT MARIJUANA USE
Q18A Frequency Percent
────────────────────────────────────────
Never Heard/Used 1958.784 66.1
In Your Lifetime 266.2985 9.0

8/14/2019 WILLIAMSON COUNTY - Round Rock ISD - 1998 Texas School Survey of Drug and Alcohol Use
http://slidepdf.com/reader/full/williamson-county-round-rock-isd-1998-texas-school-survey-of-drug-and-alcohol 143/213
Since School Began 249.8982 8.4
In the Past Month 486.3015 16.4
Frequency Missing = 30.71790668
RECENT COCAINE USE
Q18B Frequency Percent
────────────────────────────────────────
Never Heard/Used 2696.447 92.7
In Your Lifetime 95.59742 3.3
Since School Began 48.50776 1.7
In the Past Month 69.22285 2.4
Frequency Missing = 82.22479804
The frequencies have been weighted so that the
analysis reflects the distribution of students by grade
level in the district
Round Rock
Spring 1998
RECENT CRACK USE
Q18C Frequency Percent
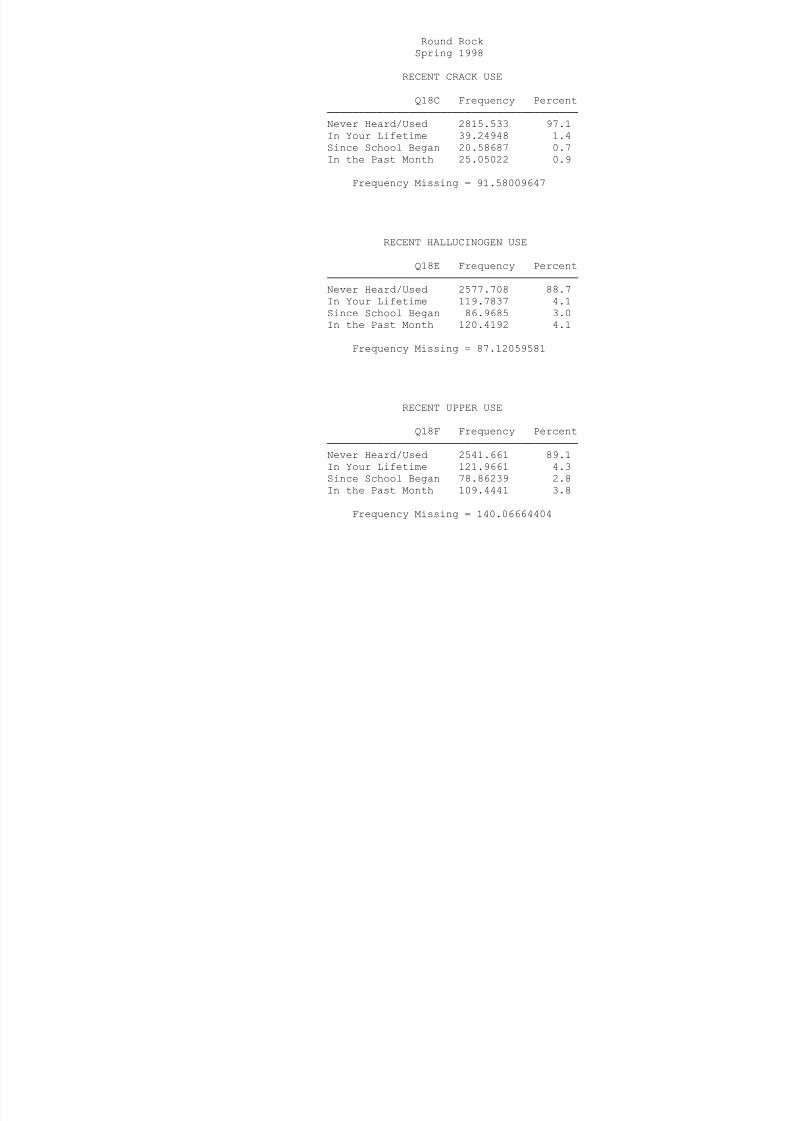
8/14/2019 WILLIAMSON COUNTY - Round Rock ISD - 1998 Texas School Survey of Drug and Alcohol Use
http://slidepdf.com/reader/full/williamson-county-round-rock-isd-1998-texas-school-survey-of-drug-and-alcohol 144/213
────────────────────────────────────────
Never Heard/Used 2815.533 97.1
In Your Lifetime 39.24948 1.4
Since School Began 20.58687 0.7
In the Past Month 25.05022 0.9
Frequency Missing = 91.58009647
RECENT HALLUCINOGEN USE
Q18E Frequency Percent
────────────────────────────────────────
Never Heard/Used 2577.708 88.7
In Your Lifetime 119.7837 4.1Since School Began 86.9685 3.0
In the Past Month 120.4192 4.1
Frequency Missing = 87.12059581
RECENT UPPER USE
Q18F Frequency Percent
────────────────────────────────────────
Never Heard/Used 2541.661 89.1
In Your Lifetime 121.9661 4.3
Since School Began 78.86239 2.8
In the Past Month 109.4441 3.8
Frequency Missing = 140.06664404
RECENT DOWNER USE
Q18G Frequency Percent
────────────────────────────────────────
Never Heard/Used 2617.329 91.9
In Your Lifetime 86.2951 3.0
i h l 67 24336 2 4

8/14/2019 WILLIAMSON COUNTY - Round Rock ISD - 1998 Texas School Survey of Drug and Alcohol Use
http://slidepdf.com/reader/full/williamson-county-round-rock-isd-1998-texas-school-survey-of-drug-and-alcohol 145/213
Since School Began 67.24336 2.4
In the Past Month 77.28009 2.7
Frequency Missing = 143.85198109
RECENT ROHYPNOL USE
Q18H Frequency Percent
────────────────────────────────────────
Never Heard/Used 2694.331 93.6
In Your Lifetime 87.22302 3.0
Since School Began 30.10268 1.0
In the Past Month 66.06479 2.3
Frequency Missing = 114.27860489
The frequencies have been weighted so that the
analysis reflects the distribution of students by grade
level in the district
Round Rock
Spring 1998
RECENT STEROID USE
Q18I Frequency Percent

8/14/2019 WILLIAMSON COUNTY - Round Rock ISD - 1998 Texas School Survey of Drug and Alcohol Use
http://slidepdf.com/reader/full/williamson-county-round-rock-isd-1998-texas-school-survey-of-drug-and-alcohol 146/213
────────────────────────────────────────
Never Heard/Used 2792.399 97.7
In Your Lifetime 30.19877 1.1
Since School Began 15.09013 0.5
In the Past Month 19.49492 0.7
Frequency Missing = 134.81721312
RECENT ECSTASY USE
Q18J Frequency Percent
────────────────────────────────────────
Never Heard/Used 2657.209 94.2
In Your Lifetime 66.96557 2.4Since School Began 37.94556 1.3
In the Past Month 58.80782 2.1
Frequency Missing = 171.07230752
RECENT HEROIN USE
Q18K Frequency Percent
────────────────────────────────────────
Never Heard/Used 2806.618 98.1
In Your Lifetime 34.23211 1.2
Since School Began 5.143224 0.2
In the Past Month 13.91493 0.5
Frequency Missing = 132.09141974
TOBACCO USE IN PAST MONTH
Q19A Frequency Percent
──────────────────────────────────────
Never Heard/Used 2094.642 71.9
1-2 times 260.8897 9.0
3 10 ti 194 0355 6 7

8/14/2019 WILLIAMSON COUNTY - Round Rock ISD - 1998 Texas School Survey of Drug and Alcohol Use
http://slidepdf.com/reader/full/williamson-county-round-rock-isd-1998-texas-school-survey-of-drug-and-alcohol 147/213
3-10 times 194.0355 6.7
11+ times 362.3218 12.4
Frequency Missing = 80.11099097
ALCOHOL USE IN PAST MONTH
Q19B Frequency Percent
──────────────────────────────────────
Never Heard/Used 1696.299 58.7
1-2 times 659.6096 22.8
3-10 times 385.009 13.3
11+ times 147.981 5.1
Frequency Missing = 103.10087458
The frequencies have been weighted so that the
analysis reflects the distribution of students by grade
level in the district
Round Rock
Spring 1998
INHALANT USE IN PAST MONTH
Q19C Frequency Percent

8/14/2019 WILLIAMSON COUNTY - Round Rock ISD - 1998 Texas School Survey of Drug and Alcohol Use
http://slidepdf.com/reader/full/williamson-county-round-rock-isd-1998-texas-school-survey-of-drug-and-alcohol 148/213
──────────────────────────────────────
Never Heard/Used 2732.14 94.8
1-2 times 106.5779 3.7
3-10 times 31.83433 1.1
11+ times 12.79562 0.4
Frequency Missing = 108.65164406
MARIJUANA USE IN PAST MONTH
Q19D Frequency Percent
──────────────────────────────────────
Never Heard/Used 2255.732 79.1
1-2 times 260.1066 9.13-10 times 173.0647 6.1
11+ times 163.4572 5.7
Frequency Missing = 139.63932508
COCAINE USE IN PAST MONTH
Q19E Frequency Percent
──────────────────────────────────────
Never Heard/Used 2748.891 96.9
1-2 times 60.29349 2.1
3-10 times 19.16513 0.7
11+ times 7.380697 0.3
Frequency Missing = 156.26967513
CRACK USE IN PAST MONTH
Q19F Frequency Percent
──────────────────────────────────────
Never Heard/Used 2802.382 98.8
1-2 times 19.46949 0.7
3-10 times 11 40162 0 4

8/14/2019 WILLIAMSON COUNTY - Round Rock ISD - 1998 Texas School Survey of Drug and Alcohol Use
http://slidepdf.com/reader/full/williamson-county-round-rock-isd-1998-texas-school-survey-of-drug-and-alcohol 149/213
3-10 times 11.40162 0.4
11+ times 3.03429 0.1
Frequency Missing = 155.71283736
CLOSE FRIENDS USE CIGARETTES
Q20A Frequency Percent
──────────────────────────────────────
Never heard/None 813.1851 27.8
A few 865.4015 29.6
Some 591.4409 20.2
Most 551.0489 18.9
All 101.9053 3.5
Frequency Missing = 69.01826443
The frequencies have been weighted so that the
analysis reflects the distribution of students by grade
level in the district
Round Rock
Spring 1998
CLOSE FRIENDS USE SMOKELESS TOBACCO
Q20B Frequency Percent
──────────────────────────────────────

8/14/2019 WILLIAMSON COUNTY - Round Rock ISD - 1998 Texas School Survey of Drug and Alcohol Use
http://slidepdf.com/reader/full/williamson-county-round-rock-isd-1998-texas-school-survey-of-drug-and-alcohol 150/213
──────────────────────────────────────
Never heard/None 1840.272 63.9
A few 602.018 20.9
Some 299.3855 10.4
Most 116.0717 4.0All 20.61401 0.7
Frequency Missing = 113.63894941
CLOSE FRIENDS USE BEER
Q20C Frequency Percent
──────────────────────────────────────
Never heard/None 825.0961 28.4A few 650.7649 22.4
Some 528.3001 18.2
Most 636.1237 21.9
All 262.3412 9.0
Frequency Missing = 89.37399999
CLOSE FRIENDS USE WINE COOLERS
Q20D Frequency Percent
──────────────────────────────────────
Never heard/None 1004.718 35.3
A few 631.7373 22.2
Some 537.9899 18.9
Most 470.4189 16.5
All 199.2102 7.0
Frequency Missing = 147.92554795
CLOSE FRIENDS USE WINE
Q20E Frequency Percent
──────────────────────────────────────

8/14/2019 WILLIAMSON COUNTY - Round Rock ISD - 1998 Texas School Survey of Drug and Alcohol Use
http://slidepdf.com/reader/full/williamson-county-round-rock-isd-1998-texas-school-survey-of-drug-and-alcohol 151/213
Never heard/None 1259.815 44.2
A few 715.3145 25.1
Some 441.7109 15.5
Most 298.596 10.5All 135.0803 4.7
Frequency Missing = 141.48330653
CLOSE FRIENDS USE LIQUOR
Q20F Frequency Percent
──────────────────────────────────────
Never heard/None 1049.823 37.2A few 552.6024 19.6
Some 470.8037 16.7
Most 528.7822 18.7
All 219.1468 7.8
Frequency Missing = 170.8419432
The frequencies have been weighted so that the
analysis reflects the distribution of students by grade
level in the district
Round Rock
Spring 1998
CLOSE FRIENDS USE INHALANTS
Q20G Frequency Percent
──────────────────────────────────────

8/14/2019 WILLIAMSON COUNTY - Round Rock ISD - 1998 Texas School Survey of Drug and Alcohol Use
http://slidepdf.com/reader/full/williamson-county-round-rock-isd-1998-texas-school-survey-of-drug-and-alcohol 152/213
Never heard/None 2310.215 81.0
A few 391.5014 13.7
Some 101.0733 3.5
Most 35.72839 1.3All 14.50391 0.5
Frequency Missing = 138.97775655
CLOSE FRIENDS USE MARIJUANA
Q20H Frequency Percent
──────────────────────────────────────
Never heard/None 1282.485 44.7A few 544.7263 19.0
Some 423.4011 14.8
Most 444.2291 15.5
All 171.7991 6.0
Frequency Missing = 125.35976074
DIFFICULT TO GET CIGARETTES
Q21A Frequency Percent
────────────────────────────────────
Never heard of 72.70661 2.5
Impossible 240.4082 8.2
Very difficult 136.7307 4.7
Somewhat diff 216.6605 7.4
Somewhat easy 581.8262 19.9
Very easy 1679.888 57.4
Frequency Missing = 63.78023889
DIFFICULT TO GET SMOKELESS TOBACCO
Q21B Frequency Percent

8/14/2019 WILLIAMSON COUNTY - Round Rock ISD - 1998 Texas School Survey of Drug and Alcohol Use
http://slidepdf.com/reader/full/williamson-county-round-rock-isd-1998-texas-school-survey-of-drug-and-alcohol 153/213
Q21B Frequency Percent
────────────────────────────────────
Never heard of 260.8466 9.2
Impossible 380.3719 13.4
Very difficult 224.0125 7.9Somewhat diff 318.7899 11.3
Somewhat easy 528.4046 18.7
Very easy 1119.602 39.5
Frequency Missing = 159.972588
The frequencies have been weighted so that the
analysis reflects the distribution of students by grade
level in the district
Round Rock
Spring 1998
DIFFICULT TO GET BEER
Q21C Frequency Percent
────────────────────────────────────

8/14/2019 WILLIAMSON COUNTY - Round Rock ISD - 1998 Texas School Survey of Drug and Alcohol Use
http://slidepdf.com/reader/full/williamson-county-round-rock-isd-1998-texas-school-survey-of-drug-and-alcohol 154/213
Never heard of 59.29627 2.1
Impossible 209.7571 7.4
Very difficult 140.7293 5.0
Somewhat diff 345.0227 12.2Somewhat easy 699.553 24.7
Very easy 1383.127 48.7
Frequency Missing = 154.51436634
DIFFICULT TO GET WINE COOLERS
Q21D Frequency Percent
────────────────────────────────────Never heard of 110.5839 4.0
Impossible 258.4264 9.2
Very difficult 164.6225 5.9
Somewhat diff 366.8559 13.1
Somewhat easy 709.5047 25.4
Very easy 1185.255 42.4
Frequency Missing = 196.7519126
DIFFICULT TO GET WINE
Q21E Frequency Percent
────────────────────────────────────
Never heard of 73.97833 2.7
Impossible 234.0275 8.4
Very difficult 187.0486 6.7
Somewhat diff 365.5821 13.1
Somewhat easy 733.2123 26.3
Very easy 1197.125 42.9
Frequency Missing = 201.02554732
DIFFICULT TO GET LIQUOR

8/14/2019 WILLIAMSON COUNTY - Round Rock ISD - 1998 Texas School Survey of Drug and Alcohol Use
http://slidepdf.com/reader/full/williamson-county-round-rock-isd-1998-texas-school-survey-of-drug-and-alcohol 155/213
Q21F Frequency Percent
────────────────────────────────────
Never heard of 76.17402 2.8
Impossible 321.5827 11.8
Very difficult 208.3724 7.6
Somewhat diff 343.1035 12.6
Somewhat easy 609.6545 22.3
Very easy 1170.906 42.9
Frequency Missing = 262.20725432
The frequencies have been weighted so that the
analysis reflects the distribution of students by grade
level in the district
Round Rock
Spring 1998
DIFFICULT TO GET INHALANTS
Q21G Frequency Percent
────────────────────────────────────

8/14/2019 WILLIAMSON COUNTY - Round Rock ISD - 1998 Texas School Survey of Drug and Alcohol Use
http://slidepdf.com/reader/full/williamson-county-round-rock-isd-1998-texas-school-survey-of-drug-and-alcohol 156/213
Never heard of 176.9975 6.2
Impossible 257.8428 9.1
Very difficult 91.70954 3.2
Somewhat diff 152.0726 5.4
Somewhat easy 275.6405 9.7
Very easy 1886.179 66.4
Frequency Missing = 151.5581625
DIFFICULT TO GET MARIJUANA
Q21H Frequency Percent
────────────────────────────────────Never heard of 107.0468 3.8
Impossible 567.7716 20.3
Very difficult 300.8736 10.8
Somewhat diff 355.7076 12.7
Somewhat easy 554.2577 19.8
Very easy 907.0011 32.5
Frequency Missing = 199.34159065
DIFFICULT TO GET COCAINE
Q21I Frequency Percent
────────────────────────────────────
Never heard of 173.4126 6.2
Impossible 810.8826 29.1
Very difficult 618.7001 22.2
Somewhat diff 582.1423 20.9
Somewhat easy 355.696 12.8
Very easy 248.2845 8.9
Frequency Missing = 202.88183303
DIFFICULT TO GET CRACK
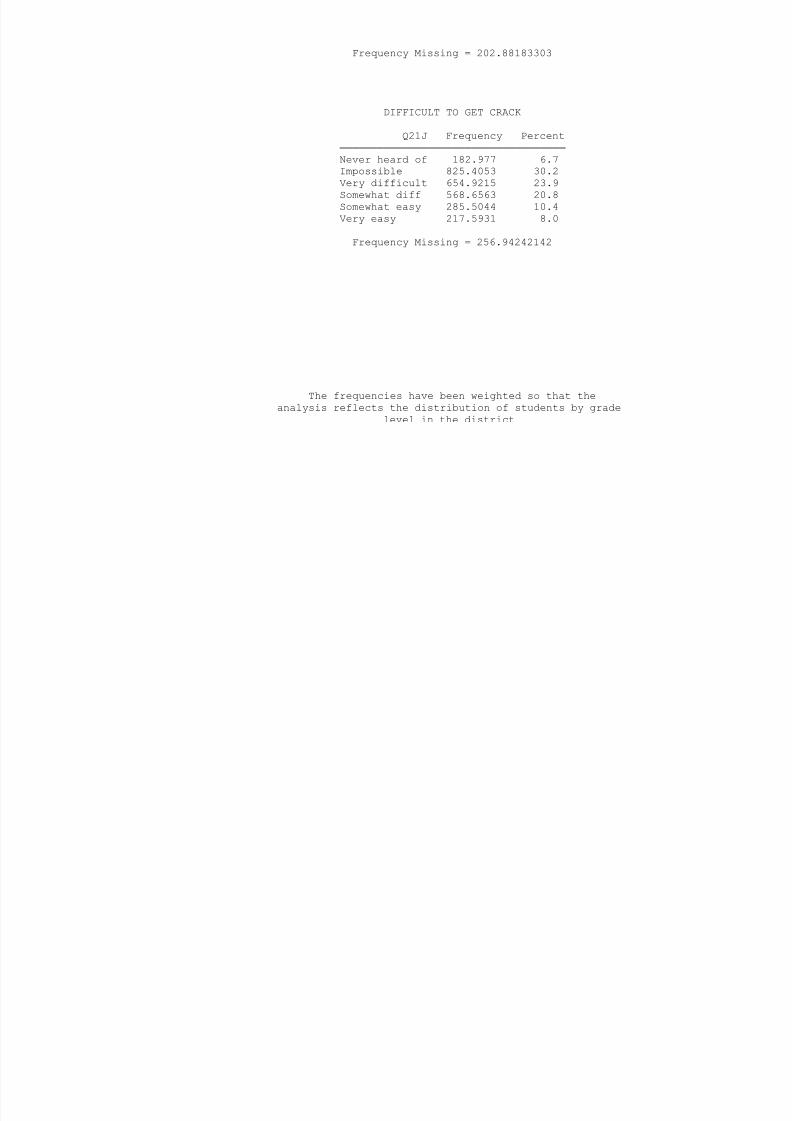
8/14/2019 WILLIAMSON COUNTY - Round Rock ISD - 1998 Texas School Survey of Drug and Alcohol Use
http://slidepdf.com/reader/full/williamson-county-round-rock-isd-1998-texas-school-survey-of-drug-and-alcohol 157/213
Q21J Frequency Percent
────────────────────────────────────
Never heard of 182.977 6.7
Impossible 825.4053 30.2
Very difficult 654.9215 23.9
Somewhat diff 568.6563 20.8
Somewhat easy 285.5044 10.4
Very easy 217.5931 8.0
Frequency Missing = 256.94242142
The frequencies have been weighted so that the
analysis reflects the distribution of students by grade
level in the district
Round Rock
Spring 1998
DIFFICULT TO GET HALLUCINOGENS
Q21L Frequency Percent
────────────────────────────────────

8/14/2019 WILLIAMSON COUNTY - Round Rock ISD - 1998 Texas School Survey of Drug and Alcohol Use
http://slidepdf.com/reader/full/williamson-county-round-rock-isd-1998-texas-school-survey-of-drug-and-alcohol 158/213
Never heard of 468.0754 16.8
Impossible 742.3923 26.6
Very difficult 505.5855 18.1
Somewhat diff 468.8069 16.8
Somewhat easy 288.1744 10.3
Very easy 314.7816 11.3
Frequency Missing = 204.18388633
DIFFICULT TO GET UPPERS
Q21M Frequency Percent
────────────────────────────────────Never heard of 674.7693 24.6
Impossible 537.7089 19.6
Very difficult 416.3122 15.2
Somewhat diff 445.4421 16.3
Somewhat easy 355.2051 13.0
Very easy 310.2136 11.3
Frequency Missing = 252.34881354
DIFFICULT TO GET DOWNERS
Q21N Frequency Percent
────────────────────────────────────
Never heard of 657.0875 24.6
Impossible 528.8676 19.8
Very difficult 398.7481 14.9
Somewhat diff 443.3879 16.6
Somewhat easy 356.491 13.4
Very easy 285.4037 10.7
Frequency Missing = 322.01419716
DIFFICULT TO GET ROHYPNOL

8/14/2019 WILLIAMSON COUNTY - Round Rock ISD - 1998 Texas School Survey of Drug and Alcohol Use
http://slidepdf.com/reader/full/williamson-county-round-rock-isd-1998-texas-school-survey-of-drug-and-alcohol 159/213
Q21O Frequency Percent
────────────────────────────────────
Never heard of 937.8226 34.0
Impossible 505.4323 18.3
Very difficult 401.503 14.6
Somewhat diff 393.065 14.3
Somewhat easy 264.5247 9.6
Very easy 254.1388 9.2
Frequency Missing = 235.51365161
The frequencies have been weighted so that the
analysis reflects the distribution of students by grade
level in the district
Round Rock
Spring 1998
DIFFICULT TO GET STEROIDS
Q21P Frequency Percent
────────────────────────────────────
h d f 246 3861 9 0

8/14/2019 WILLIAMSON COUNTY - Round Rock ISD - 1998 Texas School Survey of Drug and Alcohol Use
http://slidepdf.com/reader/full/williamson-county-round-rock-isd-1998-texas-school-survey-of-drug-and-alcohol 160/213
Never heard of 246.3861 9.0
Impossible 814.0956 29.7
Very difficult 586.1728 21.4
Somewhat diff 516.4658 18.8
Somewhat easy 325.1573 11.8
Very easy 256.425 9.3
Frequency Missing = 247.29746017
DIFFICULT TO GET ECSTASY
Q21Q Frequency Percent
────────────────────────────────────Never heard of 758.0937 27.3
Impossible 593.0381 21.3
Very difficult 461.7451 16.6
Somewhat diff 384.1569 13.8
Somewhat easy 298.0621 10.7
Very easy 284.8403 10.2
Frequency Missing = 212.06383305
DIFFICULT TO GET HEROIN
Q21R Frequency Percent
────────────────────────────────────
Never heard of 251.7076 9.1
Impossible 992.5177 35.8
Very difficult 691.6278 24.9
Somewhat diff 423.1514 15.2
Somewhat easy 214.3761 7.7
Very easy 202.0662 7.3

8/14/2019 WILLIAMSON COUNTY - Round Rock ISD - 1998 Texas School Survey of Drug and Alcohol Use
http://slidepdf.com/reader/full/williamson-county-round-rock-isd-1998-texas-school-survey-of-drug-and-alcohol 161/213

8/14/2019 WILLIAMSON COUNTY - Round Rock ISD - 1998 Texas School Survey of Drug and Alcohol Use
http://slidepdf.com/reader/full/williamson-county-round-rock-isd-1998-texas-school-survey-of-drug-and-alcohol 162/213
AGE WHEN FIRST USED WINE COOLERS
Q22D Frequency Percent
───────────────────────────────────
Never used it 1222.572 42.4
9 or younger 197.6482 6.9
10 years old 127 0525 4 4

8/14/2019 WILLIAMSON COUNTY - Round Rock ISD - 1998 Texas School Survey of Drug and Alcohol Use
http://slidepdf.com/reader/full/williamson-county-round-rock-isd-1998-texas-school-survey-of-drug-and-alcohol 163/213
10 years old 127.0525 4.4
11 years old 183.0331 6.3
12 years old 281.422 9.8
13 years old 257.8333 8.9
14 years old 238.5522 8.3
15 years old 206.6213 7.2
16 years old 133.8907 4.6
17 years old 32.01456 1.1
18 or older 3.476871 0.1
Frequency Missing = 107.88326674
The frequencies have been weighted so that the
analysis reflects the distribution of students by grade
level in the district
Round Rock
Spring 1998
AGE WHEN FIRST USED WINE
Q22E Frequency Percent
───────────────────────────────────
Never used it 1248 485 43 2

8/14/2019 WILLIAMSON COUNTY - Round Rock ISD - 1998 Texas School Survey of Drug and Alcohol Use
http://slidepdf.com/reader/full/williamson-county-round-rock-isd-1998-texas-school-survey-of-drug-and-alcohol 164/213
Never used it 1248.485 43.2
9 or younger 234.134 8.1
10 years old 140.5614 4.9
11 years old 179.4773 6.2
12 years old 253.2061 8.8
13 years old 275.3343 9.5
14 years old 235.6734 8.1
15 years old 174.2644 6.0
16 years old 116.2688 4.0
17 years old 28.52249 1.0
18 or older 6.297842 0.2
Frequency Missing = 99.77518118
AGE WHEN FIRST USED LIQUOR
Q22F Frequency Percent
───────────────────────────────────
Never used it 1351.172 47.7
9 or younger 120.8851 4.3
10 years old 67.6265 2.4
11 years old 120.1531 4.2
12 years old 175.0138 6.2
13 years old 276.1248 9.7
14 years old 275.1109 9.715 years old 229.8207 8.1
16 years old 153.3309 5.4
17 years old 54.66585 1.9
18 or older 10.78438 0.4
Frequency Missing = 157.3118367
AGE WHEN FIRST USED INHALANTS
Q22G Frequency Percent
───────────────────────────────────
Never used it 2475.561 86.1
9 or younger 72.17204 2.5
10 years old 36.20176 1.3
11 years old 48 20295 1 7

8/14/2019 WILLIAMSON COUNTY - Round Rock ISD - 1998 Texas School Survey of Drug and Alcohol Use
http://slidepdf.com/reader/full/williamson-county-round-rock-isd-1998-texas-school-survey-of-drug-and-alcohol 165/213
11 years old 48.20295 1.7
12 years old 78.0808 2.7
13 years old 83.48273 2.9
14 years old 40.49373 1.4
15 years old 29.11797 1.0
16 years old 8.213319 0.3
17 years old 2.784535 0.1
18 or older 1.0461 0.0
Frequency Missing = 116.64279071
The frequencies have been weighted so that the
analysis reflects the distribution of students by grade
level in the district
Round Rock
Spring 1998
AGE WHEN FIRST USED MARIJUANA
Q22H Frequency Percent
───────────────────────────────────
Never used it 1872 294 65 9

8/14/2019 WILLIAMSON COUNTY - Round Rock ISD - 1998 Texas School Survey of Drug and Alcohol Use
http://slidepdf.com/reader/full/williamson-county-round-rock-isd-1998-texas-school-survey-of-drug-and-alcohol 166/213
Never used it 1872.294 65.9
9 or younger 31.73353 1.1
10 years old 29.70005 1.0
11 years old 71.25752 2.5
12 years old 153.147 5.4
13 years old 189.9612 6.7
14 years old 184.8709 6.5
15 years old 173.3325 6.1
16 years old 92.75245 3.3
17 years old 38.50447 1.4
18 or older 4.346088 0.2
Frequency Missing = 150.1005645
AGE WHEN FIRST USED COCAINE
Q22I Frequency Percent
───────────────────────────────────
Never used it 2628.696 92.8
9 or younger 3.768609 0.1
10 years old 3.768928 0.1
11 years old 1.817015 0.1
12 years old 16.30627 0.6
13 years old 32.29774 1.1
14 years old 30.18789 1.115 years old 50.55072 1.8
16 years old 42.72456 1.5
17 years old 17.22266 0.6
18 or older 6.438288 0.2
Frequency Missing = 158.22143449
AGE WHEN FIRST USED CRACK
Q22J Frequency Percent
───────────────────────────────────
Never used it 2693.373 97.4
9 or younger 2.686233 0.1
10 years old 2.899551 0.1
12 years old 7.189799 0.3

8/14/2019 WILLIAMSON COUNTY - Round Rock ISD - 1998 Texas School Survey of Drug and Alcohol Use
http://slidepdf.com/reader/full/williamson-county-round-rock-isd-1998-texas-school-survey-of-drug-and-alcohol 167/213
12 years old 7.189799 0.3
13 years old 19.95007 0.7
14 years old 11.79026 0.4
15 years old 14.26661 0.5
16 years old 7.661269 0.3
17 years old 3.830635 0.1
18 or older 0.869218 0.0
Frequency Missing = 227.48371802
The frequencies have been weighted so that the
analysis reflects the distribution of students by grade
level in the district
Round Rock
Spring 1998
AGE WHEN FIRST USED HALLUCINOGENS
Q22L Frequency Percent
───────────────────────────────────
Never used it 2503.493 88.9
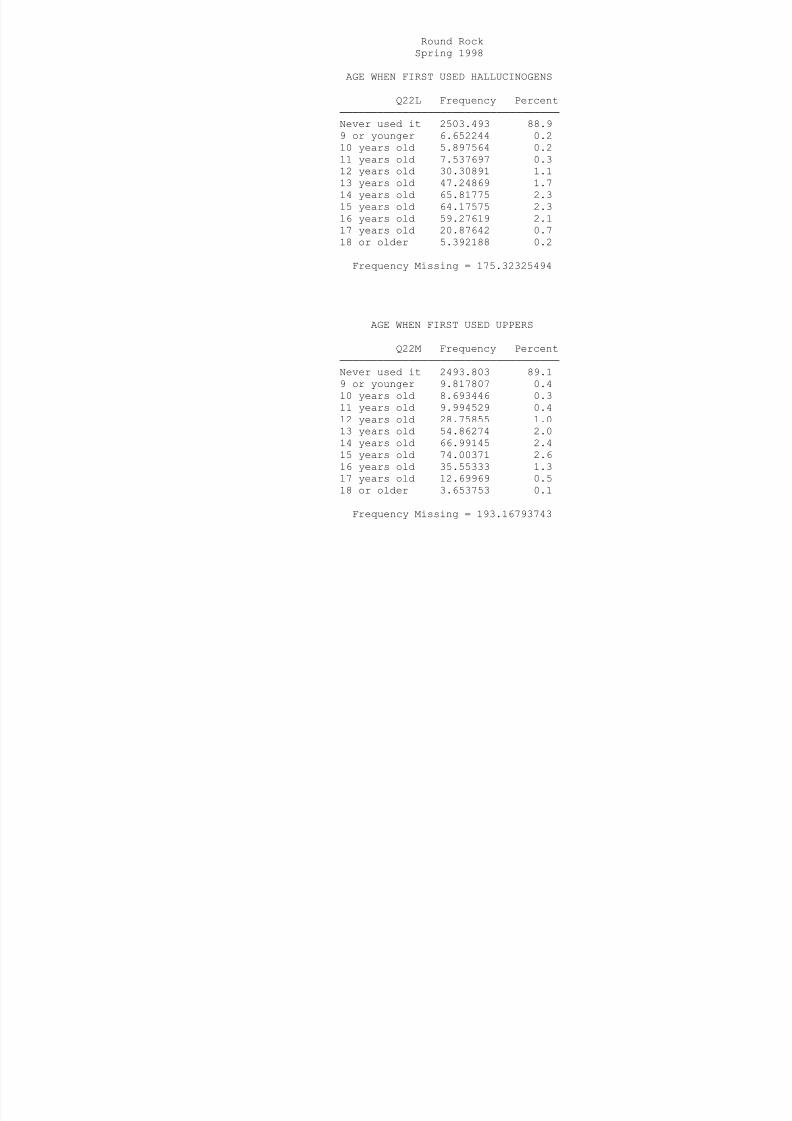
8/14/2019 WILLIAMSON COUNTY - Round Rock ISD - 1998 Texas School Survey of Drug and Alcohol Use
http://slidepdf.com/reader/full/williamson-county-round-rock-isd-1998-texas-school-survey-of-drug-and-alcohol 168/213
Never used it 2503.493 88.9
9 or younger 6.652244 0.2
10 years old 5.897564 0.2
11 years old 7.537697 0.3
12 years old 30.30891 1.1
13 years old 47.24869 1.7
14 years old 65.81775 2.3
15 years old 64.17575 2.3
16 years old 59.27619 2.1
17 years old 20.87642 0.7
18 or older 5.392188 0.2
Frequency Missing = 175.32325494
AGE WHEN FIRST USED UPPERS
Q22M Frequency Percent
───────────────────────────────────
Never used it 2493.803 89.1
9 or younger 9.817807 0.4
10 years old 8.693446 0.3
11 years old 9.994529 0.4
12 years old 28.75855 1.0
13 years old 54.86274 2.0
14 years old 66.99145 2.415 years old 74.00371 2.6
16 years old 35.55333 1.3
17 years old 12.69969 0.5
18 or older 3.653753 0.1
Frequency Missing = 193.16793743
AGE WHEN FIRST USED DOWNERS
Q22N Frequency Percent
───────────────────────────────────
Never used it 2521.791 91.9
9 or younger 4.638146 0.2
10 years old 6.241995 0.2
11 years old 8.833732 0.3

8/14/2019 WILLIAMSON COUNTY - Round Rock ISD - 1998 Texas School Survey of Drug and Alcohol Use
http://slidepdf.com/reader/full/williamson-county-round-rock-isd-1998-texas-school-survey-of-drug-and-alcohol 169/213
y
12 years old 22.15175 0.8
13 years old 48.40741 1.8
14 years old 50.0096 1.8
15 years old 48.08762 1.8
16 years old 22.6141 0.8
17 years old 7.999841 0.3
18 or older 2.784535 0.1
Frequency Missing = 248.43981839
The frequencies have been weighted so that the
analysis reflects the distribution of students by grade
level in the district
Round Rock
Spring 1998
AGE WHEN FIRST USED ROHYPNOL
Q22O Frequency Percent
───────────────────────────────────
Never used it 2632.822 93.3

8/14/2019 WILLIAMSON COUNTY - Round Rock ISD - 1998 Texas School Survey of Drug and Alcohol Use
http://slidepdf.com/reader/full/williamson-county-round-rock-isd-1998-texas-school-survey-of-drug-and-alcohol 170/213
9 or younger 2.686233 0.1
10 years old 5.007985 0.2
11 years old 10.74036 0.4
12 years old 22.06372 0.8
13 years old 30.08455 1.1
14 years old 46.28272 1.6
15 years old 34.03433 1.2
16 years old 25.18532 0.9
17 years old 9.222823 0.3
18 or older 2.607653 0.1
Frequency Missing = 171.26229866
AGE WHEN FIRST USED STEROIDS
Q22P Frequency Percent
───────────────────────────────────
Never used it 2671.494 98.0
9 or younger 4.893288 0.2
10 years old 2.103387 0.1
11 years old 2.941375 0.1
12 years old 10.36453 0.4
13 years old 6.163735 0.2
14 years old 11.62472 0.415 years old 1.23401 0.0
16 years old 7.838151 0.3
17 years old 5.745952 0.2
18 or older 0.869218 0.0
Frequency Missing = 266.72734027
AGE WHEN FIRST USED ECSTASY
Q22Q Frequency Percent
───────────────────────────────────
Never used it 2601.308 94.4
9 or younger 3.654072 0.1
10 years old 3.051025 0.1
11 years old 0.869377 0.0

8/14/2019 WILLIAMSON COUNTY - Round Rock ISD - 1998 Texas School Survey of Drug and Alcohol Use
http://slidepdf.com/reader/full/williamson-county-round-rock-isd-1998-texas-school-survey-of-drug-and-alcohol 171/213
12 years old 5.934 0.2
13 years old 26.30535 1.0
14 years old 30.59435 1.1
15 years old 30.16726 1.1
16 years old 27.07939 1.0
17 years old 23.52051 0.9
18 or older 4.559407 0.2
Frequency Missing = 234.95689576
The frequencies have been weighted so that the
analysis reflects the distribution of students by grade
level in the district
Round Rock
Spring 1998
AGE WHEN FIRST USED HEROIN
Q22R Frequency Percent
───────────────────────────────────
Never used it 2675.81 98.2

8/14/2019 WILLIAMSON COUNTY - Round Rock ISD - 1998 Texas School Survey of Drug and Alcohol Use
http://slidepdf.com/reader/full/williamson-county-round-rock-isd-1998-texas-school-survey-of-drug-and-alcohol 172/213
9 or younger 2.686073 0.1
10 years old 2.103387 0.1
11 years old 2.997853 0.1
12 years old 6.976475 0.3
13 years old 10.00588 0.4
14 years old 13.07694 0.5
15 years old 5.137517 0.2
16 years old 4.257271 0.2
17 years old 1.951754 0.1
18 or older 0.869218 0.0
Frequency Missing = 266.12810031
HOW OFTEN NORMALLY USE CIGARETTES
Q23A Frequency Percent
──────────────────────────────────────
Every day 263.6448 9.2
Several times/wk 143.7148 5.0
Several times/mo 198.3499 6.9
About once/month 254.2848 8.9
About once/year 177.4744 6.2
< once/year 346.1101 12.1
Never used 1481.9 51.7
Frequency Missing = 126.52123209
HOW OFTEN NORMALLY USE
SMOKELESS TOBACCO
Q23B Frequency Percent

8/14/2019 WILLIAMSON COUNTY - Round Rock ISD - 1998 Texas School Survey of Drug and Alcohol Use
http://slidepdf.com/reader/full/williamson-county-round-rock-isd-1998-texas-school-survey-of-drug-and-alcohol 173/213
Round Rock
Spring 1998
HOW OFTEN NORMALLY USE WINE COOLERS
Q23D Frequency Percent
──────────────────────────────────────
Every day 8.219157 0.3

8/14/2019 WILLIAMSON COUNTY - Round Rock ISD - 1998 Texas School Survey of Drug and Alcohol Use
http://slidepdf.com/reader/full/williamson-county-round-rock-isd-1998-texas-school-survey-of-drug-and-alcohol 174/213
Several times/wk 61.95091 2.3
Several times/mo 272.4915 9.9
About once/month 499.4697 18.2
About once/year 411.0676 15.0< once/year 272.4433 9.9
Never used 1213.618 44.3
Frequency Missing = 252.73938617
HOW OFTEN NORMALLY USE WINE
Q23E Frequency Percent──────────────────────────────────────
Every day 9.526221 0.3
Several times/wk 51.33112 1.9
Several times/mo 192.5611 6.9
About once/month 409.491 14.8
About once/year 561.6525 20.2
< once/year 300.9592 10.8
Never used 1248.937 45.0
Frequency Missing = 217.54189146
HOW OFTEN NORMALLY USE LIQUOR
Q23F Frequency Percent
──────────────────────────────────────
Every day 8.698653 0.3
Several times/wk 80.91393 3.0
Several times/mo 308.4567 11.4
About once/month 438.9381 16.2
About once/year 347.0212 12.8
< once/year 205.8235 7.6
Never used 1316.548 48.6
Frequency Missing = 285.60016328

8/14/2019 WILLIAMSON COUNTY - Round Rock ISD - 1998 Texas School Survey of Drug and Alcohol Use
http://slidepdf.com/reader/full/williamson-county-round-rock-isd-1998-texas-school-survey-of-drug-and-alcohol 175/213
HOW OFTEN NORMALLY USE INHALANTS
Q23G Frequency Percent──────────────────────────────────────
Every day 8.558708 0.3
Several times/wk 19.59032 0.7
Several times/mo 34.50464 1.2
About once/month 45.49146 1.6
About once/year 78.93675 2.9
< once/year 150.3753 5.4
Never used 2431.885 87.8
Frequency Missing = 222.6581557
The frequencies have been weighted so that the
analysis reflects the distribution of students by grade
level in the district
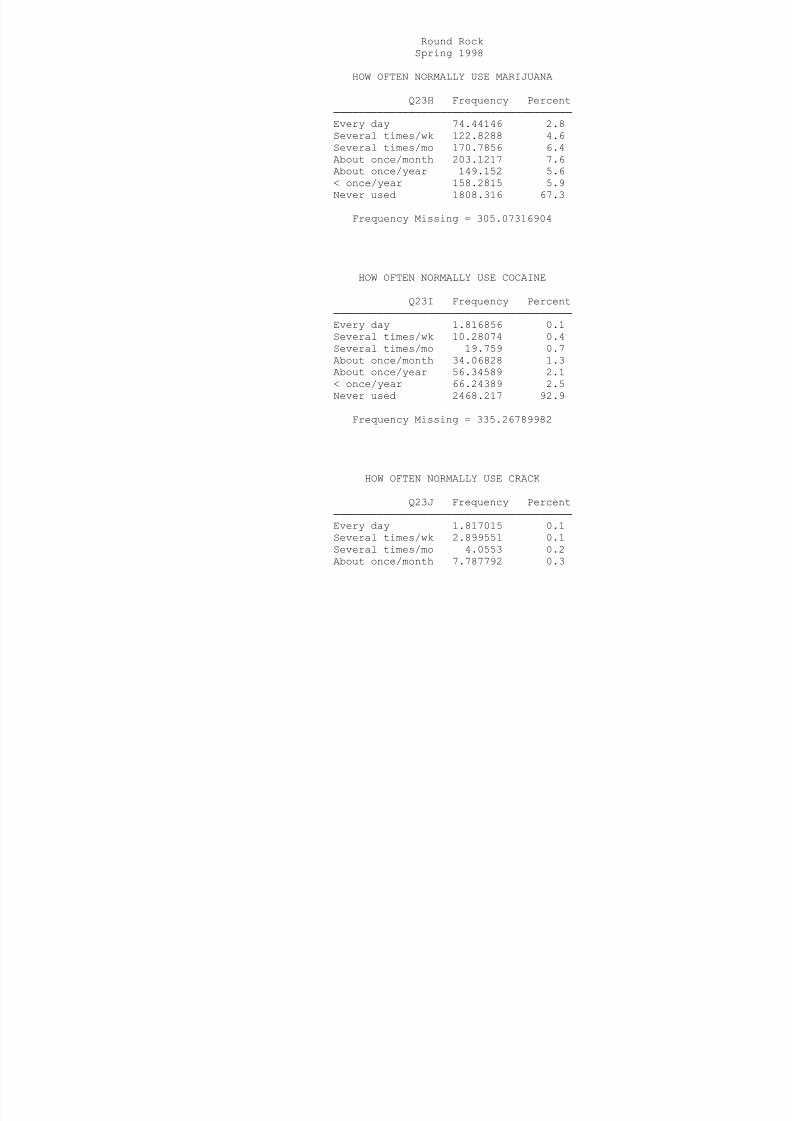
8/14/2019 WILLIAMSON COUNTY - Round Rock ISD - 1998 Texas School Survey of Drug and Alcohol Use
http://slidepdf.com/reader/full/williamson-county-round-rock-isd-1998-texas-school-survey-of-drug-and-alcohol 176/213
About once/year 21.02977 0.8
< once/year 27.41001 1.1
Never used 2505.995 97.5
Frequency Missing = 421.00530296
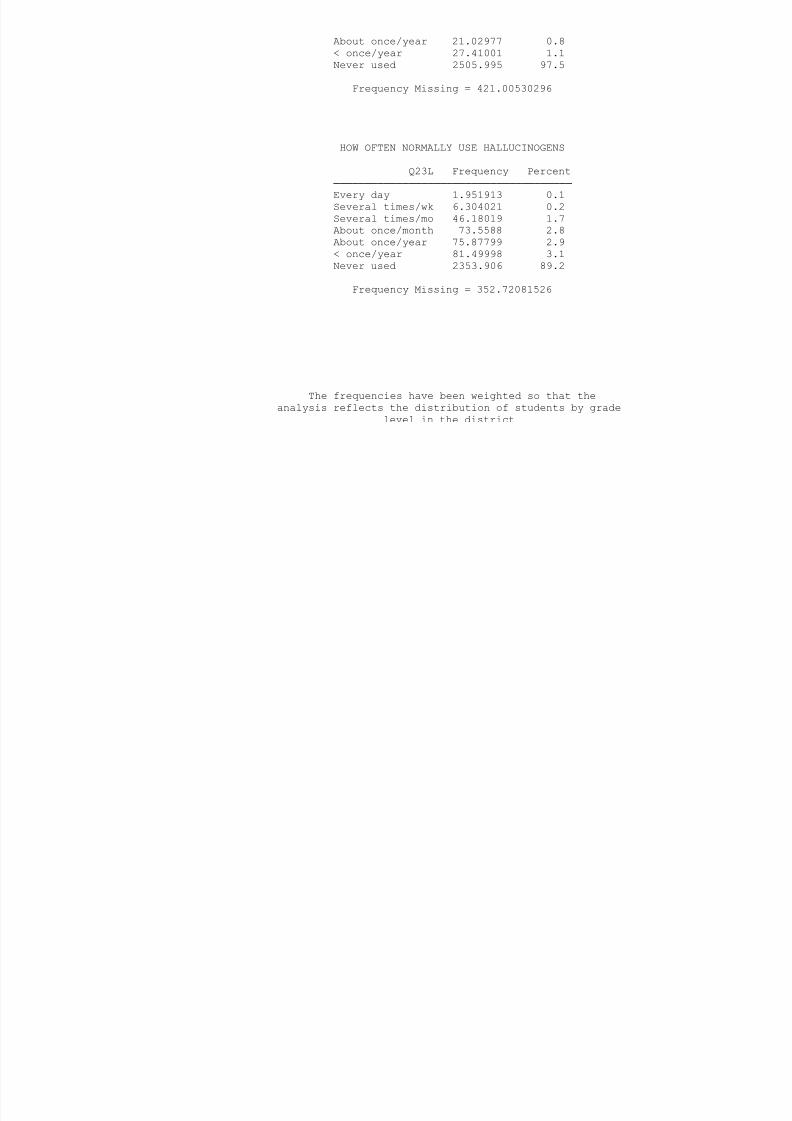
8/14/2019 WILLIAMSON COUNTY - Round Rock ISD - 1998 Texas School Survey of Drug and Alcohol Use
http://slidepdf.com/reader/full/williamson-county-round-rock-isd-1998-texas-school-survey-of-drug-and-alcohol 177/213
HOW OFTEN NORMALLY USE HALLUCINOGENS
Q23L Frequency Percent──────────────────────────────────────
Every day 1.951913 0.1
Several times/wk 6.304021 0.2
Several times/mo 46.18019 1.7
About once/month 73.5588 2.8
About once/year 75.87799 2.9
< once/year 81.49998 3.1
Never used 2353.906 89.2
Frequency Missing = 352.72081526
The frequencies have been weighted so that the
analysis reflects the distribution of students by grade
level in the district
Round Rock
Spring 1998
HOW OFTEN NORMALLY USE UPPERS
Q23M Frequency Percent
──────────────────────────────────────
Every day 11.96646 0.5
Several times/wk 18 90745 0 7

8/14/2019 WILLIAMSON COUNTY - Round Rock ISD - 1998 Texas School Survey of Drug and Alcohol Use
http://slidepdf.com/reader/full/williamson-county-round-rock-isd-1998-texas-school-survey-of-drug-and-alcohol 178/213
Several times/wk 18.90745 0.7
Several times/mo 35.03765 1.3
About once/month 64.7653 2.5
About once/year 70.41832 2.7< once/year 78.42287 3.0
Never used 2330.074 89.3
Frequency Missing = 382.40798665
HOW OFTEN NORMALLY USE DOWNERS
Q23N Frequency Percent
──────────────────────────────────────
Every day 5.028187 0.2
Several times/wk 12.24368 0.5
Several times/mo 26.84877 1.0
About once/month 58.80571 2.3
About once/year 53.03713 2.1
< once/year 60.12654 2.3
Never used 2343.873 91.6
Frequency Missing = 432.03671402
HOW OFTEN NORMALLY USE ROHYPNOL
Q23O Frequency Percent
──────────────────────────────────────
Every day 0.947638 0.0
Several times/wk 10.08414 0.4
Several times/mo 15.97128 0.6
About once/month 35.20913 1.4
About once/year 45.42744 1.7
< once/year 61.05318 2.3
Never used 2436.919 93.5
Frequency Missing = 386.38853889

8/14/2019 WILLIAMSON COUNTY - Round Rock ISD - 1998 Texas School Survey of Drug and Alcohol Use
http://slidepdf.com/reader/full/williamson-county-round-rock-isd-1998-texas-school-survey-of-drug-and-alcohol 179/213
HOW OFTEN NORMALLY USE STEROIDS
Q23P Frequency Percent──────────────────────────────────────
Every day 3.712131 0.1
Several times/wk 7.058701 0.3
Several times/mo 4.372309 0.2
About once/month 7.157163 0.3
About once/year 8.42381 0.3
< once/year 20.63941 0.8
Never used 2476.301 98.0
Frequency Missing = 464.33592828
The frequencies have been weighted so that the
analysis reflects the distribution of students by grade
level in the district
Round Rock
Spring 1998
HOW OFTEN NORMALLY USE ECSTASY
Q23Q Frequency Percent
──────────────────────────────────────
Every day 1.0461 0.0
Several times/wk 5 975824 0 2

8/14/2019 WILLIAMSON COUNTY - Round Rock ISD - 1998 Texas School Survey of Drug and Alcohol Use
http://slidepdf.com/reader/full/williamson-county-round-rock-isd-1998-texas-school-survey-of-drug-and-alcohol 180/213
Several times/wk 5.975824 0.2
Several times/mo 15.64311 0.6
About once/month 33.35857 1.3
About once/year 48.73689 1.9< once/year 47.29508 1.9
Never used 2396.021 94.0
Frequency Missing = 443.92378866
HOW OFTEN NORMALLY USE HEROIN
Q23R Frequency Percent
──────────────────────────────────────
Every day 1.817015 0.1
Several times/wk 4.836651 0.2
Several times/mo 7.288095 0.3
About once/month 5.872315 0.2
About once/year 5.314559 0.2
< once/year 21.3218 0.9
Never used 2446.29 98.1
Frequency Missing = 499.25979631
HOW MANY CIGARETTES IN PAST 30 DAYS
Q24 Frequency Percent
──────────────────────────────────────
None 2116.321 72.0
Less than 1 399.554 13.6
> 1 and < 10 284.5469 9.7
> 10 and < 1pk 82.26992 2.8
> 1pk and < 2pks 49.62223 1.7
More than 2pks 5.289311 0.2
Frequency Missing = 54.39618204
AMOUNT OF BEER AT ONE TIME

8/14/2019 WILLIAMSON COUNTY - Round Rock ISD - 1998 Texas School Survey of Drug and Alcohol Use
http://slidepdf.com/reader/full/williamson-county-round-rock-isd-1998-texas-school-survey-of-drug-and-alcohol 181/213
AMOUNT OF BEER AT ONE TIME
Q25A Frequency Percent
──────────────────────────────────────Never drink this 1295.136 44.5
12+ drinks 86.73747 3.0
9-11 drinks 92.535 3.2
5-8 drinks 231.088 7.9
3-4 drinks 286.3066 9.8
2 drinks 229.9237 7.9
1 drink 316.287 10.9
< 1 drink 373.4422 12.8
Frequency Missing = 80.54360885
The frequencies have been weighted so that the
analysis reflects the distribution of students by grade
level in the district
Round Rock
Spring 1998
AMOUNT OF WINE COOLERS AT ONE TIME
Q25B Frequency Percent
──────────────────────────────────────
Never drink this 1253.226 44.1
12+ drinks 85 04353 3 0

8/14/2019 WILLIAMSON COUNTY - Round Rock ISD - 1998 Texas School Survey of Drug and Alcohol Use
http://slidepdf.com/reader/full/williamson-county-round-rock-isd-1998-texas-school-survey-of-drug-and-alcohol 182/213
12+ drinks 85.04353 3.0
9-11 drinks 65.6478 2.3
5-8 drinks 172.5523 6.1
3-4 drinks 357.6673 12.62 drinks 292.1848 10.3
1 drink 353.8147 12.4
< 1 drink 264.0351 9.3
Frequency Missing = 147.82824598
AMOUNT OF WINE AT ONE TIME
Q25C Frequency Percent
──────────────────────────────────────
Never drink this 1286.904 45.0
12+ drinks 35.07614 1.2
9-11 drinks 27.96553 1.0
5-8 drinks 96.42828 3.4
3-4 drinks 193.9209 6.8
2 drinks 285.4949 10.0
1 drink 467.5779 16.4
< 1 drink 465.1175 16.3
Frequency Missing = 133.51518852
AMOUNT OF LIQUOR AT ONE TIME
Q25D Frequency Percent
──────────────────────────────────────
Never drink this 1371.373 48.2
12+ drinks 69.40865 2.4
9-11 drinks 71.67756 2.5
5-8 drinks 211.2451 7.4
3-4 drinks 343.0782 12.1
2 drinks 255.6497 9.0
1 drink 238.6412 8.4
< 1 drink 283.3313 10.0
Frequency Missing = 147.5949788

8/14/2019 WILLIAMSON COUNTY - Round Rock ISD - 1998 Texas School Survey of Drug and Alcohol Use
http://slidepdf.com/reader/full/williamson-county-round-rock-isd-1998-texas-school-survey-of-drug-and-alcohol 183/213
BEERS, FIVE OR MORE AT ONE TIME
Q26A Frequency Percent
──────────────────────────────────────
Never drink this 1396.525 48.5
Never 5+ at time 517.3129 18.0
Every day 2.863115 0.1
Several times/wk 70.17262 2.4
Several times/mo 239.965 8.3
About once/month 229.6415 8.0
< once/month 241.0946 8.4
< once/year 183.2884 6.4
Frequency Missing = 111.13644356
The frequencies have been weighted so that the
analysis reflects the distribution of students by grade
level in the district
Round Rock
Spring 1998
WINE COOLERS, FIVE OR MORE AT ONE TIME
Q26B Frequency Percent
──────────────────────────────────────
Never drink this 1354.539 47.9
Never 5+ at time 520.5885 18.4

8/14/2019 WILLIAMSON COUNTY - Round Rock ISD - 1998 Texas School Survey of Drug and Alcohol Use
http://slidepdf.com/reader/full/williamson-county-round-rock-isd-1998-texas-school-survey-of-drug-and-alcohol 184/213
Every day 3.847189 0.1
Several times/wk 40.59344 1.4
Several times/mo 160.5234 5.7About once/month 228.4984 8.1
< once/month 310.7553 11.0
< once/year 205.6529 7.3
Frequency Missing = 167.00173623
WINE, FIVE OR MORE AT ONE TIME
Q26C Frequency Percent
──────────────────────────────────────
Never drink this 1374.089 49.3
Never 5+ at time 560.8685 20.1
Every day 2.764653 0.1
Several times/wk 31.26019 1.1
Several times/mo 91.52487 3.3
About once/month 172.5067 6.2
< once/month 291.5759 10.5
< once/year 265.3794 9.5
Frequency Missing = 202.03099822
LIQUOR, FIVE OR MORE AT ONE TIME
Q26D Frequency Percent
──────────────────────────────────────
Never drink this 1377.999 50.0
Never 5+ at time 429.4418 15.6
Every day 5.950417 0.2
Several times/wk 55.20577 2.0
Several times/mo 198.4328 7.2
About once/month 231.3259 8.4
< once/month 277.7156 10.1
< once/year 179.9284 6.5
Frequency Missing = 236.00073434

8/14/2019 WILLIAMSON COUNTY - Round Rock ISD - 1998 Texas School Survey of Drug and Alcohol Use
http://slidepdf.com/reader/full/williamson-county-round-rock-isd-1998-texas-school-survey-of-drug-and-alcohol 185/213
GET ALCOHOLIC BEVERAGES FROM HOME
Q27A Frequency Percent
──────────────────────────────────────
Do not Drink 1131.006 39.5
Never 612.3069 21.4
Seldom 753.4449 26.3
Most of the Time 271.2305 9.5
Always 92.75982 3.2
Frequency Missing = 131.25172796
The frequencies have been weighted so that the
analysis reflects the distribution of students by grade
level in the district
Round Rock
Spring 1998
GET ALCOHOLIC BEVERAGES FROM FRIENDS
Q27B Frequency Percent
──────────────────────────────────────
Do not Drink 1021.204 36.5
Never 329.0793 11.8

8/14/2019 WILLIAMSON COUNTY - Round Rock ISD - 1998 Texas School Survey of Drug and Alcohol Use
http://slidepdf.com/reader/full/williamson-county-round-rock-isd-1998-texas-school-survey-of-drug-and-alcohol 186/213
Seldom 431.2786 15.4
Most of the Time 693.151 24.8
Always 321.0295 11.5
Frequency Missing = 196.25712946
GET ALCOHOLIC BEVERAGES FROM A STORE
Q27C Frequency Percent
──────────────────────────────────────
Do not Drink 1064.317 38.3
Never 1118.404 40.2
Seldom 313.4484 11.3
Most of the Time 204.5325 7.4
Always 79.97608 2.9
Frequency Missing = 211.32230075
GET ALCOHOLIC BEVERAGES AT PARTIES
Q27D Frequency Percent
──────────────────────────────────────
Do not Drink 969.2871 35.4
Never 363.1377 13.3
Seldom 358.5384 13.1
Most of the Time 557.7108 20.4
Always 490.4089 17.9
Frequency Missing = 252.91701353
GET ALCOHOLIC BEVERAGES FROM OTHER
Q27E Frequency Percent
──────────────────────────────────────
Do not Drink 1043.983 38.5
Never 693.5254 25.6

8/14/2019 WILLIAMSON COUNTY - Round Rock ISD - 1998 Texas School Survey of Drug and Alcohol Use
http://slidepdf.com/reader/full/williamson-county-round-rock-isd-1998-texas-school-survey-of-drug-and-alcohol 187/213
Seldom 486.4583 17.9
Most of the Time 265.3032 9.8
Always 222.3358 8.2
Frequency Missing = 280.39410579
DANGEROUS FOR KIDS
TO USE TOBACCO
Q28A Frequency Percent
────────────────────────────────
Very 1081.615 37.2
Somewhat 1051.876 36.2
Not very 530.2762 18.2
Not at all 121.6584 4.2
Don't know 122.5701 4.2
The frequencies have been weighted so that the
analysis reflects the distribution of students by grade
level in the district
Round Rock
Spring 1998
Frequency Missing = 84.00438191
DANGEROUS FOR KIDS

8/14/2019 WILLIAMSON COUNTY - Round Rock ISD - 1998 Texas School Survey of Drug and Alcohol Use
http://slidepdf.com/reader/full/williamson-county-round-rock-isd-1998-texas-school-survey-of-drug-and-alcohol 188/213
TO USE ALCOHOL
Q28B Frequency Percent────────────────────────────────
Very 1180.313 41.3
Somewhat 1104.561 38.6
Not very 416.532 14.6
Not at all 78.3006 2.7
Don't know 78.91499 2.8
Frequency Missing = 133.37775901
DANGEROUS FOR KIDS
TO USE INHALANTS
Q28C Frequency Percent
────────────────────────────────
Very 2099.251 73.4
Somewhat 531.7513 18.6
Not very 92.7051 3.2
Not at all 25.14365 0.9
Don't know 110.9859 3.9
Frequency Missing = 132.16327446
DANGEROUS FOR KIDS
TO USE MARIJUANA
Q28D Frequency Percent
────────────────────────────────
Very 1578.954 56.3
Somewhat 573.7737 20.4
Not very 356.8862 12.7
Not at all 212.1379 7.6
Don't know 84.30562 3.0
Frequency Missing = 185.94307657

8/14/2019 WILLIAMSON COUNTY - Round Rock ISD - 1998 Texas School Survey of Drug and Alcohol Use
http://slidepdf.com/reader/full/williamson-county-round-rock-isd-1998-texas-school-survey-of-drug-and-alcohol 189/213
DANGEROUS FOR KIDSTO USE COCAINE
Q28E Frequency Percent
────────────────────────────────
Very 2449.347 86.9
Somewhat 227.1755 8.1
Not very 26.08135 0.9
Not at all 14.4929 0.5
Don't know 101.737 3.6
Frequency Missing = 173.16668056
The frequencies have been weighted so that the
analysis reflects the distribution of students by grade
level in the district
Round Rock
Spring 1998
DANGEROUS FOR KIDS TO USE CRACK
Q28F Frequency Percent
────────────────────────────────
Very 2462.778 89.0
Somewhat 168.1444 6.1
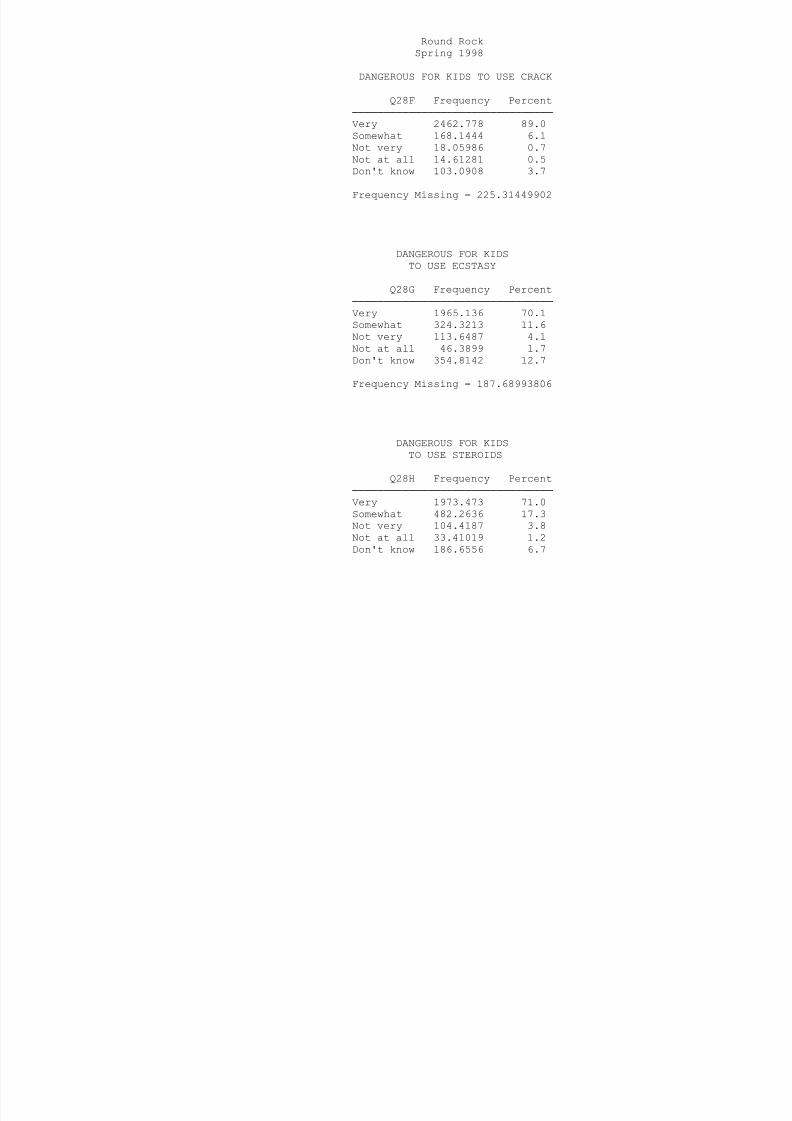
8/14/2019 WILLIAMSON COUNTY - Round Rock ISD - 1998 Texas School Survey of Drug and Alcohol Use
http://slidepdf.com/reader/full/williamson-county-round-rock-isd-1998-texas-school-survey-of-drug-and-alcohol 190/213
Not very 18.05986 0.7
Not at all 14.61281 0.5
Don't know 103.0908 3.7
Frequency Missing = 225.31449902
DANGEROUS FOR KIDS
TO USE ECSTASY
Q28G Frequency Percent
────────────────────────────────
Very 1965.136 70.1
Somewhat 324.3213 11.6
Not very 113.6487 4.1
Not at all 46.3899 1.7
Don't know 354.8142 12.7
Frequency Missing = 187.68993806
DANGEROUS FOR KIDSTO USE STEROIDS
Q28H Frequency Percent
────────────────────────────────
Very 1973.473 71.0
Somewhat 482.2636 17.3
Not very 104.4187 3.8
Not at all 33.41019 1.2
Don't know 186.6556 6.7
Frequency Missing = 211.7793831
DANGEROUS FOR KIDS TO USE HEROIN
Q28I Frequency Percent
────────────────────────────────
2559 662 90 1

8/14/2019 WILLIAMSON COUNTY - Round Rock ISD - 1998 Texas School Survey of Drug and Alcohol Use
http://slidepdf.com/reader/full/williamson-county-round-rock-isd-1998-texas-school-survey-of-drug-and-alcohol 191/213
Very 2559.662 90.1
Somewhat 119.519 4.2
Not very 12.2243 0.4Not at all 17.1591 0.6
Don't know 131.7712 4.6
Frequency Missing = 151.66423784
The frequencies have been weighted so that the
analysis reflects the distribution of students by grade
level in the district
Round Rock
Spring 1998
USE MARIJUANA AS JOINTS
Q29A Frequency Percent
──────────────────────────────────────
Never 1594.457 69.0
Seldom 233.0716 10.1
H lf th ti 196 1235 8 5

8/14/2019 WILLIAMSON COUNTY - Round Rock ISD - 1998 Texas School Survey of Drug and Alcohol Use
http://slidepdf.com/reader/full/williamson-county-round-rock-isd-1998-texas-school-survey-of-drug-and-alcohol 192/213
Half the time 196.1235 8.5
Most of the time 196.1362 8.5
Always 70.47829 3.0Don't know 21.21215 0.9
Frequency Missing = 680.52066714
USE MARIJUANA AS BLUNTS
Q29B Frequency Percent
──────────────────────────────────────
Never 1621.532 73.0
Seldom 251.0663 11.3
Half the time 156.0668 7.0
Most of the time 117.6172 5.3
Always 59.04463 2.7
Don't know 17.02227 0.8
Frequency Missing = 769.65060346
USE MARIJUANA IN BONGS OR WATER PIPES
Q29C Frequency Percent
──────────────────────────────────────
Never 1692.921 75.2
Seldom 234.9045 10.4
Half the time 137.6765 6.1
Most of the time 108.401 4.8
Always 57.7749 2.6
Don't know 18.10481 0.8
Frequency Missing = 742.21680094
USE MARIJUANA IN PIPES
Q29D Frequency Percent

8/14/2019 WILLIAMSON COUNTY - Round Rock ISD - 1998 Texas School Survey of Drug and Alcohol Use
http://slidepdf.com/reader/full/williamson-county-round-rock-isd-1998-texas-school-survey-of-drug-and-alcohol 193/213
──────────────────────────────────────
Never 1621.478 73.7
Seldom 202.7937 9.2Half the time 162.3483 7.4
Most of the time 147.8281 6.7
Always 52.50027 2.4
Don't know 12.88887 0.6
Frequency Missing = 792.16307591
The frequencies have been weighted so that the
analysis reflects the distribution of students by grade
level in the district
Round Rock
Spring 1998
USE MARIJUANA OTHER WAYS
Q29E Frequency Percent
──────────────────────────────────────
Never 1859.677 83.6
Seldom 218.1161 9.8
Half the time 39 10446 1 8

8/14/2019 WILLIAMSON COUNTY - Round Rock ISD - 1998 Texas School Survey of Drug and Alcohol Use
http://slidepdf.com/reader/full/williamson-county-round-rock-isd-1998-texas-school-survey-of-drug-and-alcohol 194/213
Half the time 39.10446 1.8
Most of the time 33.32445 1.5
Always 22.34696 1.0Don't know 53.17925 2.4
Frequency Missing = 766.2516515
DAYS SKIPPED SINCE SEPTEMBER
Q30A Frequency Percent
──────────────────────────────
None 2055.864 70.5
1-3 days 594.3802 20.4
4-9 days 165.9261 5.7
10+ days 101.8952 3.5
Frequency Missing = 73.93444265
DAYS ILL SINCE SEPTEMBER
Q30B Frequency Percent
──────────────────────────────
None 664.0938 22.9
1-3 days 1543.451 53.1
4-9 days 576.435 19.8
10+ days 121.917 4.2
Frequency Missing = 86.10305664
OTHER DAYS MISSED
SINCE SEPTEMBER
Q30C Frequency Percent
──────────────────────────────
None 1028.018 35.5
1-3 days 1564.1 54.1
4-9 days 240 6574 8 3

8/14/2019 WILLIAMSON COUNTY - Round Rock ISD - 1998 Texas School Survey of Drug and Alcohol Use
http://slidepdf.com/reader/full/williamson-county-round-rock-isd-1998-texas-school-survey-of-drug-and-alcohol 195/213
4-9 days 240.6574 8.3
10+ days 60.67132 2.1
Frequency Missing = 98.55342341
SENT TO PRINCIPAL/DEAN
SINCE SEPTEMBER
Q30D Frequency Percent
──────────────────────────────
None 2381.798 82.1
1-3 days 369.4301 12.74-9 days 82.19292 2.8
10+ days 69.40833 2.4
Frequency Missing = 89.17015741
The frequencies have been weighted so that the
analysis reflects the distribution of students by grade
level in the district
Round Rock
Spring 1998
SOMEONE CALLED HOME
SINCE SEPTEMBER
Q30E Frequency Percent
──────────────────────────────
None 2525.774 86.9
1-3 days 285 92 9 8
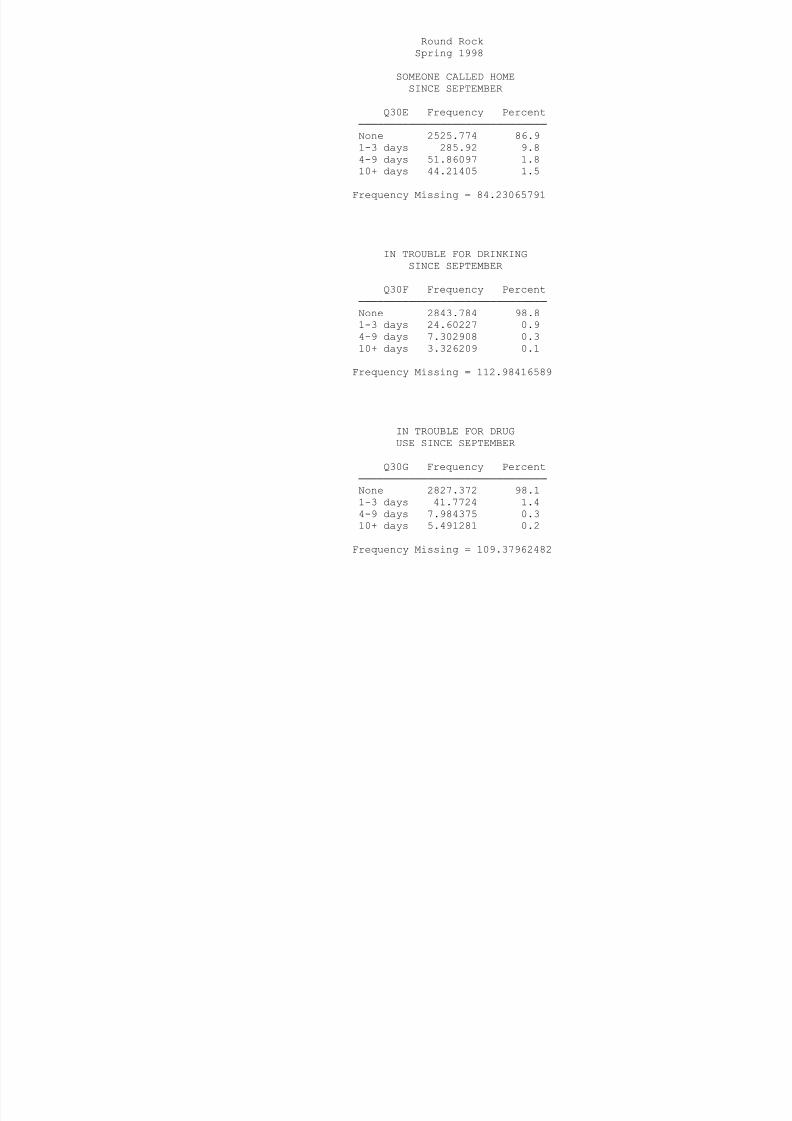
8/14/2019 WILLIAMSON COUNTY - Round Rock ISD - 1998 Texas School Survey of Drug and Alcohol Use
http://slidepdf.com/reader/full/williamson-county-round-rock-isd-1998-texas-school-survey-of-drug-and-alcohol 196/213
1 3 days 285.92 9.8
4-9 days 51.86097 1.8
10+ days 44.21405 1.5
Frequency Missing = 84.23065791
IN TROUBLE FOR DRINKING
SINCE SEPTEMBER
Q30F Frequency Percent
──────────────────────────────
None 2843.784 98.81-3 days 24.60227 0.9
4-9 days 7.302908 0.3
10+ days 3.326209 0.1
Frequency Missing = 112.98416589
IN TROUBLE FOR DRUG
USE SINCE SEPTEMBER
Q30G Frequency Percent
──────────────────────────────
None 2827.372 98.1
1-3 days 41.7724 1.4
4-9 days 7.984375 0.3
10+ days 5.491281 0.2
Frequency Missing = 109.37962482
DAYS SKIPPED IN PAST MONTH
Q31A Frequency Percent
──────────────────────────────
None 2385.532 81.9
1-3 days 466.0549 16.0
4-9 days 48 73279 1 7

8/14/2019 WILLIAMSON COUNTY - Round Rock ISD - 1998 Texas School Survey of Drug and Alcohol Use
http://slidepdf.com/reader/full/williamson-county-round-rock-isd-1998-texas-school-survey-of-drug-and-alcohol 197/213
4 9 days 48.73279 1.7
10+ days 10.78549 0.4
Frequency Missing = 80.89434108
DAYS ILL IN PAST MONTH
Q31B Frequency Percent
──────────────────────────────
None 1929.714 67.4
1-3 days 844.8225 29.5
4-9 days 75.68777 2.610+ days 13.03056 0.5
Frequency Missing = 128.74541966
The frequencies have been weighted so that the
analysis reflects the distribution of students by grade
level in the district
Round Rock
Spring 1998
OTHER DAYS MISSED
IN PAST MONTH
Q31C Frequency Percent
──────────────────────────────
None 1948.307 68.0
1-3 days 852.1299 29.7

8/14/2019 WILLIAMSON COUNTY - Round Rock ISD - 1998 Texas School Survey of Drug and Alcohol Use
http://slidepdf.com/reader/full/williamson-county-round-rock-isd-1998-texas-school-survey-of-drug-and-alcohol 198/213
1 3 days 852.1299 29.7
4-9 days 51.25239 1.8
10+ days 14.09149 0.5
Frequency Missing = 126.21949275
SENT TO PRINCIPAL/DEAN
IN PAST MONTH
Q31D Frequency Percent
──────────────────────────────
None 2609.588 91.41-3 days 197.5189 6.9
4-9 days 31.71381 1.1
10+ days 16.67974 0.6
Frequency Missing = 136.49928503
SOMEONE CALLED HOME
IN PAST MONTH
Q31E Frequency Percent
──────────────────────────────
None 2714.05 94.4
1-3 days 130.4169 4.5
4-9 days 16.07999 0.6
10+ days 15.92002 0.6
Frequency Missing = 115.5328096
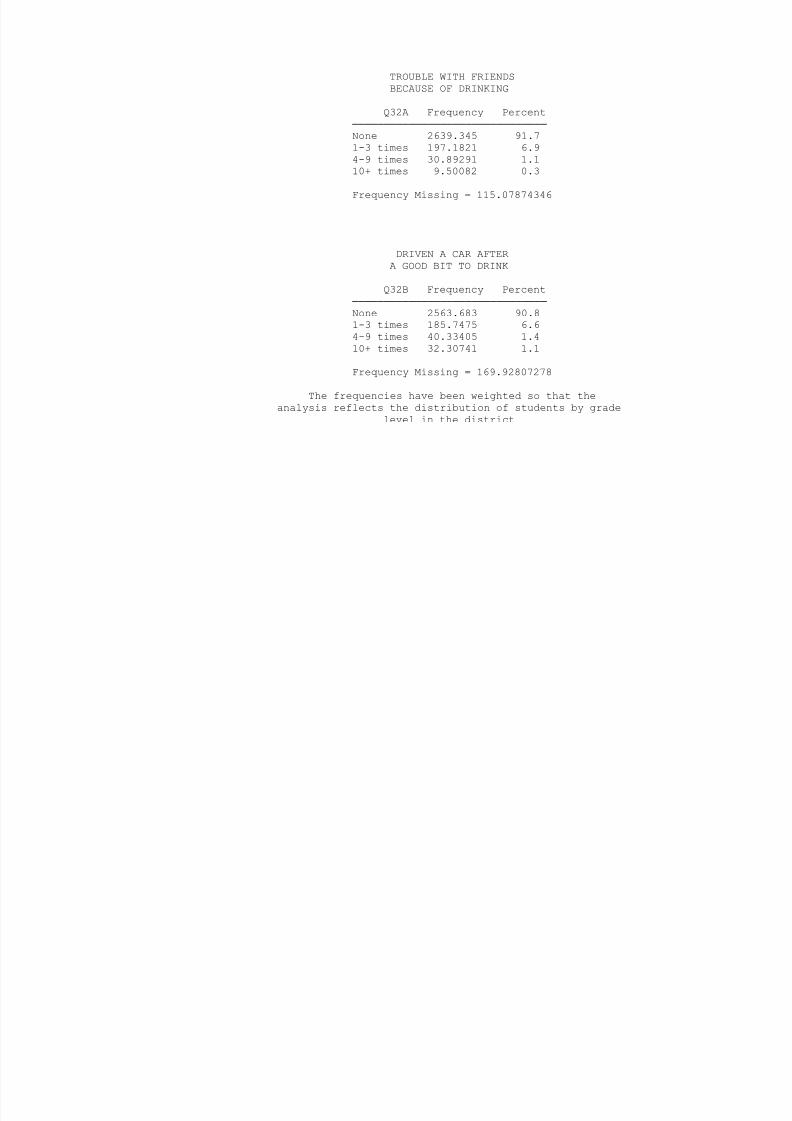
8/14/2019 WILLIAMSON COUNTY - Round Rock ISD - 1998 Texas School Survey of Drug and Alcohol Use
http://slidepdf.com/reader/full/williamson-county-round-rock-isd-1998-texas-school-survey-of-drug-and-alcohol 199/213
Round Rock
Spring 1998
CRITICIZED BY DATE
BECAUSE OF DRINKING
Q32C Frequency Percent
───────────────────────────────
None 2650.232 93.4
1-3 times 152.1237 5.4

8/14/2019 WILLIAMSON COUNTY - Round Rock ISD - 1998 Texas School Survey of Drug and Alcohol Use
http://slidepdf.com/reader/full/williamson-county-round-rock-isd-1998-texas-school-survey-of-drug-and-alcohol 200/213
4-9 times 22.9233 0.8
10+ times 12.12316 0.4
Frequency Missing = 154.5973838
TROUBLE WITH POLICE
BECAUSE OF DRINKING
Q32D Frequency Percent
───────────────────────────────
None 2671.16 95.11-3 times 116.7739 4.2
4-9 times 12.31108 0.4
10+ times 7.131574 0.3
Frequency Missing = 184.62342433
TROUBLE WITH FRIENDS
BECAUSE OF DRUG USE
Q32E Frequency Percent
───────────────────────────────
None 2638.52 93.4
1-3 times 146.0162 5.2
4-9 times 25.91314 0.9
10+ times 14.50376 0.5
Frequency Missing = 167.04685115
DRIVEN A CAR WHILE
HIGH FROM DRUGS
Q32F Frequency Percent
───────────────────────────────
None 2478.017 90.5
1-3 times 153.1932 5.6

8/14/2019 WILLIAMSON COUNTY - Round Rock ISD - 1998 Texas School Survey of Drug and Alcohol Use
http://slidepdf.com/reader/full/williamson-county-round-rock-isd-1998-texas-school-survey-of-drug-and-alcohol 201/213
4-9 times 43.36366 1.6
10+ times 63.49517 2.3
Frequency Missing = 253.93074892
CRITICIZED BY DATE
BECAUSE OF DRUG USE
Q32G Frequency Percent
───────────────────────────────
None 2602.607 93.41-3 times 147.9945 5.3
4-9 times 18.36929 0.7
10+ times 17.5575 0.6
Frequency Missing = 205.47142649
The frequencies have been weighted so that the
analysis reflects the distribution of students by grade
level in the district
Round Rock
Spring 1998
TROUBLE WITH POLICE
BECAUSE OF DRUG USE
Q32H Frequency Percent
───────────────────────────────
None 2675.339 96.7
1-3 times 67.05785 2.4

8/14/2019 WILLIAMSON COUNTY - Round Rock ISD - 1998 Texas School Survey of Drug and Alcohol Use
http://slidepdf.com/reader/full/williamson-county-round-rock-isd-1998-texas-school-survey-of-drug-and-alcohol 202/213
4-9 times 15.35671 0.6
10+ times 9.287655 0.3
Frequency Missing = 224.95902235
CLASS DAYS DRUNK ON
ALCOHOL SINCE SEPT
Q33A Frequency Percent
──────────────────────────────
None 2620.631 90.81-3 days 201.2812 7.0
4-9 days 35.44094 1.2
10+ days 29.01054 1.0
Frequency Missing = 105.63658291
CLASS DAYS HIGH ON MARIJUANA
SINCE SEPT
Q33B Frequency Percent
──────────────────────────────
None 2453.902 86.9
1-3 days 181.3202 6.4
4-9 days 69.4588 2.5
10+ days 119.2062 4.2
Frequency Missing = 168.11294198
CLASS DAYS HIGH ON INHALANTS
SINCE SEPT
Q33C Frequency Percent
──────────────────────────────
None 2758.291 96.8
1-3 days 72.07214 2.5

8/14/2019 WILLIAMSON COUNTY - Round Rock ISD - 1998 Texas School Survey of Drug and Alcohol Use
http://slidepdf.com/reader/full/williamson-county-round-rock-isd-1998-texas-school-survey-of-drug-and-alcohol 203/213
4-9 days 6.819953 0.2
10+ days 11.02059 0.4
Frequency Missing = 143.79657492
CLASS DAYS HIGH
ON OTHER DRUG(S)
Q33D Frequency Percent
──────────────────────────────
None 2626.262 92.81-3 days 133.5205 4.7
4-9 days 37.40197 1.3
10+ days 32.55007 1.2
Frequency Missing = 162.2652439
The frequencies have been weighted so that the
analysis reflects the distribution of students by grade
level in the district

8/14/2019 WILLIAMSON COUNTY - Round Rock ISD - 1998 Texas School Survey of Drug and Alcohol Use
http://slidepdf.com/reader/full/williamson-county-round-rock-isd-1998-texas-school-survey-of-drug-and-alcohol 204/213
Frequency Missing = 232.41453999
WOULD SEEK HELP FROM
SCHOOL COUNSELOR
Q36A Frequency Percent

8/14/2019 WILLIAMSON COUNTY - Round Rock ISD - 1998 Texas School Survey of Drug and Alcohol Use
http://slidepdf.com/reader/full/williamson-county-round-rock-isd-1998-texas-school-survey-of-drug-and-alcohol 205/213
────────────────────────────────
No 1894.21 66.6Yes 949.0028 33.4
Frequency Missing = 148.78754982
WOULD SEEK HELP OUTSIDE
OF SCHOOL
Q36B Frequency Percent
────────────────────────────────No 2031.218 72.5
Yes 769.6573 27.5
Frequency Missing = 191.12449274
The frequencies have been weighted so that the
analysis reflects the distribution of students by grade
level in the district

8/14/2019 WILLIAMSON COUNTY - Round Rock ISD - 1998 Texas School Survey of Drug and Alcohol Use
http://slidepdf.com/reader/full/williamson-county-round-rock-isd-1998-texas-school-survey-of-drug-and-alcohol 206/213
No 518.3902 18.5
Yes 2287.44 81.5
Frequency Missing = 186.16933163
WOULD SEEK HELP FROM
ANOTHER ADULT

8/14/2019 WILLIAMSON COUNTY - Round Rock ISD - 1998 Texas School Survey of Drug and Alcohol Use
http://slidepdf.com/reader/full/williamson-county-round-rock-isd-1998-texas-school-survey-of-drug-and-alcohol 207/213
Q36G Frequency Percent────────────────────────────────
No 1137.295 40.3
Yes 1684.989 59.7
Frequency Missing = 169.71616739
WOULD NOT SEEK HELP
Q36H Frequency Percent────────────────────────────────
No 2391.957 88.3
Yes 318.4175 11.7
Frequency Missing = 281.62516834
The frequencies have been weighted so that the
analysis reflects the distribution of students by grade
level in the district
Round Rock
Spring 1998
DRUG/ALCOHOL INFO--HEALTH CLASS
Q37A Frequency Percent
────────────────────────────────
No 1365.52 53.1
Yes 1207.823 46.9
F Mi i 418 65712692

8/14/2019 WILLIAMSON COUNTY - Round Rock ISD - 1998 Texas School Survey of Drug and Alcohol Use
http://slidepdf.com/reader/full/williamson-county-round-rock-isd-1998-texas-school-survey-of-drug-and-alcohol 208/213
Frequency Missing = 418.65712692
DRUG/ALCOHOL INFO--ASSEMBLY
PROGRAM
Q37B Frequency Percent
────────────────────────────────
No 1421.733 56.1
Yes 1111.729 43.9
Frequency Missing = 458.53854435
DRUG/ALCOHOL INFO--GUIDANCE
COUNSELOR
Q37C Frequency Percent
────────────────────────────────
No 1962.623 77.5
Yes 569.4706 22.5
Frequency Missing = 459.90650301
DRUG/ALCOHOL INFO--SCIENCE CLASS
Q37D Frequency Percent
────────────────────────────────
No 1742.434 69.6
Yes 759.6475 30.4
Frequency Missing = 489.91873437
DRUG/ALCOHOL INFO--SOCIAL
STUDIES CLASS

8/14/2019 WILLIAMSON COUNTY - Round Rock ISD - 1998 Texas School Survey of Drug and Alcohol Use
http://slidepdf.com/reader/full/williamson-county-round-rock-isd-1998-texas-school-survey-of-drug-and-alcohol 209/213
Q37E Frequency Percent────────────────────────────────
No 2198.062 87.8
Yes 305.9931 12.2
Frequency Missing = 487.94492373
DRUG/ALCOHOL INFO--DRUG
RAP SESSION
Q37F Frequency Percent
────────────────────────────────
No 2183.766 88.4
Yes 285.2416 11.6
The frequencies have been weighted so that the
analysis reflects the distribution of students by grade
level in the district
Round Rock
Spring 1998
Frequency Missing = 522.99217114
DRUG/ALCOHOL INFO--INVITED
SCHOOL GUEST

8/14/2019 WILLIAMSON COUNTY - Round Rock ISD - 1998 Texas School Survey of Drug and Alcohol Use
http://slidepdf.com/reader/full/williamson-county-round-rock-isd-1998-texas-school-survey-of-drug-and-alcohol 210/213
Q37G Frequency Percent────────────────────────────────
No 1667.956 66.4
Yes 844.2912 33.6
Frequency Missing = 479.75259049
DRUG/ALCOHOL INFO--OTHER
SCHOOL SOURCE
Q37H Frequency Percent
────────────────────────────────
No 1645.702 66.3
Yes 835.8819 33.7
Frequency Missing = 510.41596748
PARENTS FEEL ABOUT KIDS SMOKING CIGARET
Q38A Frequency Percent
───────────────────────────────────────
Strong disapprove 2011.909 69.6
Mild disapprove 454.463 15.7
Neither 260.9908 9.0
Mildly approve 39.06232 1.4
Strongly approve 22.43088 0.8
Don't know 101.0768 3.5
Frequency Missing = 102.06722553
PARENTS FEEL ABOUT KIDS DRINKING BEER
Q38B Frequency Percent
───────────────────────────────────────
Strong disapprove 1906.009 66.8
Mild disapprove 513 2973 18 0

8/14/2019 WILLIAMSON COUNTY - Round Rock ISD - 1998 Texas School Survey of Drug and Alcohol Use
http://slidepdf.com/reader/full/williamson-county-round-rock-isd-1998-texas-school-survey-of-drug-and-alcohol 211/213
Mild disapprove 513.2973 18.0
Neither 238.6886 8.4Mildly approve 64.37096 2.3
Strongly approve 30.69736 1.1
Don't know 99.72929 3.5
Frequency Missing = 139.20745997
The frequencies have been weighted so that the
analysis reflects the distribution of students by grade
level in the district
Round Rock
Spring 1998
PARENTS FEEL ABOUT KIDS USING MARIJUANA
Q38C Frequency Percent
───────────────────────────────────────
Strong disapprove 2414.938 84.6
Mild disapprove 178.2625 6.2
Neither 98.97508 3.5
Mildly approve 35 32903 1 2

8/14/2019 WILLIAMSON COUNTY - Round Rock ISD - 1998 Texas School Survey of Drug and Alcohol Use
http://slidepdf.com/reader/full/williamson-county-round-rock-isd-1998-texas-school-survey-of-drug-and-alcohol 212/213
Mildly approve 35.32903 1.2
Strongly approve 29.06908 1.0Don't know 96.79233 3.4
Frequency Missing = 138.63422992
PURCHASED LOTTERY TICKET
IN PAST YEAR
Q39 Frequency Percent
────────────────────────────────No 2090.125 72.5
Yes 792.7021 27.5
Frequency Missing = 109.17307925
NON-LOTTERY GAMBLING
IN PAST YEAR
Q40 Frequency Percent
────────────────────────────────
No 1807.712 62.7
Yes 1073.179 37.3
Frequency Missing = 111.10968501
MONEY SPENT ON GAMBLING
IN PAST YEAR
Q41 Frequency Percent
────────────────────────────────
$0 1615.15 56.3
$1 - $10 776.0151 27.0
$11 - $50 342.683 11.9
$51 - $100 72.62959 2.5
$100+ 62.64788 2.2

8/14/2019 WILLIAMSON COUNTY - Round Rock ISD - 1998 Texas School Survey of Drug and Alcohol Use
http://slidepdf.com/reader/full/williamson-county-round-rock-isd-1998-texas-school-survey-of-drug-and-alcohol 213/213
Frequency Missing = 122.8746637
The frequencies have been weighted so that the
analysis reflects the distribution of students by grade
level in the district