Dr. Nasrin Nazemzadeh, PhD Dissertation Defense, Dissertation Chair, Dr. William Allan Kritsonis
Upload
anonymous-sewu7e6Category
view
27download
3description

CHAPTER I
INTRODUCTION
“…the ‘leadership ability’ and ‘leadership values’ of the principal determine in large measure
what transpires in a school; what transpires in a school either promotes, nourishes, or impedes
and diminishes student academic success.”
-Reyes and Wagstaff (2003)
Introduction or Background to the Problem
Fifty-seven (57) years since Brown vs. the Board of Education (1954) outlawed
intentional segregation, many people and organizations, including policy makers, courts, and
opinion makers seem to assume that desegregation is no longer necessary, or that schools will
somehow be accomplished without the need for any deliberate plan (Haberman, 2003). The
Supreme Court ruling that racial segregation was unconstitutional, and the declaration that their
decision should be implemented "with all deliberate speed," offered the impression that school
desegregation would be swift and certain. The reality over the last fifty-seven years has been
quite the opposite as the K-12 educational systems have continued to be significantly segregated
by race. According to a report from the Civil Rights Project at UCLA, recent trends in the
education system revealed profound isolation and a national education system of inequality
(Orfield & Lee, 2007). The report goes on to assert that:
The consequences become larger each year because of the growing number and
percentage of non-white and impoverished students and the dramatic relationships
between educational attainment and economic success in a globalized economy.
(pp. 2-3)
1

Orfield and Lee (2007) revealed that reports on school statistics show that the Brown decision
did very little in its first decade, leaving 98% of black southerners in totally segregated schools;
that executive branch enforcement under President Johnson made the South the nation’s most
integrated region with just a few years of serious enforcement; that segregation was most intense
in the schools of the Northeast and Midwest; that as the Reagan Administration attacked court
orders, black-white desegregation continued to rise though the l980s, but Latino segregation
grew without interruption since data was first collected, surpassing black isolation a generation
ago (Orfield & Lee, 2007). They go on to assert that the basic educational policy model in the
post-civil rights generation assumed that schools could be equalized without dealing with
segregation through testing and accountability. Nearly a quarter century since the country
responded to the Reagan Administration’s 1983 report, “A Nation at Risk,” warning of
dangerous shortcomings in American schools and demanding that “excellence” policies replace
the “equity” policies of the l960s; students in our nation’s schools have continued to receive an
inequitable education.
Compared to the civil rights era, our country has a far larger population of “minority”
children and a major decline in the number of white students (U.S. Bureau of the Census, 2004).
Recent census reports depict a trend of growth in the Latino population and conclude that this
demographic is becoming the largest minority population in the country. This increasing
demographic is startling evidence that Latino students tend to be the least successful in higher
education attainment. Our country is in the last decade of a white majority in American public
schools and there are already minorities of white students in our two largest regions of the
country; the South and the West (Orfield & Lee, 2007).
2

The Civil Rights Project report (2007) revealed that: “Our country’s schools have not
only becoming less white but also have a rising proportion of poor children. The percentage of
school children poor enough to receive subsidized lunches has grown dramatically” (p. 3). The
U. S. National Center for Education Statistics published a report (2006), entitled, Poverty Status
of Persons, Families, and Children Under Age 18, By Race/Ethnicity, indicated that within the
U.S. there is an increasingly high number of children growing up in impoverished environments,
with a growing discrepancy in income based on limited parental education (Digest of Education
Statistics, 2006).
A 2007 Census Bureau Survey data report indicated that in 2000 one-sixth of U.S.
children were living below the federal poverty line (which is a significantly lower income than
the level for subsidized school lunches), including a tenth of whites, a seventh of Asians and
around a third of black, Latino and American Indian children. By 2005 those numbers had
reached almost a fifth (19%) of all U.S. children and about a ninth of whites with black children
fairing worse than Latinos or American Indians (U.S. Bureau of the Census, 2007). Orfield and
Lee (2005) suggested:
Poverty has long been one of the central problems facing segregated schools. Segregation
tends to be multidimensional. Typically, students face double segregation by
race/ethnicity and by poverty. These schools differ in teacher quality, course offerings,
level of competition, stability of enrollment, reputations, graduation rates and many other
dimensions. (p.3)
According to Orfield & Lee (2007):
The children in United States schools are much poorer than they were decades ago and
more separated in highly unequal schools. Black and Latino segregation is usually double
3

segregation, both from whites and from middle class students. For blacks, more than a
third of a century of progress in racial integration has been lost--though the seventeen
states which had segregation laws are still far less segregated than in the l950s when state
laws enforced apartheid in the schools and the massive resistance of Southern political
leaders delayed the impact of Brown vs. the Board of Education for a decade. For
Latinos, whose segregation in many areas is now far more severe than when it was first
measured nearly four decades ago, there never was progress outside of a few areas and
things have been getting steadily worse since the 1960s on a national scale. The children
in United States schools are much poorer than they were decades ago and more separated
in highly unequal schools. Too often Latino students face triple segregation by race,
class, and language. Many of these segregated African American and Latino schools have
now been sanctioned for not meeting the requirements of No Child Left Behind and
segregated high poverty schools account for most of the “dropout factories” at the center
of the nation’s dropout crisis. (pp. 4-5)
The K-12 Reality from a National Perspective
On average, segregated minority schools are inferior in terms of the quality of their
teachers, the character of the curriculum, the level of competition, average test scores, and
graduation rates. This does not mean that desegregation solves all problems, that it always
works, or that segregated schools do not perform well in rare circumstances. However, it does
mean that desegregation normally connects minority students with schools which have many
potential advantages over segregated ghetto and barrio schools, especially if the children are not
segregated at the classroom level (Orfield & Lee, 2007). A 2001 study entitled, School
Segregation on the Rise Despite Growing Diversity Among School-Aged Children supported the
4

premise that despite our nation’s growing diversity, our schools have become resegregated which
directly contributes to a growing quality gap between schools attended by white students and
those serving a large population of minority students (Harvard Graduate School of Education
News, 2010). The study resulted in four findings: steady resegregation occurring nationally and
in the South, steady Latino segregation growth, whites most segregated in schools, and strong
links between segregation by race and by poverty. The study revealed that as of 2001:
Seventy percent of the nation’s black students attend predominantly minority schools
(minority enrollment of over 50%), up significantly from the low point of 62.9% in 1980.
More than a third of the nation’s black students (36.5%) attend schools with a minority
enrollment of 90-100%. Although the South remains more integrated than it was before
the civil rights revolution, it is moving backward at an accelerating rate. (p. 18)
The second finding was that as of 2001:
The most dramatic trends in segregation affect Latino students. While intense segregation
for blacks is still 28 points below its 1969 level, it has actually grown 13.5 points for
Latinos. In 1968, 23.1% of Latino students attended schools with a minority enrollment
of 90-100%. In 1998, that number rose to 36.6% of Latino students. (p. 19)
In regard to the segregation of white students, the Harvard 2001 study indicated that as of 2001:
In spite of the rapid increase in minority enrollment in schools, white students remain the
most segregated from other races in their schools. Whites on average attend schools
where more than 80% of the students are white and less than 20% of the students are
from all of the other racial and ethnic groups combined. (p.2)
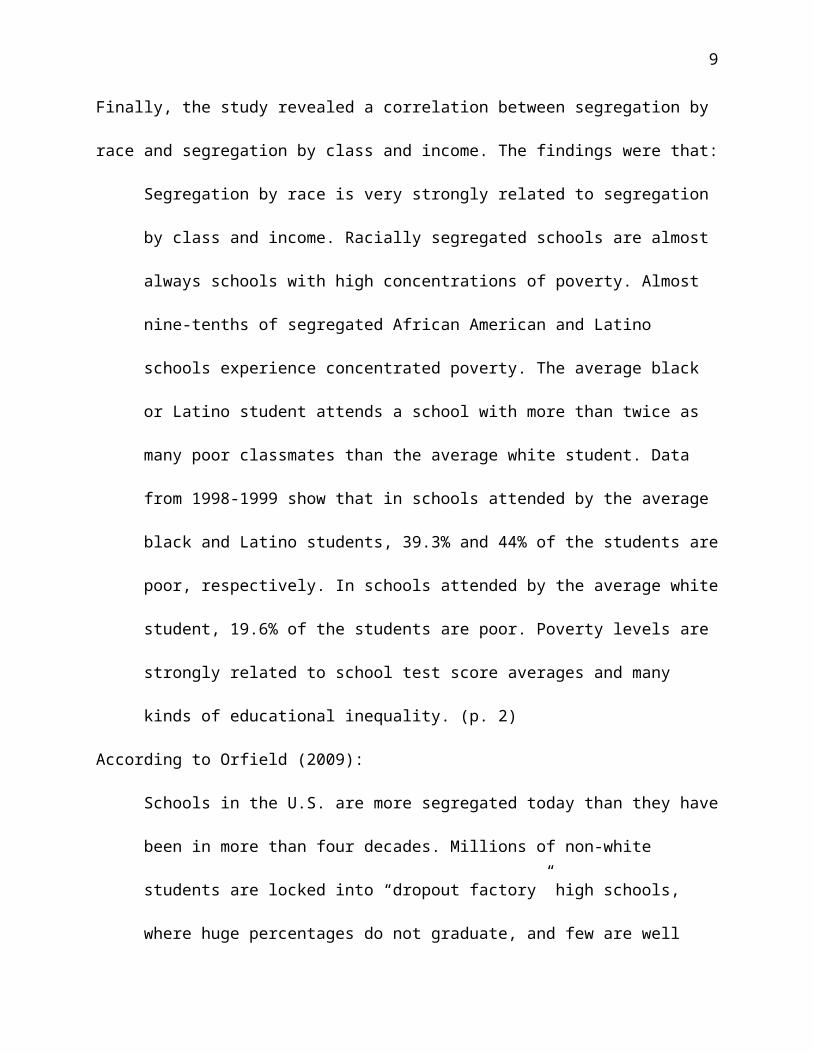
Finally, the study revealed a correlation between segregation by race and segregation by class
and income. The findings were that:
5

Segregation by race is very strongly related to segregation by class and income. Racially
segregated schools are almost always schools with high concentrations of poverty.
Almost nine-tenths of segregated African American and Latino schools experience
concentrated poverty. The average black or Latino student attends a school with more
than twice as many poor classmates than the average white student. Data from 1998-1999
show that in schools attended by the average black and Latino students, 39.3% and 44%
of the students are poor, respectively. In schools attended by the average white student,
19.6% of the students are poor. Poverty levels are strongly related to school test score
averages and many kinds of educational inequality. (p. 2)
According to Orfield (2009):
Schools in the U.S. are more segregated today than they have been in more than four
decades. Millions of non-white students are locked into “dropout factory” high schools,
where huge percentages do not graduate, and few are well prepared for college or a future
in the U.S. economy. (p. 26)
Findings from the Civil Rights Study (2009) entitled “Reviving the Goal of an Integrated
Society: A 21st Century Challenge” indicated that schools in the U.S. are 44 percent non-white,
and minorities are rapidly emerging as the majority of public school students in the US. Latinos
and African Americans, the two largest minority groups, attend schools more segregated today
than during the civil rights movement forty years ago. A review of the Latino and African
American population of school children reveal that two of every five students attend segregated
schools. Most students who attend non-white schools continue to be segregated by poverty as
well as race, and most of the country’s dropouts occur in non-white public schools, leading to
large numbers of virtually unemployable young people of color (Orfield, 2009).
6

Issues also exist with unequal funding, unqualified teaching staff and curricular
deficiencies that compound an already complex issue of inequality. Research around challenges
in urban school settings highlight disputes in securing and retaining highly-qualified staff, issues
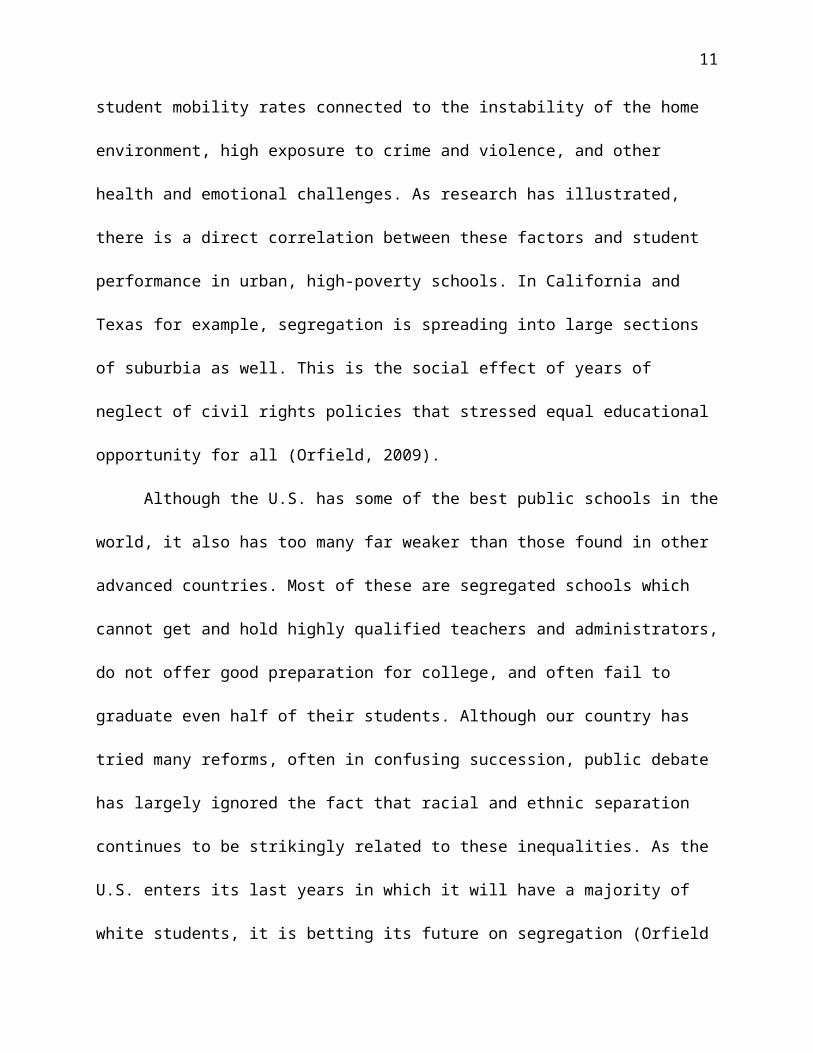
with parental engagement, high student mobility rates connected to the instability of the home
environment, high exposure to crime and violence, and other health and emotional challenges.
As research has illustrated, there is a direct correlation between these factors and student
performance in urban, high-poverty schools. In California and Texas for example, segregation is
spreading into large sections of suburbia as well. This is the social effect of years of neglect of
civil rights policies that stressed equal educational opportunity for all (Orfield, 2009).
Although the U.S. has some of the best public schools in the world, it also has too many
far weaker than those found in other advanced countries. Most of these are segregated schools
which cannot get and hold highly qualified teachers and administrators, do not offer good
preparation for college, and often fail to graduate even half of their students. Although our
country has tried many reforms, often in confusing succession, public debate has largely ignored
the fact that racial and ethnic separation continues to be strikingly related to these inequalities.
As the U.S. enters its last years in which it will have a majority of white students, it is betting its
future on segregation (Orfield & Lee, 2007). They go on to state, “The data coming out of the No
Child Left Behind tests and the state accountability systems show clear relationships between
segregation and educational outcomes, but this fact is rarely mentioned by policy makers” (p.7).
In a recent study entitled, “Gauging Growth: How to Judge No Child Left Behind”
(2007), Fuller et al revealed that:
Most states and the federal government have adopted policies that have the effect of
punishing schools and school staffs for unequal results in resegregated schools, which
7

tend to have concentrations of impoverished low-achieving students along with
inexperienced and sometimes unqualified teachers. The punishment and the narrowing of
the curriculum that accompanies excessive test pressure have not been effective and there
is evidence that it has made qualified teachers even more eager to leave these schools.
(pp. 268-277)
Problem Statement
High-poverty school failure continues to create a dark cloud over the opportunities for
students in urban communities, and widespread resources continue to be funneled into school
systems resulting in little to no closure in the achievement gaps of impoverished students within
the walls of these schools. According to Orfield and Lee (2007):
Poverty has long been one of the central problems facing segregated schools. Segregation
tends to be multidimensional. Few highly segregated minority schools have middle class
student bodies. Typically students face double segregation by race/ethnicity and by
poverty. These schools differ in teacher quality, course offerings, level of competition,
stability of enrollment, reputations, graduation rates and many other dimensions. (p.17)
The problem is more than troubled students, their parents, who according to public opinion
simply don’t care, or the inept teachers who lack formalized training to meet the needs of the
most challenging student. On the contrary, Arthur Levine in his Educating Leaders Report
(2005) harshly criticized the quality of educational administration programs. What has resulted
are atypical principal preparation programs that seek to train principals differently.
In an era of standards-based reform a marked change in the role of the principal has
evolved. Once keenly focused on management, operations, and primarily serving as a buffer to
keep externally-mandated reforms from teachers; the principal is now the leader of all school-
8
reform and instructional efforts on a campus. To support the movement toward accountability-
driven leadership, universities, national, and nonprofit organizations are partnering with school
districts across the nation to reframe the way in which principal training is delivered. These
programs are delivered above and beyond the traditional university-based master’s degree
programs, and are design to provide a pipeline of highly trained candidates ready to assume the
demanding role of the school principal in today’s schools.
Purpose of the Research Study
The purpose of this study was to investigate the differences between atypical and
traditional principal preparation programs and how principal training impacts student
achievement outcomes and school accountability ratings in Houston’s high-poverty schools.
First, this quantitative causal-comparative research study sought to examine new models
of principal preparation as recommended in the Levine Report, and compare those with more
traditional forms of principal preparation. Second, this study sought to conduct an analysis of
school accountability ratings and student achievement results at a select group of high-poverty
schools in the Houston region.
An initial review of literature reveals a modest amount of research conducted on the
subject of principal leadership. Additional information, insight and verifiable data were needed
in order to more fully understand the potential benefits of the atypical principal preparation
model and its impact on raising student achievement results. Opposing research suggested that
leadership effectiveness can be difficult in challenging schools. This viewpoint was often
attributed to the massive amount of work that challenging schools present, and the vast number
of roadblocks principals face upon entry as campus leader. Studies suggest that effective
leadership may need to be different at varying stages of a school’s development. Likewise, a
9

principal that must devote a massive amount of time to creating order in a school may place the
school at a disadvantage in getting the school to the point of creating school effectiveness. The
literature on turnaround schools (Herman, et al., 2008) reveals an urgent need for strong leaders
who have the competencies required to turn around a school.
Significance of the Study
Our education system is clearly in crisis. The public’s demand for more effective schools has
placed a laser-like focus on the critical role the school leader plays in school-reform efforts. Until
recently, the importance of the principal was often overlooked as a vital factor in the success of the
educational reform movements introduced to our nation’s schools over the past two decades.
In a 2005 Wallace Foundation study focused on the impact of school leadership, it was
revealed that second to the influences of classroom instruction delivered by the classroom teacher,
school leadership strongly affects student learning. Principals’ abilities are central to the task of
building schools that promote powerful teaching and learning for all students (Wallace Foundation,
2005). With schools in crisis, students who bring a myriad of challenges, inequities in our education
system, and the bureaucratic structure of our school systems, leading change on any school campus
requires a new type of school leader.
Leading in a Culture of Change as Fullan (2007) represents, is about unlocking the
mysteries of living organizations. These mysteries are often created by complexities in the
bureaucratic school systems across the country. Until recently the principal was often neglected
in the formulation of strategies for reform. As research mounted about the significant impact of
the principal, for better or for worse on reform outcomes, policy makers began to incorporate the
role of school leaders in leading change initiatives (Fullan, 2007). Recently, more attention and
focus has been given to the role a principal has in leading change efforts on a school campus.
10
It is the belief of the researcher that through a modified, more intensive post-university
training and mentoring model, as presented in this study, there will be a reduction in principal
turnover and principal effectiveness will improve dramatically within the next five years, thus
ensuring that systemic change in leadership preparation will occur. This study sought to explore
the principal preparation process and the role it has in introducing and leading to sustainable
change on a school campus resulting in improvements in student achievement performance and
overall improvement in the quality of education at high-poverty urban schools.
The researcher believed that through this study a strong and positive impact will be made
on the quality of principals in the greater Houston area and larger body of K-12 education with
recommendations around principal development and how training and preparing principals
differently can reshape urban educational reform.
Research Questions
Research and information gained from a synthesis of related literature helped to formulate
research questions to guide this study. The researcher attempted to find answers to the following
research questions:
1. Are there differences in school accountability ratings in high-poverty schools where
principal training and preparation differ?
2. Are there differences in student achievement outcomes in high-poverty schools where
principal training and preparation differ?
Research Hypotheses
The researcher predicted the following outcomes from conducting the study:
(H1): As measured by the AEIS Report, principals who participate in atypical principal
preparation programs will impact school accountability ratings in high-poverty schools in the
11

greater Houston area compared to principals who participated in traditional routes of principal
preparation.
(H2): As measured by the AEIS Report, principals who participate in atypical principal
preparation programs will impact student achievement outcomes in high-poverty schools
principals who in the Greater Houston area compared to participated in traditional routes of
principal preparation.
Null Hypothesis
In order to answer the research questions and test the research hypotheses, the researcher
developed the following null hypotheses:
(H01): There will be no statistically significant difference in school accountability ratings of high-
poverty schools in the greater Houston are having principals who went through atypical principal
preparation and those high-poverty schools with principals receiving atypical principal
preparation.
(H02): There will be no statistically significant difference in student achievement outcomes of
high-poverty schools in the greater Houston are having principals who went through atypical
principal preparation and those high-poverty schools with principals receiving traditional
principal preparation.
Assumptions
For the purposes of the study, the following assumptions were made:
1. Participants classified as traditionally trained principals all received training in master’s
programs with a concentration on school administration through a four year university.
2. Participants classified as atypically trained principals all received training in master’s
programs with a concentration on school administration through a four year university.
12
These participants also engaged in an additional preparation model that included some
form of mentorship by a master principal, and/or received additional classroom
instruction and clock hours around core leadership skills.
3. All participants have attained a Master’s Degree from a four year college and have
attained Texas principal certification through the State Board of Educator Certification.
4. All participants had an equal opportunity to participate in either traditional and/or
atypical principal preparation programs.
5. The Texas Assessment of Knowledge and Skills (TAKS) is an accurate and precise
measure of reading and mathematics curriculum taught by the classroom teacher.
6. Teachers used the Reading and Mathematics Texas Essential Knowledge and Skills
(TEKS) content and curriculum to prepare students for TAKS exams.
7. Anonymity of all participants in the study was maintained.
Delimitations
Delimitations can be described as a process by which the researcher randomly tightens the
range of the study and centers on chosen features of the problem, selected topics of interest to
narrow range of subject matter and level of complexity involved. Delimitation is a limitation
within the control of the researcher. The delimitations of the study included:
1. The principals included in the study were delimited to those traditionally or atypically
trained.
2. Student achievement results were delimited to reading and mathematics scores for two
consecutive academic years.
3. School accountability ratings were delimited to two consecutive academic years.
4. Schools were delimited to having 35% or higher free and reduced lunch percentages.
13

5. Principals were delimited to leading K-12 public schools within five school districts in
the greater Houston area.
6. Schools were delimited to participating in the Texas Education Agency state
assessment system.
7. Principals were delimited to having had at least 3-10 years of principal experience.
Limitations
Limitations are factors in the study that the researcher knows may sway the results or
generalization of the results, but for which the researcher has no control. The limitations that
could affect the study results included:
1. The study was limited to principals in five largest school districts in the Houston region.
2. The study was limited to an analysis of two academic school years 2008-2009 and 2009-
2010.
3. The study was limited to principals with a minimum of three years of principal
experience.
4. The study was limited to the identification of principals who had been on their campuses
a minimum of two academic years as defined by 2008-2010
Definitions of Terms
For the purpose of the study, the key terms to be used are defined as follows:
1. Academic Excellence Indicator System (AEIS) -pulls together a wide range of
information on the performance of students in each school and district in Texas every
year. This information is put into the annual AEIS reports, which are available each year
in the fall Academic Excellence Indicator System (AEIS) pulls together a wide range of
information on the performance of students in each school and district in Texas every
14

year. The performance indicators are: 1) Results of Texas Assessment of Knowledge and
Skills (TAKS); by grade, by subject, and by all grades tested; 2) Participation in the
TAKS tests; 3) Exit-level TAKS Cumulative Passing Rates; 4)Progress of Prior Year
TAKS Failers; 5)Results of the Student Success Initiative; 6) English Language Learners
Progress Measure; 7) Attendance Rates; 8) Annual Dropout Rates (grades 7-8, grades 7-
12, and grades 9-12); 9) Completion Rates (4-year longitudinal); and 10) College
Readiness Indicators. (Texas Education Agency, 2010)
2. Accountability Rating System - school districts are rated annually by the Texas Education
Agency (TEA) on the basis of campus performance on the Academic Excellence
Indicator System (AEIS). This system uses a subset of the performance measures
computed for AEIS to assign a rating to each public school and district of Exemplary,
Recognized, Acceptable, or Unacceptable based on results (Texas Education Agency,
2010).
3. Texas Assessment of Knowledge and Skills ( TAKS ) - is a standardized test used in Texas
primary and secondary schools to assess students' attainment of reading, writing, math,
science, and social studies skills required under Texas education standards. It is
developed and scored by Pearson Educational Measurement with close supervision by the
Texas Education Agency (Texas Education Agency, 2010).
4. No Child Left Behind Act (NCLB) - supports standards-based education reform, which is
based on the belief that setting high standards and establishing measurable goals can
improve individual outcomes in education. The Act requires states to develop
assessments in basic skills to be given to all students in certain grades; if those states are
to receive federal funding for schools. The Act does not assert a national achievement
15

standard; standards are set by each individual state (U.S. Department of Education,
2010).
5. Annual Measurable Objective - a measurement used to determine compliance with the
federal No Child Left Behind Act (NCLB). States must develop annual measurable
objectives (AMO) that will determine if a school, district, or the state as a whole is
making adequate yearly progress (AYP) toward the goal of having all students proficient
in English language arts and mathematics by 2013-14 (U.S. Department of Education,
2010).
6. Traditional Principal Preparation - historically, initial preparation for principals in the
U.S. has been a collection of courses covering general management principles, school
laws, administrative requirements, and procedures, with little emphasis on student
learning, effective teaching, professional development, curriculum, and organizational
change. This collection of courses generally results in a Master’s Degree with Principal
Certification (Wallace Foundation, 2007).
7. Atypical Principal Preparation - principal training goes beyond traditional university
programs, and beyond the Master’s Degree and Principal Certification. Atypical principal
preparation includes a combination of theory and real-world on the job shadowing of a
master principal embedded through a field-internship (Rainwater Leadership Alliance,
2010).
8. Texas Performance Measure (TPM) - the 2009 Texas Projection Measure (TPM) for
TAKS, TAKS (Accommodated), and linguistically accommodated versions of TAKS is a
multi-level regression-based projection model. The measure projects student performance
separately in reading/English language arts and mathematics in the next high-stakes grade
16

(defined by the Texas legislation as grades 5, 8, and 11) using students’ current year scale
scores in both reading/English language arts and mathematics and average campus scale
scores in the projection subject (i.e., reading campus mean for reading projections and
mathematics campus mean for mathematics projections) (Texas Education Agency,
2010).
9. Economically Disadvantaged - a student is classified as being economically
disadvantaged if the student is eligible for free or reduced priced lunch meals under the
National School Lunch and Child Nutrition Program based on the classification of:
having a family income at or below the federal poverty line, being eligible for Temporary
Assistance to Needy Families, or other public assistance (Texas Education Agency,
2009).
10. At-Risk - the U.S. Department of Education defines the at-risk student as one who was
likely to fail at school. Seven sets of variables are associated with at-risk students: basic
demographic characteristics; family and personal background characteristics; the amount
of parental involvement in the student’s education; the student’s academic history;
student behavioral factors; teacher perceptions of the student; and the characteristics of
the student’s school. Generally, these variables include belonging to a single head of
family household, low socioeconomic status, minority group status, having an English
language learner (ELL) status, low educational attainment of parents, disabilities,
psychosocial factors, or gender. In addition, family problems, drug addiction,
pregnancies, and other problems are viewed as at-risk factors that could potentially
prevent students from participating successfully in school (U.S. Department of
Education, 2011).
17

11. Alternative Education - also known as non-traditional education or educational alternative
includes a number of approaches to teaching and learning other than mainstream or
traditional education. Educational alternatives are often rooted in various philosophies
that are fundamentally different from those of mainstream or traditional education. While
some have strong political, scholarly, or philosophical orientations, others are more
informal associations of teachers and students dissatisfied with some aspect of
mainstream or traditional education. Educational alternatives, which include charter
schools, alternative schools, independent schools, and home-based learning vary widely,
but often emphasize the value of small class size, close relationships between students
and teachers, and a sense of community (Wikipedia, 2011).
12. Limited English Proficient (LEP) - state and federal laws require that students in our
public schools who do not speak English or whose native language is not English and
who currently cannot perform ordinary classroom work in English receive instruction that
is specifically designed to assist them both in learning English and in learning subject
matter content in their native language. These students are often referred to as limited
English proficient (LEP) students.
13. Special Education (SPED) - is the education of students with special needs in a way that
addresses the students' individual differences and needs. Ideally, this process involves the
individually planned and systematically monitored arrangement of teaching procedures,
adapted equipment and materials, accessible settings, and other interventions designed to
help learners with special needs achieve a higher level of personal self-sufficiency and
success in school and community than would be available if the student were only given
access to a typical classroom education. Common special needs include challenges with
18

learning, communication challenges, emotional and behavioral disorders, physical
disabilities, and developmental disorders (Wikipedia, 2011).
14. Public Law 94-142 - guaranteed a free appropriate public education to each child with a
disability. This law articulated a compelling national mission to improve access to
education for children with disabilities. The four purposes of the special education law
were: (1) to assure that all children with disabilities have available to them … a free
appropriate public education which emphasizes special education and related services
designed to meet their unique needs , (2) to assure that the rights of children with
disabilities and their parents … are protected , (3) to assist States and localities to provide
for the education of all children with disabilities, and (4) to assess and assure the
effectiveness of efforts to educate all children with disabilities (U.S. Department of
Education, 2011).
15. Drop Out - A dropout is a student who is enrolled in Texas public school in grades 7-12,
does not return to Texas public school the following fall, is not expelled, and does not
graduate, receive a GED, continue high school outside the Texas public school system or
begin college, or die (Texas Education Agency, 2006).
16. The No Child Left Behind Act (NCLB) - NCLB was enacted in 2001 and was designed
to improve academic of students in our nation’s public schools. The act was a strategy
designed to institute accountability measures to equalize the education system for all
students. This act emphasized testing and higher standards for teaching certification
(Texas Education Agency, 2007).
17. Urban School - a school is considered urban when at least 35% of its students are low
income (Texas Education Agency, 2006).
19

Organization of the Study
The study includes five chapters, a selected reference list, and appendices. Chapter I
offers an introduction identifying the researcher’s underlying motivations and premises for the
study and a rationale for the significance of the study. This is followed by a statement of the
study’s purpose, and problem. This chapter also includes research questions, methods,
procedures, assumptions, limitations, and delimitations. Chapter II presents a review of the
current literature surrounding the subject of the study, and it also provides the rationale for and
theoretical foundation for the study. Chapter III provides the landscape for the research
methodology used by the researcher. This includes: method, procedures, the instrumentation to
be used and data analysis procedures. Chapter IV summarizes the application of the method and
illuminates the data analysis results. Finally, Chapter V summarizes the study and provides
conclusions, and recommendations for further study.
20

CHAPTER II
REVIEW OF RELATED LITERATURE
Why does the greatest nation in the history of mankind allow roughly 30 percent of its
students to languish in illiteracy (Whittle, 2005)? The situation cannot be blamed on public
education alone. The culprits, if there are any, are the less than visionary political leadership and
less than mobilized citizenry. There are factors inherent in the beaurucratic structures of school
systems that serve as barriers that inhibit school performance, academic achievement, as well as
stifle high-quality educational opportunities for our nation’s children. This is especially evident
in schools with high levels of minority students or schools classified as being high-poverty.
To broaden the context of the this study which aims to assess how principal training
impacts student performance and school accountability ratings in high-poverty schools, an
understanding of key factors relative to the educational landscape of high-poverty minority
schools is important to consider. These factors serve as direct links to underperformance in high-
poverty schools and often serve as obstructions to a principal’s ability to reshape high-poverty
schools. They include: the identification of the disadvantaged and at-risk student, alternative
education and exclusionary programs, the Limited English Proficient (LEP) and Special
Education student, and the potential for these overarching factors to produce the dropout student.
Gauging the Quality of Education for the Impoverished Student: A Local Reality
It can be said that education is the gateway to opportunity for impoverished students.
Similar to the national landscape of poverty and substandard education for minority students, the
Texas and Houston (Harris County) public school landscapes also paint a grim picture for the
future of many of its public school students. Unless true school reform in public schools takes
place for all students with an emphasis on providing a quality education for the minority student
21

in vastly different ways than our country has already done, our country is doomed to having a
highly uneducated citizenry.
Research has shown that children living in low-income families tend to have a greater
risk of dropping out of school prior to graduating. A review of the 2010 Demographics of Poor
Children Report revealed that the landscape of Texas families included a total of 3,472,355
families having 6,607,575 school-aged children. Of this number of school-aged children, 23%
percent lived below the Federal Poverty Level compared to a national level of 19 % (National
Center for Children in Poverty, 2010). Also, 48% of students in Texas, and 45% in Harris
County were living in low-income families based on a 2009 study entitled, Demographics of
Low Income Children (National Center for Children in Poverty). Figure 1 depicts recent trends in
the number and percentage of Harris County school-aged children from 0-17 living below the
federal guidelines for sufficient income:
Year 1998 1999 2000 2002 2003 2004 2006 2008
Children in
Poverty
190,778
(20.2%)
192,163
(19.6%)
191.074
(19.1%)
208,200
(19.9%)
228, 966
(21.7%)
244,526
(22.9%)
259,986
(23.5%)
263,413
(23.0%)
Figure 1: Children at Risk Demographics of Low Income Children in Harris County (2009)
Standardized test data provides mounting evidence that there is a correlation between
poverty and lower cognitive achievement, and economically disadvantaged students often earn
below-average scores in reading, math, and science and tend to demonstrate poor writing skills.
Although the effects of poverty cannot be measured to a science, the implications for students in
poverty often set in motion a vicious and stubborn cycle of low expectations, including sub-par
academic performance.
Poverty, coupled with other identifiable labels, categories, classifications, and punitive
measures of exclusion superimposed upon minority students have resulted in a cycle of missed
22

opportunities and generations of undereducated adult citizens in the U.S., Texas and Houston
(Harris County). The identifiers include: the economically disadvantaged student, the at-risk
student, alternative education programs, the Limited English Proficient (LEP) student, Special
Education, and the high school drop-out. The origination of many of these identifiers and/or
programs was grounded with the full intent to provide systems of support for minority students,
and was created to level the “playing field.” However, research clearly demonstrates that the
minority student has been overwhelmingly impacted and limited by many of these well-intended
identifiers and programs. To compound these issues, inequitable funding in minority schools and
districts has created a challenging landscape for those who educate the minority student.
The Economically Disadvantaged Student
A student is classified as being economically disadvantaged if the student is eligible for
free or reduced priced lunch meals under the National School Lunch and Child Nutrition
Program based on the classification of: having a family income at or below the federal poverty
line, being eligible for Temporary Assistance to Needy Families, or other public assistance
(Texas Education Agency, 2009).
While 23% of all school-aged children living in Texas were classified as living below the
poverty level in 2010, there are even more children classified as economically disadvantaged.
According to the Texas Education Agency, in 2009-2010 there were 512,473 economically
disadvantaged students in Harris County, comprising 63.2% of the student population. Of the
districts represented in this study, Aldine ISD and Houston ISD had 85% and 81% economically
disadvantaged percentages respectively (Texas Education Agency, 2009). Figure 2 depicts recent
trends relative to the percentage of students in Harris County public schools classified as
economically disadvantaged:
Year 1990-91 1994-95 1998-99 2000-01 2001-02 2002-03 2003-04
23

Indicator 33.8% 42.5% 49.8% 52.5% 54.0% 55.6% 56.9%
Figure 2: Children at Risk Trends in Economically Disadvantaged Students in Harris County (2009)
History has demonstrated the relationships among race, poverty and education. As a
result of the Brown v. Board of Education decision and the civil-rights laws passed in the 1960s,
actions were taken to bridge the gap between white and black. Nevertheless, the gap between
rich and poor has continued to grow, with most negative impact on nonwhites, including a
similar situation which has developed for non-English speaking students who have entered our
country.
The At-Risk Student
In 1992, the U.S. Department of Education defined the at-risk student as one who was
likely to fail at school. School failure was typically viewed as a student dropping out of school
before high school graduation. The U. S. Department of Education associated seven sets of
variables with at-risk students: basic demographic characteristics; family and personal
background characteristics; the amount of parental involvement in the student’s education; the
student’s academic history; student behavioral factors; teacher perceptions of the student; and the
characteristics of the student’s school. These variables include: belonging to a single head of
household; low socioeconomic status; minority group status; having an English language learner
(ELL) status; low educational attainment of parents; disabilities; psychosocial factors; or gender.
In addition, family problems, drug addiction, pregnancies, and other problems were viewed as
being risk factors that could potentially prevent students from participating successfully in
school. Working in concert with one another, these variables have been found to contribute to an
increased likelihood of the risk of failing at school.
24

Nationally, about 9% or approximately 1.2 million U.S. students leave high school
without obtaining a diploma every year (U.S. Department of Education, 2009). In 2009, Texas
schools identified 2,285,954 or 48.3% of its total student population as being at-risk. Harris
County identified 424,595 students as at-risk, equating to 53.9% of the general population (Texas
Education Agency, 2009). While all ethnic groups were included in the data reporting at-risk
numbers, it was reported in 2010 that 47.8% of all African American students in Texas schools
were considered to be at-risk, and 67.3% of Hispanic students were considered at-risk. Of the
greater Houston region, two districts included in this study represented the highest and lowest at-
risk populations reported in Harris County. Aldine ISD had the highest at-risk population
reporting 70.1% and Humble had the lowest reporting 31.8% (Texas Education Agency, 2009).
The No Child Left Behind Act has placed educators in a challenging position of
supporting at-risk students, along with producing high achievements scores, making adequate
yearly progress, and meeting state standards. Schools and school leaders are focusing
considerable efforts on reaching students who are identified as at risk of becoming future
dropouts due to poverty, behavior, and/or academics. A major challenge in the educational
system today is identifying ways in which schools can improve the quality of instruction for
urban students. Many factors, including concentrated poverty, family instability, and early
exposure to violence, are a few hardships typical of growing up in an urban environment. Urban
students are often confronted with a series of obstacles in their attempts to meet academic,
personal, and social success.
Alternative Education: An Overrepresentation of Minority Placement
While race, poverty, and the at-risk classification influence minority performance in
high-poverty schools, exclusionary programs also have a major impact on overall student
25

performance. As defined by Wikipedia (2011), alternative education, also known as non-
traditional education or educational alternative, includes a number of approaches to teaching and
learning other than mainstream or traditional education. These educational alternatives are often
rooted in innumerable philosophies that are different from those of public or traditional
education. The origination of these program were based on strong political, scholarly, or
philosophical orientations, but have evolved into more informal associations of teachers and
students dissatisfied with some aspect of mainstream or traditional education. These educational
alternatives are often classified as: charter schools, alternative schools, independent schools, and
home-based learning. They often emphasize the value of small class size, close relationships
between students and teachers, and a sense of community.
Most recently however, the introduction of Disciplinary Alternative Education Programs
(DAEPs) schools designed to serve students who demonstrate difficulty functioning at their
home campus have added an additional layer to an already complex process for urban schools. In
contrast to educational and therapeutic alternative settings, DAEPs are aimed at correcting, or
managing the behavior of disruptive students (Aron, 2006). Disciplinary alternative education
programs have become a melting pot for the urban student. Students classified as “the urban
poor” often attend poorly-funded public schools that are unable to meet the demands of
educating their students and meeting their individual needs. In many school districts with high
concentrations of students in poverty, disciplinary alternative education serve as a warehouse for
poor, disabled, and minority youth.
The use of disciplinary alternative education programs to punish students who are
deemed to be undesirable is part of the school-to-prison pipeline – a nationwide trend of
funneling poor and minority students out of the education system and into the criminal justice
26

system (Geronimo, 2010). In a 2007 study entitled, “The Overrepresentation of African
American Students in Exclusionary Discipline: The Role of School Policy” the authors stated:
The overrepresentation of ethnic minority students, particularly African American males,
in the exclusionary discipline consequences of suspension and expulsion has been
consistently documented during the past three decades. Children of poverty and those
with academic problems are also overrepresented in such discipline consequences. Sadly,
a direct link between these exclusionary discipline consequences and entrance to prison
has been documented and termed the school-to-prison pipeline for these most vulnerable
students. (p.536)
During the 2007-2008 school year 103, 727 Texas public school students were
transferred from regular instructional settings to a disciplinary alternative setting (Texas
Education Agency, 2009). A review of the same data in 2008-2009, revealed that a large
majority or 68.3% of all alternative education program placements were discretionary, and were
not a direct result of violation of state code (Texas Education Agency, 2009). Alternative
education programs are often used as “dumping grounds” and “warehouses”
for difficult students, teachers, or administrators, creating “second-class
citizens” in the education community.
In Texas, alternative education programs have a drop-out rate that is
five times that of mainstream education programs and a recidivism rate that
approaches 30 percent. (Texas Appleseed, 2007). This fact is significant
because, while blacks are disciplined at a rate proportionate to their
representation in the population for mandatory referrals, they are
disproportionately represented for offenses that are deemed “discretionary
27

(Texas Appleseed, 2010). Figure 3 represents an illustration of the
comparison of alternative placements in Harris County during the 2008-2009
school year:
Disciplinary Action Mandatory Discretionary
Number Percent Number Percent
Expelled to JJAEP 456 39.8% 689 60.2%
Expelled 491 26.9% 1,332 73.1%
Removed to a DAEP 6648 31.7% 14,334 68.3%
In-School Suspension 1213 0.3% 395,994 99.7%
Out-of-School Suspension 5779 3.6% 15,6181 96.4%
Total-All Disciplinary Actions 14587 2.5% 568,530 97.5%
Figure 3: Children at Risk Comparison of Alternative Placements in Harris County (2009)
According to a 2003 study entitled, Zero Tolerance Policy in Schools: Rationale,
Consequences, and Alternatives, DAEPs are documenting record levels of enrollment, and a
"revolving door" for students has become a potential concern. While the recidivism rate of
students enrolled in DAEPs and the demographic characteristics of those who do return are not
being adequately tracked, it is important to consider the long-term ramifications for the minority
student. (Casella, 2003).
Limited English Proficient Students: A Growing Local Majority
The landscape of this study presents many factors contributing to the underperformance
of the urban school, the challenges and roadblocks students in these schools face, as well as the
importance of a school leader being able to lead change efforts against undeniable odds. An
additional factor contributing to the local landscape of educating minority students is that of
language barriers.
28

State and federal laws require that students in our public schools who do not speak
English or whose native language is not English and who currently cannot perform ordinary
classroom work in English receive instruction that is specifically designed to assist them both in
learning English and in learning subject matter content. These students are often referred to as
limited English proficient (LEP) students. They are also referred to as English language learners
(ELLs).
A 1995 study conducted by the Department of Education revealed the following in regard
to Limited English Proficient students:
1. LEP students are a diverse and often poor population. While LEP students speak over a
hundred languages, Spanish is spoken by more than 77 percent of these students. In low-
income urban schools, the proportion of Spanish speakers rises to about 90 percent of
LEP students.
2. Most LEP students come from poverty backgrounds. Fifty-four percent of LEP students
in 1st and 3rd grades are in families with incomes under $15,000--and the proportion
rises to 66 percent in high-poverty schools. About 50 percent of Hispanic LEP 1st graders
attend a high-poverty school--compared to 8 percent of Asian LEP 1st graders. Less than
a 3rd of the parents of LEP students reported very good skills in speaking, reading or
writing English. About 50 percent of mothers of LEP students do not have a high school
diploma.
3. LEP students are likely to attend schools with poor children.
4. Schools with high concentrations of low-income students face increased challenges.
More than 40 percent of LEP students attend high-poverty schools where at least 75
percent of the students are eligible for the school lunch program--compared to 13 percent
29

of all students. Over 74 percent of LEP students attend schools where at least half the
students are eligible for the School lunch program--schools now eligible for Title I
"school-wide" programs.
According to state data from the 2010-2011 school year, slightly more than 50 percent of
Texas' 4.9 million public school students were classified as Hispanic (Texas Education Agency,
2010). During the 2008-2009 school year, the percentage of students in the greater Houston
identified as Limited English Proficient (LEP) was 20.2%. An additional 19.1% were identified
as being enrolled in bilingual or English as a Second Language (ESL) programs (Texas
Education Agency, 2009). In Texas, the number of Latino dropouts will be nearly three times
greater than the number of dropouts for any other ethnicity by 2012 (Education Equality Project,
2011).
The percentage of students classified as Limited English Proficient (LEP) has a profound
effect on the student and his or her transition into American schools. Many of these students
struggle to master academic content and mastery of subject matter can be challenging. In many
ways, academic achievement, as measured by the state assessment, is not a true depiction of the
skills and abilities of these students, since language often becomes a barrier to the demonstration
of mastery of learning.
Schools with high LEP populations have high demands to not only ensure that students
are receiving the required support around language barriers, but also necessary interventions and
remedial instruction as identified by classroom performance. Principals must also be well-versed
in supporting the LEP student, and in identifying, hiring, retaining and training staff who are
trained to meet the needs of students at all levels.
30
Special Education and Its Impact on the Minority Student
Wikipedia (2011) defines special education as the education of students with special
needs in a way that addresses the students' individual differences and needs. This process
involves the individually planned and systematically monitored arrangement of teaching
procedures, adapted equipment and materials, accessible settings, and other interventions
designed to help learners with special needs achieve a higher level of personal self-sufficiency
and success in school and community than would be available if the student were only given
access to a typical classroom education. While Public Law 94.142 guaranteed a free appropriate
public education to each child with a disability, minorities have historically been classified as
special education which impacts the trajectory of their educational experiences.
Poverty has long been noted as a cause of overrepresentation of minority groups in
special education. Minority children with disabilities who live in urban and high poverty
environments are believed to be at alarmingly high risks for educational failure and poor
outcomes because of inappropriate identifications and placement services. A 2002 National
Research Council report assessed the number of students in special education according to race.
The study revealed clear disparities in the special education categories that carry the greatest
stigma, including mental retardation, emotional disturbance and, to a lesser degree, learning
disabilities (Donovan and Cross, 2002).
The Twenty-Second Annual Report to Congress on the Implementation of the Individuals
with Disabilities Education Act (2000) documents the extent and seriousness of the problem:
1. African-American youth, ages 6 through 21, account for 14.8 percent of the general
population. Yet, they account for 20.2 percent of the special education population.
31

2. In 10 of the 13 disability categories, the percentage of African-American students equals
or exceeds the resident population percentage.
3. The representation of African-American students in the mental retardation and
developmental delay categories is more than twice their national population estimates.
There are overwhelming statistics indicating an overrepresentation of students of color
who have been identified to receive special education services. A 2010 Texas Appleseed report
revealed a disproportionate share of minority and special education students being expelled from
Texas public schools for non-criminal, non-violent offenses. During the 2009-2010 school year,
64, 696 students received special education services in Harris County. An analysis of ethnic
group distribution revealed that of this number, 10.7% of those students were African American,
and 7.7% were Latino (Academic Excellence Indicator System, n.d.). The Public Policy Institute
(2003) reported that without adequate intervention resources, public schools would soon be
overwhelmed with children from poor socioeconomic environments in the special education
system.
The real problem of the overrepresentation of students of color in special education is that
miscategorization leads to misplacement, and misplacement leads to a lack of appropriate
instruction for students (Obiakor & Ford, 2002). Further, a lack of appropriate instruction results
in failure and ultimately a cycle of low expectations and frustration that begets more failure; a
vicious cycle that contributes, ultimately, to in-school and post-school failure for a
disproportionate number of students of color. This multifaceted dynamic bounds high-poverty
schools to a never-ending cycle of deciphering which students are classified effectively, and the
impacts for those who are misplaced and have such huge gaps in knowledge and skills as a
result.
32

Graduation and Drop-Out Rates
Researchers have identified many factors and conditions that appear to be correlated with
high student dropout rates (Davis & Lee, 2003). Many of the most commonly cited factors have
been previously cited in this study and demonstrate a clear alignment of research centered on the
challenges urban schools and students face. They include: low family income level, being a
member of certain racial/ethnic minority groups, limited English proficiency, living in a single-
parent household, retention in grade, academic problems and course failure, behavioral and
disciplinary problems, teenage pregnancy, low educational levels of parents, high absenteeism
and truancy, geographic location, family problems, high mobility, having a sibling or siblings
who dropped out, substance abuse, and a lack of motivation for and/or a strong dislike for
traditional schooling (Davis & Lee, 2003).
In the 2010 Children at Risk Report, Growing Up in Houston: Assessing the Quality of
Life of Our Children report, it was reported that Texas ranks last in the nation on the percentage
of adults with the high school diplomas; with only 79.6% of Texans having a high school
diploma. In Texas, a single cohort of dropouts has been estimated to result in a loss of up to $9.6
billion for the state (Taylor, et.al, 2009). Of the districts represented in this study, Figure 4
represents trends in graduation, completion and dropout rates as reported by the Texas Education
Agency in 2008.
District TEA Graduation Rate TEA Completion Rate TEA Longitudinal Dropout Rate
Aldine ISD 69% 81% 18%
Alief ISD 69% 81% 18%
Cy-Fair ISD 86% 96% 4%
Houston ISD 68% 81% 19%
Humble ISD 83% 90% 9%
Figure 4: Children at Risk Harris County Graduation, Completion and Drop-Out Rates in Harris County (2008)
33

Research shows that urban students compared to suburban students are more likely to live
in poverty and attend schools with high concentrations of low income students, high drop-out
percentages, and above-average numbers of students in special education. These schools also
have large numbers of students who struggle with speaking, reading and writing English; live in
single-parent households; and have less access to regular medical care. Urban schools also tend
to have fewer financial and educational resources and a shortage of teachers. These schools are
in crisis, and the importance of school leadership is undeniable.
A Call for Transformational Leadership
Public school reform has long been associated with the quality and structure of leadership
as a contributing factor to improving student achievement. With the introduction and realization
of the No Child Left Behind Act of 2001 (NCLB), educational leaders are held responsible for
higher standards of student achievement on standardized tests. NCLB was designed to change
the culture of America’s schools by closing the achievement gap, offering more flexibility,
giving parents more options, and teaching students based on what works (U.S. Department of
Education, 2005). The results have been instead, measures of progress based almost exclusively
on standardized tests superimposed on schools each year.
When high-poverty schools fail to rise to the standards established for performance they
are frequently categorized as centers of academic failure. Schools are often labeled as hubs for
miseducating children in poverty; while research suggests that vast inequities remain in the K-12
system even though these schools are measured by same standards as schools with extensive
resources, highly-trained and proficient teachers, and ample parental support. This presents a
unique and challenging opportunity to address a phenomenon that continues to plague school
districts across the country.
34

Since 2001, accountability standards in education have increased substantially based on
the passage of NCLB and its mandates. The onslaught of high stakes testing, accountability, and
public pressure to meet these high standards necessitates the need for a different type of
principal. However, training programs continue to prepare principals for schools of yesterday.
Carnoy, Elmore, and Siskin (2003) concluded that “The expressed purpose of the new state
accountability systems is to raise student achievement and, more generally, to improve the
quality of schooling” (p. 6). According to Hess and Kelly (2005):
School leadership is the key to school improvement. School principals are the front-line
managers, the small business executives, the team leaders charged with leading their
faculty to new levels of effectiveness. In this new era of educational accountability,
where school leaders are expected to demonstrate bottom-line results and use data to
drive decisions, the skills and knowledge of principals matter more than ever. (p.1)
With an undeniable need to have a strong leader at the helm of every school, the need for
transformational leadership is paramount to the ability of high-poverty schools to be successful.
Transformational leadership can be described as a type of leadership that focuses on the
impact leaders have on their organizations. Viewing leadership through this type of lens is a
rarity as most often a leaders’ impact in measured by his/her natural abilities and level of output
within an organization. The concept of transformational leadership was introduced through the
work of James McGregor Burns. His theoretical framework of leadership was based on
transcendence of self-interest by both leader and those who are being led. Essentially,
accomplishing tasks was based on something larger than a focus on self, and thus the leader had
to engage the subordination in meeting the skills and objectives required by the job.
35

Bernard Bass continued the work of Burns by introducing transactional leadership and
contrasting it with that of transformational leadership (Bass & Avolio, 2005). Bass defined
transactional leadership as leadership where the leader makes a determination of what
subordinates need to do to accomplish a given objective. Once the leader has identified the
objectives, the leader the works directly with the subordinates to build confidence in subordinate
ability to accomplish the task, and rewards to the subordinates for their individual
accomplishments. In contrast, transformational leaders not only focus on getting subordinates to
complete a task; instead, they motivate and inspire those they lead to do much more than they
expect them to do. According to Bass & Avolio (2005):
Transformational leaders motivate and inspire in three ways: (1) by raising followers'
levels of consciousness about the importance and value of designated outcomes and about
ways of reaching them; (2) by getting followers to transcend their own self-interest for
the sake of the team, organization, or larger polity; and (3) by raising followers' need
levels to the higher-order needs, such as self-actualization, or by expanding their portfolio
of needs.
Recently, the introduction of a holistic model of transformational leadership was
provided by Kenneth Leithwood who identified seven factors that constitute transformational
and transactional leadership. The Leithwood model of transformational leadership (Leithwood,
2011), conceptualizes leadership behaviors along a continuum of eight dimensions: (1) building
school vision, (2) establishing school goals, (3) providing intellectual stimulation, (4) offering
individualized support, (5) modeling best practices and important organizational values, (6)
demonstrating high performance expectations, (7) creating a productive school culture, and (8)
developing structures to foster participation in school decisions.
36

Leadership is an essential ingredient for ensuring that every child in America gets the
education they need to succeed. Indeed, educational leadership has been called the “bridge” that
can bring together the many different reform efforts in ways that practically nothing else can
(Wallace Foundation, 2007). Teachers are on the front lines of learning. But principals at the
school level, and superintendents at the district level, are uniquely poised to provide a climate of
high expectations, a clear vision for better teaching and learning, and the means for everyone in
the system – adults and children – to realize that vision. There is a strong need for leadership to
forge all of the various elements of today’s school reform efforts into a well-functioning system
that makes sense for those working hard to achieve results for children.
In the text, Learning to Lead: A Workbook on Becoming a Leader, Bennis and Goldsmith
quote John Gardner as saying, “Leaders have a significant role in creating the state of mind that
is the society. They can serve as symbols of the moral unity of the society. They can express the
values that hold the society together” (Bennis & Goldsmith, 2003, p. 200). Most important, they
can conceive and articulate goals that lift people out of their petty preoccupations and carry them
above the conflicts. Learning to lead is, on one level, learning to manage change. A leader
imposes (in the most positive sense of the word) his or her philosophy on the organization
creating or re-creating its culture. The organization then acts on that philosophy, carries out the
mission, and the culture takes on a life of its own, becoming more cause than effect. But unless
the leader continues to evolve, to adapt and adjust to external change, the organization will
sooner or later stall (Bennis & Goldsmith, 2003).
Successful schools are complex, collaborative institutions requiring a high level of
performance from every professional. School success critically begins with the school principal
who — day in and day out — has prime responsibility for ensuring that all students meet
37

challenging grade-level and college- and career-readiness standards. More often than not, the
principal’s leadership skills determine whether a school becomes a dynamic learning
organization or a failed enterprise (Southern Regional Educational Board, 2007).
In a 2003 Southern Regional Education Board article entitled, Good Principals Are the
Key to Successful Schools: Six Strategies to Prepare More Good Principals, readers were
provided with six strategies as the basis of preparing good principals for today’s schools. The
article frames the need for a different kind of principal leadership development with the
following statement:
Some schools are lucky enough to have excellent principals. What’s missing is a reliable
leadership development system that takes luck out of the equation-a system that identifies
recruits and develops people who have proven records of raising student performance and
closing achievement gaps. The problem is not a lack of certified principals but rather a
lack of qualified principals (p.1)
With an abundance of individuals attending the nation’s universities to gain the necessary degree
and certification required to move into the job of principal, the question could be asked, “Why
are there so many certified principals who are not qualified to get the job done in today’s high-
poverty schools?” Currently universities determine who is enrolled in their programs based on
their own internal selection criteria, and thus control the pool of potential principals. While the
selection criteria may provide the university with indications of how well a candidate may do in
graduate or certification programs, they offer few clues as to whether or not a person has the
ability to lead a school (Southern Regional Education Board, 2003).
38

Underperformance of the Urban Student and the Call for Strong Leadership
Every year, thousands of students housed in underperforming schools represent a
continuing tragedy in the K-12 system. Every student who attends those schools will struggle for
a lifetime; not being able to secure stable employment, obtain adequate housing or health
insurance, therefore living shorter lives characterized by greater stress and limited life options.
At the same time, every urban school district classified as holistically failing has within its
schools that serve as examples of success, and generally the principal at the helm of the school
that makes the difference. The success of these individual schools is rarely replicated throughout
the entire district as doing so would challenge the bureaucracies within those districts. The most
cynical of all blocking strategies used by failing urban districts is the notion that the proposed
changes have not been fully researched, as if current school practices reflect a scientific
knowledge base and not an accumulation of traditions (Haberman, 2003). The Wallace
Foundation (2007), beckoned:
The call for strong leadership in education is unmistakable—leadership that brings
about significant improvement in learning and narrowing of achievement gaps.
Yet many school and district administrators report their time is consumed by matters
unrelated to learning improvement. Even with enough time to focus, the task leaders
face is complex, and it is not always clear what they should be doing to contribute to
that goal. Within the nature of accountability and continuing measures of progress,
leaders have to be prepared to exert a different style of leadership. (p.7)
The school leader has become the central ingredient to school improvement. Hess and
Kelly (2007), revealed that school principals are the front-line managers, the small business
executives, the team leaders charged with leading their faculty to new levels of effectiveness.
39
The critical mass of research literature supports the concept that effective leadership is
significant to the successful creation of a well balanced and healthy organization (Bruffee, 1999;
Bolman & Deal, 1997; Furman, 2003; Schein, 2000; Yukl, 2006). Today’s educational leaders
must have a keen awareness of national, state, and local standards of accountability, while
balancing reduced per pupil allocations, diminishing resources, and lessening public support.
Leaders of today are dealing with issues that leaders of yesterday could not have
imagined. In an era where accountability measures serve as the barometer of success or lack
thereof, principal effectiveness in high-poverty schools is an educational organization’s best
hope for success. Moreover, authors and theorists have concluded that effective leadership serves
as the cornerstone for future success and also reveals an obvious relationship between effective
leadership and overall school effectiveness and student achievement outcomes. (Davis, 2003;
Furman, 2003; Hallinger & Heck, 1999; Schein, 2000). At the same time that schools and
principals are addressing the needs of at-risk students, they also must increase the rigor of the
traditional curriculum and the level of student achievement to meet the changing needs of the 21st
century workplace. Student preparation for success in post-secondary education and careers is
central to the long-term health of our economy and society. Even students who do make it to
their senior year and graduate from high school may continue to struggle.
According to The American Diploma Project, only 47 percent of high school juniors had
scores that would be considered “college ready” on 2005 standardized tests (American Diploma
Project Network, 2007). Some reports suggest that as many as 50 percent of college freshmen
require remedial work in English and math before they can handle college-level courses (Texas
Higher Education Coordinating Board, 2007). The economic impact both for individuals and for
40
society are huge, as the difference in average earning by educational attainment level has
expanded significantly (Public Agenda, 2007).
State Assessment: Teaching with the Cognitive and Affective Domains in Mind
In regard to the impact of state assessment and student achievement in schools, Glenn in
his 2006 article entitled, “The Diversity Dilemma in Texas and the Nation: Creating a Holistic
Educational Model to Make “No Child Left Behind” a Reality in America, espoused that the
inception of the federal mandate around gauging success of schools based on the state
assessment is based on the assessment of a students grasp of cognitive skills. While assessing
one’s cognitive skills is a standard practice around the country, Glenn’s research illuminated the
fact that most African American and Latino students learn best through the affective domain.
This presents a stark contrast in the way in which we teach and assess minority students, and
could explain factors that contribute to the achievement gap.
The concept of teaching for cognitive and affective outcomes was stressed as far back as
1972 through the work of social critic, Peter Drucker, who felt that American schools needed to
rethink the fundamental way in which schools operated. Most notably, Drucker stressed that the
schools of tomorrow should be neither behavioristic nor cognitive; neither child-centered nor
discipline-centered. He stressed that they must be a combination of all of these. So often in
American schools the instructional focus is centered-around the cognitive domain. In teacher
preparation programs across America, teachers are trained to concentrate on teaching students at
various levels of Bloom’s Taxonomy. While this cognitive type of teaching has become more
prevalent due to the focus on accountability and testing, minority students are often left with
instruction they can neither relate to or value.
41

Research clearly demonstrates that minority students tend to depend upon their affective
domains as a major part of their learning, which emphasizes what is taught in conjunction with
their values, motivation, attitudes, feelings, and stereotypes. However, in most formal classroom
teaching, most of the teacher's efforts typically go into the cognitive aspects of the teaching and
learning and most of the classroom time is designed for cognitive outcomes. Similarly, state
assessments and the evaluation of cognitive learning is straightforward while assessing affective
outcomes is difficult. Thus, there is significant value in realizing the potential to increase student
learning by tapping into the affective domain. Similarly, students may experience affective
roadblocks to learning that can neither be recognized nor solved when using a purely cognitive
approach.
No Child Left Behind and the Influence of School Accountability on Leadership
As a result of NCLB, educational accountability standards have increased tremendously
(Stecher & Kirby, 2004). Subsequently, educational leaders are now responsible for meeting
expectations unparalleled to that of previous decades (Aldridge, 2003). School leaders of today
must employ a breadth and depth far beyond everyday tasks of balancing budgets, creating
master schedules, and dealing with student behavior and irate parents. Bolman and Deal (2002)
emphasized that:
The most important responsibility of school leaders is not to answer every question fully
or make every decision correctly. They, of course, need to track budgets, comply with
mandates and keep the buses running. But as leaders they serve a deeper, more powerful
and more durable role when they are models and catalysts for such values as excellence,
caring, justice and faith. (p. 1)
42

With recent research highlighting the importance of leadership in improving student achievement
outcomes and the increased complexity of the position, the preparation of principals has taken on
an increased importance. The Wallace Foundation (2007) stated in its annual report that
principals at the school level, and superintendents at the district level, are uniquely poised to
provide a climate of high expectations, a clear vision for better teaching and learning, and the
means for everyone in the system – adults and children – to realize that vision. A well-
functioning system means not only improved training — but a more coherent web of support for
strong, learning-focused leadership in schools school districts.” In order to ensure that principals
are prepared to lead schools of today, districts must adopt new ways of identifying, recruiting,
training, and retaining principals. According to Fielder (2003):
Principals have an impact on every aspect of their school. They affect the climate, the
cleanliness, and the quality of staff. They affect the taste of the food in the cafeteria, the
availability of extracurricular athletics and activities, and the general appearance of the
building. They also affect student achievement regardless of the socioeconomic
background of the students. It may not be too much of an overstatement to say that
students succeed or fail because of the principal. (p.107)
Today, school principals are asked to lead in a unique educational field manifested by
unparalleled responsibilities and challenges. With recent research highlighting the importance of
leadership in improving student achievement and the increased complexity of the position, the
preparation of principals has taken on an even greater importance. Educational leadership has
been called the “bridge” that can carry reform efforts in ways that practically nothing else can.
As the University of Toronto researcher Kenneth Leithwood and his colleagues put it in their
landmark 2004 report “How Leadership Influences Student Learning,”:
43
There are virtually no documented instances of troubled schools being turned
around in the absence of intervention by talented leaders. While other factors
within the school also contribute to such turnarounds, leadership is the catalyst.
If leadership is in fact the critical bridge to having school improvement pay off
for children, we need to understand how to better prepare school administrators
to lead the increasingly complex institution we call school, so that all children can
learn to high standards. (p. 5)
Successful schools are complex, collaborative institutions requiring a high level of performance
from every professional. School success critically begins with the school principal who — day in
and day out — has prime responsibility for ensuring that all students meet challenging grade-
level and college- and career-readiness standards. More often than not, the principal’s leadership
skills determine whether a school becomes a dynamic learning organization or a failed
enterprise.
Leaders: Inherent Skill or a Set of Learned Behaviors
Highly skilled school leaders are not born — nor are they fully forged in the instructional
setting of the school classroom. Neither do they emerge fully prepared to lead from traditional
graduate programs in school administration. Most likely, effective new principals who have been
rigorously prepared and deliberately mentored in well-designed programs that immerse them in
real-world leadership experiences where they are challenged to excel will be the most successful
(Southern Regional Educational Board, 2007). Many districts are now attempting to place the
power and authority back into the schools after many different attempts at reforming from the
outside. According to the 2008 Wallace Foundation study entitled Becoming a Leader:
Preparing School Principals for Today’s Schools:
44
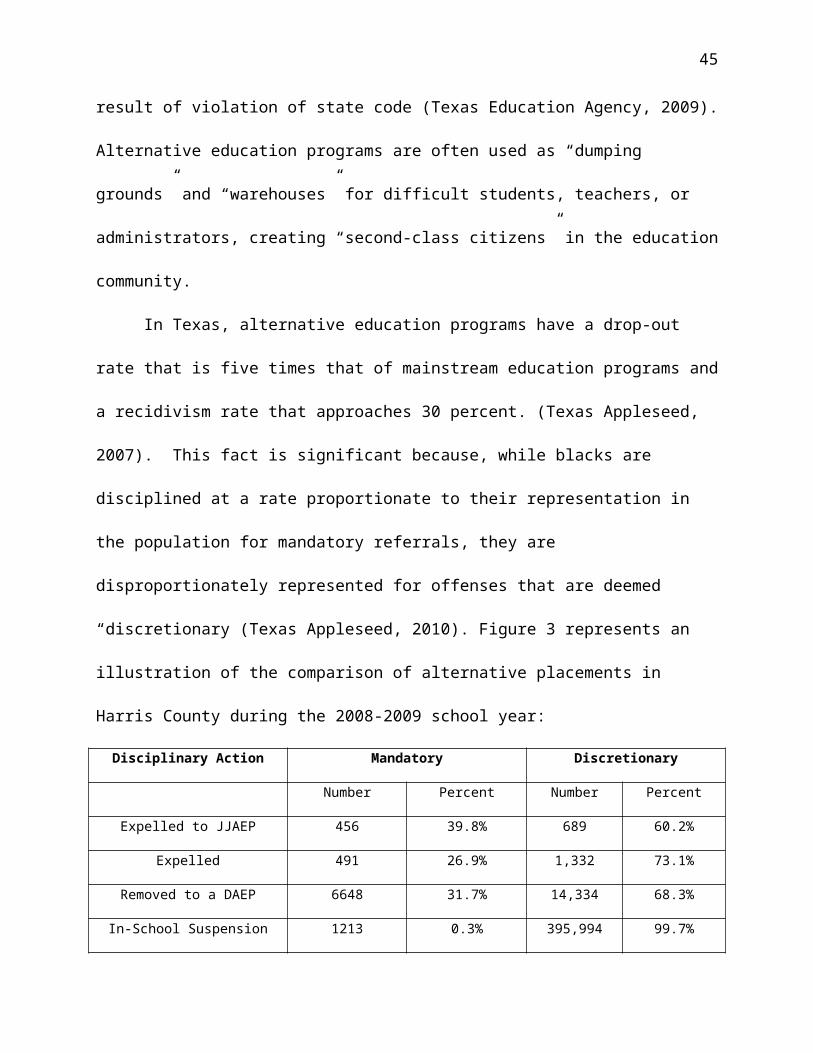
The importance of effective school leadership and the accompanying need to provide
principals with more appropriate training to meet today’s needs are getting long-overdue
attention. Teachers have the most immediate in-school effect on student success. But
there is growing agreement that with the national imperative for having every child
succeed, it is the principal who is best positioned to ensure that teaching and learning are
as good as they can be throughout entire schools, especially those with the highest needs.
(p. 1)
Schools of the twenty-first century require a unique and different kind of principal who can
fulfill many different roles. Principals in today’s schools must have the intellectual acumen to
simultaneously serve as instructional leaders, community leaders, and visionary leaders
simultaneously. An instructional leader is one who is continually focused on strengthening
teaching and learning, professional development, data-driven decision making and
accountability. Being a leader of the community requires that the principal have an awareness of
the big picture in regard to the school’s role in society. The principal must also recognize the
need to operate through systems of shared leadership and close relationships with community
members, parents, and other stakeholders. Finally, the principal as visionary leader must embody
a demonstrated commitment to a belief that all students can learn at high levels regardless of
race, socio-economic standing, and background. As a visionary leader, the principal is
responsible for inspiring others in the school with the same belief.
The antiquated model of principal preparation that focuses on management and
production is no longer aligned to the needs in today’s schools. There is no room for command
and control as a means of leading a school. Principals must be equipped and armed with a full
understanding of how to lead based on a philosophy of shared leadership with an emphasis on
45

academic content, pedagogical techniques, and a new mind-set around leadership. Michael
Fullan (2001) describes five core mind-action sets that principals must embody to lead today’s
schools: moral purpose, understanding of the change process, relationships, knowledge building,
and coherence making. In his 2001 text entitled Leading in a Culture of Change, he describes
these five mind-actions sets as follows:
1. Moral purpose-is about both ends and means. Leaders in all organizations contribute for
better or worse to moral purpose in their own organizations. Moral purpose is critical to
the long success of all organizations.
2. Understanding the change process-six guidelines are offered that provide leaders with
concrete and novel ways of thinking about the process of change: (1) the goal is not to
innovate the most; (2) it is not enough to have the best ideas; (3) recognize and manage
the implementation dip; (4) redefine resistance as a potential positive force; (5)
reculturing is the name of the game; (6) never a checklist, always complexity.
3. Relationships-leaders must be consummate relationship builders with diverse people and
groups. Effective leaders constantly foster purposeful interaction and problem solving.
4. Knowledge building-leaders need to commit themselves to constantly generating and
increasing knowledge inside and outside the organization. Effective leaders understand
the value and role of knowledge creation, they make it a priority and set about
establishing and reinforcing habits of knowledge exchange among organizational
members.
5. Coherence making-effective leaders guide people through differences and enable
differences to surface while creating coherence. They tolerate enough ambiguity to keep
46

creative juices flowing, but seek coherence along the way. They ensure strategies are in
place to keep people focused and moving in a purposeful direction.
Principal Leadership and School Effectiveness
Principal leadership contributes positively to school effectiveness. Based on a review of
the literature, no particular style of leadership is effective across all schools, but rather,
successful principals find a style that is most suited to their own school and situation. In a
Schooling Digest article the characteristics of school effectiveness were studied and found that:
“Principals who share leadership responsibilities and involve teachers in decision-making
processes will build a sense of unity in their leadership teams and amongst their staff; which will
contribute positively to school effectiveness” (2004, p. 5). The author revealed that an additional
factor connects effective leadership in schools to the notion that the principal is not just a senior
administrator, but also an educational and instructional leader with expertise in teaching and
learning. Principals, as the article points out, should have knowledge and experience of what
happens in the classroom, and should know and be able to suggest teaching strategies and
assessment procedures. It also suggests that leadership support is critically important in
establishing a positive work environment for teachers and thus maintaining a high level of
morale. This in turn results in a staff that is empowered and thus works on behalf of the students
enrolled (Schooling Issues Digest, 2004, pp. 4-6).
Leadership at its best creates an avenue of shared leadership, a culture of common values,
and empowerment of teachers. In its truest form effective school leadership impacts school
effectiveness by a) creating a common mission and vision; b) involving others in the decision
making process; c) the leader having a direct concern for what happen in the classroom with
students; d) a hands on monitoring process related to instructional delivery; e) a hands on
47

staffing model that monitors the effectiveness at the classroom level; and f) high expectations for
staff and students.
The Local Perspective: Houston’s Schools and the Need for a New Type of Leader
The national problem of segregation of public school children based on race is also found
in Texas and in particular, the Houston area. The Houston region encompasses 54 school
districts, approximately 1,294 schools, and more than one million students. Three out of four of
these students are economically disadvantaged, and a growing number are English-language
learners. The fourteen largest area districts enroll more than 770,000 students; and of these, eight
serve student populations that are more than 50 percent economically disadvantaged (Region IV
Education Service Center, 2007). These changes have created huge challenges for public school
principals in the Houston area. Schools are becoming more crowded, and serve more children
from different backgrounds who are increasingly poor. Population changes have made Houston
one of the most ethnically diverse metropolitan areas in the country, in which all ethnic groups
are “minorities (Kleinberg, 2007). The city’s population is increasingly young and
predominantly non-Anglo. For the region’s long-term success, it is imperative to provide an
effective and rigorous education to all our students, particularly to those who are poor.
The public school systems in the Houston region are struggling with these challenges. In
a recent report from Johns Hopkins University (Balfanz & Legters, 2004), Texas ranks 9th among
states with schools considered to be “dropout factories” – defined as schools where fewer than
60 percent of freshmen make it to their senior year. Nationally, these schools are either in large
cities or in high-poverty rural areas. Locally, these schools are found in many of our urban
districts – in Alief, Aldine, Spring Branch and North Forest. In Houston ISD, 20 of the 24
48

comprehensive high schools have earned this dubious title. In every case, students served in
these schools are predominantly high-poverty and minority (Zuckerbrod, 2009).
At the same time that schools and principals are addressing the needs of at-risk students,
they also must increase the rigor of the traditional curriculum and the level of student
achievement to meet the changing needs of the 21st century workplace. Student preparation for
success in post-secondary education and careers is central to the long-term health of our
economy and society. Even students who do make it to their senior year and graduate from high
school may continue to struggle. According to The American Diploma Project, only 47 percent
of high school juniors had scores that would be considered “college ready” on 2005 standardized
tests (American Diploma Project Network, 2007). Some reports suggest that as many as 50
percent of college freshmen require remedial work in English and math before they can handle
college-level courses (Texas Higher Education Coordinating Board, 2007). The economic
impact, both for individuals and for society are huge, as the difference in average earning by
educational attainment level has expanded significantly (Public Agenda, 2007).
The Role of Principal as the Difference Maker
There is one strategic leverage point that maximizes student success: strong principals
who develop instruction-focused leadership teams and who remain at schools long enough for
improvements to take hold. What’s more, research reveals that highly effective principals: 1)
understand how to improve instruction because they have deep experience with good curriculum
and good teaching, and 2) think systemically and plan and implement strategically because they
are efficient, knowledgeable and insightful managers of people.
A large body of national research supports these findings, and today’s most respected
thinkers in school improvement – including Michael Fullan, Tony Wagner and Linda Darling-
49
Hammond – agree that the job of the principal requires a major shift in the way we attract and
develop them. While the demands of building management remain, the most important role for
principals today and tomorrow are those of instructional leader and change agent. Research has
shown that principals who function as instructional leaders and managers of change improve
student academic achievement significantly more than traditional administrative leaders with
similar student populations (Institution for Educational Leadership, 2000).
The challenge facing the Houston region – and urban centers across the nation – is to
attract a larger pool of qualified principal candidates and to develop their abilities as future
principals. The need is urgent; evidence shows that school leadership is second only to
classroom instruction when it comes to improving student achievement (Leithwood K., et al,
2004).
In a 2011 article entitled, Using Competencies to Improve School Turnaround Principal
Success, authors Steiner and Hassel state:
The U.S. desperately needs a strong cadre of school leaders who can turn around
persistently low-performing schools. But today, this cadre is far too small. States and
districts that are serious about eliminating broad scale failure in schools must use the very
best tools available to select, evaluate, and develop these school turnaround leaders.
Current practices — inconsistent hiring, uneven support, and weak evaluation — are
severely inadequate. Competency-based people-management, coupled with the right
district environment, can significantly increase the number and performance of school
turnaround leaders (p.11).
50
Principal Leadership Development: A Call to Action
A recent four-year study by Arthur Levine (2005), president of Teachers College
Columbia University, raised the stakes in the debate around school reform by harshly assessing
the quality of educational administration programs. In this study, Levine points out that, “The job
of school leader has been transformed by extraordinary economic, demographic, technological,
and global changes” (p. 11). He further espoused:
In a rapidly changing environment, principals and superintendents no longer serve
primarily as supervisors. They are being called on to lead in the redesign of their schools
and school systems. In an outcome-based and accountability-driven era, administrators
have to lead their schools in the rethinking of goals, priorities, finances, staffing,
curriculum, pedagogies, learning resources, assessment methods, technology, and use of
time and space. They have to recruit and retain top staff members and educate
newcomers and veterans alike to understand and become comfortable with an education
system undergoing dramatic and continuing change. (p. 12)
Levine’s research (2005, p. 22) around university-based school leadership programs reveals that
most programs across the U.S. mainly educate three types of students—current and future school
administrators, teachers earning a degree primarily for salary enhancement, and future
researchers in school leadership. This study also exposed many alarming facts about the overall
quality of university based or traditional educational leadership preparation programs across the
country. Levine found the overall quality of educational administration programs in the U. S. to
be poor, ranging from inadequate to appalling even at some of the country’s leading universities.
Collectively he found school leadership programs to be unsuccessful, and the study revealed
seven clear indicators of a troubled educational leadership preparation model in the U.S:
51
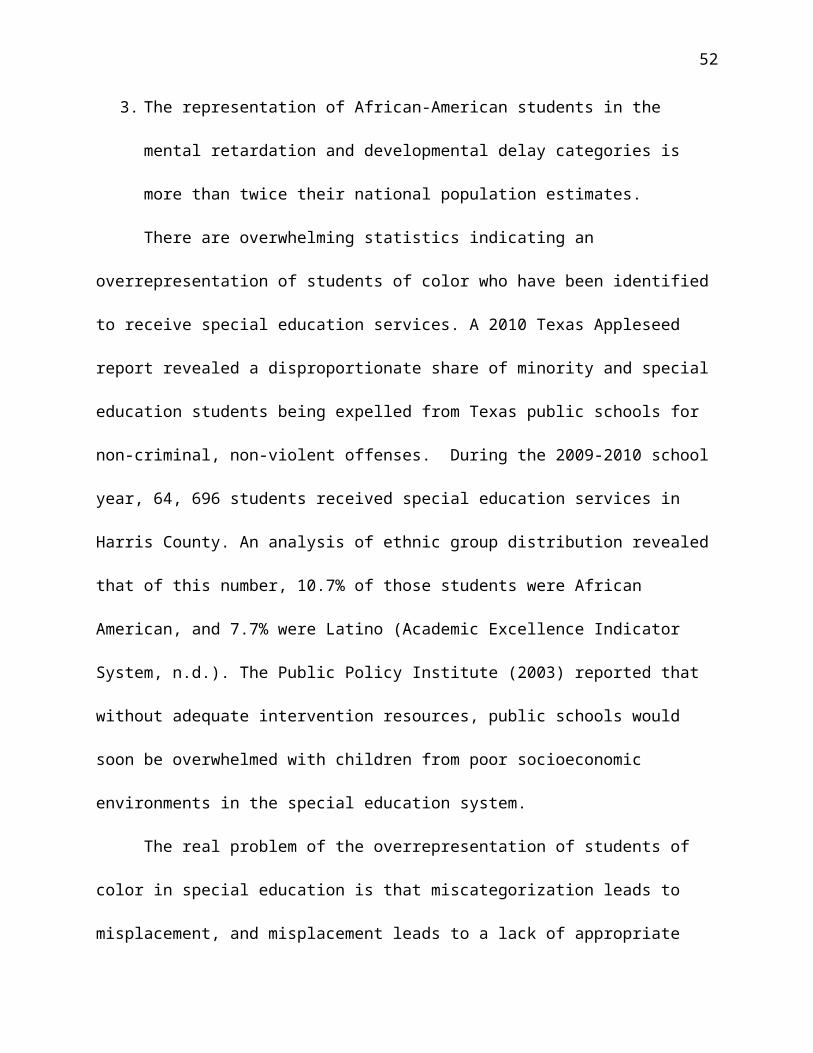
1. Their curricula are disconnected from the needs of leaders and their schools.
2. Their admission standards are among the lowest in American graduate schools.
3. Their professoriate is ill equipped to educate school leaders.
4. Their programs pay insufficient attention to clinical education and mentorship by
successful practitioners.
5. The degrees they award are inappropriate to the needs of today’s schools and school
leaders. Their research is detached from practice.
6. Their programs receive insufficient resources. (p. 24)
The study also found that most curriculum associated with university-based principal
preparation programs have an irrelevant curriculum. The typical course of study for the
principalship was found to have little to do with the job of being a principal. In fact, it appeared
to be a nearly random collection of courses. The study included a Principal Survey which
revealed that principals were very critical of education school programs in general with almost
nine out of 10 survey respondents (89 percent) saying, “That schools of education fail to
adequately prepare their graduates to cope with classroom realities” (Levine, 2005, p. 29).
University-Based Principal Preparation: A Broken System
University-based master’s degree programs typically consist of approximately 36 credit-
hours or 12 semester courses. These courses are primarily dominated by theory and research, but
have little focus on implementation of the theory and application in a school environment.
Moreover, these programs pay minimal attention to curriculum and instruction, and
predominantly focus on theory as opposed to the application of said theory (Southern Regional
Educational Board, 2003).
52

In The Principal Internship: How Can We Get It Right? (SREB, 2004, p. 18), these
findings were reported from a survey of educational leadership department heads’ perceptions of
their internship programs:
1. More than two-thirds of the department heads indicated that their universities had
not established strong working relationships with local school districts that would
support joint ownership of principal preparation and well-structured, well-
supervised internships.
2. Only one-third of surveyed programs placed interns in situations where they could
gain a comprehensive understanding of how to lead changes in school and
classroom practices that make higher student achievement possible.
3. Overall, less than half of surveyed programs provide interns a developmental
continuum of practice that begins with observing, then participating and then
taking the lead in the essential elements of school improvement.
4. Many aspiring principals are under-supported during their internships.
5. The number of interns assigned to a faculty supervisor ranged from three to 35
among programs surveyed.
6. More than half of the department heads rated their evaluations of interns’
performance as having either an average or a small degree of rigor, as opposed to
a great degree.
Currently, all systems of principal preparation are governed by each state. These systems
are often complex and interrelated establishing licensing, certification, re-certification,
continuing education credits, and alternative certification options. While the job of the principal
has evolved over the years with the changes in the education system and the introduction of
53

accountability structures, principal preparation has remained stagnant. As stated in the 2003
article entitled, Preparing School Principals: National Perspective on Policy and Program
Innovations:
The intense pressure for principals to be instructional leaders who can more effectively
implement standards-based reform has given unprecedented prominence and political
visibility to the problems of preparing school principals. (p. 7)
A growing body of literature on effective school principals often describes the skills, traits,
responsibilities, and behaviors one must possess to make an impact at the school level. Although
similarities exist in the research, there is little agreement on specific descriptors of effective
principals. Leithwood and Riehl (2003) narrowed the focus by providing a comprehensive
review of the knowledge and skills that principals need to have to be successful, based upon
quantitative and qualitative research studies. As a result of their research, six claims around
school leadership can be generalized:
1. Successful school leadership makes important contributions to the improvement of
student learning.
2. The primary sources of successful leadership in schools are principals and teachers.
3. In addition to principals and teachers, leadership is, and ought to be distributed to others
in the school and school community.
4. A core set of ‘basic’ leadership practices is valuable in almost all contexts: setting
directions; developing people; redesigning the organization.
5. In addition to engaging in a core set of leadership practices, successful leaders must act in
ways that acknowledge accountability.
54

6. Successful leaders in schools serving highly diverse student populations enact practices
to promote school quality, equity and social justice through building powerful forms of
teaching and learning, creating strong communities in schools, nurturing the development
of educational cultures in families, and expanding the amount of students’ social capital
valued by the schools.
A 2002 study entitled, Learning to Lead: What Gets Taught in Principal Preparation Programs,
Hess and Kelly espoused:
Almost no current research systematically documents the content studied in the nation’s
principal preparation programs, the instructional focus, or the readings assigned to
students. The field of educational leadership has suffered from a dearth of systematic
scholarly inquiry. The evidence indicates that principal preparation has not kept pace
with changes in the larger world of schooling, leaving graduates of principal preparation
programs ill-equipped for the challenge and opportunities posed by and era of
accountability (pp. 5, 9, and 35).
Principal Preparation: An Alternative Viewpoint
Not everyone believes that our national system of principal preparation is in crisis. In a
2004 article entitled, The Good News about the Preparation of School Leaders: A Professor’s
Viewpoint, professor John Hoyle rebuts the Levine study, as well as, much of the research about
the ineffectiveness of principal preparation programs across this country. In his article he asserts:
Based on indicators of academic achievement, such as entrance examinations, grade point
averages, and ethnic and gender diversity, the talent pool of graduate students in
educational administration improves each decade. Attacks on school administrator
55

preparation programs and professors has been an art form for some within the profession
and for others standing outside peering in. (p. 1)
Hoyle counters each of the claims made by leading researchers on the topic of principal
preparation, based on what he terms as “methodological flaws” in the Levine study, and an
absence of measurable findings in other associated studies. In his view, it is difficult to stand on
the sidelines to measure the impact of university-based programs without being a part of the
many successes universities experience in preparing leaders of tomorrow.
Redesigning Principal Preparation
According to a 2000 study entitled, The New Look in Principal Preparation Programs,
disappointment in traditional and theory-based preparation programs, coupled with the public
demand for increased expertise in the principalship, has produced a wave of new and redesigned
principal preparation programs. The study found that atypical principal preparation programs
incorporate the following components: entrance requirements aligned with the demands of the
principalship, are built around a cohort model, clear performance-based standards, opportunities
for individualization for each aspiring principal, an assessment of skills, emphasis of reflective
practice, and continuous program review with input from practitioners.
Petzko (2004) asserted:
The capacity to improve schools depends on the quality and effectiveness of the leaders
in each school. The national outcry for school improvement, the anticipated retirement
rate of current principals, and the increased accountability of the position demand that
comprehensive professional support systems be designed and implemented for all stages
of the principalship. (p.21)
56

A 2010 Rainwater Leadership Alliance study of atypical principal preparation programs
across the country revealed similar design elements:
1. Clear set of skills, knowledge, and dispositions that a principal must have in order to
drive high levels of student achievement for all children.
2. Rely on strategic, proactive, and targeted recruiting strategies to ensure that they have
strong candidate pools and pipeline programs from which they can select candidates
most likely to thrive in their programs and grow into effective principals.
3. Are highly selective and establish clear criteria and rigorous processes to evaluate
applicants’ disposition, skills and knowledge. Candidates are required to demonstrate
their skills through experiential events to evaluate whether candidates’ behaviors and
actions match their stated beliefs.
4. Believe that training and development need to be experience, giving trainees authentic
opportunities to lead, make mistakes, and grow. This includes the coordination of
coursework, school-based residencies, on-going assessment, coaching and feedback.
5. On-going support for new leaders to help them grow on the job is essential to drive
school-wide improvements that lead to improved student achievement results.
6. A continual use of data to assess the effectiveness of their programs and the quality of
the work of the principal on the school campus.
Over the last decade, these atypical principal preparation programs have surged into the
forefront, questioning the basis and merit of university-based programs. Subsequently, many
university-based programs have begun to reassess the merits of their principal preparation
programs. In an article entitled Schools Can’t Wait: Accelerating the Redesign of University
Principal Preparation Programs (SREB, 2006, p. 18), findings were reported from a study of the
57
progress made by 22 pacesetter universities in redesigning their programs to emphasize
instructional leadership and student achievement reveal the sense of urgency around the
importance of a new way of training principals:
1. About one-third (seven of 22) of the universities had made substantial progress in
developing a strong working relationship with local school districts.
2. Half (11 of 22) of the universities had made some progress in redesigning principal
preparation to emphasize knowledge and skills for improving schools and raising
student achievement.
3. Only four of 22 universities had made substantial progress in developing programs
with well-planned and well-supported internships; 14 had made some progress and
four had made no progress.
4. Only one university had made some progress in incorporating rigorous evaluations of
participants’ mastery of essential competencies; 21 of 22 had made no progress.
An Evolving Paradigm of Principal Preparation
The gravitation by states and districts toward this evolving paradigm of school leadership is a
major accomplishment (Wallace Foundation, 2008). According to the Wallace Foundation:
1. Forty-six states have adopted leadership standards and many have begun applying them
to evaluate leadership training programs and school leaders and to hold them more
accountable. Missouri, for example, has identified essential leadership behaviors and has
been working to implement them at every phase of leadership development –including
redesigning all 17 university preparation programs for leaders in that state as well as its
newly-enacted statewide principal mentoring program (Wallace Foundation, 2008).
58

2. Many states are pressing universities to redesign their leadership preparation programs by
applying new accreditation guidelines and more rigorous standards and are also taking
steps to spread effective training practices statewide. Georgia, for example, has adopted
new university reaccreditation processes that required all university programs to sunset
and reapply for accreditation in 2008. In Illinois, Chicago and Springfield have developed
exemplary principal training programs and a statewide consortium of districts is working
to spread those effective practices. The University of Delaware has approved a
dramatically redesigned principal preparation program that will serve as a model for other
higher education institutions in the state (Wallace Foundation, 2008).
3. Leadership academies are springing up in a growing number of states including Iowa,
Georgia and Louisiana, and in large districts including New York City, Chicago, Boston
and St. Louis. The aim is to provide high-quality alternatives that are responsive to
district leadership needs and some competition to university-based leadership preparation
programs. The NYC Leadership Academy, launched in 2003, has been a model for such
institutions and has provided exemplary pre-service training to some 300 aspiring
principals and mentoring to about 1,000 New York City school leaders using a highly-
acclaimed “blended coaching” model. A statewide academy in Arkansas has developed
criteria and measurement tools for evaluating the progress and performance of veteran
principals who participate in its Master Principal Program (Wallace Foundation, 2008).
4. Since 2000, about half the nation’s states have adopted mentoring requirements for
newly-seated principals for the first time. This fast-spreading phenomenon marks a major
shift from the “sink-or-swim” attitude that had long predominated toward fledgling
59

principals and is also a sign of increased recognition that leadership preparation should
not end abruptly with licensure and hiring (Wallace Foundation, 2008).
There is ample research to support the need to reconfigure and redesign principal preparation,
and that existing leadership preparation programs are in dire need of improvement (Hale &
Moorman, 2003). The Southern Regional Education Board 2004 research study
on mentoring for principals-in-training suggests that unless universities and
local school districts make substantial changes, new school leaders will
continue to reap limited benefits from their internship experiences. These
changes include (a) rethinking and restructuring the way mentors are
selected and trained, (b) the responsibilities they assume, and the roles they
play in evaluating and documenting the competency of aspiring principals
and (c) greater investments of resources — time, money and people —on the
part of states, universities and districts if schools are to have the benefit of
higher-quality leadership that results in improved teaching and learning.
Leadership Treatment: Principal Preparation through Traditional and Atypical Methods
The signs that the states have pulled back from their historic alliance with university-
based educational administration programs are unmistakable. In 2003, half of the states had no
education school requirements for becoming a superintendent, had alternative pathways to
certification, or had a policy of exceptions, allowing candidates without education school
preparation to become superintendents.
More than a third of the states had comparable procedures for principals and more states
are talking about moving in this direction (Levine, 2005 as cited in Certification of Principals
and Superintendents in the U.S (2003). At the same time, a growing number of competitors are
60

springing up to lay claim to the historic franchise of education schools in preparing school
administrators. States are establishing their own school leadership programs (Levine, 2005).
According to Hale & Moorman (2003):
Currently, universities and colleges prepare the bulk of principal, but the times are
changing. Reflecting a trend in all of graduate education, not just in the field of
educational leadership, non traditional providers have emerged to meet the new demands.
These new providers are offering principal preparation and professional development
programs through new models and using delivery mechanisms that many think are more
appropriate to the needs of the principals in the 21st century. (pp.15-16)
There are many atypical leadership preparation programs including Chicago Public Schools,
New York Leadership Academy, KIPP Leadership Academy, New Leaders for New Schools,
and those in non-profits across the country such as The Houston A+ Regional Principal
Leadership Academy in Houston, Texas. Levine (2005) reveals that:
A few things stand out about the ways these new providers are educating school
administrators. First, they tend to give more emphasis to on-the-job preparation than
university-based programs do, and they seem to favor mentoring over book learning.
Their formal curricula seem to be more pragmatic, geared to the specific knowledge and
skills required by school principals and superintendents at different career stages. They
appear to be as concerned with supporting practicing administrators as they are with
preparing them for the job. And they seem largely to distrust education school faculty.
Most of these programs have chosen to avoid or minimize involvement with education
schools and to limit the use of education school professors as program instructors.
(pp. 51-52)
61

Essentially, the Levine study (2005) describes what we have today as parallel approaches to
educating school leaders. On one hand, we have traditional university programs that are
classroom-based. They rely primarily on courses of uniform length; utilize a faculty composed
largely of education school professors, supplemented practitioners; and provide instruction in the
field of education. In contrast, the new competitors offer programs that are variable in length; are
primarily experiential; occur largely in schools; are taught primarily by practitioners,
supplemented by business school professors; and focus on management. In many respects, the
new providers have become the ying to the education school’s yang. Neither approach is
complete. The poignant anecdote remains the most often presented “evidence” of success (p. 52).
A Grand Experiment in Leadership: A National Model of Principal Empowerment
Despite altering viewpoints about the success or failure of principal preparation
methodologies, cities and states are beginning to make changes to their empowerment of sitting
principals across the country, thus bringing to the forefront, changes in the way in which
principals must lead to impact today’s schools.
In 2006, New York City Chancellor Joel Klein implemented a reorganization of 331
schools including 10 charters, which became known as empowerment schools. According to a
2008 report entitled, “School Governance and Accountability: Outcomes of Mayoral Control in
New York City, the development of Empowerment Schools would allow leadership to be driven
specifically by the principal as opposed to regional or district superintendents. These
Empowerment Principals were given the power to lead and operate with one hundred percent
autonomy. In this model, principals became responsible for most of the school functions
including training of staff, designing special education programs, and offering sex and health
education programs. In exchange for assuming the additional responsibility the principals
62

received approximately one hundred fifty thousand dollars in their budgets each year. Principals
had to form “networks” of twenty schools and hire their own “network teams” to provide
services that were offered by the regional offices that once supported them (Fruchter &
McAlister, 2008).
The Empowerment Schools represented a wide array of schools including the highest
performing schools to the lowest. The Empowerment Schools initiative was a disruptive
innovation in its purest form, outside of any previous efforts to decentralize the school system,
because power is granted directly to schools rather than districts or school boards. In
Empowerment Schools, principals were truly held accountable for student performance because
they have direct command over key educational decisions and resources (Fruchter & McAlister,
2008). According to Klein, the rationale for this reform effort was to move schools to the
dynamism needed for long-term change. Klein stressed, “Empowerment" essentially means
giving principals more control over decision-making, including finances, personnel, and
instruction, and accountability by tying rewards and sanctions to school-wide test results and
other measures of student achievement”.
Theoretical Framework
The body of research in educational administration cannot answer questions as basic as
whether school leadership programs have any impact on student achievement in the schools that
graduates of these programs lead. There is an absence of research on what value these programs
add, what aspects of the curriculum or educational experience make a difference, and what
elements are unnecessary or minimally useful in enhancing children’s growth and educational
attainment, K-12 teacher development and effectiveness, and overall K-12 school functioning
(Levine, 2005).
63
The theoretical foundation for this study is largely based on the need for a new model of
leadership which will accommodate the ever changing complexion leadership for today’s most
challenging schools. This study is framed through the lens of leadership. As a result of an
expansive literature review, five main components surfaced as recurring themes among current
trends in leadership. These components consist of: a) increased accountability; b) need for
effective leadership; c) organizational effectiveness; d) leader as a change agent; and e)
development of school culture. This study will be primarily driven by Transformational
Leadership Theory to support the notion of school reform through the actions of the principal as
school leader.
Transformational leadership is a type of leadership style that leads to positive changes in
those who follow. Transformational leaders are generally energetic, enthusiastic and passionate.
Not only are these leaders concerned and involved in the process; they are also focused on
helping every member of the group succeed as well (Cherry, 2010).
The History of Transformational Leadership
The concept of transformational leadership was initially introduced by leadership expert
and presidential biographer James MacGregor Burns. According to Burns, “Transformational
leadership can be defined as a process by which leaders and followers make each other to
advance to a higher level of moral and motivation. Through the strength of their vision and
personality, transformational leaders are able to inspire followers to change expectations,
perceptions and motivations to work towards common goals” (as cited in Cherry, 2010). Later,
researcher Bernard M. Bass expanded upon Burns original ideas to develop what is today
referred to as Bass’ Transformational Leadership Theory. According to Bass, transformational
64

leadership can be defined based on the impact that it has on followers. Transformational leaders,
Bass suggested, garner trust, respect and admiration from their followers (Cherry, 2010).
Components of Transformational Leadership
Based on the work of Bernard Bass, Cherry (2010) suggests four different components of
transformational leadership:
1. Intellectual Stimulation – Transformational leaders not only challenge the status quo;
they also encourage creativity among followers. The leader encourages followers to
explore new ways of doing things and new opportunities to learn.
2. Individualized Consideration – Transformational leadership also involves offering
support and encouragement to individual followers. In order to foster supportive
relationships, transformational leaders keep lines of communication open so that
followers feel free to share ideas and so that leaders can offer direct recognition of each
follower’s unique contributions.
3. Inspirational Motivation – Transformational leaders have a clear vision that they are able
to articulate to followers. These leaders are also able to help followers experience the
same passion and motivation to fulfill these goals.
4. Idealized Influence – The transformational leader serves as a role model for followers.
Because followers trust and respect the leader, they emulate the leader and internalize his
or her ideals.
Martin Luther King, Jr. once said:
“The ultimate measure of a man is not where he stands in moments of comfort, but where
he stands at times of challenge and controversy. Courage faces fear and thereby masters
65

it; cowardice represses fear and is thereby mastered by it. We must constantly build dikes
of courage to hold back the flood of fear.”
The more complex society gets, the more sophisticated leadership must become. Complexity
means change, but specifically it means rapidly occurring, unpredictable, nonlinear change
(Fullan, 2001, p. v).
In an era where leadership in today’s schools is even more pressing, the preparation of the
leader is vital to his/her ability to impact school reform. The purpose of this study is to expose an
intensive principal leadership training model and its probable benefit to the Houston region of
schools. A recent report from the Wallace Foundation (2006) states it plainly:
Behind excellent teaching and excellent schools is excellent leadership – the kind that
ensures that effective teaching practices don’t remain isolated and unshared in single
classrooms, and ineffective ones don’t go unnoticed and unremedied. Indeed, with our
national commitment to make every single child a successful learner, the importance of
having such a high-quality leader in every school is greater than ever. (p. 2)
Educational change is one of the most complex and perplexing forces that continues to
challenge school communities and the leaders that must consistently manage these institutions of
learning. Although change is inevitable, educators face challenges and dilemmas that can
sometimes prevent them from growing professionally. In their major study of teacher education,
Fullan and his colleagues found themselves being pushed deeper to the moral purposes of
education in order to understand the basic rationale for teaching in post-modern society (Fullan
p. 8). Fullan goes on to discuss four moral imperatives that are essential to facilitate educational
change including: a) facilitating critical enculturation, b) providing access to knowledge, c)
building an effective teacher-student connection and d) practicing good stewardship.
66

While it seems strikingly apparent that there is a massive amount of research on what
principals need to know and be able to do to change the trajectory of an underperforming school,
not-surprisingly, the preparation models for principal preparation are not up to par. The
challenge facing the Houston region – and urban centers across the nation – is to attract a larger
pool of qualified principal candidates and to develop their abilities as future principals. This
research study seeks to compare the impact atypical principal preparation has on student
achievement outcomes in high-poverty schools versus the same impact for principals trained
through traditional mechanisms (i.e. university and alternative certification programs).
67

CHAPTER III
METHODOLOGY
The purpose of this study was to investigate the differences between atypical and
traditional principal preparation programs and how principal training impacts student
achievement outcomes and school accountability ratings in the greater Houston area high-
poverty schools. This quantitative research study sought to examine new models of principal
preparation (atypical principal preparation models) as recommended in the Levine Report
(2005), and compare those recommendations with more traditional forms of principal
preparation. This causal-comparative study included an analysis of school accountability ratings
and student achievement results at a select group of high-poverty schools in the greater Houston
region. This study compared the performance of a comparison group, traditional principal
preparation methods and atypical principal preparation methods.
Research Questions
Research and information gained from a synthesis of related literature helped to formulate
research questions to guide this study. The researcher attempted to find answers to the following
research questions:
1. Are there differences in school accountability ratings in high-poverty schools where
principal training and preparation differ?
2. Are there differences in student achievement outcomes in high-poverty schools where
principal training and preparation differ?
68

Research Hypotheses
The researcher predicted the following outcomes from conducting the study:
(H1): As measured by the AEIS Report, principals who participate in atypical principal
preparation programs will impact school accountability ratings in high-poverty schools in the
greater Houston area compared to principals who participated in traditional routes of principal
preparation.
(H2): As measured by the AEIS Report, principals who participate in atypical principal
preparation programs will impact student achievement outcomes in high-poverty schools
principals who in the Greater Houston area compared to participated in traditional routes of
principal preparation.
Null Hypothesis
In order to answer the research questions and test the research hypotheses, the researcher
developed the following null hypotheses:
(H01): There will be no statistically significant difference in school accountability ratings of high-
poverty schools in the greater Houston are having principals who went through atypical principal
preparation and those high-poverty schools with principals receiving atypical principal
preparation.
(H02): There will be no statistically significant difference in student achievement outcomes of
high-poverty schools in the greater Houston are having principals who went through atypical
principal preparation and those high-poverty schools with principals receiving traditional
principal preparation.
69

Research Design
A quantitative causal-comparative design was used to determine the cause for or the
consequences of differences between participants in the study. The basic causal-comparative
design involved selecting two or more groups that differ on a particular variable of interest and
comparing them on another variable ((Fraenkel & Wallen, 2009). The value of using this type of
design was the ability for the researcher to identify possible causes of observed variations in
behavior patterns (Fraenkel & Wallen, 2009). Utilizing this methodology, the researcher was
able to investigate the effects of the independent variable after it had been implemented or had
already occurred. The researcher collected and analyzed quantitative (numeric) data for the
study. The rationale for selecting this approach was that the quantitative data and results
provided a picture of the research problem, (i.e. what internal and external factors contribute to
and/or impede principal performance in leading high-poverty schools against measurable
outcomes). According to Fraenkel and Wallen (2009):
Quantitative data are obtained when the variable being studied is measured along a scale
that indicates how much of the variable is present. Quantitative data are reported in terms
of scores. Higher scores indicate that more of the variable is present than do lower scores
(p. 186).
Independent and Dependent Variables
Within this quantitative casual-comparative research design, the independent variable (X)
for both research questions was the type of principal preparation program participants engaged
in. The independent variable had two levels:
X1= atypical principal preparation
X2= traditional principal preparation
70

The research study also included two dependent variables. The dependent variable for the
first research question was the impact on school accountability ratings (Exemplary, Recognized,
Acceptable, and Unacceptable) of high-poverty schools in greater Houston area school districts
as measured by AEIS reports. The dependent variable for the second research question was
student achievement results of high-poverty schools in greater Houston area school districts as
measured by the Texas Assessment of Knowledge and Skills (TAKS) mathematics and reading
scores.
Subjects of the Study (Population and Sample)
The target population for this study was all elementary, middle and high school principals
in five targeted schools districts in the Greater Houston area. The districts included: Houston
ISD, Aldine ISD, Alief ISD, Cy-Fair ISD, and Humble ISD. The selected districts were all
located in Harris County, had at least 30,000 students, and at least 30% of its students classified
as economically disadvantaged. Each of the selected districts also had more than 50% of the
student population classified as minority (Diane Moser Properties Houston Area School District
Profiles, 2009). A review of Houston area district profiles reflected the following district
enrollments: (1) Aldine ISD- 62,792 students, (2) Alief ISD-45,553 students, (3) Cy-Fair ISD-
104,231 students, (4) Houston ISD-202,773 students, and (5) Humble ISD-34, 923 students.
Sampling Procedures
For this study the researcher employed a two-fold sampling strategy: criterion sampling
and the snowballing sampling technique. A sample size of 100 principals was selected for the
study. The sample population consisted of 20 principals selected from each of the five targeted
districts. Within this sample, a combination of 10 atypically trained and 10 traditionally trained
71
principals was included for each district represented in the study. The sample included 50
atypically trained and 50 traditionally trained principals.
Criterion sampling involves selecting cases that meet some predetermined criterion of
importance. Using this technique, the researcher identified criteria and picked all cases that met a
pre-determined set of characteristics. Principals included in the study met the following criterion
to be selected as part of the study: (1) participants were active principals of K-12 schools (2)
participants must have been employed in one of the five targeted districts, (3) participants had to
have been in the role of principal at the selected school for two full academic years beginning in
2008-2009 and ending in 2009-2010, (4) participants must have led a school that participated in
the Texas Education Agency state assessment system, (5) participants must have been principal
of a school identified as having 35% or higher free and reduced lunch, and (6) participants must
have had at least 3-10 years of principal experience. This method of sampling is very strong in
quality assurance and can be useful for identifying and understanding cases that are information
rich. Criterion sampling can also provide an important qualitative component to quantitative
data.
The researcher also utilized a snowball sampling technique within the study. Snowball
sampling is a method used to obtain research and knowledge, from extended associations or
through previous acquaintances. Snowball sampling uses recommendations to find people with
the specific range of skills that has been determined as being useful. Within this sampling
process, an individual or a group receives information from different places through a mutual
intermediary. Snowball sampling is a useful tool for building networks and increasing the
number of participants.
72
Within the study, the researcher utilized this technique to locate people meeting specific
criteria that the researcher would not have been able to identify. The advantage of this technique
was the ability for the researcher to use those in the field with knowledge of others who meet the
criteria identified for participation in the study. This technique also ensured that the sampling
group was consistent.
Instrumentation
The process of collecting data is known as instrumentation (Fraenkel and Wallen, 2009).
The initial data collection process for this research study included the use of a demographic
survey to collect and identify the sample population based on pre-identified criteria. As outlined
in the sampling procedures, principals included in the study had to meet the following criteria to
be selected as part of the study: (1) participants were active principals of K-12 schools, (2)
participants must have been employed in one of the five targeted districts, (3) participants had to
have been in the role of principal at the selected school two academic school years, (4)
participants must have been the leader of a school that participated in the Texas Education
Agencies state assessment system, (5) participants must have been principal of a school
identified as having 35% or higher free and reduced lunch, and (6) participants must have had at
least 3-10 years of principal experience.
The School Leadership Demographic Survey [see Appendix A] was utilized as a tool to
dissect the target population and narrow the sample based on identified criteria. The survey was
comprised of nine sections: school name, grade level, economically disadvantaged percentage,
years of experience as a building principal, total years as principal of the current school, total
years of administrative experience, ethnicity, gender, and type of principal training.
73

The statistical analysis portion of the study relied solely on quantitative instruments. The
instrumentation included Texas Assessment of Knowledge and Skills (TAKS) data from the
2008-2009 and 2009-2010 school years gathered from the Academic Excellence Indicator
System (AEIS) report published by the Texas Education Agency (TEA) each year. According to
the Texas Education Agency website (2011), the Academic Excellence Indicator System (AEIS)
pulls together a wide range of information on the performance of students in each school and
district in Texas every year.
The performance indicators included in the report were: (1) Results of Texas Assessment
of Knowledge and Skills (TAKS); by grade, by subject, and by all grades tested, (2) Participation
in the TAKS tests, (3) Exit-level TAKS Cumulative Passing Rates, (4) Progress of Prior Year
TAKS Failers, (5) Results of the Student Success Initiative, (6) English Language Learners
Progress Measure, (7) Attendance Rates, (8) Annual Dropout Rates (grades 7-8, grades 7-12, and
grades 9-12), (9) Completion Rates (4-year longitudinal), and (10) College Readiness Indicators.
The Texas Assessment of Knowledge and Skills (TAKS) test is the primary state
assessment for students in Texas. The researcher used the Academic Excellence Indicator
System (AEIS) report to ascertain school accountability ratings and student achievement results
on the Texas Assessment of Knowledge and Skills (TAKS) Mathematics and Reading
assessments during the 2008-2009 and 2009-2010 school years. The researcher also reviewed the
school accountability ratings (Exemplary, Recognized, Acceptable and Unacceptable) bestowed
upon the school for overall performance during the 2008-2009 and 2009-2010 school years, also
accessible through the Academic Excellence Indicator System (AEIS) report.
For the purposes of this study, the researcher utilized the Academic Excellence Indicator
System (AEIS) report to access school accountability ratings and mathematics and reading scores
74

from the selected schools to assess the impact of types of principal training on these dependent
variables.
Validity and Reliability
For the purposes of this study, the researcher elected to use two instruments that have both
validity and reliability. The quantitative instrument or Academic Excellence Indicator System
(AEIS) report is an instrument generated by the Texas Education Agency (TEA) that documents
school performance on the Texas Assessment of Knowledge and Skills (TAKS) assessment each
year. The Texas Education Agency (TEA) conducts internal tests for validity and reliability each
year prior to releasing the reports for review by the general public.
Test validity as it applies to the use of instruments refers to the “appropriateness,
meaningfulness, and usefulness of the inferences researchers make based on the data they
collect” as explained by Fraenkel and Wallen (2003, p.463). Careful attention was taken to
ensure that the items that make up the Texas Assessment of Knowledge and Skills (TAKS) are
fair and representative of the content domain as provided by the required curriculum and
expressed in the measurement specifications and objectives and every effort has been made to
eliminate items that may have ethnic or cultural biases (Texas Education Agency, 2005).
The validity of the Texas Assessment of Knowledge and Skills (TAKS) has been developed
by the content it assesses; therefore, it is content based and tied directly to the statewide
curriculum. Content validity describes whether the test objectives sufficiently represent what
students should be able to do and whether the items, which are based on test objectives, calculate
intended responses; whereas, construct validity is the extent to which a test can be said to
measure a theoretical construct or trait (Texas Education Agency, 2005).
75
Frankel and Wallen (2003) reveal that “test reliability refers to the consistency of
inferences researchers make based on the data collected over time, location, and circumstances
(p.463). Test reliability on the Texas Assessment of Knowledge and Skills (TAKS) indicates that
the measurement was established by internal consistency measures and by standard error of
measurement calculations. The Kuder-Richardson Formula 20 (KR-20) is the measure by which
internal consistency is measured. The Kuder- Richardson Formula 20 is a mathematical
expression of the classical measurement definition of reliability that posits that as error variance
is reduced, reliability increases. Standard measurement is calculated using both the standard
deviation and the reliability of test scores and represents the amount of variance in a score
resulting from factors other than achievement. The standard error of measurement is based on the
premise that underlying traits such as academic achievement cannot be measured exactly without
a perfectly precise measuring instrument (Texas Education Agency, 2005).
Procedures
The target population for this study was all elementary, middle and high school principals
in five targeted schools districts in the greater Houston area. The districts included: Houston ISD,
Aldine ISD, Alief ISD, Cy-Fair ISD, and Humble ISD. From the targeted districts, a sample size
of 100 principals was selected for the study. The researcher mailed a copy of the School
Leadership Demographic survey [see Appendix A], a Letter of Research Intent detailing the
purpose of the research study [see Appendix B], and a self-addressed stamped envelope for
return to the researcher. All returned surveys were kept in a locked box to ensure confidentiality.
After one month, the researcher telephoned or visited campuses where surveys had not been
returned. During the survey process, the snowballing sampling technique was utilized as the
76

researcher sought consult from principals who may have known other principals who would have
met the criteria established for the study.
At the conclusion of the survey intake process, the researcher used a criterion sampling
technique to identify criteria and select principals meeting the following criterion: : (1)
participants were active principals of K-12 schools (2) participants must have been employed in
one of the five targeted districts, (3) participants must have been in the role of principal at the
selected school for two academic years, (4) participants must have been the leader of a school
that participated in the Texas Education Agency state assessment system, and (5) participants
must have been principal of a school identified as having 35% or higher free and reduced lunch,
and (6) participants must have had at least 3-10 years of principal experience.
Throughout the survey intake process, the researcher imported data into an Excel
spreadsheet to track the demographic information provided. Each school was randomly assigned
a number documented on both the spreadsheet as well as the actual survey. This aided the
researcher in protecting the identity of the principal, as well as provided a way in which the
researcher could track each school. A coding system of E (elementary), M (middle), H (high)
was added to the spreadsheet to classify schools included on the spreadsheet. While this is not a
variable being measured in the study, the researcher sought to share school classifications as part
of the descriptive statistics for the study.
The purpose of the research study was to determine the impact of principal training on
school accountability ratings and student achievement in mathematics and reading; therefore the
researcher assigned a (T) to all traditionally trained principals and an (A) to atypically trained
principals.
77

Once all demographic data had been compiled, the researcher began to compile and
analyze the quantitative data for the study. The statistical analysis portion of the study relied
solely on quantitative instruments. The instrumentation included Texas Assessment of
Knowledge and Skills (TAKS) data from the 2008-2009 and 2009-2010 school years gathered
from the Academic Excellence Indicator System (AEIS) report published by the Texas Education
Agency (TEA) each year.
Data Collection
The study was a dominantly quantitative design. The quantitative methodology was
utilized to answer the initial research question about the differences in school accountability
ratings and student achievement outcomes in high-poverty schools in the greater Houston area
where principal training and preparation differ. Data for each participating principal was
collected and analyzed using the Academic Excellence Indicator System (AEIS) report which
includes school accountability ratings and student achievement results. The methodology
included a review of related literature of the content.
The data collection process was three-fold. The researcher began with a School Leadership
Demographic Survey [see Appendix A]. This instrument served as a means of collecting
demographic data on all of the principals in the target population. A letter of Research Intent
detailing the purpose of the research study was also included [see Appendix B]. Once all
demographic data had been compiled, the researcher began to assemble and analyze the
quantitative data for the study. The statistical analysis portion of the study relied solely on
quantitative instruments. The instrumentation included Texas Assessment of Knowledge and
Skills (TAKS) data from the 2008-2009 and 2009-2010 school years gathered from the
78

Academic Excellence Indicator System (AEIS) report published by the Texas Education Agency
(TEA) each year.
The Texas Assessment of Knowledge and Skills (TAKS) test was the primary state
assessment for students in Texas. The Academic Excellence Indicator System (AEIS) report was
used to ascertain school accountability ratings and student achievement results on the Texas
Assessment of Knowledge and Skills (TAKS) Mathematics and Reading Assessments during the
2008-2009 and 2009-2010 school years. For the purposes of this study, the Academic Excellence
Indicator System (AEIS) report was utilized to access school accountability ratings and
mathematics and reading scores from the selected schools for 2008-2009 and 2009-2010 to
assess the impact of types of principal training on these dependent variables.
Data Analysis
Demographic data was analyzed based on information gathered from the School
Leadership Demographic Survey instrument. In this study, the researcher sought to identify
differences that exist between the independent variable which is the type of principal preparation
and to analyze the quantitative data. For the purposes of this research study, the researcher
sought to compare the means (sets of scores) from two independent or different groups. The
comparison groups consisted of those who have participated in atypical or traditional principal
preparation programs. The Independent Samples T Test was used to measure differences in the
comparison groups. There was one independent variable with two levels (X1= atypical principal
preparation and X2= traditional principal preparation). For each research question, there was one
dependent variable: School Accountability Ratings (Exemplary, Recognized, Acceptable, and
Unacceptable) and Texas Assessment of Knowledge and Skills (TAKS) student achievement
scores in mathematics and reading. The Independent T-Test was utilized to assess whether a
79

difference existed between type of principal training and school accountability ratings and
student achievement results in high-poverty schools in the greater Houston area.
The Statistical Package for the Social Sciences (SPSS 13.0) was utilized to analyze the
data. Frequencies and percentages were calculated and represented graphically. The researcher
constructed frequency polygons and then calculated the mean and standard deviation of each
group if the variable is quantitative. According to Fraenkel and Wallen (2009, p. 370), the most
commonly used test for causal-comparative research is theT-Test for differences between means.
The T-Test was used to demonstrate whether or not students and the school as a whole
achieved positive gains in student achievement results and school accountability ratings based on
whether or not they have an atypically trained principal or a principal trained using traditional
methods of principal preparation. This demanded careful statistical and design controls to rule
out alternative explanations to changes in principal outcomes. Carefully designed impact studies
of this type, coupled with intensive examination of the factors underlying potential changes,
were needed to help districts and schools make difficult decisions about school restructuring
efforts, especially in the context of dwindling economic resources.
It was important to also consider ethics when conducting this research study in order to
determine whether or not there are certain aspects that may be right or wrong procedurally.
Participants placed a great deal of trust in the researcher and it was imperative to consider what
could be deemed to be an unethical practice when conducting this study. The researcher bore the
sole responsibility of assigning pseudonyms to the subjects being studied in order to maintain
confidentiality.
80

Summary of Research Procedure
There was no physical or psychological harm brought to anyone as a result of this
research. The researcher utilized the list of ethical principles for conducting research with
human subjects based on the recommendations by the Committee on Scientific and Professional
Ethics of the American Psychological Association. An Institutional Review Board (IRB)
committee was utilized to approve, monitor, and review the research involving human subjects.
Institutional Review Boards (IRBs) have been approved to assist and approve or
disapprove possible research proposals. The researcher reviewed the oversight and functions of
the Institutional Review Board (IRB) in order to adhere to the regulations and modifications that
are commonly accepted for educational settings and involving normal educational practices.
This was imperative to the researcher in order to protect the rights of human subjects who
participated in the subject.
No one other than the researcher or designated had access to the data or any identifiable
information. The names of all subjects were removed from the documents. In cases where there
was a need to identify a participant, the linkage system was carefully guarded. All subjects were
assured by the researcher that any data collected was held in complete confidence and no names
would ever be used if the information were to be used for publication. All data was maintained
in a locked file cabinet for seven years. If any participant wished to withdraw from the study, or
make the request that their data not be used, their requests were honored and confidentiality
continued to be maintained.
81
CHAPTER IV
DATA ANALYSIS
A 2008 report entitled, Mapping America’s Educational Progress, found that during the
2006-2007 school year, 70% or 64, 546 of 98,905 schools nationwide made adequate yearly
progress; 10,676 schools were designated as schools in need of improvement, and 2,302 schools
were designated as schools in need of improvement restructuring.
Nearly 60% of a school’s impact on student achievement is attributable to principal and
teacher effectiveness. These are the most important in-school factors driving school success, with
principals accounting for 25% and teachers 33% of a school’s total impact on achievement
(Marzano, et al., 2005). Furthermore, even though a single teacher can have a profound impact
on student learning over the course of a year, that effect generally fades quite quickly unless a
student’s subsequent teachers are equally effective, with half the gains being lost the following
year, and nearly all of the gains being lost within two years (Kane & Staiger, 2008).
In order for students to have high-quality learning gains year after year, schools must be
high-functioning led by effective principals with effective teachers across the school. This is
especially vital for turnaround schools, where studies find no examples of success without
effective principal leadership (Berends, et. al., 2001).
The purpose of this study was to investigate the differences between atypical and
traditional principal preparation programs and how principal training impacts student
achievement outcomes and school accountability ratings in Houston’s high-poverty schools.
First, this quantitative causal-comparative research study sought to examine new models
of principal preparation as recommended in the Levine Report, and compare those with more
traditional forms of principal preparation. Second, this study sought to conduct an analysis of
82

school accountability ratings and student achievement results at a select group of high-poverty
schools in the Houston region.
This chapter presents an analysis of the data assembled to determine whether principal
preparation made a difference in school accountability ratings and student achievement results in
high-poverty schools in the greater Houston region. The study compared the performance of two
groups: principals trained through traditional university-based programs, and those trained
through atypical principal preparation methods.
Data were collected from 2008-2009 and 2009-2010 Academic Excellence Indicator
System (AEIS) reports issued by the Texas Education Agency. The reports were used to identify
and compare Texas Assessment of Knowledge and Skills (TAKS) scores for two consecutive
years, and to identify the assigned school accountability rating designation for each campus
participating in the study.
Research Questions
Research and information gained from a synthesis of related literature helped to formulate
research questions to guide this study. The researcher attempted to find answers to the following
research questions:
1. Are there differences in school accountability ratings in high-poverty schools where
principal training and preparation differ?
2. Are there differences in student achievement outcomes in high-poverty schools where
principal training and preparation differ?
83

Research Hypotheses
The researcher predicted the following outcomes from conducting the study:
(H1): As measured by the AEIS Report, principals who participate in atypical principal
preparation programs will impact school accountability ratings in high-poverty schools in the
greater Houston area compared to principals who participated in traditional routes of principal
preparation.
(H2): As measured by the AEIS Report, principals who participate in atypical principal
preparation programs will impact student achievement outcomes in high-poverty schools
principals who in the Greater Houston area compared to participated in traditional routes of
principal preparation.
Null Hypothesis
In order to answer the research questions and test the research hypotheses, the researcher
developed the following null hypotheses:
(H01): There will be no statistically significant difference in school accountability ratings of high-
poverty schools in the greater Houston are having principals who went through atypical principal
preparation and those high-poverty schools with principals receiving atypical principal
preparation.
(H02): There will be no statistically significant difference in student achievement outcomes of
high-poverty schools in the greater Houston are having principals who went through atypical
principal preparation and those high-poverty schools with principals receiving traditional
principal preparation.
84
Research Procedures
The study included five targeted school districts in the greater Houston area. The districts
included in the study were: Houston ISD, Aldine ISD, Alief ISD, Cy-Fair ISD, and Humble ISD.
From the targeted districts, a sample size of 100 principals was selected to participate. To
facilitate the identification of the sample population for the study, the researcher mailed a copy
of the School Leadership Demographic survey [see Appendix A], a Letter of Research Intent
detailing the purpose of the research study [see Appendix B], and a self-addressed stamped
envelope to 500 principals in the five targeted districts. To aid in the identification of the target
population, the snowball sampling technique was utilized as a means of consulting with
principals to identify other principals who met the criteria established for the study. The study
was based solely on extant test data using state education reports, so there was no contact made
with participants other than the collection of demographic data through the use of a survey sent
via U.S. mail.
The survey intake process lasted for 45 days. The survey intake process yielded a total of
278 returned surveys. Of the 278 surveys returned, the researcher used a criterion sampling
technique to identify criteria and select principals meeting the following criterion: (1)
participants were active principals of K-12 schools; (2) participants must have been employed in
one of the five targeted districts; (3) participants must have been in the role of principal at the
selected school for two full academic years, (4) participants must have been the leader of a
school that participated in the Texas Education Agency state assessment system; (5) participants
must have been principal of a school identified as having 35% or higher free and reduced lunch;
and (6) participants must have had at least 3-10 years of principal experience.
85

Throughout the survey intake process, the researcher maintained an Excel spreadsheet to
track the demographic information provided. As surveys were returned, each school was
randomly assigned a number documented on both the spreadsheet, as well as the actual survey.
This aided the researcher in protecting the identity of the principal and school, as well as
provided a way in which the researcher could track each school. Data was maintained in a locked
file cabinet for the duration of the study. No one other than the researcher had access to the data
or any identifiable information related to the participants.
A coding system was created to identify key indicators for each school represented in the
study. The coding system for the study included: (1) a random number assigned to each
demographic survey returned; (2) name of the school district; (3) school name; (4) campus
enrollment; and (5) high poverty percentage. Specific to the campus principal, data collected
included (1) type of principal preparation; (2) years as a school principal; (3) ethnicity of the
principal; and (4) gender of the principal. Data to be used for the statistical analysis of the study
was also housed in the Excel spreadsheet and included the Texas Assessment of Knowledge and
Skills (TAKS) Reading and Mathematics scores for two consecutive academic years. School
Accountability Ratings for the same period of time were also included in the data file. Finally,
outlier data that was not directly measured in the study such as teacher years of experience and
the Limited English Proficient (LEP) percentages for each campus during a two year period was
also collected. While many of the coded items were not included as variables being measured in
the study, this data was included as part of the descriptive statistics for the study.
Of the 278 returned surveys, the researcher was able to identify a sampling of 100
principals to be included in the study. This sample population was comprised of 20 principals
86

from each of the five districts including 10 traditionally trained principals and 10 atypically
trained principals. The sample of 100 principals included elementary, middle and high schools.
The study was conducted using a dominantly quantitative design. The quantitative
methodology was utilized to answer the initial research questions about the differences in school
accountability ratings and student achievement outcomes in high-poverty schools in the greater
Houston area where principal training and preparation differ.
Statistical Analysis
Once all demographic data had been compiled, the researcher began the process of
analyzing the quantitative data for the study. The statistical analysis portion of the study relied
solely on quantitative instruments. For the purposes of this study, the researcher utilized the
Academic Excellence Indicator System (AEIS) report to ascertain school accountability ratings
and student achievement results on the Texas Assessment of Knowledge and Skills (TAKS)
mathematics and reading assessments during the 2008-2009 and 2009-2010 school years. The
Texas Assessment of Knowledge and Skills (TAKS) test has been the primary state assessment
for students in Texas, and was used to collect state assessment data for this study.
Demographic data was analyzed based on information gathered from the School
Leadership Demographic Survey instrument. In this study, the researcher sought to identify
differences that existed between School Accountability Ratings and TAKS achievement scores
based on type of principal preparation. For the purposes of this research study, the researcher
sought to compare the means (sets of scores) from two independent or different groups. The
comparison groups consisted of those who have participated in atypical or traditional principal
preparation programs.
87
The Independent Samples T-Test was the primary statistical measure utilized to assess
whether a difference exists between type of principal training and school accountability ratings
and student achievement results in 100 high-poverty schools in the greater Houston area. The
Statistical Package for the Social Sciences (SPSS 13.0) was utilized to analyze the data.
Frequencies and percentages were calculated and represented graphically. The researcher
constructed frequency polygons and then calculated the mean and standard deviation of each
group if the variable was quantitative.
The Independent Samples T-Test was used to measure differences in the comparison
groups. There was one independent variable with two levels (X1= atypical principal preparation
and X2= traditional principal preparation). For each research question, the researcher had one
dependent variable: School Accountability Ratings (Exemplary, Recognized, Acceptable, and
Unacceptable) and Texas Assessment of Knowledge and Skills (TAKS) student achievement
scores in reading and mathematics.
The statistical analysis portion of this chapter is divided into two major sections. The first
section consists of the demographic profile of the participants in the study. The second portion
examines the hypotheses formulated for the study. The hypotheses were tested through the
application of the Independent Samples T-Test.
Research Findings
Demographic Profile of the Participants in the Study
There were 100 principals who participated in the study. Based on a collection of
demographic data, participants were described descriptively by their gender, ethnicity, grade
level, years on campus as principal, total years as a campus administrator, school district and
type of principal preparation.
88

Type of Principal Preparation
To ensure an equitable study, the variable principal preparation was in a dichotomous
format for this investigation. Fifty (50%) principals attended an atypical principal preparation
programs and 50 (50%) principals were involved in traditional principal preparation programs.
Table 1 provides an illustration of type of principal preparation for all principals included in the
study.
Table 1: Frequency Distribution by Principal Preparation
Principals Preparation Number PercentAtypical 50 50.0Traditional 50 50.0Total (N) 100 100.0
Gender by Type of Preparation
There were 17 (17%) male atypical principals and 19 (19%) male traditional principals
who participated in the study. In comparison, there were 33 (33%) female atypical principals
and 31 (31%) female traditional principals who participated in the study. Table 2 provides an
analysis of the distribution of gender by type of principal preparation.
Table 2: Frequency Distribution by Gender and Type of Preparation
Atypical (50) Traditional (50) TotalGender N % N % N %Male 17 17.0 19 19.0 36 36.0
Female 33 33.0 31 31.0 64 64.0
Total 50 50.0 50 50.0 100 100
Ethnicity by Type of Preparation
89

There were 29 (29%) atypical white American principals and 32 (32%) traditional white
American principals who participated in the study. Also, there were 15 (15%) atypical African
American principals and 11 (11%) traditional African American principals who participated in
the study. Finally, there were 6 (6%) atypical Hispanic American principals and 7 (7%)
traditional Hispanic American principals who were involved in this empirical study. Table 3
represents these findings.
Table 3: Frequency Distribution by Ethnicity and Type of Preparation
Type of Preparation
Atypical (50) Traditional (50) TotalEthnicity N % N % N %White American 29 29.0 32 32.0 61 61.0African American 15 15.0 11 11.0 26 26.0Hispanic American 6 6.0 7 7.0 13 13.0Total 50 50.0 50 50.0 100 100
Years of Experience on Campus and Type of Preparation
There were 9 (9%) atypical principals who indicated they had 1 to 3 years and 7 (7%)
traditional principals reported similar years of experience on campus. By contrast, 21 (21%)
atypical principals reported 4 to 6 years of experience and 21 (21%) traditional principals said
they had 4 to 6 years of experience.
Additionally, 10 (10%) atypical principals expressed they had 7 to 9 years of experience
on their campus and 16 (16%) traditional principals indicated the same. In addition, 10 (10%)
atypical principals reported they had 10 years or more of experience on their campus and 6 (6%)
traditional principals indicated they had 10 or more years of experience on their campus. Table 4
represents years of experience on campus and type of principal preparation.
90

Table 4: Frequency Distribution by Years of Experience on Campus
Type of PreparationYears ofExperience Atypical (50) Traditional (50) Totalon Campus N % N % N %1 to 3 9 9.0 7 7.0 16 16.04 to 6 21 21.0 21 21.0 42 42.07 to 9 10 10.0 16 16.0 26 26.010 + years 10 10.0 6 6.0 16 16.0Total 50 50.0 50 50.0 100 100
Years of Experience as an Administrator
There were 2 (2%) atypical principals with 5 years or less of experience and 4 (4%)
principals with 5 years or less of experience and who were traditionally trained. In addition, 20
(20%) were atypical principals with 6 to 10 years of experience and 26 (26%) of the traditional
principals had 6 to 10 years of experience. On the other hand, there were 17 (17%) atypical
principals with 11 to 15 years and 16 (16%) traditional principals with similar years of
experience. Also, 7 (7%) and 3 (3%) traditional principals had 16 to 20 years of experience.
Finally, there were 4 (4%) atypical principals with 21 years or more as an administrator and 1
(1%) traditional principal with 21 years or more as an administrator. Table 5 provides a
description of these analyses.
Table 5: Frequency Distribution by Years of Experience as an Administrator
Type of Preparation
91

Years ofExperienceAs anAdministrator
Atypical (50)
Traditional
(50) Total
N % N % N %1 to 5 2 2.0 4 4.0 6 6.06 to 10 20 20.0 26 26.0 46 46.011 to 15 17 17.0 16 16.0 33 33.016 to 20 7 7.0 3 3.0 10 10.021 + years 4 4.0 1 1.0 5 5.0Total 50 50.0 50 50.0 100 100
Grade Level and Type of Preparation
There were 21 (21%) atypical K-4 principals and 16 (16%) traditional K-4 principals who
participated in the study. In addition, there were 2 (2%) atypical 5-6 grade principals and 7 (7%)
traditional 5-6 grade principals who provided administrative leadership in their schools.
Moreover, there were 15 (15%) atypical 7-8 principals and 14 (14%) traditional 7-8
principals who participated in the study. Finally, there were 12 (12%) atypical and 13 (13%)
traditional principals who provided administrative guidance through grades 9 through 12. See
Table 6 for these findings.
Table 6: Frequency Distribution by Grade Levels and Type of Preparation
Grade Level
Type of PreparationAtypical (50) Traditional (50) TotalN % N % N %
K-4 21 21.0 16 16.0 37 37.05-6 2 2.0 7 7.0 9 9.07-8 15 15.0 14 14.0 29 29.09-12 12 12.0 13 13.0 24 24.0Total (N) 50 50.0 50 50.0 100 100
School Districts
92

Principals who participated in the present study were employed in five Greater Houston
school districts. Twenty (20%) principals were employed in the Aldine, Alief, Humble, HISD
and Cy-Fair School District, respectively. Each of the principals represented in the study had
been at the same campus during the 2008-2009 and 2009-2010 school years. Table 7 presents an
analysis of principal placement as it relates to the study.
Table 7: Frequency Distribution by School District
School District Number PercentAldine 20 20.0Alief 20 20.0Humble 20 20.0HISD 20 20.0Cy-Fair ISD 20 20.0Total (N) 100 100.0
Examination of the Null Hypothesis
In order to answer the first quantitative research question, the following null hypothesis
was formulated:
Research Question 1: Are there differences in school accountability ratings in high-poverty
schools where principal training and preparation differ?
H01 There will be no statistically significant difference in school accountability ratings of
high-poverty schools in the greater Houston area having principals who went through
atypical principal preparation and those high-poverty schools with principals receiving
traditional principal preparation.
Descriptive Statistics Comparing Differences in School Accountability Ratings (08-09)
To answer the first research question, an Independent Samples T-Test was calculated and
analyzed to measure differences in school accountability ratings during the 2008-2009 school
year between atypically and traditionally trained principals in high-poverty schools in the Greater
93

Houston area. Table 8 presents the Independent Samples T-Test results pertaining to these
differences. The mean accountability rating for schools with atypical principals was 2.98, and the
mean accountability rating for schools with traditional principals was 2.54. The mean difference
was .44. A statistically significant difference was found between the mean accountability ratings
of atypical and traditional principals (t=-2.51, df=98, p<.05) at the .05 level. Thus, the null
hypothesis was rejected.
Table 8: T-Test Results Comparing Differences in the School Accountability Ratings of High- Poverty Schools with Atypical and Traditional Principals (08-09)
Statistics Atypical(n=50)
Traditional(n=50)
Mean 2.98 2.54SD 0.82 0.93SE .11 0.13Mean Difference .44Df 98tp 2.51
.014*
*Significant at the .05 level
Descriptive Statistics Comparing Differences in School Accountability Ratings (09-10)
Accordingly, the same test was executed to compare the same measures for the 2009-
2010 school year. As shown in Table 9, the mean accountability rating score for high-poverty
schools with atypical principals was 3.22 and mean accountability rating score for high-poverty
schools with traditional principals was 3.14. The mean difference was .08. A statistically
significant difference was not found between the mean accountability rating scores of high-
poverty schools with atypical and traditional principals at the .05 level (t=-.621, df=98, p>.05).
Therefore, the hypothesis was not rejected.
Table 9: T-Test Results Comparing Differences in the School Accountability Ratings of High- Poverty Schools with Atypical and Traditional Principals (09-10)
94

Statistics Atypical(n=50)
Traditional(n=50)
Mean 3.22 3.14SD 0.62 0.67SE 0.01 0.01Mean Difference .08Df 98TP
.0621
.536
In order to answer the second quantitative research question, the following null hypothesis
was formulated:
Research Question 2: Are there differences in student achievement outcomes in high-poverty
schools where principal training and preparation differ?
H02: There will be no statistically significant differences in student achievement outcomes of
high-poverty schools in the greater Houston area having principals who went through atypical
principal preparation and those high-poverty schools with principals receiving traditional
principal preparation.
Six separate Independent Samples T-Tests were computed to measure differences in
TAKS achievement scores for atypically and traditionally trained principals: (1) TAKS Total of
All Campus Achievement Scores (08-09); (2) TAKS Total of all Campus Achievement Scores
(09-10); (3) Reading TAKS Achievement Scores (08-09); (4) Reading TAKS Achievement
Scores (09-10); (5) Math TAKS Achievement Scores (08-09); and (6) Math TAKS Achievement
Scores (09-10).
Descriptive Statistics Comparing Differences in Total TAKS Achievement Scores (08-09)
95

The T-Test for independent means was computed and examined to measure the
differences in the total TAKS student achievement scores of high-poverty schools with atypical
and traditional principals. As indicated in Table 10, the mean total TAKS score for schools with
atypically trained principals was 74.3 and 72.4 for schools with traditionally trained principals.
The mean difference was -.01. Significant differences were not found in the mean total TAKS
scores of high-poverty schools with atypical and traditional principals at the .05 level (t=-.813,
df=98, p>.05). Consequently, the hypothesis was not rejected. Table 10 presents the
Independent Samples T-Test results pertaining to these differences.
Table 10: T-Test Results Comparing Differences in the TAKS Total Achievement Scores of Students in High-Poverty Schools with Atypical and Traditional Principals (08-09)
Statistics Atypical(n=50)
Traditional(n=50)
Mean 74.3 72.4SD 00.12 00.11SE 00.02 00.02Mean Difference .02df 98tp
.813 .418
Descriptive Statistics Comparing Differences in Reading TAKS Achievement Scores (08-09)
Similarly, illustrated in Table 11, were the T-Test findings regarding the differences
specific to TAKS Reading scores of students enrolled in high-poverty schools with atypical and
traditional principals. The mean reading score for schools with atypical principals was 89.0 and
the mean proportioned reading score for schools with traditional principals was 83.0. The mean
difference was .06. Significant differences were found between the mean reading scores of
students enrolled in high-poverty schools with atypical and traditional principals (t=3.41, df=98,
p<.001) at the .001 level. Accordingly, the hypothesis was rejected.
96

Table 11: T-Test Results Comparing Differences in the Reading TAKS Achievement Scores of Students in High-Poverty Schools with Atypical and Traditional Principals (08-09)
Statistics Atypical(n=50)
Traditional(n=50)
Mean 89.0 83.0SD 00.001 00.11SE 00.001 00.02Mean Difference 0.06df 0.98tp
3.410.001***
***Significant at the .001 level
Descriptive Statistics Comparing Differences in Math TAKS Achievement Scores (08-09)
Likewise, Table 12 depicts the Independent Samples T-Test results concerning the mean
differences in Mathematics TAKS scores of students enrolled in high-poverty schools with
atypical and traditional principals. The mean mathematics score for schools with atypical
principals was 83.1, and for schools with traditional principals, the mean mathematics score was
79.2. The mean difference was .04. No differences were found in the mean proportion TAKS
mathematics scores of students attending high-poverty schools (t=-1.91, df=98, p>.05) with
atypical and traditionally prepared principals at the .05 level. Therefore, the hypothesis was not
rejected.
Table 12: T-Test Results Comparing Differences in the Mathematics TAKS Achievement Scores of Students in High-Poverty Schools with Atypical and Traditional Principals (08-09)
Statistics Atypical(n=50)
Traditional(n=50)
97

Mean 83.1 79.2SD 00.10 00.11SE 00.01 00.01Mean Difference 0.04df 98tp
1.910.060
In order to complete the analysis of measuring differences for two consecutive years
around common variables, the same tests were utilized to compare and report the second year of
comparison data.
Descriptive Statistics Comparing Differences in Total TAKS Achievement Scores (09-10)
The Independent Samples T-Test was employed to ascertain the differences in the total
TAKS achievement scores of students attending high-poverty schools with atypical and
traditional principals. High- poverty schools with atypical principals had a mean total TAKS
score of 81.8 and high-poverty schools with traditional principals had a mean total TAKS score
of 75.2. The mean difference was .06. Statistically significant differences were found between
the mean total TAKS scores of high-poverty schools with atypical and traditional principals at
the .001 level (t=-3.34, df=98, p<.001). Based on the above analyses, the hypothesis was
rejected.
Table 13: T-Test Results Comparing Differences in the TAKS Total Achievement Scores of Students in High-Poverty Schools with Atypical and Traditional Principals (09-10)
Statistics Atypical(n=50)
Traditional(n=50)
Mean 81.8 75.2
98

SD 00.09 00.11SE 00.01 .01Mean Difference .06df 98tp
3.34.001***
***Significant at the .001 level
Descriptive Statistics Comparing Differences in Reading TAKS Scores (09-10)
To complete the second year comparison of Reading TAKS scores, the T-Test was
calculated to investigate the differences in scores of students enrolled in high-poverty schools
with atypical and traditional principals. The mean proportional Reading TAKS score of students
attending schools with atypical principals was 91.2 and the mean reading scores of students
attending schools with traditional principals was 86.6. The mean difference was .05. Statistically
significant differences were found between the mean reading scores of students enrolled in high-
poverty schools with atypical and traditional principals (t=2.76, df=98, p<.01) at the .01 level.
Thus, the hypothesis was rejected.
Table 14: T-Test Results Comparing Differences in the Reading TAKS Achievement Scores of Students in High-Poverty Schools with Atypical and Traditional Principals (09-10)
Statistics Atypical(n=50)
Traditional(n=50)
Mean 91.2 86.6SD 00.01 00.10SE 00.001 00.01Mean Difference 0.05df 98tp
2.760 .007**
**Significant at the .01 level
Descriptive Statistics Comparing Differences in Mathematics TAKS Scores (09-10)
Correspondingly, Table 15 represents the T-Test findings pertaining to the differences in
the Mathematics TAKS scores of students enrolled in high-poverty schools with atypical and
99

traditional principals. The mean mathematics score for schools with atypical principals was 88.5
and the mean mathematics score for schools with traditional principals was 84.8. The mean
difference was .04. A significant difference was found between the mean TAKS mathematics
scores of students enrolled in high-poverty schools with atypical and traditional principals
(t=1.998, df= 98, p<.05) at the .05 level. Therefore, the hypothesis was rejected.
Table 15: T-Test Results Comparing Differences in the Math TAKS Achievement Scores of Students in High-Poverty Schools with Atypical and Traditional Principals (09-10)
Statistics Atypical(n=50)
Traditional(n=50)
Mean 88.5 84.8SD 00.01 00.11SE 00.001 00.001Mean Difference .04df 98t 1.998P .049**Significant at the .05 level
Summary
Descriptive statistics and the T-Test for independent means were used to analyze the
quantitative data. The T-Test for independent means was used to determine whether a principal’s
preparation route made a significant difference in school accountability ratings and TAKS
achievement scores in high poverty schools across two consecutive school years (2008-2009 and
2009-2010). The criterion value of p<0.05 was used to determine whether differences in means
were statistically significant. The following research hypotheses were tested in the study:
H01: There will be no statistically significant difference in school accountability ratings of
high poverty schools in the greater Houston area having principals who went through atypical
principal preparation and those high poverty schools with principals receiving traditional
principals’ preparation.
100

H02: There will be no statistically significant differences in student achievement outcomes of
high poverty schools in the greater Houston area having principals who went through a typical
principal preparation and those high poverty schools with principals receiving traditional
principal preparation.
Accountability Ratings
Specific to accountability ratings, type of principal preparation program did produce a
significant effect on the 08-09 academic year’s accountability ratings of high-poverty schools;
however the 09-10 academic year’s accountability ratings of high-poverty schools were not
significantly affected by their principals’ preparation program.
Student achievement showed mixed results across the two consecutive academic school
years. The data for each of the tested variables are listed below:
Student Achievement in Total (All) TAKS
The 08-09 academic year’s Total (All) TAKS achievement scores of students were not
influenced by their principals’ preparation program. In contrast, the variable principal
preparation did produce a significant difference in Total (All) TAKS achievement scores during
the 09-10 school year.
Student Achievement (Reading)
The variable preparation program of principals did produce a significant effect on the 08-
09 academic year’s TAKS Reading achievement scores of students attending high-poverty
schools. Likewise, the 09-10 academic years’ TAKS Reading achievement scores of students
were also influenced by their principals’ preparation program.
Student Achievement (Mathematics)
101
The preparation program of principals did not provide a significant influence on the 08-
09 academic years’ TAKS Mathematics achievement score of students. Conversely, principal
preparation program produced a significant impact on the 09-10 academic year’s TAKS
Mathematics achievement scores of students attending high-poverty schools.
Summary of Statistical Significance
The purpose of this study was to investigate the differences between atypical and
traditional principal preparation programs and how principal training impacts student
achievement outcomes and school accountability ratings in Houston’s high-poverty schools.
First, this quantitative causal-comparative research study sought to examine new models
of principal preparation as recommended in the Levine Report, and compare those with more
traditional forms of principal preparation. Second, this study sought to conduct an analysis of
school accountability ratings and student achievement results at a select group of high-poverty
schools in the Houston region.
All statistically significant T-Test results provided clear evidence that atypically trained
principals’ schools outperformed traditionally trained principals’ schools in five of the eight
variables tested. Those included: 1) School Accountability (08-09); 2) TAKS Reading (08-09);
3) Total TAKS (09-10); 4) TAKS Reading (09-10); and TAKS Mathematics (09-10).
CHAPTER V:
SUMMARY OF FINDINGS, DISCUSSION, CONCLUSIONS, AND
RECOMMENDATIONS
102

Introduction
Chapter V presents a summary of the study including questions addressed, the purpose of
the study of research methods, and a presentation of major findings. A discussion of research
findings will be presented and conclusions will be drawn about each of the two quantitative
research questions and two hypotheses. Implications will be also shared to provide practical
suggestions for addressing the issues that have been raised in the research study. Finally,
recommendations for practices and further research are included.
Problem
High-poverty school failure continues to create a dark cloud over the opportunities for
students in urban communities, and widespread resources continue to be funneled into school
systems resulting in little to no closure in the achievement gaps of impoverished students within
the walls of these schools. The problem is more than troubled students, their parents, who based
on public opinion simply do not care, or the inept teachers who lack formalized training to meet
the needs of the most challenging student. Our education system is clearly in crisis. The public’s
demands for more effective schools has placed a laser-like focus on the critical role the school leader
plays in school-reform efforts. Until recently, the importance of the principal was often overlooked
as a vital factor in the success of the educational reform movements introduced to our nation’s
schools over the past two decades.
In a 2005 Wallace Foundation study focused on the impact of school leadership, it was
revealed that second to the influences of classroom instruction delivered by the classroom teacher,
school leadership strongly affects student learning. Principals’ abilities are central to the task of
building schools that promote powerful teaching and learning for all students (Wallace Foundation,
2005). With schools in crisis, students who bring a myriad of challenges, inequities in our education
103
system, and the bureaucratic structure of our school systems, leading change on any school campus
requires a new type of school leader.
Arthur Levine in his Educating Leaders Report (2005) harshly criticized the quality of
educational administrations programs. What has resulted are atypical principal preparation
programs that seek to train principals differently. In an era of standards-based reform, the
implementation of a marked change in the role of the principal has evolved. Once keenly
focused on management, operations, and primarily serving as a buffer to keep externally-
mandated reforms from teachers; the principal is now the leader of all school-reform and
instructional efforts on a campus. The implementation of NCLB compounds this dilemma for
principals and school districts across the country. To support the movement toward
accountability-driven leadership, universities, national, and nonprofit organizations are
redefining principal preparation to identify a pipeline of candidates ready to assume the
demanding role of the school principal in today’s schools.
Purpose of the Study
The purpose of this study was to investigate the differences between atypical and
traditional principal preparation programs and how principal training impacts student
achievement outcomes and school accountability ratings in Houston’s high-poverty schools.
First, this quantitative causal-comparative research study sought to examine new models
of principal preparation as recommended in the Levine Report, and compare those with more
traditional forms of principal preparation. Second, this study sought to conduct an analysis of
school accountability ratings and student achievement results at a select group of high-poverty
schools in the Houston region.
Specifically, this study was concerned with the influence of preparation programs of
principals on the 08-09 and 09-10 academic years’ accountability ratings of their schools, as well
104

as, the 08-09 and 09-10 academic years’ reading, mathematics and total TAKS scores of students
attending their schools.
Quantitative Research Questions
The following quantitative research questions guided the study:
1. Are there differences in school accountability ratings in high-poverty schools in the
greater Houston area where principal training and preparation programs differ (atypical
vs. traditional)?
2. Are there differences in student achievement outcomes in high-poverty schools in the
greater Houston area where principal training and preparation programs differ (atypical
vs. typical)?
Null Hypotheses
In order to answer the two research questions, the following research null hypotheses
were formulated:
H01: There will be no statistically significant difference in school accountability ratings of high
poverty schools in the Greater Houston area having principals who went through atypical
principal preparation and those high poverty schools with principals receiving traditional
principals’ preparation.
H02: There will be no statistically significant differences in student achievement outcomes of
high poverty schools in the greater Houston area have principal preparation and those high
poverty schools with principals receiving traditional principal preparation.
Summary of Findings
Each research question listed below presented these major findings:
105

Quantitative Research Question 1 asked: Are there differences in school accountability ratings in
high-poverty schools in the greater Houston area where principal training and preparation
programs differ (atypical vs. traditional)? Specific to accountability ratings, type of principal
preparation did produce a significant effect o the 08-09 academic years’ accountability ratings of
high poverty schools. However, the 09-10 academic year’s accountability ratings of high poverty
schools were not significantly affected by their principals’ preparation program.
Quantitative Research Question 2 asked: Are there differences in student achievement outcomes
in high-poverty school in the greater Houston area where principal training and preparation
programs differ (atypical vs. traditional)? Student achievement showed mixed results across the
two consecutive academic school years. The 08-09 academic year’s Total (All) TAKS
achievement scores of students were not influenced by their principals’ preparation program. In
contrast, the variable principal preparation did produce a significant difference in Total (All)
TAKS achievement scores during the 09-10 school year.
The variable preparation program of principals did produce a significant effect on the 08-
09 academic year’s TAKS Reading achievement scores of students attending high-poverty
schools. Likewise, the 09-10 academic year’s TAKS Reading achievement scores of students
were also influenced by their principals’ preparation program.
The preparation program of principals did not provide a significant influence on the 08-
09 academic year’s TAKS Mathematics achievement score of students. Conversely, principals’
preparation program produced a significant impact on the 09-10 academic year’s TAKS
Mathematics achievement scores of students attending high-poverty schools.
Discussion
106
The most interesting finding of the study was the evidence that principal preparation had
an influence on the overall school performance and academic achievement of students attending
high poverty schools. Kenneth Leithwood and his colleagues said in their landmark 2004 report
“How Leadership Influences Student Learning,”:
There are virtually no documented instances of troubled schools being turned
around in the absence of intervention by talented leaders. While other factors
within the school also contribute to such turnarounds, leadership is the catalyst.
If leadership is in fact the critical bridge to having school improvement pay off
for children, we need to understand how to better prepare school administrators
to lead the increasingly complex institution we call school, so that all children can
learn to high standards. (p. 5)
Some of today’s most respected thinkers in school improvement – including Michael
Fullan, Tony Wagner and Linda Darling-Hammond – agree that the job of the principal requires
a major shift in the way we attract and develop them.
A notable finding from the present study pertained to the influence of principals’
preparation programs on the accountability ratings of high poverty schools during the 08-09 and
09-10 academic school years. Specifically, the preparation programs of principals had influence
on the accountability ratings of high poverty schools during one of two school years measured in
the study. These findings correspond with the research of the Wallace Foundation (2007), Davis
(2003), Forman (2003), Schein (2000), and Hallinger and Heck (1999). These researchers found
a significant relationship between overall school effectiveness and principal preparation.
Moreover, the findings regarding the influence of the variable principals’ preparation
program on academic achievement of students were consistent with those of Fielder (2003),
107

Leithwood (2004), Southern Regional Education Board (2007), and Institution for Educational
Leadership (2010). The findings from research conducted by the above researchers indicated
that principals’ preparation was a significant predictor of student academic success.
The current findings regarding the significant effect of principals’ preparation program
on the academic achievement of students were supported by the works of Fielder (2003),
Leithwood and Associates (2004) and Institution for Educational Leadership (2000). The
aforementioned researchers found that principals’ preparation had a significant impact on the
academic achievement, and the results of the study did show a significant difference in reading
for both years tested, and in mathematics in one out of the two years tested.
Principals’ preparation was found to be a significant factor in the academic achievement
of students enrolled in high poverty schools, and the study revealed that students with atypically
trained principals outperformed those with traditionally trained principals on 5 out of the 8
variables tested in this study. These finding were in direct correlation to much of the research
presented in Chapter 2 of this study, where traditional university-based principal preparation
programs were found to be fundamentally flawed and in need of desperate overhaul.
The Lack of Influence of the Texas Performance Measure (TPM)
There are many plausible explanations for the prevailing findings in this study. One
surprising finding was the lack of impact the Texas Performance Measure had on the findings
within this study. A 2010 article entitled, Texas Projection Measure Tossed as 2011
Accountability System Begins revealed that The Texas Education Agency adopted the TPM in
2008 to address concerns that the state’s accountability system was punishing low-performing
students whose test scores improved dramatically but failed to meet the passing standard.
108

The TPM allowed districts to count as passing certain students who failed the TAKS test
but were projected to pass within three years. With implementation of the TPM, the number of
schools statewide or in the Houston area ranked “exemplary” skyrocketed in 2010, with 239
schools receiving the highest “exemplary” rating - more than three times the number that would
have received that rating without TPM. For the purposes of this study, all schools accountability
ratings and student achievement scores for the 2008-2009 and 2009-2010 school year included
TPM as a factor.
A notable finding in this study was despite the implementation of TPM and its influence
on school accountability ratings and student achievement ratings for Texas schools during this
period, schools led by atypically trained principals still outperformed traditionally trained
principals overwhelmingly.
Multiplicity of Challenges Facing the Principal
Also striking was the influence of atypical principal preparation had on school
accountability ratings and student academic achievement despite the multiplicity of challenges
facing principals in high-poverty schools. As expressively stated in the literature review, high
poverty schools face a multitude of challenges that impact their overall ability to thrive and
progress towards higher achievement. Several factors were identified as key roadblocks to high-
poverty schools: economically disadvantaged students, at-risk students, alternative education,
Limited English Proficient (LEP) student, Special Education (SPED) student, and the Drop-Out.
Each of these factors created potential roadblocks as the principal lead improvement efforts on
his/her campus.
This study looked specifically at measures of performance without delving into the
underlying factors that contribute to overall school performance. However, the study did include
109

a population based on similar criterion and demographics, which even further supports the
importance of principal training and its impact on overall school performance. While both the
atypically trained and traditionally trained principals share similar percentages of economically
disadvantaged and at-risk students, the influence of this as a factor was overshadowed by the
performance of the atypical principal based upon training in overall school accountability ratings
during one school year, TAKS Reading achievement for two consecutive school years, Total
(All) TAKS performance for one school year, and TAKS Mathematics for one school year.
Alternative Education Programs was also presented as a potential challenge for urban
school leaders. The results of this study did not include an in-depth analysis of the percentages of
alternative placements into DAEPs across the 100 schools, however Chapter 2 did present
percentages and other related data around alternative placements in the greater Houston region.
While the quality and alignment of instruction during the timeframe that students are in an
alternative education environment impacts their overall performance and can create impact on
campus level data that the principal has no control over, there was no evidence that the influence
of atypically trained principals leading schools was adversely affected by this challenge. One
could naturally assume that while this variable was not measured directly in the study, there were
middle and high schools included in the study with students participating in DAEP programs.
The Limited English Proficient (LEP) student also presented a unique challenge for the
principal as these students struggle with language deficiencies that impact their ability to perform
well on state assessments. Clearly, Houston has a growing population of LEP students. The level
of LEP populations was not assessed in the study although these percentages, as reported by
concentrations at each of the 100 schools would affect overall school performance data. Also, the
quantity and quality of LEP support changes dramatically from the time a student transitions
110

from elementary to middle and high school. While Texas mandates that students transition out of
LEP support while in elementary school, students often struggle with lasting language challenges
that carry-over into middle and high school. Once again, while this was not a variable directly
measured in the study, the criterion used to select schools was based on similar demographics.
One would therefore infer that the atypically trained principal had the skills and training
necessary to overcome this challenge.
Students in Special Education (SPED) present multi-faceted challenges for the campus
principal. One major challenge the high poverty principal faces is meeting the needs of students
with the most severe disabilities. Also, as introduced in Chapter 2 of this study, the
misrepresentation and misplacement of minority students in SPED is a huge dilemma facing
high-poverty principals. An analysis of the special education percentages of the 100 principals in
the study was not conducted. The distribution of SPED students by campus could potentially
impact overall campus performance, however, the results favor atypically trained principals
based on the criterion used to drive this study which favor the performance of atypically trained
principals.
Finally, the drop-out rate is another factor found to contribute to overall school
performance. While this issue is specific to high school in regard to measurement by the state,
the challenge for the school principal begins in middle schools, when students become less
motivated and more transient. As noted earlier in the study, the motivation level of students often
impacts their desire to stay engaged in school. While this study did not measure drop-out
percentages within the sample of 100 schools, the results of the study supports the overall
performance of atypically trained principals.
New Demands of the Principalship
111
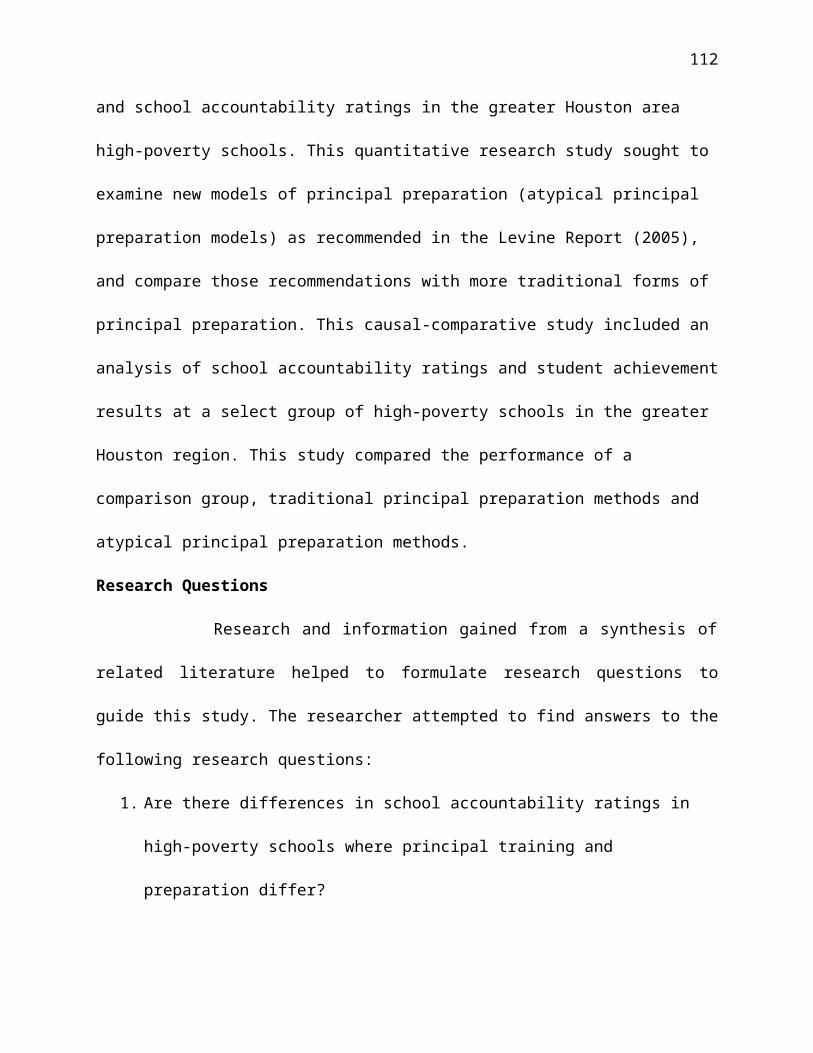
Leaders of today are dealing with issues that leaders of yesterday could not have
imagined. In an era where accountability measures serve as the barometer of success or lack
thereof, principal effectiveness in high-poverty schools is an educational organization’s best
hope for success. Moreover, authors and theorists have concluded that effective leadership serves
as the cornerstone for future success and also reveals an obvious relationship between effective
leadership and overall school effectiveness and student achievement outcomes. (Davis, 2003;
Furman, 2003; Hallinger & Heck, 1999; Schein, 2000).
Scope of the Study
Despite the fact that this study was confined to a two year period, growth over time at a
given campus was clearly demonstrated at schools led by atypically trained principals . The years
of experience on the campus as principal was presented as demographic data with 12% of
principals having one-to three years experience, 46% with four to six years experience, 26%
having seven to nine years experience , and 16% with ten or more years of principal experience.
Since research bears out that due to the multitude of challenges high poverty schools and
their students present, time may be a factor in growth and progress at a school. This study was
limited to two consecutive school years of testing and accountability data to show findings. A
deeper analysis and comparison of growth over a five year period may have yielded stronger
patterns of growth for atypically trained versus traditionally trained principals.
Nearly 60% of a school’s impact on student achievement is attributable to principal and
teacher effectiveness. These are the most important in-school factors driving school success, with
principals accounting for 25% and teachers 33% of a school’s total impact on achievement
(Marzano, et al., 2005). This study was limited to the role of the principal in leading the
acceleration of student improvement on a campus. Even though statistically significant
112

differences were found, teacher influence also has a substantial impact on student achievement,
and could have been a major influence on the study’s findings. Teachers total years of experience
on each of the 100 campuses included in the study, as well as, whether the teacher was
traditionally or alternatively certified may have influenced the outcomes of the study. Also, a
district’s level of investment in principal and teacher development could have also made a
difference in the outcomes of the study.
The Academic Achievement Spectrum
Urban school districts are – and have historically been – at the lowest end of the
academic achievement spectrum. The Council of the Great City Schools recently gathered data
on 59 major city school systems in 36 states and found that urban school achievement in both
reading and mathematics remains below national averages (Council of the Great City Schools
(2003). The idea that a quality education provides the best opportunity for every child to reach
his or her full potential clearly illustrates the connection between this nation’s future and the
effectiveness of urban school districts in educating their students (Cuban, 2001).
The “achievement gap” in education refers to the disparity in academic performance
between groups of students. Many times the term is used to describe the troubling performance
gaps between African-American and Hispanic students, at the lower end of the performance
scale, and their non-Hispanic white peers, and the similar academic disparity between students
from low-income families and those who are better off. Increased attention over the past few
decades have focused on the differences between these groups, as well as other achievement
gaps, such as those based on sex, English-language proficiency and learning disabilities. A vast
amount of research has also been done regarding the impact transitioning from elementary to
secondary schools has on minority students. In many ways the student support systems, parental
113

involvement, and social needs of students are lost when they leave elementary school. In many
cases, minority students tend to begin to loose interest in school as they proceed through the K-
12 system. This only compounds the level of drop-out rates, and impact on our nation’s society.
Conclusions
The theoretical framework for the study was grounded by the notion that transformational
leadership is the vehicle by which a principal leads sustainable change at high poverty campuses.
The basis for the research hypotheses was driven by the expected influence of atypical principal
preparation on school accountability ratings and student achievement in high poverty schools.
The literature clearly supported the underpinnings that atypical principal preparation programs
share common design elements that traditional principal preparation programs are missing.
Those transformational elements include:
1. A clear set of skills, knowledge, and dispositions that a principal must have in order to
drive high levels of student achievement for all children.
2. The reliance on strategic, proactive, and targeted recruiting strategies to ensure that they
have strong candidate pools and pipeline programs from which they can select candidates
most likely to thrive in their programs and grow into effective principals.
3. Highly selective and establish clear criteria and rigorous processes to evaluate applicants’
disposition, skills and knowledge. Candidates are required to demonstrate their skills
through experiential events to evaluate whether candidates’ behaviors and actions match
their stated beliefs.
4. A belief that training and development need to be experienced, giving trainees authentic
opportunities to lead, make mistakes, and grow. This includes the coordination of
coursework, school-based residencies, on-going assessment, coaching and feedback.
114

5. On-going support for new leaders to help them grow on the job is essential to drive
school-wide improvements that lead to improved student achievement results.
6. A continual use of data to assess the effectiveness of their programs and the quality of the
work of the principal on the school campus.
According to Bass & Avolio (2005):
Transformational leaders motivate and inspire in three ways: (1) by raising followers'
levels of consciousness about the importance and value of designated outcomes and about
ways of reaching them; (2) by getting followers to transcend their own self-interest for
the sake of the team, organization, or larger polity; and (3) by raising followers' need
levels to the higher-order needs, such as self-actualization, or by expanding their portfolio
of needs.
The Leithwood holistic model of transformational leadership identified factors that
constitute transformational and transactional leadership. This model conceptualizes leadership
behaviors along a continuum of eight dimensions: (1) building school vision, (2) establishing
school goals, (3) providing intellectual stimulation, (4) offering individualized support, (5)
modeling best practices and important organizational values, (6) demonstrating high
performance expectations, (7) creating a productive school culture, and (8) developing structures
to foster participation in school decisions.
In order for principals to build a school vision, the principal must identify new
opportunities for his or her school and develop a collaborative vision that inspires others to act.
Often times the school has operated for years with no common vision of how to move towards
high expectations of performance, and it is only through this transformative element that the
principal introduces the possibility of achievement.
115

The principal also fosters the acknowledgment and appreciation for group goals aimed at
promoting cooperation among staff and assisting them at working together toward common
goals. The principal creates buy-in by setting the stage for common work tied to a shared vision.
The principal provides the avenue by which teachers and staff can collaborate, share ideas, and
he/she understands the need for all stakeholders to have a voice in achieving the vision. Setting
the stage for shared ownership in moving the campus towards higher expectations for staff and
students is a transformational trait the leader uses to impact change within high poverty schools.
Conveying high-performance expectations that demonstrate the leader’s expectations for
excellence, quality, and/or high performance on the part of the staff is also a transformative
behavior on the part of the principal. The principal provides appropriate models of behavior on
the part of the leader that sets an example for staff to follow and that is consistent with the values
espoused by the leader.
The principal provides intellectual stimulation as well. The leader challenges staff to
reexamine some of the assumptions about their work and to rethink how it can be performed.
The principal also recognizes the need to provide individualized support that models respect for
individual members of staff and shows concern about their personal feelings and needs. It is
equally important to recognize the need to provide contingent reward where the leader
recognizes the achievements of the school staff and celebrates early wins to build a culture of
achievement.
Leadership is an essential ingredient for ensuring that every child in America gets the
education he/she needs to succeed. Indeed, educational leadership has been called the “bridge”
that can bring together the many different reform efforts in ways that practically nothing else can
(Wallace Foundation, 2007).
116

The results of this study clearly support Levine’s (2005) work around the need to reframe
principal preparation with the atypically trained principal outperforming the traditionally trained
principal on five of the eight variables measured in this research study. Accordingly, this brings
the atypical principal preparation modality to the forefront as having found the potential answer
to preparing principals to lead a new and different type of school, meet the needs of students who
come with a multitude of challenges, and change the trajectory of the achievement gap across
schools in the U. S. that have struggled for generations. Levine (2005) reveals that:
A few things stand out about the ways these new providers are educating school
administrators. First, they tend to give more emphasis to on-the-job preparation than
university-based programs do, and they seem to favor mentoring over book learning.
Their formal curricula seem to be more pragmatic, geared to the specific knowledge and
skills required by school principals and superintendents at different career stages. They
appear to be as concerned with supporting practicing administrators as they are with
preparing them for the job. And they seem largely to distrust education school faculty.
Most of these programs have chosen to avoid or minimize involvement with education
schools and to limit the use of education school professors as program instructors.
(pp. 51-52)
Irrespective of the modality of preparation, the role of the principal in leading improvement
efforts at high poverty schools is undeniable. Regardless of the type of preparation received by
principals, particularly those tested in this investigation, the fact that two modes of principal
preparation were presented, tested, and yielded vastly different results, symbolizes a need to
ensure that more work is done beyond this study. Also, since the student population attending the
types of schools included in this study is dominated by minorities from low income households,
117
the type of training principals receive must take into account cultural differences and how these
differences impact the total pedagogical environment.
Recommendations
The following practical suggestions for principal preparation programs based on the findings are:
1. A national committee should be formed to work on the redesign of principal preparation
should be formed creating national guidelines around principal preparation. This
committee should include national researchers and organizations whose work centers
around principal preparation and effectiveness, university schools of education, atypical
providers of principal preparation, and school districts from across the nation. The
committee’s work should be driven around how principal preparation programs are built
around the Interstate School Leaders Licensure Consortium (ISLLC) Standards for
principals.
2. A complete redesign of university principal preparation programs should take place to
ensure that both traditional and atypical programs have content and experiential
alignment. These programs should move away from basic theory to more real-world
application through partnerships with school districts around internship and mentorship in
school settings.
3. Public school administrators, especially those responsible for hiring and developing
principals, should be cognizant of the preparation and training these individuals undergo
to enhance their leadership skills. Research has shown, in many instances, that the
leadership behavior of the principals, if effective, can improve the academic performance
of students, as well as, the overall school effectiveness.
118

4. Principal preparation programs should teach the core leadership skills necessary to lead
high-poverty schools, but also prepare principals to lead improvements alongside the
challenges facing students in poverty (i.e. Economically Disadvantaged, At-Risk, Special
Education, Limited English Proficient, Alternative Education, and the Drop-Out).
Principals need to be well-versed in the challenges minority that students bring, and how
to deal with them.
5. Principal preparation programs should include selection criteria to assess a candidate’s
ability to lead transformative efforts on a school campus. Assessment criteria built around
Leithwood’s model of transformational leadership should include the candidates ability
to: (1) build a school vision, (2) establish school goals, (3) provide intellectual
stimulation to teachers staff, and students, (4) understand the need to offer individualized
support to teachers and students, (5) model best practices and important organizational
values, (6) demonstrate high performance expectations for all stakeholders, (7) create a
productive school culture, and (8) develop structures to foster participation in school
decisions.
6. Principal preparation programs should include selection criteria to assess a candidate’s
cultural proficiency in working with urban students. The Haberman Star Urban
Questionnaire is a research-based instrument being used by districts across the country.
The questionnaire predicts which candidates will succeed as school principals serving
diverse children and youth in urban poverty in major urban school districts. It analyzes
respondents' answers to thirteen dimensions of urban school administration. These
dimensions were identified in our studies of star urban principals who led effective
schools in major urban districts or who turned failing schools into effective ones. The
119

items represent star administrators' behaviors and predispositions to act. These actions
reflect an ideology regarding the respondents' beliefs about the nature of effective
schooling for diverse children and youth in urban poverty and the nature of school
leadership necessary to create such schools.
7. Public school administrators and other school district officials should be aware of the
social, cultural, economic, and psychological factors which drive the leadership of
principals, particularly those who will be employed at high poverty schools. An
understanding of these factors will enable school district officials to take into account
their influence in the development and implementation of programs to train principals.
8. Public school administrators whose primary responsibility is to develop effective,
efficient, and quality preparation programs for principals should be aware of the proper
role of collaboration in regard to the matching of principal and school to enhance the total
effectiveness of the preparation program for principals.
9. Districts should provide ongoing professional development for principals to ensure that
they are well versed and supported to deal with the demands of the work in high poverty
schools.
Recommendations for Further Study
The following recommendations are offered for future research:
120

1. A follow-up study could be conducted to compare the growth patterns across school
accountability ratings and student achievement rates of the atypically trained principals of
the high poverty schools included in this study for a longer period of time.
2. A follow-up study could be conducted to compare the growth patterns of traditionally
trained principals included in this study to compare growth across school accountability
ratings and student achievement rates in high poverty schools for a longer period of time.
3. A mixed method study could be done to not only compare school performance and
achievement data by type of principal training, but the study could also include a
qualitative instrument used to measure and collect the elements of principal preparation
differences between atypical and university-based programs.
4. A follow-up study could be done to measure the influence of other factors (i.e. At-Risk,
Economically Disadvantaged, SPED, LEP, Drop-Out, Alternative Placement, teacher
years of experience, teacher turnover, etc.) on the school accountability ratings and
school achievement results in high poverty schools.
5. A follow-up study could be conducted that would use a larger population from various
geographical regions across America. Such a study, if conducted, would provide more
pertinent data on principal preparation and its impact on school accountability and
student achievement.
6. A follow-up study could be conducted to compare school performance of atypically
trained and traditionally trained principals under the new STAAR assessment being
introduced during the 2011-2012 school year.
121

7. A qualitative study could be conducted to compare principal effectiveness based on
stakeholder perceptions in high poverty schools around the eight transformational
indicators in Leithwood’s model.
8. A study could be conducted to examine the impact that principal preparation has on
school climate and teacher attitudes. This study would measure how preparation
specifically impacts perceptions of stakeholders regarding overall school climate, as well
as teacher perceptions of principal preparedness to impact overall school climate.
9. A study could be conducted to compare the student achievement growth patterns of
atypical principal preparation programs across the country based on national norm-
referenced assessments. This study would explore a comparison of like programs and
their national impact on student achievement patterns of growth.
10. A study could be conducted to compare and contrast the elements of training content in
both atypical and traditional preparation programs for principals.
122

REFERENCES
Aldridge, J. (2003). Rethinking the No Child Left Behind Act of 2001. Childhood
Education, 80(1), 45. Retrieved from http://www.questia.com/PM.qst?
a=o&d=5002563042
America Diploma Project Network. (2007). Achieve data profile: Texas. Retrieved from
http://www.achieve.org/node/
Aron, L. Y., (2006). An overview of alternative education. Washington, DC: Urban Institute.
Retrieved from http://www.urban.org/publications/411283.html.
Bass, B. M., & Avolio, B. J. (2005). Transformational leadership. Mahwah, NJ: Lawrence
Erlbaum.
Bennis, W., & Goldsmith J. (2003). Learning to lead: A workbook on becoming a leader.
New York, NY: Basic Books.
Berends, M., et.al (2001). Implementation and performance in new american schools: Three
years into scale-up. Santa Monica, CA: RAND Corporation
Bolman, L. G., & Deal, T. E. (2002). Leading with soul and spirit: Effective
leadership in challenging times boils down to qualities such as focus, passion
and integrity. School Administrator, 59, 21. Retrieved from
http://www.questia.com/PM.qst?a=o&d=5000694741
Bruffee, K. A. (1999). Collaborative learning: Higher education, interdependence, and
the authority of knowledge (2nd ed.). Baltimore, MD: The John Hopkins University Press.
Carnoy, M., Elmore, R., & Siskin, L. S. (Eds.). (2003). The new accountability: High
schools and high stakes testing. New York, NY: Routledge Falmer. Retrieved from
http://www.questia.com/PM.qst?a=o&
123

Casella, R. (2003). Zero tolerance policy in schools: Rationale, consequences, and alternatives.
Teachers College Record, 105, 872-892.
Cherry, K. (2010). Transformational leadership: What is transformational leadership? Retrieved
from http://psychology.about.com/od/leadership/a/transformational.htm
Council of the Great City Schools (2003). Beating the odds: A city-by-city analysis of the
student performance and achievement gaps on state assessments. Washington, DC:
Council of the Great City Schools. Retrieved from
http://www.cgcs.org/reports/beat_the_oddsIII.html.
Cresswell, J. (2004). School effectiveness. Schooling Issues Digest, 1. Retrieved from
http://www.dest.gov.au/NR/rdonlyres/5EE08C1D-E01F-4631-8203-
77EE83B47930/4020/school_effectiveness.pdf
Cuban, Larry (2001). Urban school leadership: Different kind and degree. Washington, DC:
Institute for Educational Leadership. Retrieved from\
http://www.iel.org/programs/21st/reports/urbanlead.pdf
Darling-Hammond, L. (2010). The flat world and education: How america’s commitment to
equity will determine our future. New York, NY: Teachers College Press.
Davis, J. R. (2003). Learning to lead: A handbook for postsecondary administrators (pp. 3-17).
Westport, CT: American Council on Education and Praeger.
Davis, W. & Lee, R. (2003). Reducing the dropout rate for all maine students with a
particular emphasis upon students with disabilities who drop out of school. Retrieved
from http://www.umaine.edu/issar/reducedorate.htm
124

Donovan, M. Suzanne and Cross, Christopher T., eds. (2002). Minority students in special and
gifted education. Committee on Minority Representation in Special Education,
Washington, DC: National Academy Press. Retrieved from
http://www.nap.edu/catalog/10128).
Education Equality Project (2011). Latino dropouts in texas. Retrieved from
http://www.edequality.org/facts/entry/latino_dropouts_in_texas/
Fielder, D. (2003). Achievement now! How to assure no child is left behind. Larchmont,
NY: Eye On Education.
Flemming, P. & Rose, J. (2007). Overrepresentation of African American Students in
Exclusionary Discipline: The role of school policy. Urban Education. Vol. 42: No. 6
p. 536.
Frankel, J., & Wallen, N. (2009). How to design and evaluate research in education.
New York, NY. McGraw-Hill.
Fruchter, N., & McAlister, S. (2008). School governance and accountability: Outcomes of
mayoral control of schooling in New York City. Brown University, Providence, RI:
Annenburg Institute for School Reform.
Fullan, M. (2001). Leading in a culture of change. San Francisco, CA: Jossey-Bass.
Geronimo, I. (2010). Deconstructing the marginalization of “underclass” students: disciplinary
alternative education. Retrieved from
http://works.bepress.com/cgi/viewcontent.cgi?
article=1000&context=iindia_geronimo&seiredir=1#search=
%22minority%20students%20placed%20alternative%20education%22
Glenn, C. (2006). The diversity dilemma in texas and the nation: Creating a holistic educational
125

model to make “no child left behind a reality in America. National Forum of Teacher
Education Journal, 17(3).
Haberman, M. (2003). Who benefits from failing urban school districts? An essay on
equity and justice for diverse children in urban poverty. University of
Wisconsin. Milwaukee, WI. Retrieved from www.educationnews.org
Hale, E. & Moorman, H. Preparing school principals: National perspective on policy and
program innovations. Edwardsville, IL: Institute for Educational Leadership.
Hedges, L. V., Laine, R. D., & Greenwald, R. (1994). Does money matter? A meta-analysis
of studies of the effects of differential school inputs on student outcomes. Educational
Researcher, 23, 5-14.
Herman, R., et.al. (2008). Turning around chronically low-performing schools: A practice guide
Washington, DC: National Center for Education Evaluation and Regional Assistance,
Institute of Education Sciences, U.S. Department of Education. Retrieved from
http://ies.ed.gov/ncee/wwc/publications/practiceguides.
Hess, F.M., & Kelly, A.P. (2007), Learning to lead: What gets taught in principal preparation
programs. Teachers College Record, 109(1), 244-74.
Hoyle, J. (2004). The good news about the preparation of school leaders: A professor’s
viewpoint. Texas Council of Professors of Educational Administration's School
Leadership. Retrieved from http://www.tcpea.org/slr/2005/hoyle.pdf
Kane, T. J., & Staiger, D. O. (2008). Estimating teacher impacts on student achievement: An
experimental evaluation. Cambridge, MA: National Bureau of Economic Research.
Klineberg, S., (2007). Educating our children for the knowledge economy: Impact on our city
future. Retrieved from http://www.livablehouston.com/good/articles/klineberg.html
126
Leithwood, K. & Riehl, C. (2003). What do we already know about successful school
leadership? School Leadership and Management, 26(4), 372
Leithwood, K., Seashore-Louis, K., Anderson, S., & Wahlstrom, K. (2004). How leadership
influences student learning (Learning From Leadership Project Executive Summary).
New York, NY: The Wallace Foundation.
Leithwood, K. (2011). Leading school turnaround: How successful leaders transform low
performing schools. New York, NY: Wiley.
Levine, A. (2005). Educating school leaders. The Chronicle of Higher Education. pp. 11, 12, 22,
24, 29, 51, and 52.
Moser, D. (2009). Houston School District Profiles. Retrieved from
http://www.texasbest.com/schools/schools.html
Obiakor, F., & Ford, B. A. (2002). School accountability and reform: Implications for african
americans with exceptionalities. Thousand Oaks, CA: Corwin Press, Inc.
Orfield, G., & Lee, C. (2007). Historic reversals: Accelerating resegregation, and the
need for new integration strategies. (A report of the Civil Rights
Project/Proyecto Derechos Civiles). UCLA. Los Angeles, CA. Retrieved from
http://news.yahoo.com/s/
Orfield, G. & Lee. C. (2005).Why segregation matters: Poverty and educational inequality,
(Civil Rights Project). Harvard University, Cambridge, MA. Retrieved from
http://bsdweb.bsdvt.org/district/EquityExcellence/Research/Why_Segreg_Matters.pdf
Orfield, G. (2009). Reviving the goal of an integrated society: A 21st century challenge.
Public Agenda Website. Retrieved from
http://www.publicagenda.org/issues/factfiles_detail.cfm?issue_type=higher_education&list=6
Petzko, V.N. (2004). Tailoring professional development for a better fit. Principal Leadership,
127

5(3), 21.
Public Policy Research Institute. (2003). Disproportionate representation of minority
children in special education. College Station, TX: Texas A & M University.
Rainwater Leadership Alliance. (2010). A new approach to principal preparation: Innovative
programs share their practices and lessons learned. Retrieved from
http://www.anewapproach.org/docs/exec_summary.pdf
Region 4 Education Service Center. (2007). Retrieved from
http://www.esc4.net/default.aspx?name=pi.aboutus
Southern Regional Educational Board. (2004). The principal internship: How can we get
it right? Retrieved from http://www.sreb.org
Southern Regional Educational Board. (2006). In schools can’t wait: Accelerating
the redesign of university principal preparation program. Retrieved from
http://www.sreb.org
Southern Regional Educational Board. (2007). Good principals aren’t made: They’re mentored.
Retrieved from http://www.sreb.org
Southern Regional Educational Board. (2003). Good Principals Are the Key to Successful
Schools: Six strategies to prepare more good principals. Retrieved from
http://www.sreb.org
Stecher, B., & Kirby, S. N. (Eds.). (2004). Organizational improvement and
accountability: Lessons for education from other sectors. Santa Monica, CA:
Rand. Retrieved from http://www.questia.com/PM.qst?a=o&d=103028724
Steiner, L., & Hassel, E. A. (Public Impact). (2011). Using competencies to improve school
128

turnaround principal success. Charlottesville: University of Virginia’s Darden/Curry
Partnership for Leaders in Education. Retrieved from www.DardenCurry.org
Tashakkori, A., & Teddlie, C. (Eds.). (2003). Handbook on mixed methods in the behavioral and
social sciences. Thousand Oaks, CA: Sage.
Texas Appleseed Project (2007). Texas’ school-to-prison pipeline: dropout to
incarceration.
Retrieved from http://www.texasappleseed.net/pdf/Pipeline
%20Report.pdf
Texas Appleseed Project (2010). Texas’ school-to-prison pipeline: school
expulsion. Retrieved
from http://www.texasappleseed.net/index.php?
option=com_docman&task=doc_download&gid=380&Itemid
Texas Classroom Teachers Association (2011). Texas projection measure tossed as 2011
accountability system begins. Retrieved from
http://www.tcta.org/teacher_resources/education_matters/texas_projection_measure_toss
ed_as_2011_accountability_system_be
Texas Comptroller http://www.window.state.tx.us/comptrol/wwstand/wws0512ed/
Texas Higher Education Coordinating Board. (2007). The need for remediation in college.
Retrieved from http://www.thecb.state.tx.us/
Texas Education Agency. (2010). Academic excellence indicator system. Retrieved
from http://ritter.tea.state.tx.us/perfreport/aeis
U.S. Bureau of the Census. (2004). People: Race and ethnicity. Retrieved from
http://www.census.gov/
129

U.S. Department of Education. (n.d.). Four pillars of NCLB. Retrieved from
http://www.ed.gov/print/nclb/overview/intro/4pillars.html
U.S. Department of Education (2000). Twenty second annual report to congress
on the implementation of the individuals with disabilities education act. Washington
D.C.: U.S. Government Printing Office.
U.S. Department of Education (2008). Mapping america’s educational progress. Retrieved from
http://www2.ed.gov/nclb/accountability/results/progress/nation.html
U.S. Department of Education (2011). Progress of education in the united states of america –
1990 through 1994. Retrieved from http://www2.ed.gov/pubs/Prog95/pt3major.html
U.S. Department of Education (2011). Innovations in education: Innovative pathways to school
Leadership. Retrieved from
http://www2.ed.gov/admins/recruit/prep/alternative/report_pg11.html
U.S. National Center for Education Statistics. (2006), Table 21. Poverty status of persons,
families, and children under age 18, by race/ethnicity. Digest of Education Statistics,
Retrieved from http://nces.ed.gov/programs/digest/d09/tables/dt09_021.asp-101k
Villani, S. (2006). Mentoring and induction programs that support new principals.
Thousand Oaks, CA: Corwin Press.
Wallace Foundation. (2005). School leadership study: Developing successful principals.
Retrieved from http://www.wallacefoundation.org/Pages/default.aspx
Wallace Foundation. (2006). Leadership for learning: Making the connection among state,
district and school policies and practices. Retrieved from
http://www.wallacefoundation.org/Pages/default.aspx
Wallace Foundation. (2007). A bridge to school reform. Retrieved from
http://www.wallacefoundation.org/Pages/default.aspx
130

Wallace Foundation. (2007). Preparing school leaders for a changing world: Lessons from
exemplary leadership development programs. Retrieved from
http://www.wallacefoundation.org/SiteCollectionDocuments/WF/Knowledge
%20Center/Attachments/PDF/preparingschoolleaders_finalreport.pdf
Wallace Foundation. (2008). Becoming a leader: Preparing school principals for today’s
Schools. Retrieved on from http://www.wallacefoundation.org/Pages/default.aspx
Whittle, C. (2005). Crash course: Imagining a better future for public education. New York,
NY: Penguin Group.
Wikipedia: The Free Encyclopedia. (2011) Retrieved from
http://en.wikipedia.org/wiki/Special_education
Williams, J. (2003). Thurgood Marshall: The man and his enduring but endangered legacy. The
College Board Review, 200, p.12-19.
Zuckerbrod, N. (2007). 1 in 10 schools are ‘dropout factories.’ USA Today. Retrieved from
http://www.usatoday.com/news/education/2007-10-30-dropout-factories_N.htm?csp=34
131

APPENDICES
132
APPENDIX A
SCHOOL LEADERSHIP DEMOGRAPHIC SURVEY
133

AN INVESTIGATION OF THE IMPACT OF ATYPICAL PRINCIPAL PREPARATION
PROGRAMS ON SCHOOL ACCOUNTABILITY AND STUDENT ACHIEVEMENT IN
HIGH-POVERTY SCHOOLS
THE SCHOOL LEADERSHIP DEMOGRAPHIC SURVEY
Section I: School Demographics
School Name __________________________________
Enrollment __________________________________
Grade Level K-5 5-6 6-8 9-12(Circle One)
Years of Principal Experience 1-3 4-6 7-9 10 or more(Circle One)
Economically Disadvantaged % __________________________________
Section II: Principal Demographics
Ethnicity M F(Circle One)
Gender W AA H O(Circle One)
Years of Admin Experience 1-5 6-10 11-15 16-20 20+(Circle One)
Note: Administrative experience in any supervisory position not defined as the principalship.
Section III: Principal Preparation
Note: Please select the type of principal development program you participated in defined by the descriptions below.
134

__________ Traditional Principal Preparation (Completion of Master’s Degree and principal certification attained prior to assuming principalship.
__________ Atypical Principal Preparation (Completion of Master’s Degree, principal certification program and an extended training program which includes field residency or clinical internship with a mentor principal or coaching from a master principal.
APPENDIX BLETTER TO SCHOOL PRINCIPAL PARTICIPANTS
135
February 15, 2011
Principal NameSchool NameSchool AddressCity, Stare, Zip
Dear Educator,
I am a doctoral student in Educational Leadership at Prairie View A & M Universityconducting a research study on the impact of atypical principal preparation programs on schoolaccountability and student achievement in high-poverty schools. The purpose of my study is to investigate whether school accountability ratings or student achievement is impacted by the type of training a principal receives.
Your participation is vital to this study. I hereby request your assistance by completing the attached survey instrument entitled, School Leadership Demographics Survey. This survey is voluntary and will take five minutes to complete. Individual responses will be kept confidential. Please return the questionnaire in the stamped, pre-addressed envelope provided by DATE.
If you have any questions or concerns regarding this request, please feel free to contact me at [email protected] or I can be reached at (832) 515-9684. Your assistance in this research project is greatly appreciated.
Respectfully submitted,
Sheri L. Miller-Williams William A. Kritsonis, Ph.D.Ph.D. Student Professor and Dissertation Chair Educational Leadership PhD Program in Educational LeadershipCollege of Education College of EducationPrairie View A& M University Prairie View A & M UniversityPrairie View, Texas 77446 Prairie View, Texas 77446
136

VITA
SHERI L. MILLER-WILLIAMS18810 PARK KEY CIRCLEHOUSTON,TEXAS 77084
Sheri L. Miller-Williams is a visionary education and business professional with outstanding qualifications in educational leadership, sales, leadership training, and business operations in both education and business markets. Sheri has an extraordinary education and management background with a documented record of leadership success, business and operational management, market development, and customer service. She is an influential leader with an intrinsic talent for conceptualizing and communicating vision, training and development, and focusing consensus and cohesion for achievement of common goals.
Sheri is a passionate educator who is committed to taking a leadership position in revolutionizing the way we deliver education in our urban schools. As a former teacher, elementary and middle school principal, and as a senior executive with the largest education management organization (EMO) in the US, she has established a reputation as a school turnaround specialist. For the past three years Sheri has served as the Director of Leadership for Houston A+ Challenge where she leads all leadership development initiatives for direct reports to area superintendents, principals, assistant principals and aspiring principals.
As the former Vice President of Achievement and Vice President of Educational Services for Edison Schools, Sheri has deep experience in supervising, mentoring, supporting, and guiding principals to promote academic achievement in schools. Paramount to these roles was working with principals and leadership teams to develop, monitor, and adjust the schools instructional program based on consistent data analysis. Her role also included assessment and re-design of school components including: the establishment of bold measurable goals, establishment of strong instructional delivery systems supported by research, on-going data analysis with principals and school teams, customized professional development based on identified campus needs, approval of all campus expenditures, and oversight of budgets in excess of $5 million dollars per campus.
A natural leader and motivator, Sheri’s extensive experience in a wide range of disciplines, (education, business, marketing, and management), enables her to see things from a variety of angles, quickly seize the essence of a problem, and offer creative and practical solutions. She was recently listed by Edison Schools’ senior management as one of the “top 150 brightest minds” in the corporation.
137

Sheri began her career as an elementary school teacher in 1991 where her leadership, administrative skills, and commitment to educational excellence quickly elevated her to the role of school principal. As Principal and Chief School Administrator of the YMCA Service Learning Academy (YMCA SLA), a charter school located in Detroit, Michigan, she served as the instructional leader of 1156 students and 102 staff members, and held all of the operational and fiscal responsibility of an independent school district Superintendent. Sheri also served as a teacher and Principal in the Detroit Area (Ecorse) Public School District, the Alief Independent School District, and the Houston Independent School District. Her early work experience includes Assistant Principal, District Reading Trainer, and Director of Academic Services.
An exceptional speaker, presenter and trainer, Sheri has made numerous presentations and keynotes at local and national conferences and is a frequent session leader and speaker at independent school conferences. An avid reader herself, Sheri has developed and authored several training modules under the title “The Culture of Achievement” (2002).
Sheri has received numerous professional awards, including a two time recipient of the Double Four Star Principal Award, the highest honor awarded for Student Achievement improvement, School Fiscal and Operational Management (2002-2003 and 2003-2004), a “Proclamation of Outstanding Leadership” from Kwame M. Kilpatrick, Mayor of the City of Detroit (2004), the State of Michigan Golden Apple Award presented by John Engler, Governor of Michigan, to the highest achieving schools for student performance on the Michigan Educational Assessment Program (MEAP) (2001), the Betty Best Leadership Award, Teacher of the Year, and the Outstanding Teacher Achievement Award.
138

VITA
SHERI L. MILLER-WILLIAMS18810 PARK KEY CIRCLEHOUSTON, TEXAS 77084
EXECUTIVE PROFILEVisionary, resourceful executive with strong education and business management background; providing leadership, focused mission building, and compelling client value in education and business arenas. Deep experience in educational administration, school operations, curriculum and staff development, national training, sales and market development. Influential leader with intrinsic talent for conceptualizing and communicating vision, fusing drive with exceptional managerial know how to shepherd projects, and focusing consensus and cohesion for achievement of common goals. Known for ability to win fiercely loyal community support, developing key coalitions, and building crucial relationships with a shared sense of purpose. Highly regarded as a key resource, critical thinker, and out-of-the-box problem solver. Solid understanding of the relationship between education and strategic business interests with a P&L mindset.
EXECUTIVE PERFORMANCE HIGHLIGHTS
FOUNDING DIRECTOR OF THE REGIONAL PRINCIPAL LEADERSHIP ACADEMY AND CURRENT DIRECTOR OF NEW VISIONS LEADERSHIP ACADEMY AND EXECUTIVE LEADERSHIP COUNCIL
Director of Leadership, Houston A+ Challenge, Houston, TX (2008-Present)
Bottom Line: Consults with the Executive Director to establish global vision of principal and
school/district leadership development programs for the Greater Houston region that is aligned to organizational goals.
Develops and recommends plans, objectives, policies and budgets to the Executive Director to achieve the goals of the Houston Regional Principal Leadership Academy, New Visions Leadership Academy, and Executive Leadership Council.
Designs and executes candidate recruitment and selection strategy, curriculum and training modules and processes, and leads design of overall program evaluation.
Develops partnership strategies with participating national faculty, partnering districts, and state/TEA departments.
139

Assists the Executive Director in directing, coordinating and participating in Houston A+ Challenge fund-raising and public relations activities.
ENSURED EXCELLENCE IN SERVICE DELIVERY OF SUPERIOR NATIONAL ACHIEVEMENT GAINS THROUGH COLLABORATION AND PARTNERSHIPS
As VP of Educational Services, Edison Schools, New York, NY (2007 to 2008) managed Edison’s primary focus of student achievement in elementary, middle and high schools located in Philadelphia, Atlanta and New Orleans. Served as the single point of accountability for the management of individual client relationships, as well as led all aspect of the academic, operational/financial/budgetary/legal management of five schools. The role also ensured excellence in service delivery by collaborating and partnering with district and charter school boards, providing national training for principals and teachers, and driving consistently superior achievement gains within assigned sites.
Bottom Line: Developed and annually adjusted the school's instructional support plans and identified
areas of focus and improvement. Codified a support strategy for individual schools to make improvements in the targeted areas.
Supervised all academic, operational and financial activities at the school sites, including supervision of principal and school staff.
Led a regional team of ELA, Math, Science, Social Studies, Special Populations, and Student Management specialists who worked to implement the improvement targets for each campus.
Formalized and executed customized professional development training modules specific to clientele and worked closely with district officials to create a plan and set measurable goals for program implementation.
Served as lead facilitator for all Edison Achievement Conferences (HQ Quarterly Meetings, Summer Institutes, Edison Leadership Development Academy, Instructional Leadership Conferences, and Client Conferences).
DESIGNED AND IMPLEMENTED AN ACADEMIC ACHIEVEMENT PROGRAM TAILORED TO MEET INDIVIDUAL DISTRICT AND SCHOOL ACHIEVEMENT GOALS
As VP of Achievement, Edison Schools, New York, NY (2006 to 2007) challenged to accelerate, improve, and sustain student achievement gains at 8 elementary, middle and high school campuses in Charleston, SC. Established a keen focus on establishing systems and processes to accelerate attainment of AYP and state targets; monitored instructional delivery, student management systems and professional development programs
Bottom Line:
140

Collaborated with Principals and leadership teams to develop, monitor, and adjust annual Student Achievement Plans and campus action strategies.
Coached, mentored and supervised principals around instructional leadership, school culture building, student management, parent involvement, and basic building financial/operational management.
Created a staff development plan for Principals and leadership teams that focused on student achievement and needs-based professional development; supported school discipline and improvement in the learning environment.
Trained and supported Principals on the implementation of teacher supervision, evaluation, and performance appraisal processes consistent with School Performance Standards.
EMPLOYED STRATEGIC THINKING & PLANNING TO FACILITATE GREATER MARKET POSITION, CUSTOMER RELATIONS AND REVENUE GROWTH
As VP of Development, Newton Learning/Edison Schools New York, NY (2004 to 2006) Front-line business executive working with targeted school districts and community-based organizations to promote the Newton Learning supplemental education services (SES) model. Manage and execute agreements, developed new markets, conducted evaluations of school districts’ needs, presented and trained districts/principals on the benefits of Newton Learning’s SES model. Built and supported deep and broad relationships with targeted districts.
Bottom Line:
Reversed history of politicized, hostile interactions with school districts by establishing, cooperative working relationships, culminating in the penetration of new markets in 8 states and setting the stage for future revenue growth. Directly responsible for initial market penetration of Miami, Charleston, and Memphis markets for the company.
Provided on-site training to principals on NCLB sanctions and implementation of the SES model.
Communicated across all management levels and functions to improve sales, operations, planning ability, profitability, and customer relations.
DEMONSTRATED TURN-AROUND MANAGEMENT SKILLS BY RESTRUCTURING AND REORGANIZING ACADEMIC, OPERATIONAL, AND BUSINESS FUNCTIONS
As Principal and Chief School Administrator, Edison Schools-YMCA Service Learning Academy Charter School, Detroit, MI (2002 to 2004) Improved academic standards by 50%, overhauled business operations and transformed school and faculty into a school of excellence. Formally recognized by Edison Schools and Board of Directors for meeting all objectives: completely reversed operational history of persistent budget incompliance and poor academic performance that were below state standards, low and declining enrollment, poor community reputation, nonexistent referrals, persistent underutilization, and facility disrepair by creating an in-demand program with a professional
141

reputation that led to long waiting lists for admission. Served as advisor to Charter School Board of Directors and instructional leader of a K-8 school with 1156 students and 102 staff members.
Bottom Line: Provided consistent leadership in the formulation and annual adjustment of the school’s
instructional program that resulted in students achieving an average gain of 50.10% in Language Arts, Mathematics, Science, and Social Studies over a two-year period.
Received the Double Four Star Principal Award for excellence in financial and operational improvement for two consecutive years by continually setting standards for financial and operational management, implementing multi-tiered cost-saving initiatives, incorporating operational efficiencies, equipment expense reductions, and vendor contract re-negotiations that resulted in a 32% reduction in operational costs.
Increased enrollment by 25% through comprehensive image make over, and improved organizational success through ongoing data analysis, staff development, and the development of a concise training model.
Built consensus amongst a fragmented board that succeeded in delivering unanimous support of instructional and operational programs.
DEVELOPED SCHOOL/PARENT/BUSINESS PARTNERSHIPS THAT IMPACTED STUDENT ACHIEVEMENT AND OPTIMIZED OPERATIONAL AND FINANCIAL PERFORMANCE
As Principal and Educational Leader, Ralph J. Bunche Elementary School, Ecorse Public School District, (2001 to 2002) articulated a clear vision and mission of the school through a shared understanding of and commitment to instructional goals, priorities, and accountability, creating a climate of high expectations for staff and students that embraced and required parent involvement.
Bottom Line:
Developed various school/parents/business partnerships that positively impacted student achievement levels by 20% in first year.
Created professional growth plans and alternative staff development models for teachers in need of assistance, resulting in a reduction of teacher turnover ratio by 35%.
Successfully met or exceeded seven successive operational goals, reversing a failing school trend through the judicious allocation of resources and an internal campaign emphasizing parent involvement, student achievement, and teacher quality.
EARLY ADMINISTRATIVE EXPERIENCE AND CLASSROOM TEACHING EXPERIENCE Director of Academic Services, Plymouth Educational Center Reading Teacher Trainer and Gifted and Talented Coordinator for HISD Eight years of classroom teaching experience in HISD and Alief ISD Graduate of the Alief ISD Administrative Internship Program
EDUCATION Prairie View A & M University, Prairie View, Texas M.Ed.
142

Educational Administration, May 2000
Dillard University, B.S.Elementary and Early Childhood Education, May 1991
SPECIALIZED TRAININGCertified Leadership Performance Coach-The Leadership and Learning CenterCritical Friends Group CoachPerformance Coach Trainer (Doug Reeves Performance Coach Certified)
LEADERSHIP AWARDS Double Four Star Principal for Student Achievement/Operational Management (02-03 & 03-04)Proclamation for Outstanding Leadership – Mayor of the City of DetroitState of Michigan Golden Apple Governor’s Award Principal of the YearBetty Best Leadership AwardTeacher of the YearOutstanding Teacher Achievement Award
PROFESSIONAL ORGANIZATIONSAssociation for Supervision and Curriculum Development (ASCD)National Alliance of Black School EducatorsInternational Reading Association
143

EXECUTIVE PROFILE OF EXPERIENCES
Summary of Experience Director of Leadership, Houston A+ Challenge Vice President of Educational Services, Edison Schools, Inc. Vice President of Achievement, Edison Schools, Inc. Vice President of Development, Newton Learning a Division of Edison Schools,
Inc. Elementary and Middle School Principal Director of Academic Services, Plymouth Educational Center District Reading Training, Houston Independent School District (Central Office) Gifted and Talented Coordinator, Houston Independent School District Teacher (Eight Years in Houston ISD and Alief ISD)
Leadership Qualities Visionary with ability to look at the “Big Picture”
o As the Vice President of Educational Services, managed Edison’s primary focus of student achievement in schools, including managing client relationships as well as the operational/financial/budgetary/legal management of the schools.
o As the Vice President of Achievement, responsible for accelerating and sustaining achievement gains to meet AYP targets in eight schools in Charleston, SC.
o As a former elementary and middle school principal, held the responsibility of providing the instructional, financial, operational, and administrative leadership necessary to ensure the school’s success.
o Natural ability to look at the big picture through the organization, administration, supervision, and evaluation of all aspects of the school design components in partnership with the greater school community.
Demonstrated ability to collaboratively establish, plan and execute SMART goalso Led campus improvement planning around fundamental concepts: Culture of
Achievement, Design Implementation, Data Analysis, Meeting Individual Student Needs, Aligning and Embedding, Test Administration, Professional Development, and Monitoring Student Progress
Creative problem solver
144

o Methodical approach to problem solving entails: Reducing the problem to its most basic root then characterizing the problem generically, and thinking outside of the box to clearly and objectively identify workable solutions.
o Development of a conflict/management and or peer mediation program to support teachers, parents, and students.
o Implemented a Family and Student Support Team (FASST) that met regularly to develop prevention and intervention strategies for at-risk students. This program also linked the student, teacher, school, and family in a partnership that was action oriented and drew on community resources to support student’s academic and social learning, while solving problems for the teacher, student, and parent.
o Development of a clear crisis intervention plan that clearly described procedures for addressing emergency situations.
o Establishment of a Behavior Support Team, whose purpose was to improve the learning climate through data analysis and problem-solving related to discipline issues (i.e. by location, by student, by teacher, by infraction).
Visionary/innovative leadershipo Ensured that all goals pertained to measurable outcomes for students as well as to
the actions and behaviors of teachers and other members of the organization. o Established simple metrics and information systems to measure progress toward
goals.o Skilled at effectively communicating a vision that supports open and honest
partnerships with a common understanding of shared values and consistent models effective operating principles.
o Site transformation philosophy consisting of working collaboratively with all members of the school community to: build commitment, mold the school organization, develop systems to support continuous improvement, and developing the school as a self-sustaining organization.
o Ensured that the vision reflected the core values that teachers, students, parents, and other stakeholders felt deeply and strongly embraced.
o Worked collaboratively with school stakeholders to establish specific goals that clearly demonstrated what the vision would look like short-term vs. long term.
Effective communication skills (internally/externally)o Superior communications skills with the ability to organize and deliver
presentations; exceptional interpersonal skills with a talent for building relationships across diverse groups and all levels of management.
o Demonstrated ability to communicate vision, goals, and objectives and lead teams of colleagues with the capacity to initiate and influence change.
o Presenter at National Conferences. o Made monthly presentations to local School Boards on all aspects of school
governance.
Demonstrates confidence and effective leadership skills
145
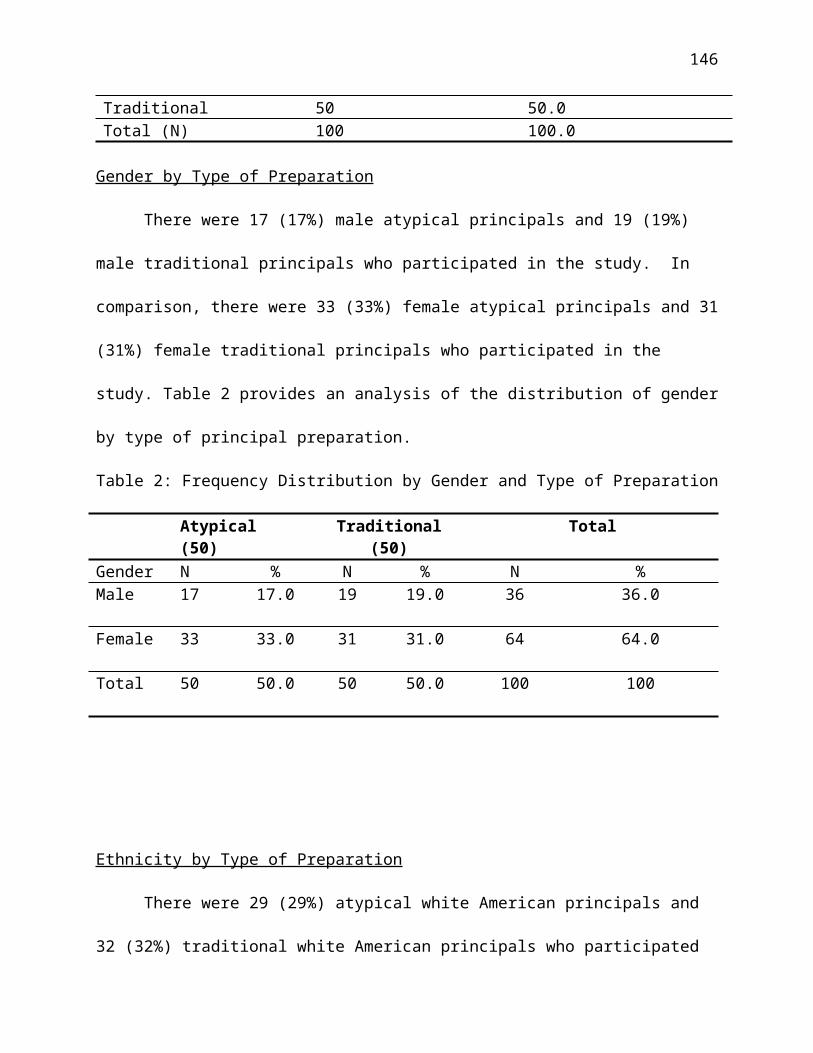
o As a two-time Double Four Star Edison Principal, held the responsibility for providing all administrative, financial and operational leadership to ensure the success of the existing partnership.
o Responsible for the recruitment, selection, hiring, of school staff including teachers, and school-based support staff.
Instructional Leadership Instructional Leader
o Gained knowledge and experience as the Director of Academic Services, Houston ISD District Reading Trainer, Urban Elementary and Middle School Principal/Instructional Leader.
o Philosophy that alignment of state standards to instructional design/delivery, coupled with purposeful planning, effective instructional delivery, authentic assessment leads to student achievement gains.
o Strong focus on key instructional techniques as direct indicators of student progress.
o Use of on-going alignment and embedding techniques as a means of addressing academic performance weaknesses.
o Continual use of alignment and embedding T-charts and Embedding Pacing Calendars to address content strands and objectives drawn from TEKS.
o On-going analysis of test data through the use of interim assessments.o Direction of teacher attention to testing content, testing format, and testing
conventions that pose problems for students.o Modeled standards of instruction based on research related to high quality
instruction: quantity, coherence, student voice, and content with a project emphasis.
o Trained teachers how to use test data to identify students by quartile mapping, to develop plans to improve students’ scores from the lower two quartiles, and to develop benchmark tests to measure student progress.
Advocate for addressing the needs of special populations (i.e. bilingual, special needs, gifted and talented students)
o Belief in interactive school environments that promote time management, curriculum integration, problem solving, exploration, projects, skill integration, pacing, and individualized instruction.
o Full incorporation of individual student needs through the use of alternative instructional strategies, various measuring tools, and alignment to federal guidelines of IDEA and 504 within the Student Achievement Plan.
o All decisions regarding grouping and differentiated instruction driven by the needs of learners.
Appreciation for the total educational program (i.e. fine arts, physical education, etc.)
o Launched Band Program through the commitment of $50,000 by local school board
146

o Initiation of Service Learning Instruction as a tool of connecting learning to real-life project-based experiences.
Ability to protect the learning environment from outside influenceso History of leading schools in tough urban environments.o Integration of the parent voice in the establishment of non-negotiables (i.e. dress
code, tardiness, violence, etc.).o Partnered with local community organizations to implement outreach programs. o Promoted an intentional and responsive learning environment that introduced the
establishment of fundamental core values and norms, walls that talk, and the instruction of the head, heart, and hand.
Communication/Management Style Belief in a system of accountability that governs the organization making
clear the expected school and student outcomes. Emphasis on teamwork, collaboration, and decentralized governance.
Student Management Experience developing and implementing effective behavior management systems
o Collaborated with staff to create a behavior management policy that established a culture of mutual respect and caring, and designed disciplinary procedures that minimized the los of instructional time, and were designed to reinforce, remind, and re-direct students around school expectations.
o Use of consistent staff collaboration in explicitly teaching, modeling, practicing, and supporting all rules, procedures and ways of interacting within the school.
o Establishment of a program of positive consequences (i.e. awards and privileges) for positive behavior, which recognized model school community citizens and nurtures others’ growth.
Experience in dealing effectively with diverse students, staff, and stakeholderso Ability to recognize and respond to individual and cultural differences in students
and employ different teaching methods that will result in higher student achievement.
o Able to work cooperatively and communicate effectively with teachers, support staff, parents, and members of the community from varied ethnic, racial, and religious backgrounds.
o Encouraged teachers to include multicultural programming in their lesson plan to address the needs of all students, regardless of their cultural background.
School/Community Relations
Connects with community and able to generate community support
147
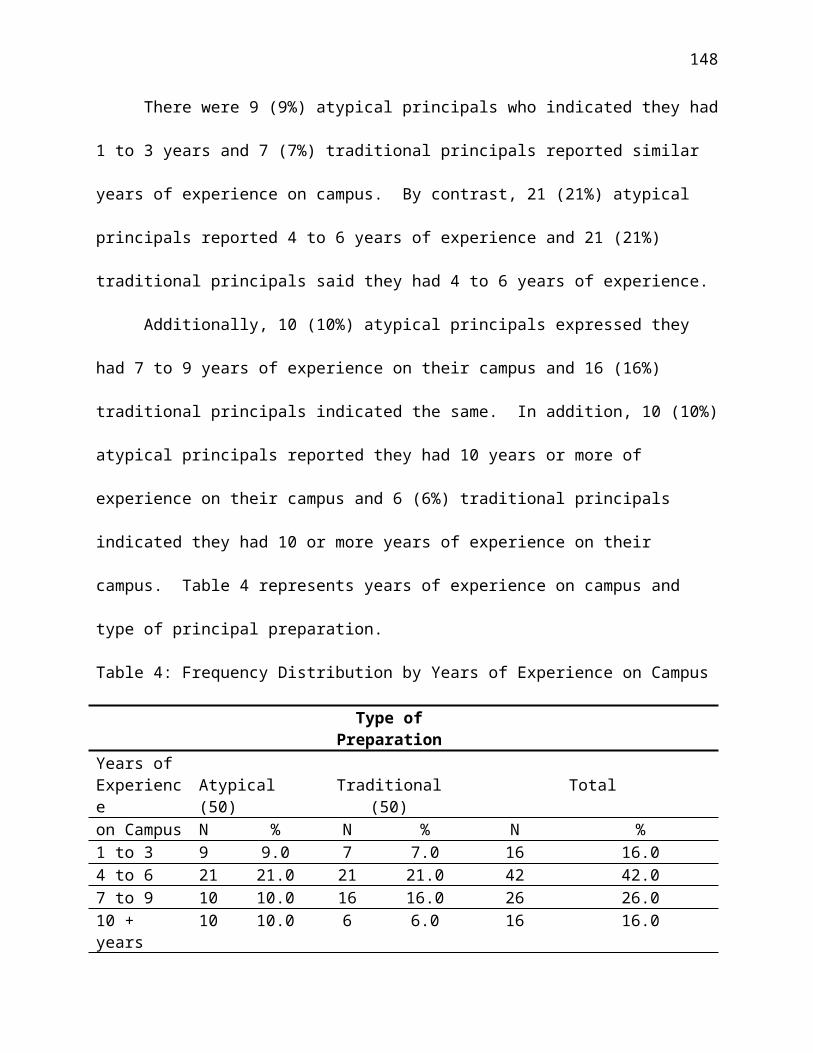
o Views students and parents as the “primary customer”, and promotes the engagement of families.
o Embeds “impact analysis” techniques through the use of end of the year program surveys to assess strengths and weaknesses from the customer’s viewpoint.
o Routinely identified and established Parent Advisory Committees, Board of Friends, alliances with local agencies, and other community based organizations.
o Enlisted involvement of and partnerships with community organizations to promote and support student recruitment, retention, and personal development needs.
o Developed an effective and professional working relationship with school PTA/PTO's and other influential groups in the achievement of achievement goals
o Received Proclamation from the Mayor of Detroit for establishment of Community Partnerships throughout the city of Detroit in alignment with Service Learning. Trained through the YMCA of Metro Detroit in Service Learning as a basis for establishing broad-based community partnerships.
Personnel/Human Resource Management
Team Building Experienceo Developed and implemented collaborative school improvement teacher teams that
met weekly to examine testing data, discuss student achievement, examine student work, and analyzed the success of planned and implemented school improvement strategies.
o Identified and provided opportunities for school staff, parents, students, and the community to join together and model responsible behavior within the educational program and community.
Ability to work with staff collaborativelyo Encouraged teachers and parents to participate actively in management decisions
regarding school operations. o Involved teachers in decision making regarding the budget, personnel, textbooks,
curriculum design, and instructional methods.o Established standards of professionalism for teachers and staff; leading by
example in portraying a polished, professional image.o Adept at establishing goals and objectives for teachers and staff based upon
clearly communicated goals and strategies, and clearly communicated these goals and objectives to the appropriate employees.
Administrative Fiscal and Facility Management
Managed campus budgets exceeding twenty-five million dollars and prioritized needs
148

o Experienced in the analysis and justification of capital equipment investments and held budgetary responsibilities for an 8 million dollar budget as an Edison principal.
o Skilled in the supervision of all aspects of school operations and business functions including school funding, district funds, payroll, purchases, inventories, office operations, and facilities management.
o Broad depth of knowledge and experience in the management of all State and local reporting requirements as a district and charter school principal (i.e., Title 1, Title II, Title V, IDEA, At-Risk, etc.)
o Held responsibility for management and oversight of vendor accounts; monitored discount opportunities, verifying federal id numbers; scheduling and preparing checks; resolving purchase order issues, contract, invoice, or payment discrepancies and documentation.
o Responsible for oversight of accounting ledgers by verifying and posting account transactions and verifying vendor accounts by reconciling monthly statements and related transactions.
o Managed purchasing processes for transportation, food services, facility management, curriculum, technology, etc.
o Oversight of financial management for school as the lead administrator against revenue streams (i.e., activity fund account, payroll, monthly payables, forecasting monthly revenues and expenses, and processing on monthly invoices).
o Developed payables calendar to establish a payable system that was effective, efficient, and timely.
o Administered capital budget to ensure effective use of all available resources.
149